
Inbound patients seek complex care and fertility treatment
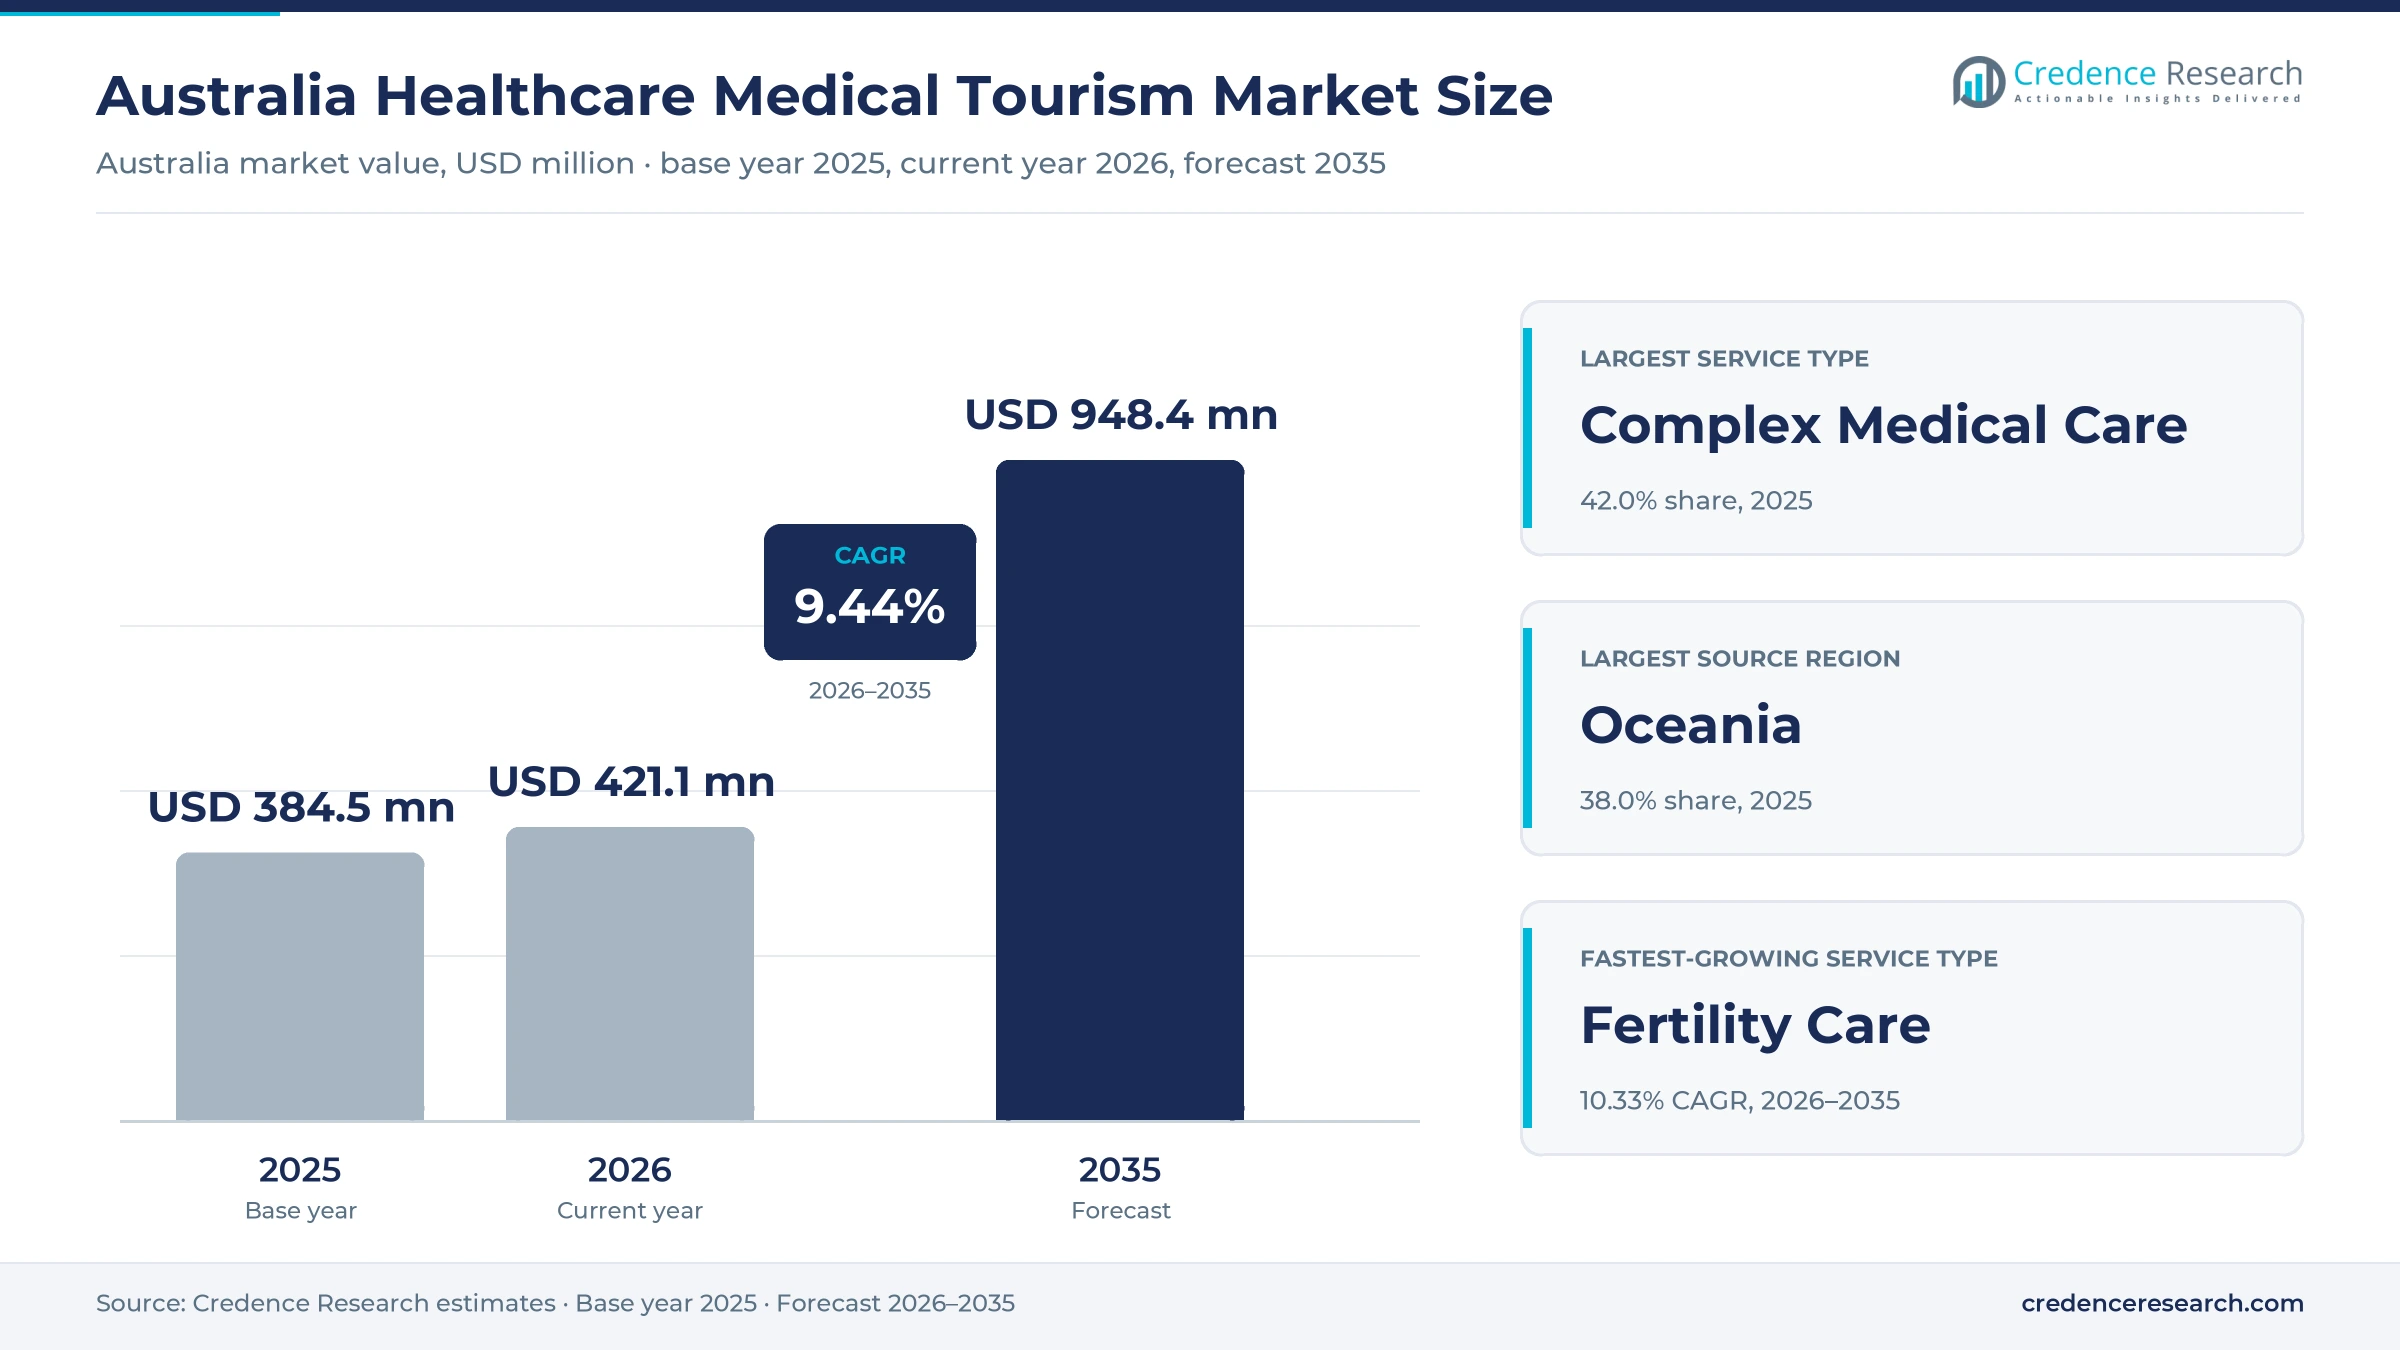
The Australia healthcare medical tourism market was valued at USD 384.5 million in 2025 and is projected to increase from USD 421.1 million in 2026 to USD 948.4 million by 2035, registering a CAGR of 9.44% during 2026–2035. Demand comes from overseas patients who travel to Australia for cancer, cardiac and specialist surgery, for fertility treatment and for dental work, along with government-sponsored patients referred from Pacific nations. Oceania held the largest source-region share, 38.0% in 2025, because New Zealand and Pacific patients sit closest to Australian hospitals and share long referral links. Asia is the fastest-growing source region at 10.02% a year, as arrivals from India, South Korea and Indonesia have moved above pre-pandemic levels. In turn, private hospital ownership is changing, with Healthscope parent companies placed in receivership in May 2025 and Ramsay Health Care agreeing to buy a Canberra hospital in December 2025.
Which inbound treatments and patients does the estimate cover?
The estimate measures what overseas residents pay Australian hospitals, day procedure facilities and clinics for planned treatment, including complex medical care, elective procedures, fertility care and dental care. It counts payments from self-paying patients, international insurers and foreign governments that sponsor their citizens for care.
The estimate excludes emergency care for tourists, treatment for temporary residents covered by local health insurance, and travel, lodging and visa costs. The value chain runs from referring doctors, insurers, embassies and facilitators abroad to Australian specialists, private hospital groups, fertility clinics and public hospitals that sell private services.
Australia Healthcare Medical Tourism Market Insights
- The Australia healthcare medical tourism market was valued at USD 384.5 million in 2025 and is projected to reach USD 948.4 million by 2035, registering a CAGR of 9.44% during 2026–2035.
- Oceania held a 38.0% share of 2025 value, because New Zealand supplied 1,391,140 short-term visitor arrivals to Australia in 2024-25.
- Complex medical care led with a 42.0% share of 2025 value, because cancer, cardiac and specialist surgery carry the highest treatment costs.
- Ramsay Health Care agreed on Dec. 23, 2025, to buy National Capital Private Hospital in Canberra from the Healthscope receivers.
- Fertility care grows fastest at 10.33% a year during 2026–2035, as fertility preservation and embryo screening cycles keep rising.
Complex care leads while fertility treatment grows fastest
Why does complex medical care lead inbound spending?
Based on service type, the market is categorized into complex medical care, elective procedures, fertility care and dental care. Complex Medical Care led with a 42.0% share of 2025 value, because cancer, cardiac and neurosurgical cases need long stays and costly specialist teams. Fertility Care grows fastest at 10.33% a year, as overseas patients seek embryo screening, egg freezing and donor programs.
How do hospitals and day facilities split patient spending?
Based on care setting, the market is categorized into inpatient hospitals, day procedure facilities and outpatient clinics. Inpatient Hospitals led with a 52.0% share of 2025 value, because complex surgery and cancer care need overnight beds. Day Procedure Facilities grow fastest at 10.09% a year, as fertility retrievals, eye surgery and minor orthopedic work move to same-day settings that cost less.
Why do self-paying patients account for most spending?
Based on customer type, the market is categorized into self-paying patients, internationally insured patients and government-sponsored patients. Self-Paying Patients led with a 50.0% share of 2025 value, because most fertility, dental and elective patients pay providers directly. Internationally Insured Patients grow fastest at 9.91% a year, as global insurers add Australian hospitals to their cross-border networks.
How do patients find Australian providers?
Based on referral channel, the market is categorized into direct provider enquiries, clinician referrals, payer referrals and medical travel facilitators. Direct Provider Enquiries led with 35.0% of 2025 value, because hospital groups and fertility clinics run international patient offices and websites. Direct Provider Enquiries grow fastest at 9.88% a year, as patients compare clinics online before they contact a doctor.
| Segment Group | Leading Sub-segment | Share, 2025 | Fastest-growing Sub-segment | CAGR, 2026–2035 |
|---|---|---|---|---|
| By Service Type | Complex Medical Care | 42.0% | Fertility Care | 10.33% |
| By Care Setting | Inpatient Hospitals | 52.0% | Day Procedure Facilities | 10.09% |
| By Customer Type | Self-Paying Patients | 50.0% | Internationally Insured Patients | 9.91% |
| By Referral Channel | Direct Provider Enquiries | 35.0% | Direct Provider Enquiries | 9.88% |
Request a Free Sample
Fill in your details and we'll send you a free sample report.
- Sample data tables & charts
- Research methodology
Visitor recovery, specialist capacity and IVF lift demand
How does recovering visitor traffic widen patient access?
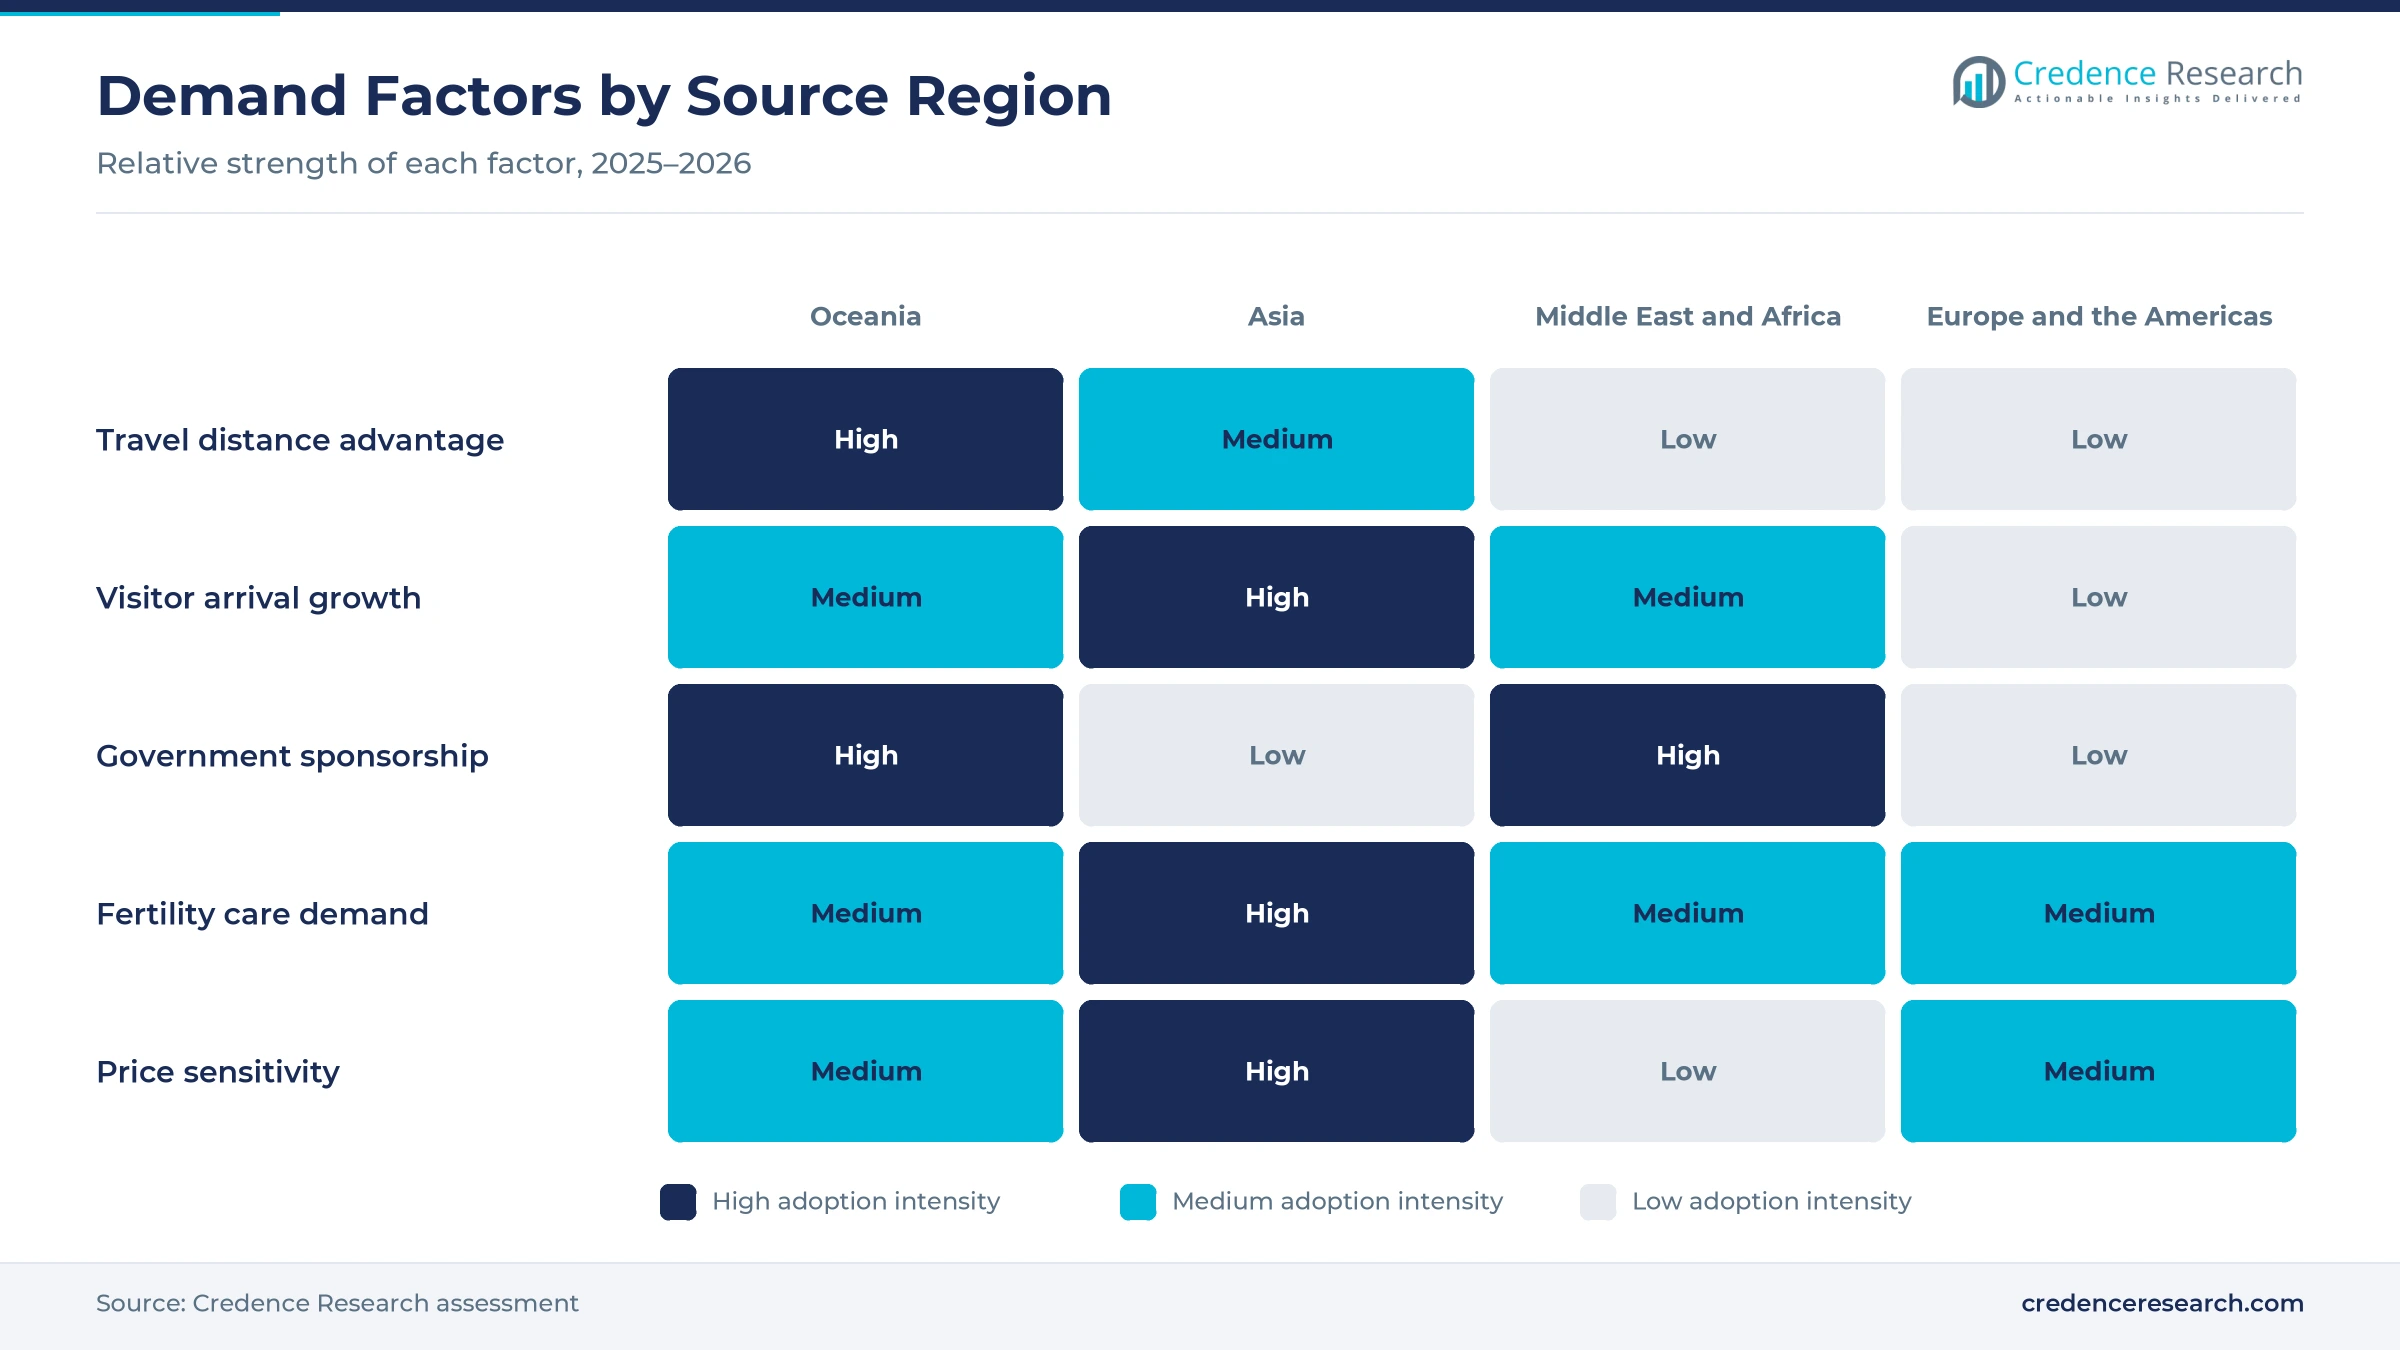
Recovering visitor traffic widens patient access, because flows into Australia have nearly returned to their pre-pandemic level. Short-term visitor arrivals reached 8,402,400 in 2024-25, up 5.5% from 2023-24, according to the Australian Bureau of Statistics. New Zealand supplied 1,391,140 of those arrivals, or 16.6% of the total, which keeps trans-Tasman treatment trips steady. Arrivals from India reached 121.2% of their 2018-19 level, while South Korea and Indonesia also moved above pre-pandemic volumes. China, however, recovered to only 66.5% of its 2018-19 level, which leaves room for further gains. As a result, Asia holds 34.0% of 2025 value, and Asian patients are adding the most new demand.
Why does complex-care referral capability attract patients?
Complex-care referral capability attracts patients who cannot find advanced treatment at home, because Australian hospitals offer cancer, cardiac and specialist surgery in accredited settings. Icon Group marked 40 cancer centers in Australia in February 2025 after openings in Noosa and The Bays, and it runs a network across seven countries, according to Icon Group. Ramsay Health Care agreed on Dec. 23, 2025, to buy National Capital Private Hospital in Canberra for AUD 251 million, a site known for cardiac, orthopedic and oncology care. The Australian Bragg Centre for Proton Therapy and Research in Adelaide is building the first proton therapy unit in the southern hemisphere, designed to treat up to 700 people a year. In turn, complex medical care holds 42.0% of 2025 value.
How does fertility treatment demand support inbound travel?
Fertility treatment demand supports inbound travel, because Australian clinics combine strong laboratory oversight with genetic screening and single-embryo transfer. More than 109,000 IVF cycles were performed in Australia and New Zealand in 2023, up 3.6% from 2022, according to UNSW Sydney. Nearly 10,000 preimplantation genetic testing cycles were recorded in 2023, up 14%, while nearly 95% of transfers used a single embryo. Fertility preservation cycles rose 28% to nearly 9,000 in 2023. Infertility also affects about 1 in 6 people globally, according to the World Health Organization. As a result, fertility care grows fastest at 10.33% a year, supported by clinics that sell in vitro fertilization packages to overseas patients.
How does the treatment visa framework support planned trips?
A dedicated treatment visa supports planned trips, because overseas patients can enter Australia on the Medical Treatment visa, subclass 602. Applicants need a letter from the treating doctor in Australia that sets out the condition, the required treatment, the estimated timeframe and the cost, according to the Australian High Commission. The application charge is nil for applicants outside Australia and for representatives of foreign governments, which eases sponsored referrals. Public hospitals must confirm that no Australian will be disadvantaged in accessing medical services, which steers many patients to private capacity. Applicants must also show enough money to support themselves and anyone who travels with them. In turn, self-paying patients hold 50.0% of 2025 value across all service types.
Asian arrivals, hospital deals and regional care shape flows
How is the rise of South and East Asian arrivals reshaping demand?
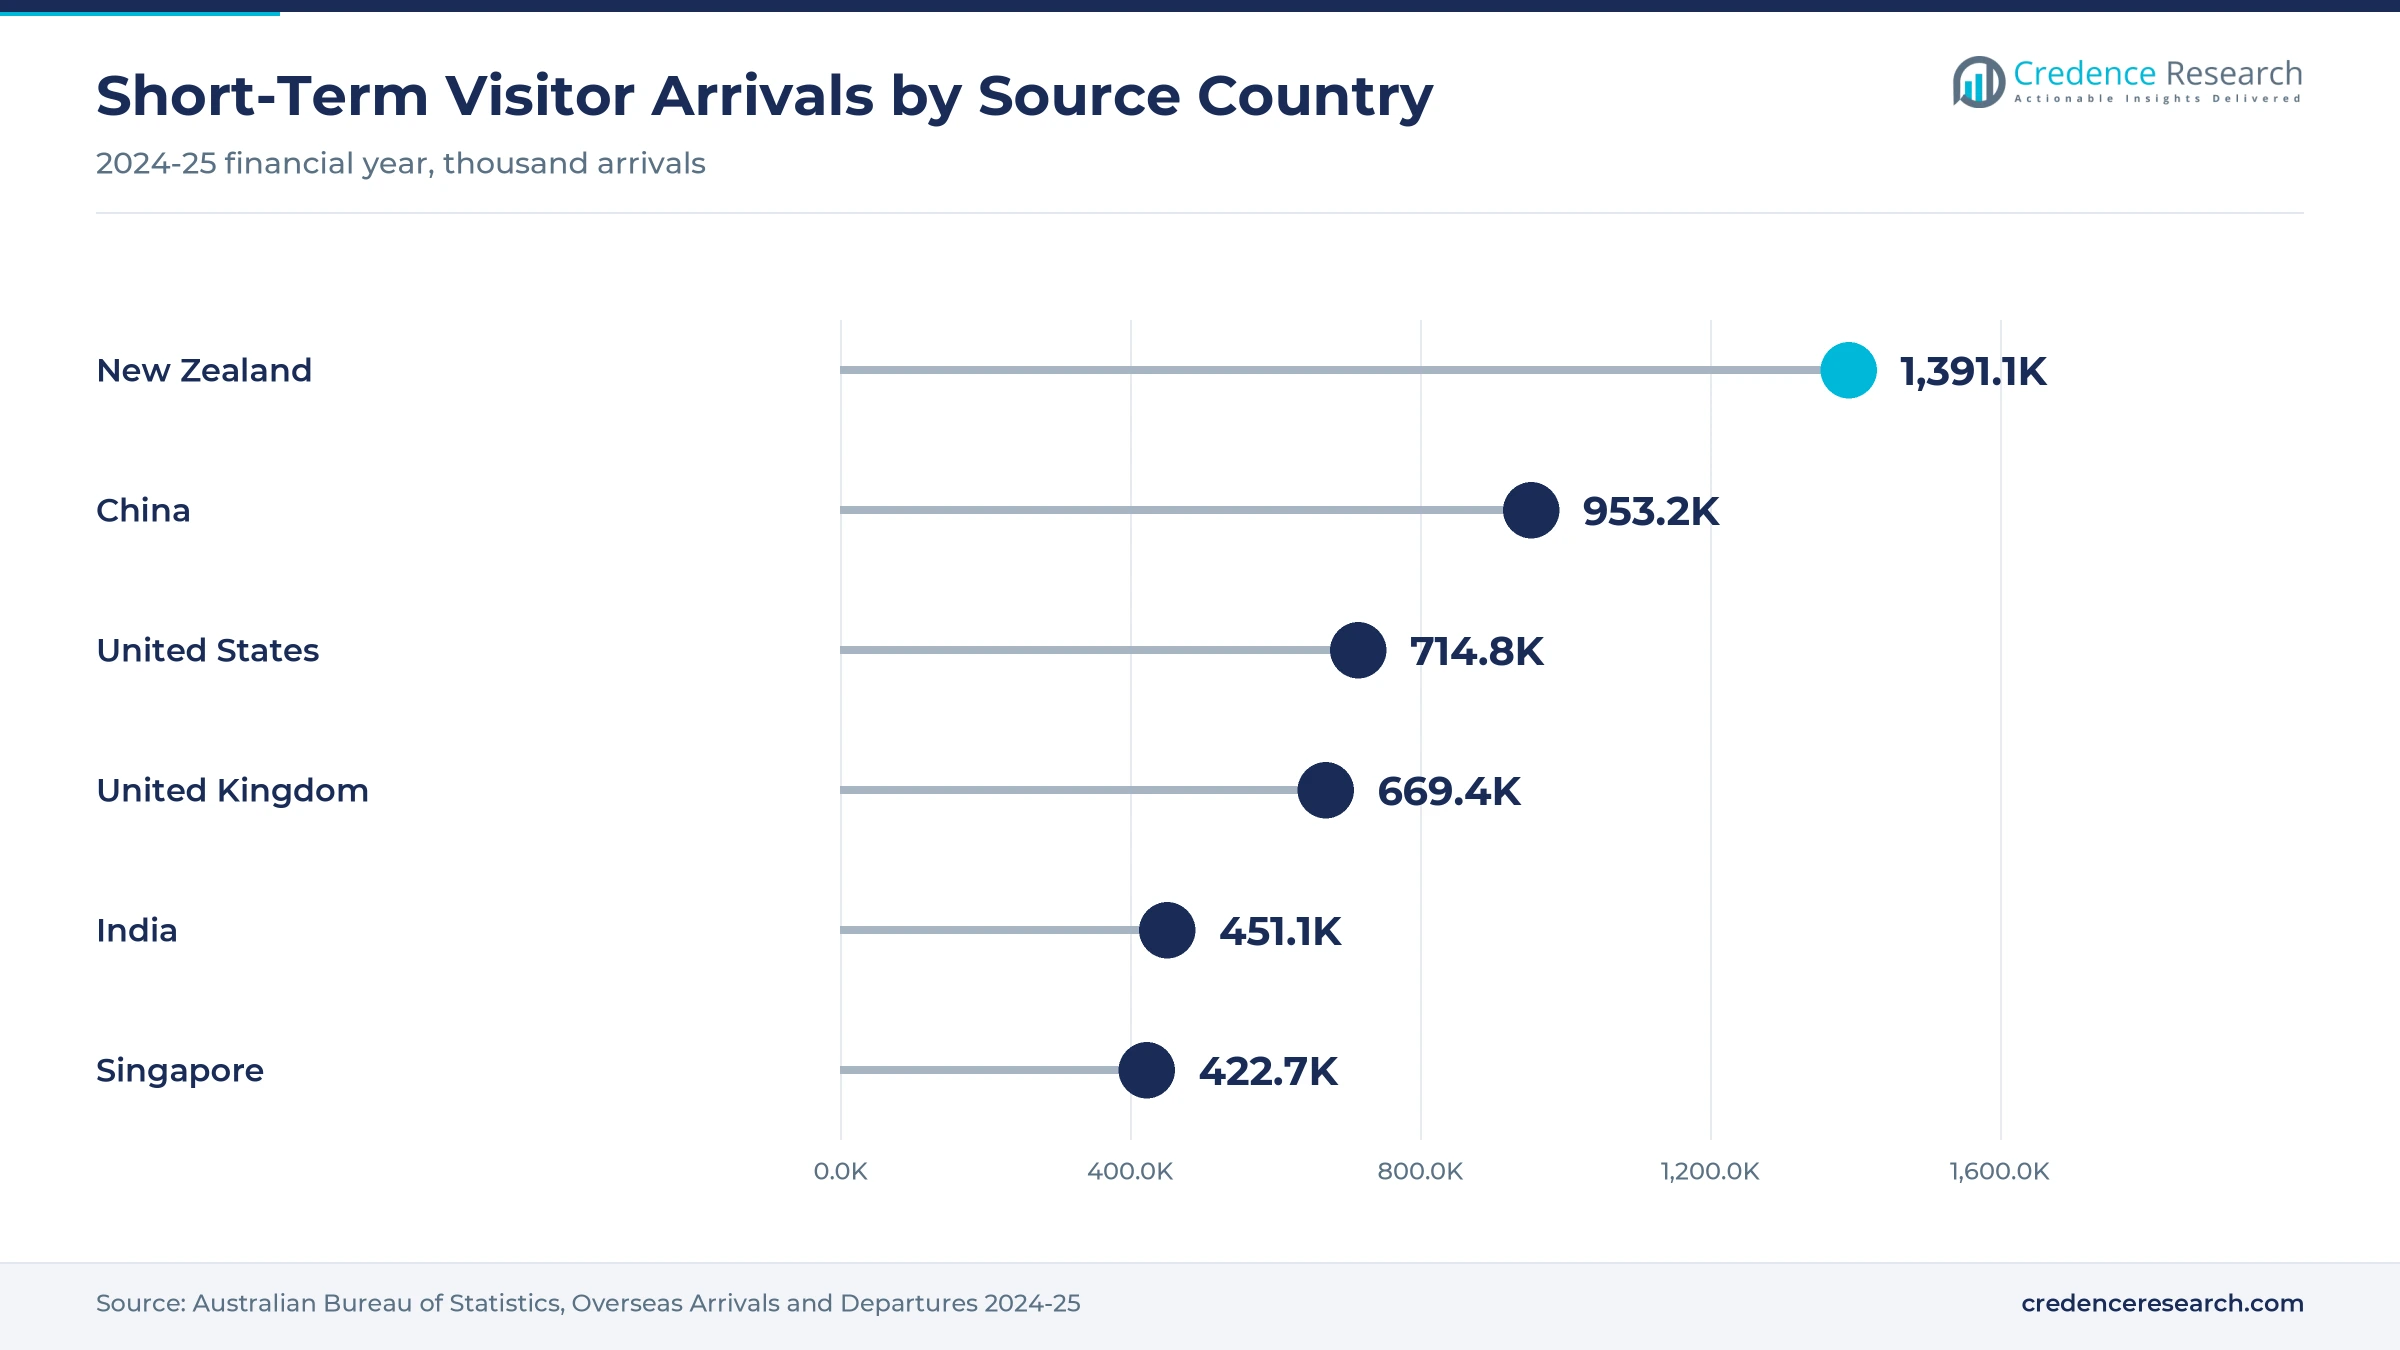
The rise of South and East Asian arrivals is reshaping demand, because these markets are growing faster than traditional source countries. India supplied 451,090 short-term arrivals in 2024-25, and visiting friends or relatives was the main reason for the trip, which links travel to family-supported treatment. South Korea reached 133.1% of its 2018-19 level and Indonesia reached 105.5%, the only other markets above pre-pandemic volumes. Singapore supplied 422,680 arrivals, which reflects close medical and business links across the region. As a result, providers are adding multilingual coordinators, online consultations and payment options, as cross-border patient travel across Asia keeps growing.
Why is the shift in private hospital ownership notable?
The shift in private hospital ownership is notable, because it changes who controls the beds that serve overseas patients. Receivers were appointed to Healthscope parent companies on May 26, 2025, while all 37 Healthscope hospitals stayed open on a business-as-usual basis. Ramsay Health Care then agreed on Dec. 23, 2025, to buy National Capital Private Hospital in Canberra, its first hospital in the Australian Capital Territory. Ramsay plans to fund the purchase from existing debt facilities, with completion expected in 2026 subject to competition approval. In turn, inpatient hospitals keep 52.0% of 2025 value, while buyers of distressed sites gain specialist cardiac and cancer capacity for referrals.
Can wider fertility access open new patient groups?
Wider fertility access can open new patient groups, because clinics now treat more single women, same-sex couples and people who want to preserve fertility. Single women started 15,994 IVF cycles in 2023, up from about 9,500 in 2020, while female same-sex couples started 4,777 cycles. Some 712 fertility preservation cycles were for cancer patients in 2023, up 22% from 2020. Live births per frozen embryo transfer also rose from 29.7% in 2019 to 32.8% in 2023, which improves the value case for travel. As a result, fertility clinics that offer clear pricing, donor programs and storage can reach overseas patients who face legal limits or long waits at home.
Is there an opening in regional and follow-up care models?
Regional and follow-up care models create an opening, because overseas patients need treatment planning before arrival and review after they fly home. The median short-term visitor stayed only 12 days in 2024-25, which leaves little time for in-person review. Epworth HealthCare launched a regional consulting partnership in East Gippsland in late 2025, with in-person appointments and telehealth for follow-up care. Icon Group was set to open a CyberKnife center in Melbourne in May 2025, after it counted 40 cancer centers in Australia that February. Icon also runs clinics in Singapore, Malaysia and Indonesia, which creates referral paths into Australia. In turn, day procedure facilities grow fastest at 10.09% a year as providers move consultations online and keep stays short.
Hospital finances, lab errors and costs test providers
How do private hospital finances threaten capacity?
Private hospital finances threaten capacity, because rising costs and weak insurer payments have strained several operators. Receivers were appointed to Healthscope parent companies in May 2025, although the hospitals stayed open. As a result, overseas patients and referrers may worry about service continuity at affected sites. Operators respond by selling hospitals to stronger groups, which keeps beds open but can change specialist rosters and pricing for international patients.
Why do laboratory errors weigh on fertility trust?
Laboratory errors weigh on fertility trust, because overseas patients choose Australian clinics for their safety record. Monash IVF disclosed in April 2025 that a Brisbane patient had received another patient's embryo, and a second error at its Clayton clinic followed in June 2025. In turn, the chief executive resigned on June 12, 2025, and the Victorian regulator opened an investigation. Clinics respond with extra witnessing checks, electronic tracking and independent audits.
How do high costs and long distances limit demand?
High costs and long distances limit demand, because Australian treatment prices are higher than those in many Asian hospital hubs. Patients must also show enough money to support themselves and their companions for the full stay. As a result, price-sensitive elective patients and buyers of overseas dental work often choose closer destinations. Providers respond with fixed-price packages, shorter stays in day facilities and remote consultations that cut the number of trips patients need.
Why do public capacity rules and clinic closures constrain supply?
Public capacity rules and clinic closures constrain supply, because public hospitals must show that no Australian will be disadvantaged before they accept overseas patients. In turn, many complex cases rely on private hospitals with limited specialist time. IVFAustralia also announced in October 2026 that its Canberra clinic will close from Dec. 16 after two specialists left. Providers respond by moving patients to other clinics, which keeps treatment available but adds travel.
Oceania leads inbound patients as Asia grows fastest
| Source Region | Value, 2025 (USD million) | Share, 2025 | CAGR, 2026–2035 |
|---|---|---|---|
| Oceania | 146.1 | 38.0% | 9.12% |
| Asia | 130.7 | 34.0% | 10.02% |
| Europe and the Americas | 69.2 | 18.0% | 8.82% |
| Middle East and Africa | 38.5 | 10.0% | 9.72% |
Why do Oceania patients hold the top share?
Oceania held a 38.0% share of 2025 value and grows at 9.12% a year, because New Zealand and Pacific nations sit closest to Australian hospitals. New Zealand supplied 1,391,140 short-term arrivals in 2024-25, which keeps trans-Tasman referrals and private treatment trips steady. Pacific governments also sponsor citizens who need cancer, cardiac and pediatric care that local hospitals cannot provide. As a result, Oceania remains the largest source of government-sponsored patients.
Why is Asia the fastest-growing source region?
Asia held a 34.0% share of 2025 value and grows fastest at 10.02% a year, because arrivals from India, South Korea and Indonesia are above pre-pandemic levels. India supplied 451,090 arrivals in 2024-25, while Singapore supplied 422,680. China recovered to only 66.5% of its 2018-19 level, which leaves room for further gains. In turn, Asian patients drive demand for fertility care, cancer treatment and specialist surgery in Sydney, Melbourne and Brisbane.
How do Europe and the Americas contribute?
Europe and the Americas held 18.0% of 2025 value and grow at 8.82% a year, because many visitors from these markets combine treatment with family or holiday travel. The United States supplied 714,770 arrivals in 2024-25 and the United Kingdom supplied 669,390. As a result, this region adds steady demand for dental and elective care, while long flights limit complex cases.
What shapes demand from the Middle East and Africa?
The Middle East and Africa held a 10.0% share of 2025 value and grow at 9.72% a year, because Gulf governments and insurers sponsor complex care abroad. The Medical Treatment visa charge is nil for representatives of foreign governments, which eases sponsored referrals. In turn, demand concentrates on cancer, cardiac and pediatric care at large private hospitals and public hospitals that sell private services.
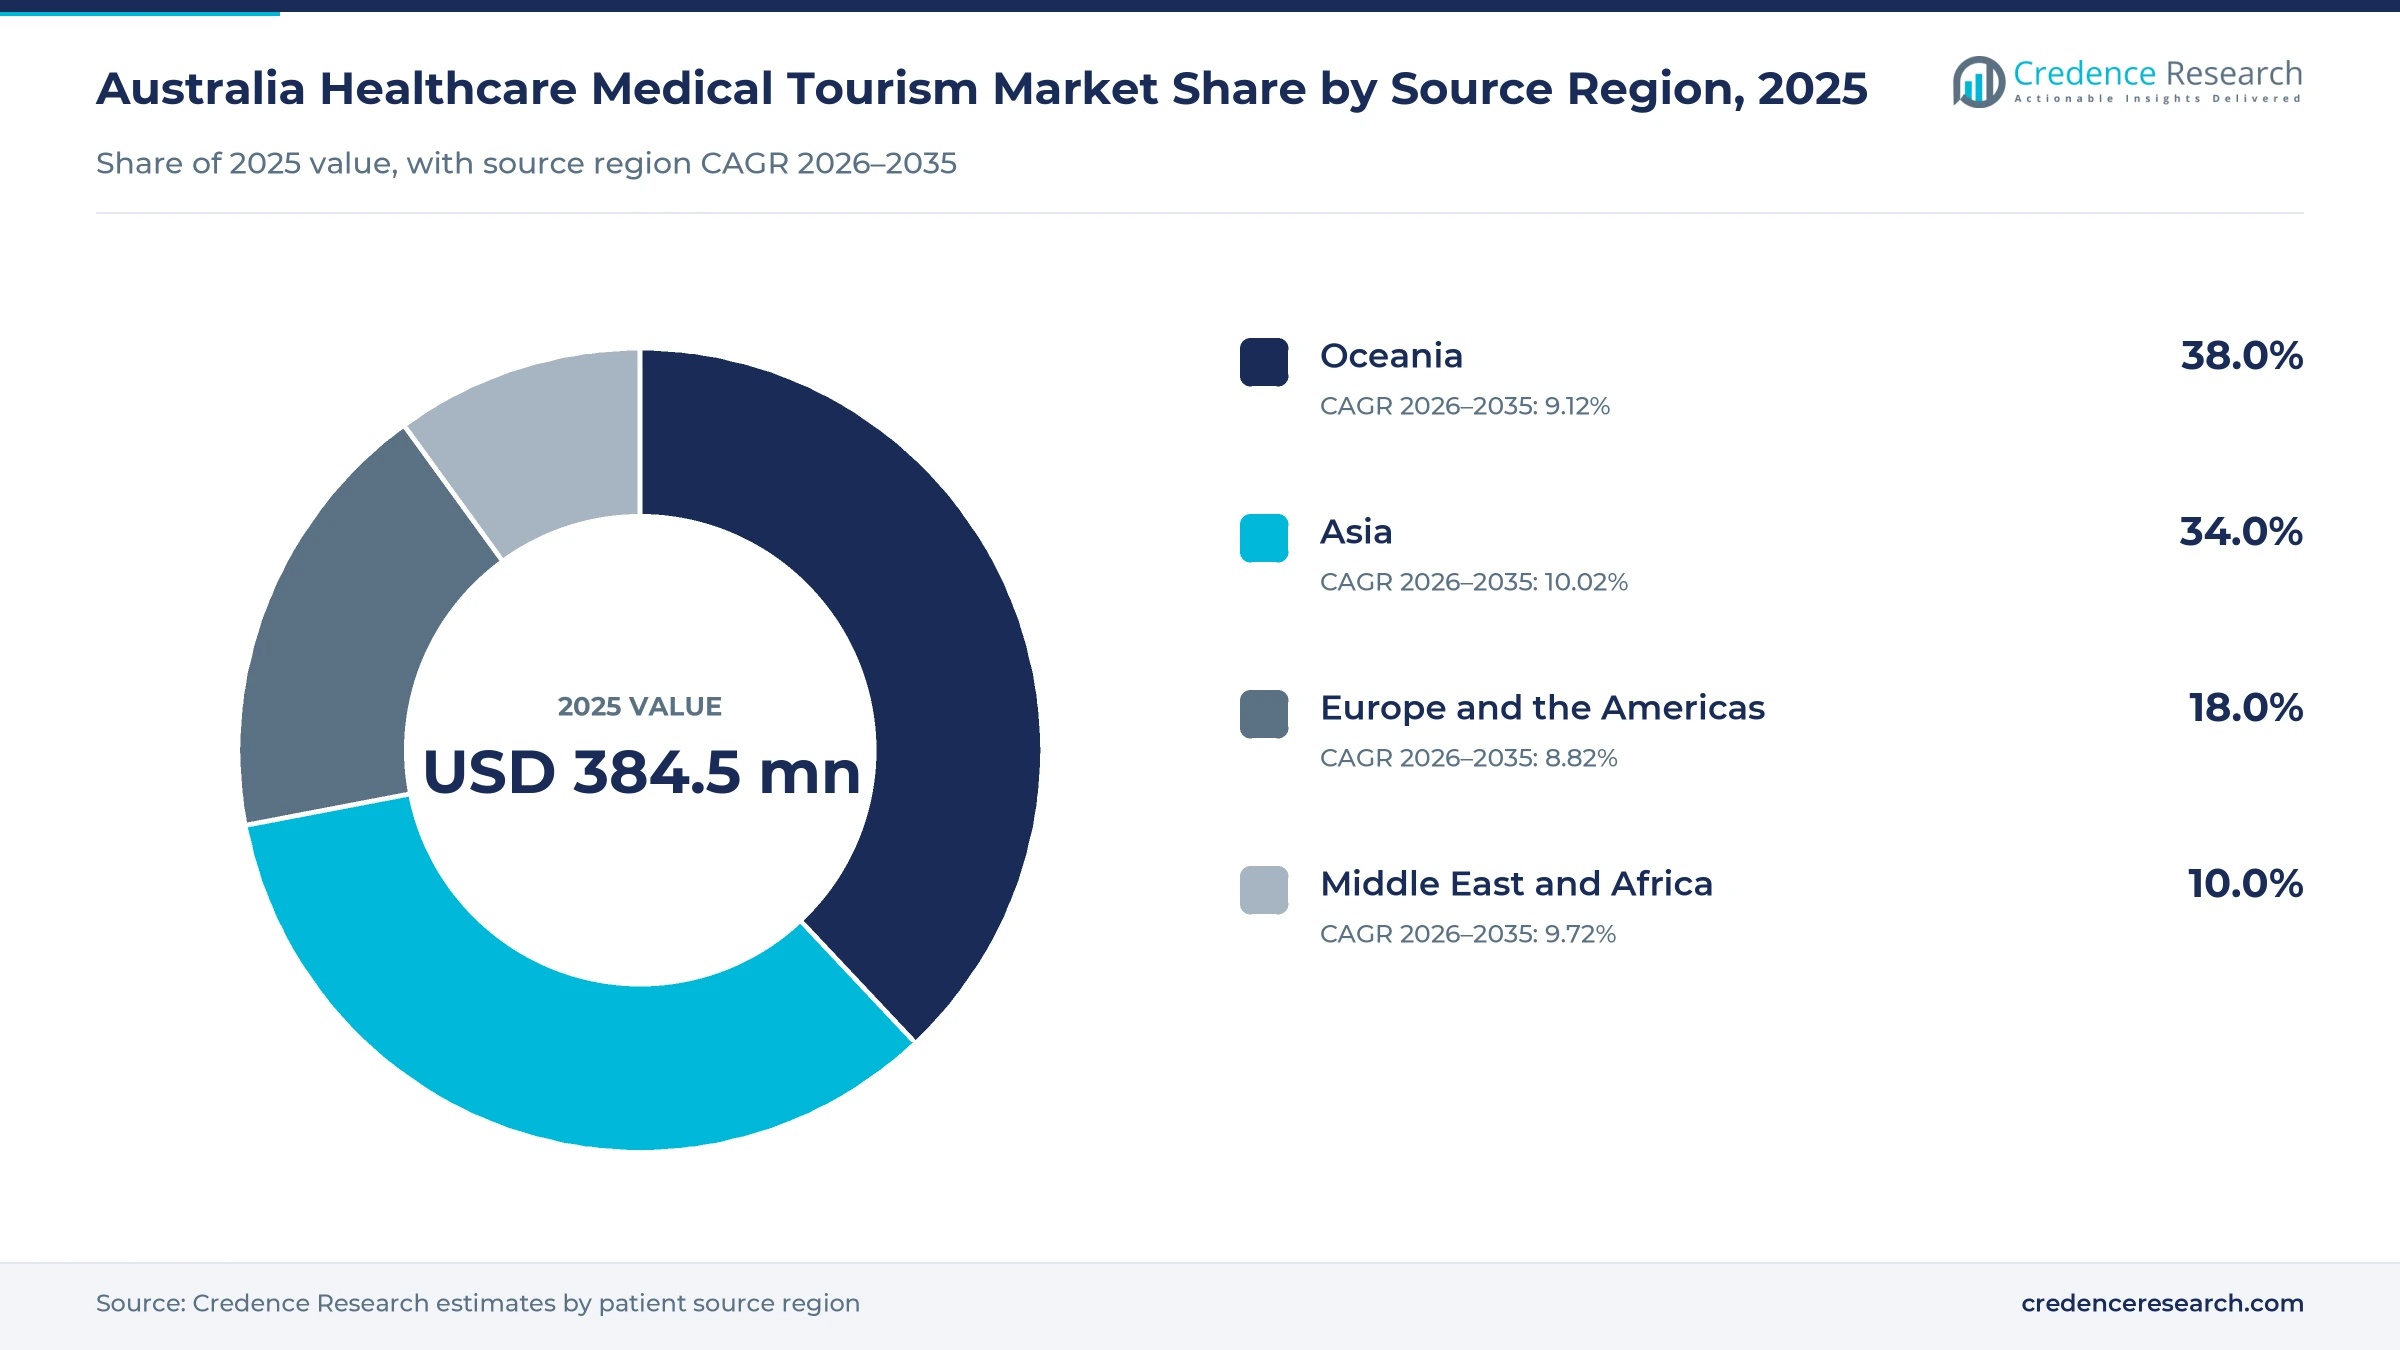
Hospital deals, IVF reviews and network growth, 2024–2026
| Development | Status and market relevance |
|---|---|
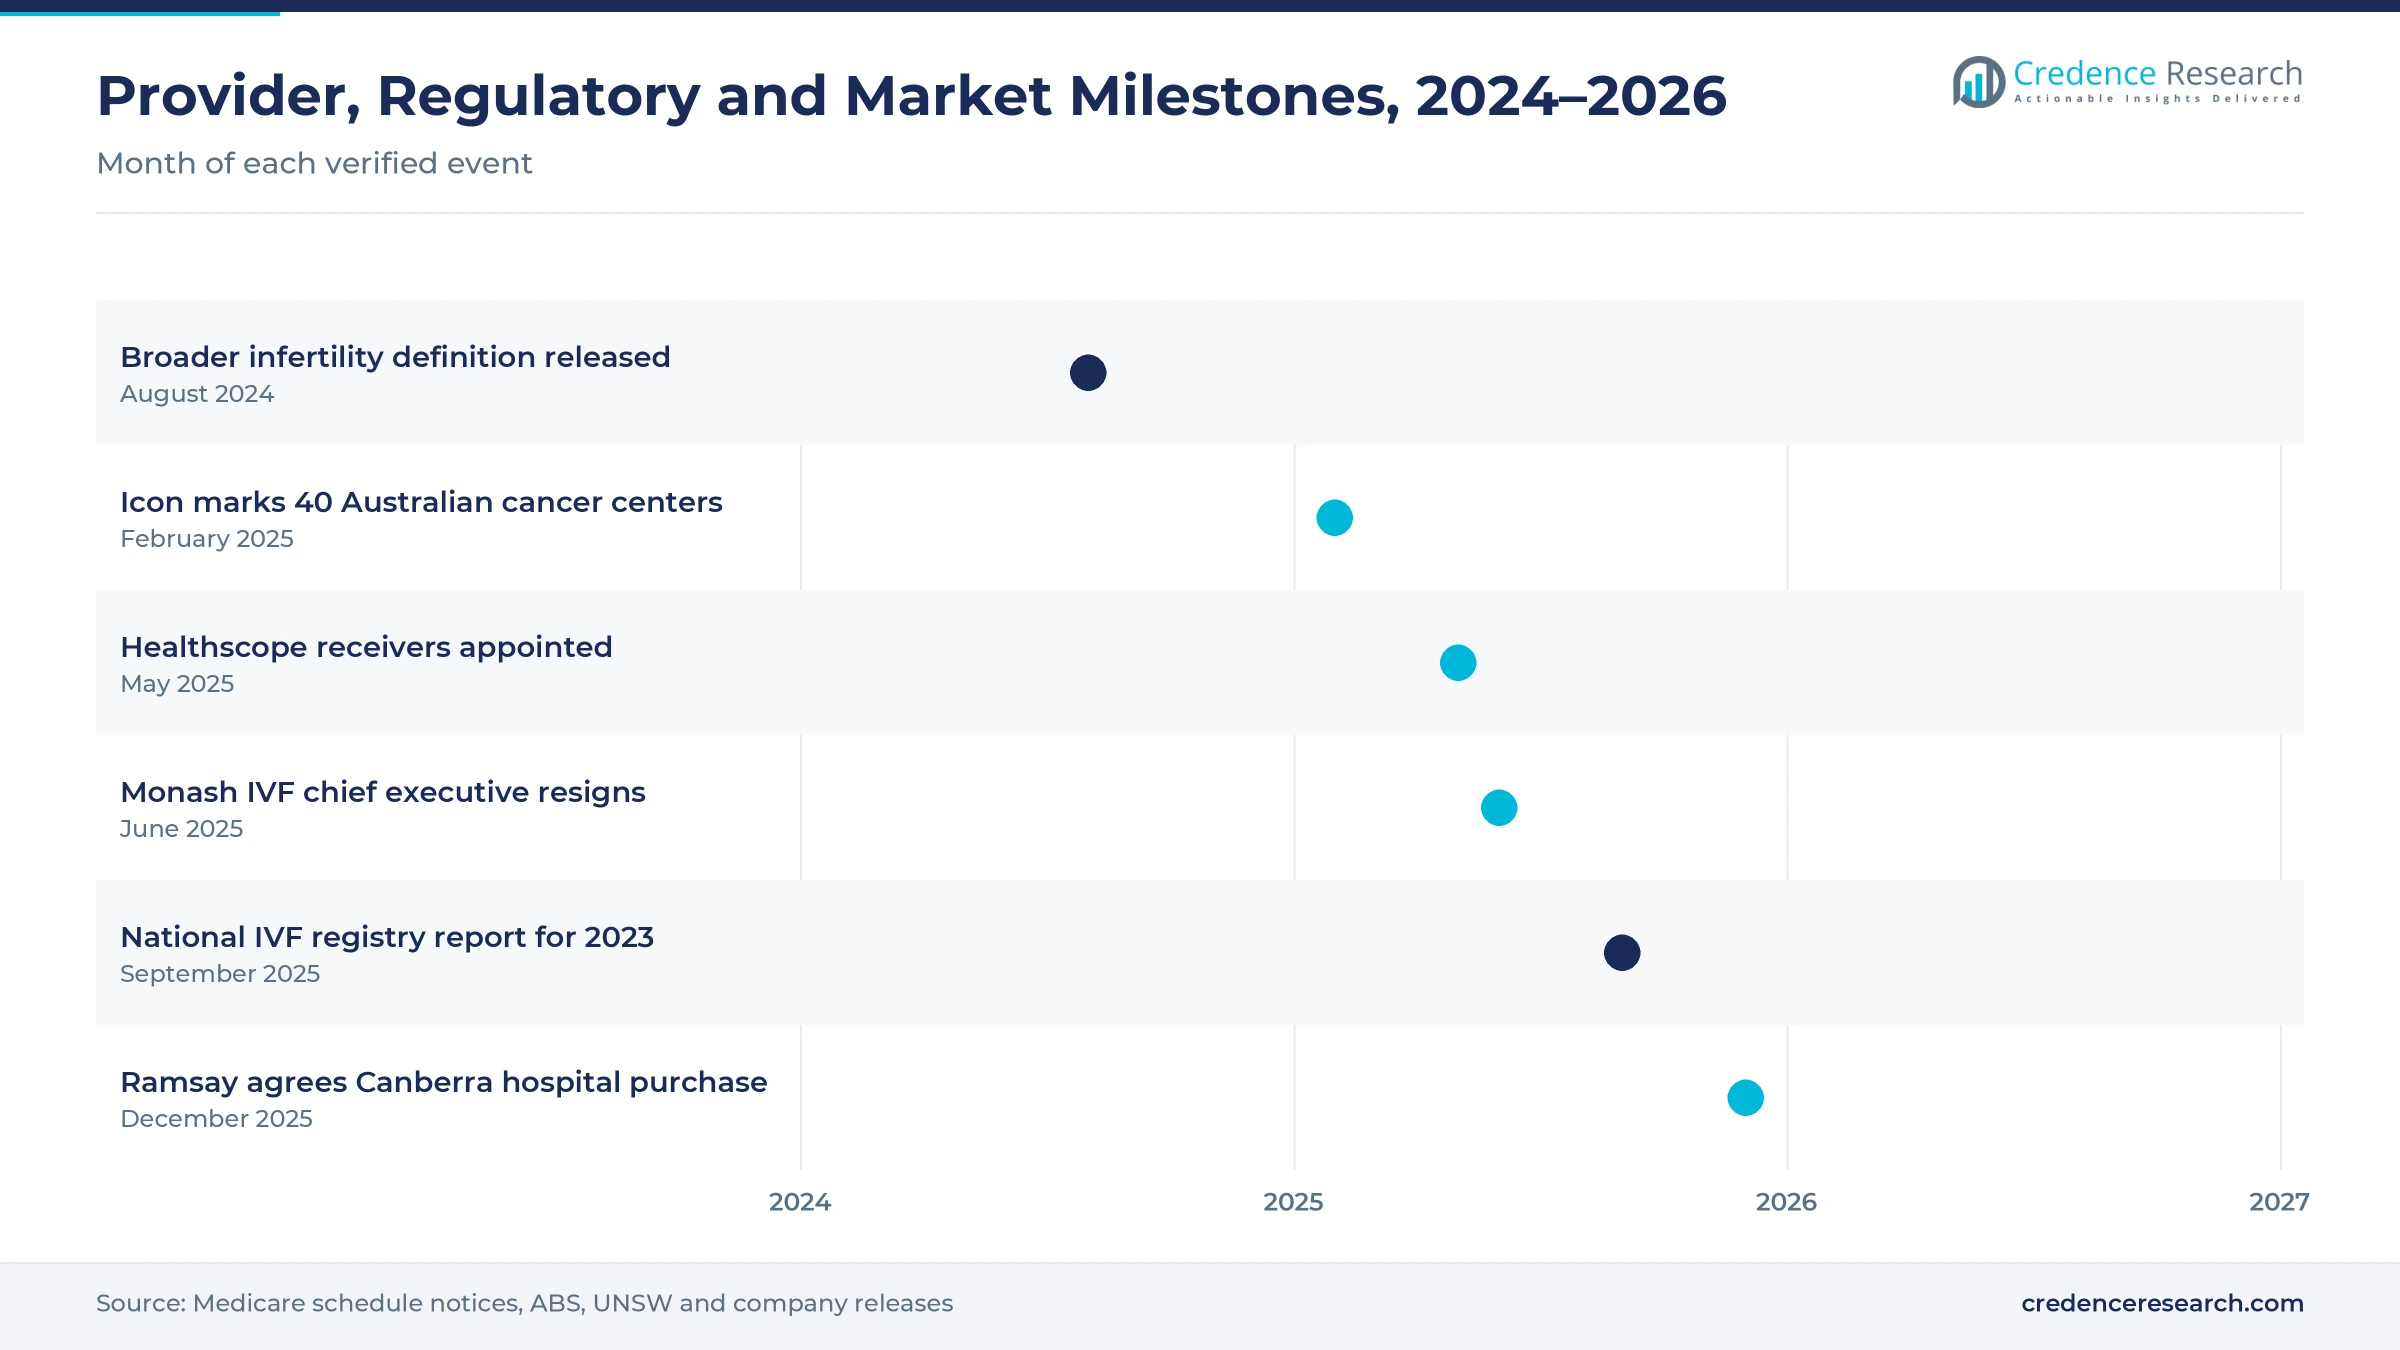
| In August 2024, Australian fertility societies released a broader clinical definition of infertility that the Medicare schedule now recognizes. | May let more patients claim benefits for fertility treatment |
| In February 2025, Icon Group marked 40 cancer centers in Australia after openings in Noosa and The Bays. | Widens specialist cancer capacity for referrals |
| In May 2025, receivers were appointed to Healthscope parent companies, while all 37 Healthscope hospitals stayed open. | Signals financial strain in private hospital capacity |
| In June 2025, the Monash IVF chief executive resigned after a second embryo transfer error was disclosed. | Raises scrutiny of fertility laboratory controls |
| In December 2025, Ramsay Health Care agreed to buy National Capital Private Hospital in Canberra for AUD 251 million. | Completion expected in 2026, subject to competition approval |
Radiosurgery, embryo screening and telehealth widen care
- Stereotactic radiosurgery delivers precise, high-dose radiation in a few sessions, which suits overseas cancer patients who cannot stay for weeks of treatment.
- Preimplantation genetic testing checks embryos for inherited conditions using methods such as karyomapping, which draws couples who carry known genetic risks.
- Telehealth consultations let specialists review records before arrival and follow patients after they fly home, which shortens stays and reduces travel costs.
- Fertility preservation and embryo freezing store eggs and embryos for later use, which lets overseas patients complete retrieval in one trip and return for transfer when they are ready.
Need a Custom Version of This Report?
Tailor the scope, geography, or segments to your exact requirements.
- Custom geography or segment scope
- Direct access to our analyst team
Hospital groups and fertility chains compete for patients
Medical tourism competition is led by private hospital groups, fertility chains and cancer care networks that run international patient services. Ramsay Health Care operates a large national hospital network and agreed in December 2025 to buy National Capital Private Hospital in Canberra. Icon Group runs 40 cancer centers in Australia and clinics across Asia, which creates referral paths into its Australian sites. Monash IVF Group and Virtus Health compete for fertility patients with embryo screening, donor programs and storage. Epworth HealthCare, a not-for-profit group, offers specialist surgery in Melbourne and regional Victoria. Rivals compete on specialist reputation, success rates, safety records, package pricing and patient coordination. Because overseas patients rely on trust, providers with strong accreditation and clear communication win more referrals.
Which providers serve overseas patients in Australia?
| Company | Type | Role in the market |
|---|---|---|
| Ramsay Health Care | Private hospital group | Agreed in December 2025 to buy National Capital Private Hospital in Canberra |
| Icon Group | Cancer care network | Runs 40 Australian cancer centers and clinics in six other countries |
| Monash IVF Group | Fertility clinic chain | Offers preimplantation genetic testing through its genetics laboratory |
| Virtus Health | Fertility clinic chain | Runs IVFAustralia clinics, including a Canberra site closing from Dec. 16 |
| Epworth HealthCare | Not-for-profit hospital group | Launched an East Gippsland consulting partnership in late 2025 |
Credence Research view on inbound patient travel
Credence Research's view is that medical tourism to Australia will grow steadily because visitor flows have recovered and specialist capacity is strong. Complex medical care remains the largest value pool, while fertility care adds the fastest growth as embryo screening and fertility preservation spread. Asia will provide most new patients, led by India, South Korea and Indonesia. Hospital consolidation and laboratory scrutiny will test providers, so groups with stable finances, strong safety records and clear package pricing should gain share fastest.
How the inbound patient estimate was built
The report uses 2025 as the base year on a calendar basis, and market values come from the Credence Research model. That model combines visitor arrival statistics, assisted reproduction registry data, visa rules, hospital and clinic network data and company announcements. Segment splits, source-region shares and growth rates are Credence Research estimates. Sources used are official statistics, government publications, university registry reports and company releases, and no interviews or surveys were used.
Asian demand and fertility care carry growth to 2035
Inbound patient spending is expected to reach USD 948.4 million by 2035, a 9.44% CAGR during 2026–2035, as Asian arrivals rise and fertility care expands. Growth should stay strongest through 2030 while visitor flows from China recover and Indian arrivals keep climbing. After that, day procedure facilities and telehealth follow-up will carry more of the value. Stable hospital finances and strong safety records will decide which providers win the most overseas referrals. Faster visa processing and more insurer agreements would lift medical tourism volumes, while a stronger Australian dollar would push price-sensitive patients toward Asian hospitals.
Frequently Asked Questions
How big is the Australia healthcare medical tourism market?
Which service type leads inbound patient spending?
Which source region sends the most patients?
How many short-term visitors arrived in Australia in 2024-25?
How many IVF cycles were performed in 2023?
Which visa do overseas patients use?
Who are the leading providers in the Australian market?
What are the main challenges for providers?
Table of Content
Chapter 1 Market Segmentation
- 1.1 Segmentation Framework
- 1.1.1 Product and Service Classification
- 1.1.2 Application and End-Use Classification
- 1.1.3 Technology and Solution Classification
- 1.1.4 Customer and Distribution Channel Classification
- 1.1.5 Geographic Segmentation
- 1.1.6 Market Segment Definitions and Boundaries
- 1.2 By Service Type
- 1.2.1 Complex Medical Care
- 1.2.2 Elective Procedures
- 1.2.3 Fertility Care
- 1.2.4 Dental Care
- 1.3 By Care Setting
- 1.3.1 Inpatient Hospitals
- 1.3.2 Day Procedure Facilities
- 1.3.3 Outpatient Clinics
- 1.4 By Customer Type
- 1.4.1 Self-Paying Patients
- 1.4.2 Internationally Insured Patients
- 1.4.3 Government-Sponsored Patients
- 1.5 By Referral Channel
- 1.5.1 Direct Provider Enquiries
- 1.5.2 Clinician Referrals
- 1.5.3 Payer Referrals
- 1.5.4 Medical Travel Facilitators
- 1.6 By Source Region
- 1.6.1 Oceania
- 1.6.2 Asia
- 1.6.3 Middle East and Africa
- 1.6.4 Europe and the Americas
Chapter 2 Introduction
- 2.1 Report Objectives and Scope
- 2.2 Product Definition and Industry Terminology
- 2.3 Market Inclusions and Exclusions
- 2.4 Research Process
- 2.4.1 Primary Research and Expert Interviews
- 2.4.2 Secondary Research and Source Review
- 2.4.3 Top-Down and Bottom-Up Estimation
- 2.4.4 Data Triangulation and Verification
- 2.5 Market Size Measurement Basis
- 2.5.1 2025: USD 384.5 million → 2035: USD 948.4 million
- 2.6 Historical and Forecast Reference Periods
- 2.6.1 Historical Period: 2018-2025
- 2.6.2 Base Year: 2025
- 2.6.3 Forecast Period: 2025-2035
- 2.7 Research Assumptions and Limitations
Chapter 3 Executive Summary
- 3.1 Market Snapshot and Key Findings
- 3.2 Base-Year Market Size, 2025
- 3.3 Forecast Market Size, 2035
- 3.4 Revenue and Volume Growth Outlook
- 3.5 Key Demand and Supply Indicators
- 3.6 Leading Market Segments
- 3.7 Fastest-Growing Market Opportunities
- 3.8 Regional Performance Highlights
- 3.9 Technology and Industry Transformation
- 3.10 Competitive Landscape Summary
- 3.11 Analyst View and Strategic Implications
Chapter 4 Australia Healthcare Medical Tourism Market Trends and Developments
- 4.1 Historical Industry Development, 2018-2025
- 4.2 Recent Market Trends and Developments
- 4.3 Demand and Customer Behavior Trends
- 4.4 Technology and Product Innovation
- 4.5 Artificial Intelligence, Automation and Digitalization
- 4.6 Local Manufacturing and Supply Chain Realignment
- 4.7 Industry Partnerships, Mergers and Acquisitions
- 4.8 Sustainability and Circular Economy Developments
- 4.9 Government and Private Sector Investment Trends
- 4.10 Emerging Business Models and Commercialization
- 4.11 Industry Developments and Announcements
Chapter 5 Australia Healthcare Medical Tourism Market Supply and Demand Analysis
- 5.1 Demand Trend and Consumption Analysis, 2018-2025
- 5.2 Demand Forecast, 2025-2035
- 5.3 Supply Chain Structure and Procurement Trends
- 5.4 Supply-Demand Gap and Bottlenecks
- 5.5 Import Dependence and Sourcing Structure
- 5.6 Regional Supply and Demand Concentration
Chapter 6 Australia Healthcare Medical Tourism Market Pricing Analysis
- 6.1 Pricing Structure and Measurement
- 6.2 Historical Pricing Trends, 2018-2025
- 6.3 Pricing Outlook, 2025-2035
- 6.4 Pricing by Product and Market Segment
- 6.5 Geographic Pricing Differences
- 6.6 Key Input, Energy, Labor and Logistics Costs
- 6.7 Contract Pricing and Purchasing Models
- 6.8 Pricing Sensitivity and Competitive Positioning
- 6.9 Price, Margin and Profitability Implications
Chapter 7 Australia Healthcare Medical Tourism Market Dynamics
- 7.1 Market Growth Drivers
- 7.1.1 Demand-Side Drivers
- 7.1.2 Technology and Innovation Drivers
- 7.1.3 Infrastructure and Investment Drivers
- 7.1.4 Regulatory and Policy Drivers
- 7.2 Market Restraints
- 7.2.1 Cost and Affordability Constraints
- 7.2.2 Technology and Adoption Barriers
- 7.2.3 Supply Chain and Operational Constraints
- 7.3 Market Challenges
- 7.3.1 Competitive Pressure and Margin Erosion
- 7.3.2 Skills, Infrastructure and Implementation Gaps
- 7.4 Emerging Market Opportunities
- 7.5 Market Dynamics Impact and Time-Horizon Assessment
Chapter 8 Australia Healthcare Medical Tourism Value Chain Analysis
- 8.1 Industry Value Chain Overview
- 8.2 Upstream Suppliers and Critical Inputs
- 8.3 Technology and Component Providers
- 8.4 Manufacturing or Service Delivery
- 8.5 Distribution, Channel Partners and Integrators
- 8.6 Downstream Applications and End Users
- 8.7 Value Addition and Profit Pools
- 8.8 Vertical Integration and Outsourcing
- 8.9 Supplier Concentration and Risk
- 8.10 Supply Chain Localization and Resilience
Chapter 9 Australia Healthcare Medical Tourism Market Regulations and Policies
- 9.1 Relevant Laws, Standards and Compliance Frameworks
- 9.2 Product, Service, Safety and Quality Requirements
- 9.3 Government Policies, Incentives and Subsidies
- 9.4 Imports, Exports and Trade Barriers
- 9.5 Public Procurement and Local Content Requirements
- 9.6 Data Protection, AI and Cybersecurity Compliance
- 9.7 Upcoming Policy Changes and Market Implications
Chapter 10 Australia Healthcare Medical Tourism Market Hotspots and Opportunities
- 10.1 Market Opportunity Mapping and Growth Hotspots
- 10.2 High-Growth Applications and Customer Groups
- 10.3 Underserved Markets and White-Space Opportunities
- 10.4 Emerging Technology and Product Opportunities
- 10.5 New Capacity and Investment Hotspots
- 10.6 Market Entry and Expansion Opportunities
- 10.7 Distribution and Partnership Opportunities
- 10.8 Near-Term and Long-Term Commercial Potential
- 10.9 Opportunity Attractiveness and Execution Risks
Chapter 11 Australia Healthcare Medical Tourism Market Outlook, 2025-2035
- 11.1 Market Size and Analysis
- 11.1.1 Revenue (Market Measurement: 2025: USD 384.5 million → 2035: USD 948.4 million)
- 11.1.2 Historical Market Size, 2018-2025
- 11.1.3 Base-Year Market Size, 2025
- 11.2 Market Forecast, 2025-2035
- 11.2.1 Revenue Forecast to 2035
- 11.2.2 CAGR and Year-on-Year Growth
- 11.2.3 Incremental Revenue Opportunity
- 11.3 Forecast Assumptions and Scenario Analysis
- 11.3.1 Base-Case Forecast
- 11.3.2 Optimistic and Conservative Scenarios
- 11.3.3 Technology, Pricing and Policy Sensitivities
- 11.4 Market Attractiveness and Growth Outlook
Chapter 12 Australia Healthcare Medical Tourism Market Segmentation and Outlook
- 12.1 Segmentation Summary and Market Shares, 2025
- 12.2 Largest and Fastest-Growing Segments
- 12.3 By Service Type - Market Size and Forecast, 2025-2035
- 12.3.1 Segment Definition and Scope
- 12.3.2 Historical Market Size, 2018-2025
- 12.3.3 Revenue Forecast, 2025-2035
- 12.3.4 Base-Year Market Share, 2025
- 12.3.5 Segment CAGR and Growth Drivers
- 12.3.6 Subsegment Market Size and Forecast
- 12.3.6.1 Complex Medical Care
- 12.3.6.2 Elective Procedures
- 12.3.6.3 Fertility Care
- 12.3.6.4 Dental Care
- 12.3.7 Subsegment Pricing and Adoption Trends
- 12.3.8 Leading Suppliers and Competition
- 12.3.9 Regional Demand and Opportunities
- 12.4 By Care Setting - Market Size and Forecast, 2025-2035
- 12.4.1 Segment Definition and Scope
- 12.4.2 Historical Market Size, 2018-2025
- 12.4.3 Revenue Forecast, 2025-2035
- 12.4.4 Base-Year Market Share, 2025
- 12.4.5 Segment CAGR and Growth Drivers
- 12.4.6 Subsegment Market Size and Forecast
- 12.4.6.1 Inpatient Hospitals
- 12.4.6.2 Day Procedure Facilities
- 12.4.6.3 Outpatient Clinics
- 12.4.7 Subsegment Pricing and Adoption Trends
- 12.4.8 Leading Suppliers and Competition
- 12.4.9 Regional Demand and Opportunities
- 12.5 By Customer Type - Market Size and Forecast, 2025-2035
- 12.5.1 Segment Definition and Scope
- 12.5.2 Historical Market Size, 2018-2025
- 12.5.3 Revenue Forecast, 2025-2035
- 12.5.4 Base-Year Market Share, 2025
- 12.5.5 Segment CAGR and Growth Drivers
- 12.5.6 Subsegment Market Size and Forecast
- 12.5.6.1 Self-Paying Patients
- 12.5.6.2 Internationally Insured Patients
- 12.5.6.3 Government-Sponsored Patients
- 12.5.7 Subsegment Pricing and Adoption Trends
- 12.5.8 Leading Suppliers and Competition
- 12.5.9 Regional Demand and Opportunities
- 12.6 By Referral Channel - Market Size and Forecast, 2025-2035
- 12.6.1 Segment Definition and Scope
- 12.6.2 Historical Market Size, 2018-2025
- 12.6.3 Revenue Forecast, 2025-2035
- 12.6.4 Base-Year Market Share, 2025
- 12.6.5 Segment CAGR and Growth Drivers
- 12.6.6 Subsegment Market Size and Forecast
- 12.6.6.1 Direct Provider Enquiries
- 12.6.6.2 Clinician Referrals
- 12.6.6.3 Payer Referrals
- 12.6.6.4 Medical Travel Facilitators
- 12.6.7 Subsegment Pricing and Adoption Trends
- 12.6.8 Leading Suppliers and Competition
- 12.6.9 Regional Demand and Opportunities
- 12.7 By Source Region - Market Size and Forecast, 2025-2035
- 12.7.1 Segment Definition and Scope
- 12.7.2 Historical Market Size, 2018-2025
- 12.7.3 Revenue Forecast, 2025-2035
- 12.7.4 Base-Year Market Share, 2025
- 12.7.5 Segment CAGR and Growth Drivers
- 12.7.6 Subsegment Market Size and Forecast
- 12.7.6.1 Oceania
- 12.7.6.2 Asia
- 12.7.6.3 Middle East and Africa
- 12.7.6.4 Europe and the Americas
- 12.7.7 Subsegment Pricing and Adoption Trends
- 12.7.8 Leading Suppliers and Competition
- 12.7.9 Regional Demand and Opportunities
- 12.8 Segment Growth Comparison
- 12.9 Segment Attractiveness and Priority Matrix
Chapter 13 Australia Healthcare Medical Tourism End-Use and Application Market Outlook
- 13.1 End-Use Industry and Customer Demand Structure
- 13.2 Leading Applications and Customer Groups
- 13.3 End-Use Market Size, Share and Forecast
- 13.4 Major End-Use Industry Deep Dives
- 13.4.1 Customer Requirements and Use Cases
- 13.4.2 Demand and Replacement Cycles
- 13.4.3 Technical and Regulatory Considerations
- 13.4.4 Purchasing and Procurement Models
- 13.4.5 Leading Vendors and Distribution Channels
- 13.4.6 Forecast and Commercial Opportunities
- 13.5 Emerging Applications and Cross-Segment Demand
- 13.6 End-Use Industry Investment Priorities
Chapter 14 Australia Healthcare Medical Tourism Geographic Market Outlook, 2025-2035
- 14.1 Domestic Market Distribution and Demand Clusters
- 14.2 State- or Province-Wise Market Size and Forecast, 2025-2035
- 14.3 City and Metropolitan Market Outlook
- 14.4 Industrial, Manufacturing and Commercial Clusters
- 14.5 Geographic Concentration of Key End Users
- 14.6 Local Pricing and Purchasing Differences
- 14.7 Domestic Production Facilities and Capacity Map
- 14.8 Local Infrastructure and Project Pipeline
- 14.9 State-Level Policy and Incentive Differences
- 14.10 Subnational Investment Hotspots and Opportunities
- 14.11 Distribution and Logistics Networks
- 14.12 Domestic Competitive Footprint
Chapter 15 Australia Healthcare Medical Tourism Technology, Innovation and Sustainability Outlook
- 15.1 Technology Landscape and Maturity
- 15.2 Product, Process and Service Innovation
- 15.3 AI, Automation and Digital Tools in the Industry
- 15.4 Technology Adoption and Performance Benchmarking
- 15.5 Innovation Pipeline and R&D Investment
- 15.6 Energy Efficiency and Resource Management
- 15.7 Sustainability, Recycling and Circularity
- 15.8 Technology Roadmap, 2025-2035
- 15.9 Risks of Obsolescence and Technology Substitution
Chapter 16 Australia Healthcare Medical Tourism Market Key Strategic Imperatives
- 16.1 Growth and Market Entry Priorities
- 16.2 High-Return Products and Segments
- 16.3 Pricing, Profitability and Cost Optimization
- 16.4 Technology Investment and Product Differentiation
- 16.5 Supply Chain Localization and Resilience
- 16.6 Distribution and Customer Acquisition
- 16.7 Partnership, Acquisition and Capacity Strategy
- 16.8 Regional Expansion Priorities
- 16.9 Short-, Medium- and Long-Term Actions
Chapter 17 Competition Outlook
- 17.1 Industry Competition Characteristics
- 17.2 Market Structure and Concentration
- 17.3 Market Share and Competitive Positioning, 2025
- 17.4 Company-Wise Revenue and Product Benchmarking
- 17.5 Production and Service Capacity Benchmarking
- 17.6 Technology, Pricing and Differentiation
- 17.7 Regional Footprint and Distribution Strength
- 17.8 Mergers, Acquisitions and Strategic Alliances
- 17.9 New Entrants and Competitive Threats
- 17.10 Porter's Five Forces and Industry Attractiveness
- 17.11 Competitive Outlook, 2025-2035
Chapter 18 Company Profiles
- 18.1 Company Coverage and Selection Criteria
- 18.2 Ramsay Health Care
- 18.2.1 Business Description
- 18.2.2 Company Ownership and Geographic Presence
- 18.2.3 Product and Service Portfolio
- 18.2.4 Manufacturing and Operating Footprint
- 18.2.5 Financial Performance and Investment
- 18.2.6 Market Share and Competitive Position
- 18.2.7 Technology and Innovation Capabilities
- 18.2.8 Strategic Alliances or Partnerships
- 18.2.9 Recent Developments
- 18.2.10 Growth Strategy and Outlook
- 18.3 Monash IVF Group
- 18.4 Epworth HealthCare
- 18.5 Virtus Health
- 18.6 Icon Group
- 18.7 Other Relevant Market Participants
Note: Every listed company is profiled on the structure shown under the first company. The company list is preliminary and may change based on research findings, market developments, data availability and client requirements.
Chapter 19 Disclaimer
- 19.1 Research and Forecast Disclaimer
- 19.2 Data Source and Estimation Limitations
Note: The depth of individual sections depends on data availability for this market. Volume, capacity, trade and other unit-based metrics are included where applicable.

