
Rooftop systems carry demand while utility tenders return
The Canada solar energy market was valued at USD 433.5 million in 2025 and is projected to increase from USD 503.0 million in 2026 to USD 2.09 billion by 2035, registering a CAGR of 17.17% during 2026–2035. Demand comes from federal investment tax credits, a restart of provincial power tenders and steady rooftop and commercial installations by owners who want to cut power bills. Ontario held the largest provincial share, 46.0% in 2025, because the province has the deepest base of distributed systems and the largest pipeline of contracted projects. Quebec is the fastest-growing province at 20.17% a year, as Hydro-Québec moves from almost no installed solar toward a large utility and customer program. On the policy side, the Department of Finance Canada opened consultations in February 2026 on a possible domestic content requirement for the clean technology tax credit, which could shape where developers buy modules.
What solar spending does the estimate include?
The estimate measures the installed value of new solar photovoltaic capacity in Canada each year, including modules, inverters, racking and trackers, balance of system, design, installation and grid connection. It covers utility-scale ground-mounted plants, mid-scale and commercial systems, community projects and household rooftop arrays. Values are stated in USD million at current prices for each calendar year.
The estimate excludes the value of electricity sold by operating plants, standalone battery projects without solar and solar water heating. It also excludes module exports and the resale of used panels. The value chain runs from development and permitting through EPC and installation, grid interconnection and commissioning, and then operations and maintenance.
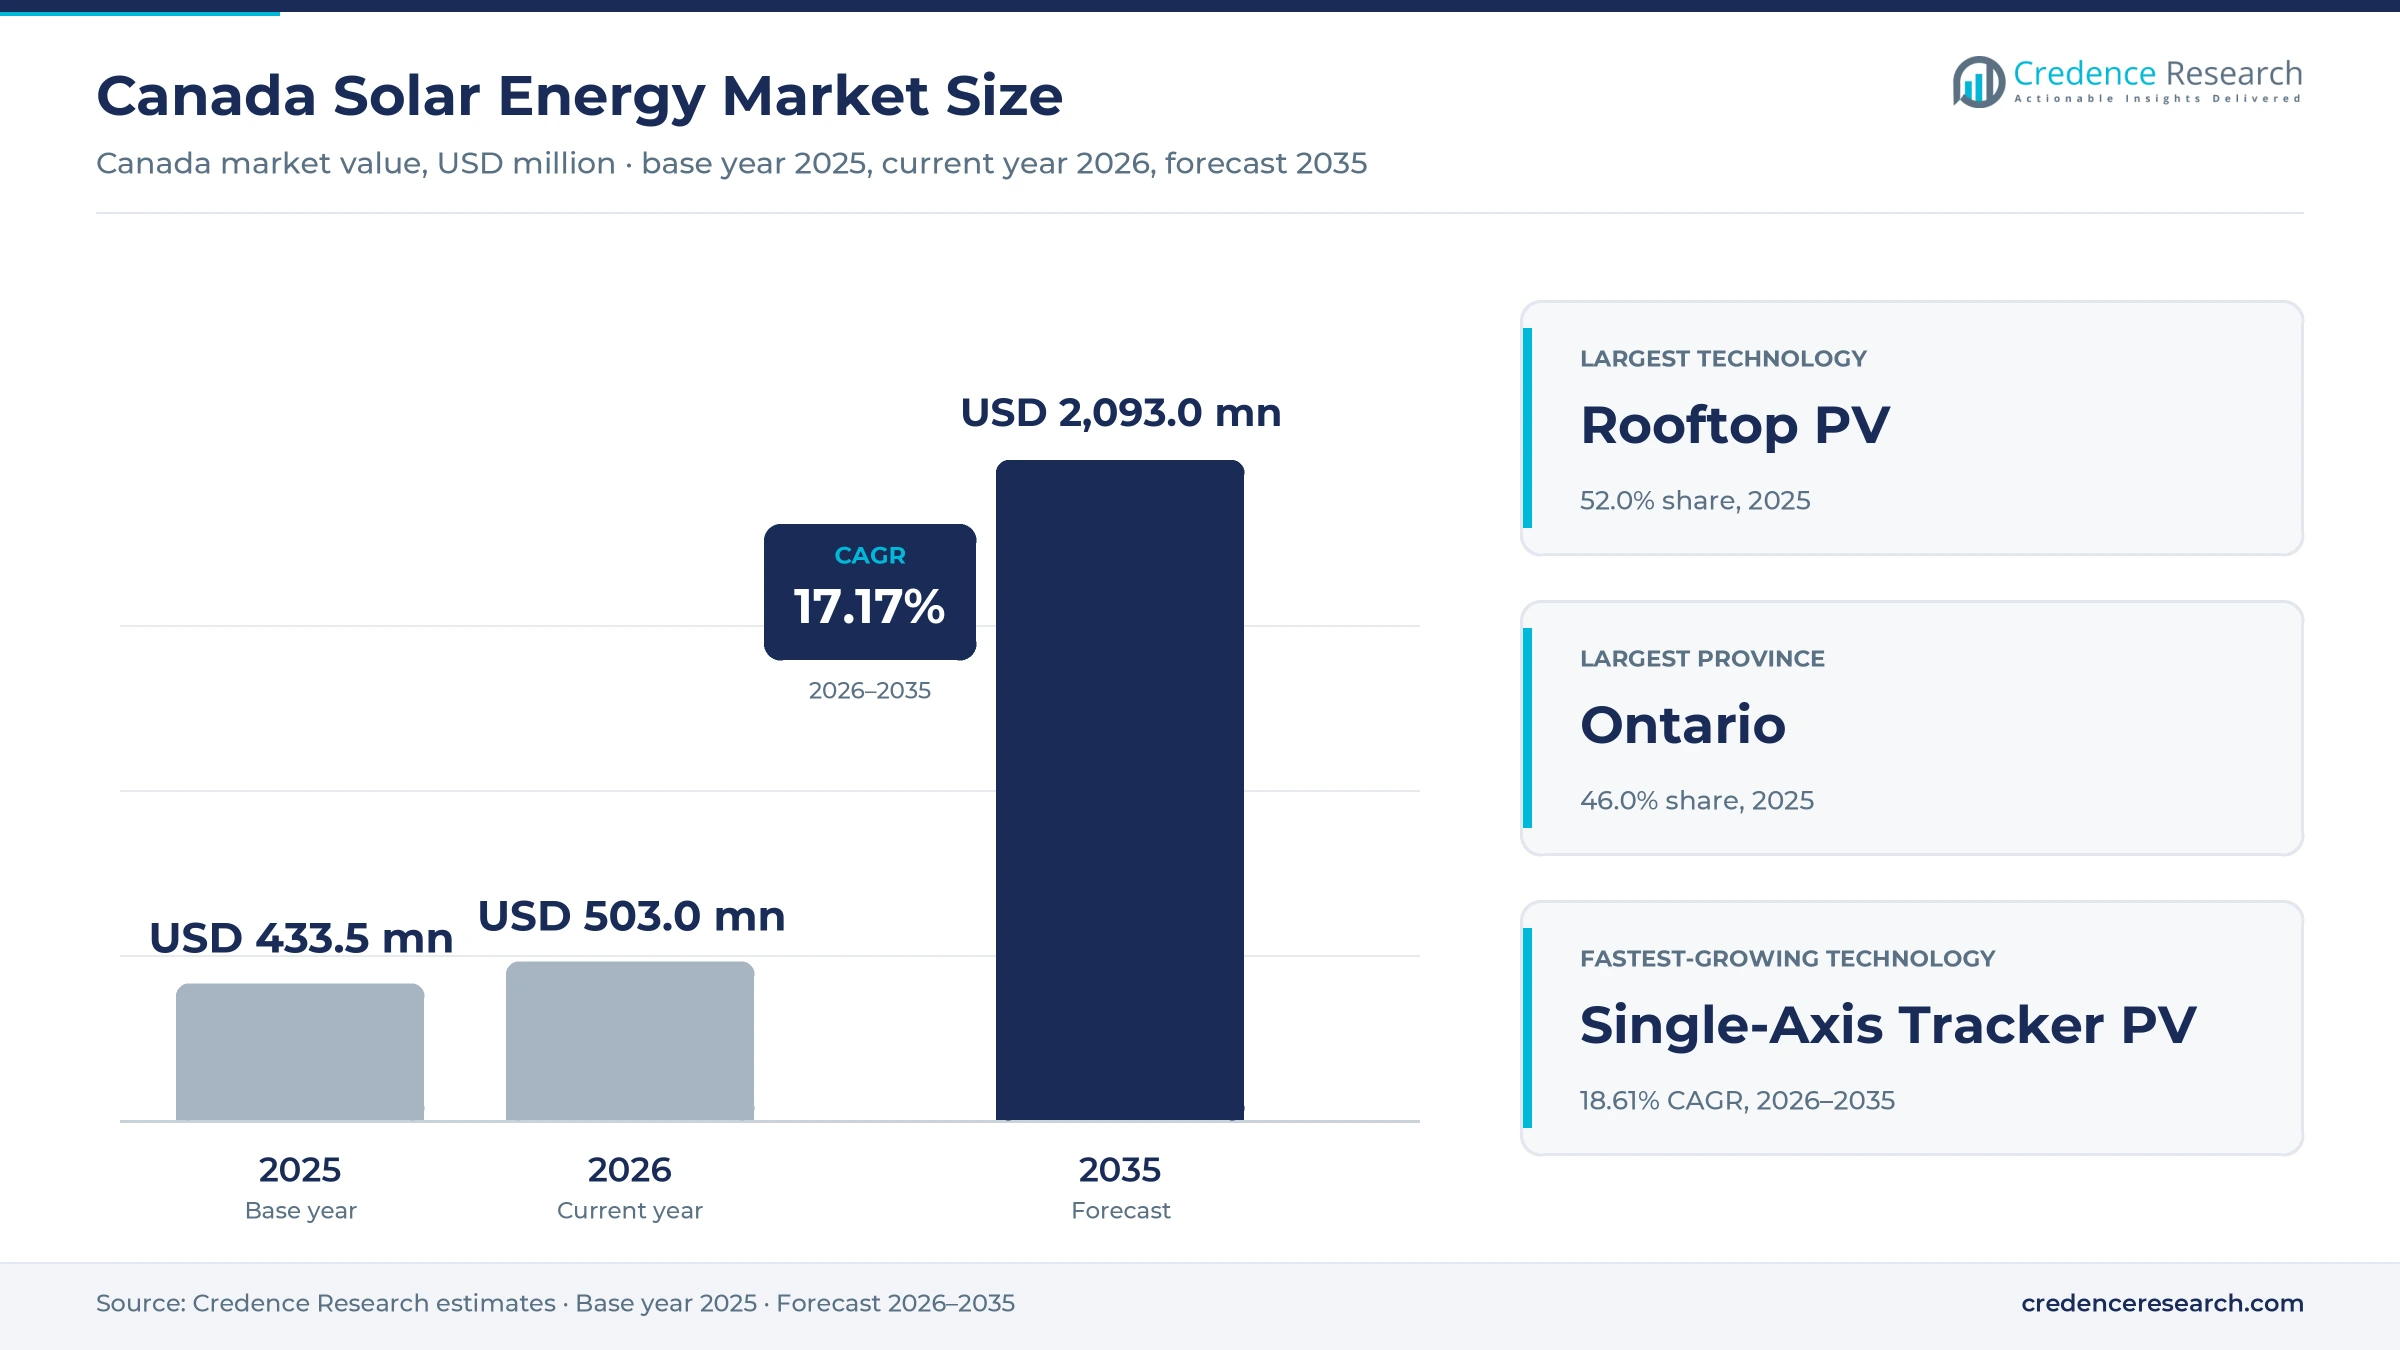
Canada Solar Energy Market Insights
- The market was valued at USD 433.5 million in 2025 and is projected to reach USD 2.09 billion by 2035, registering a CAGR of 17.17% during 2026–2035.
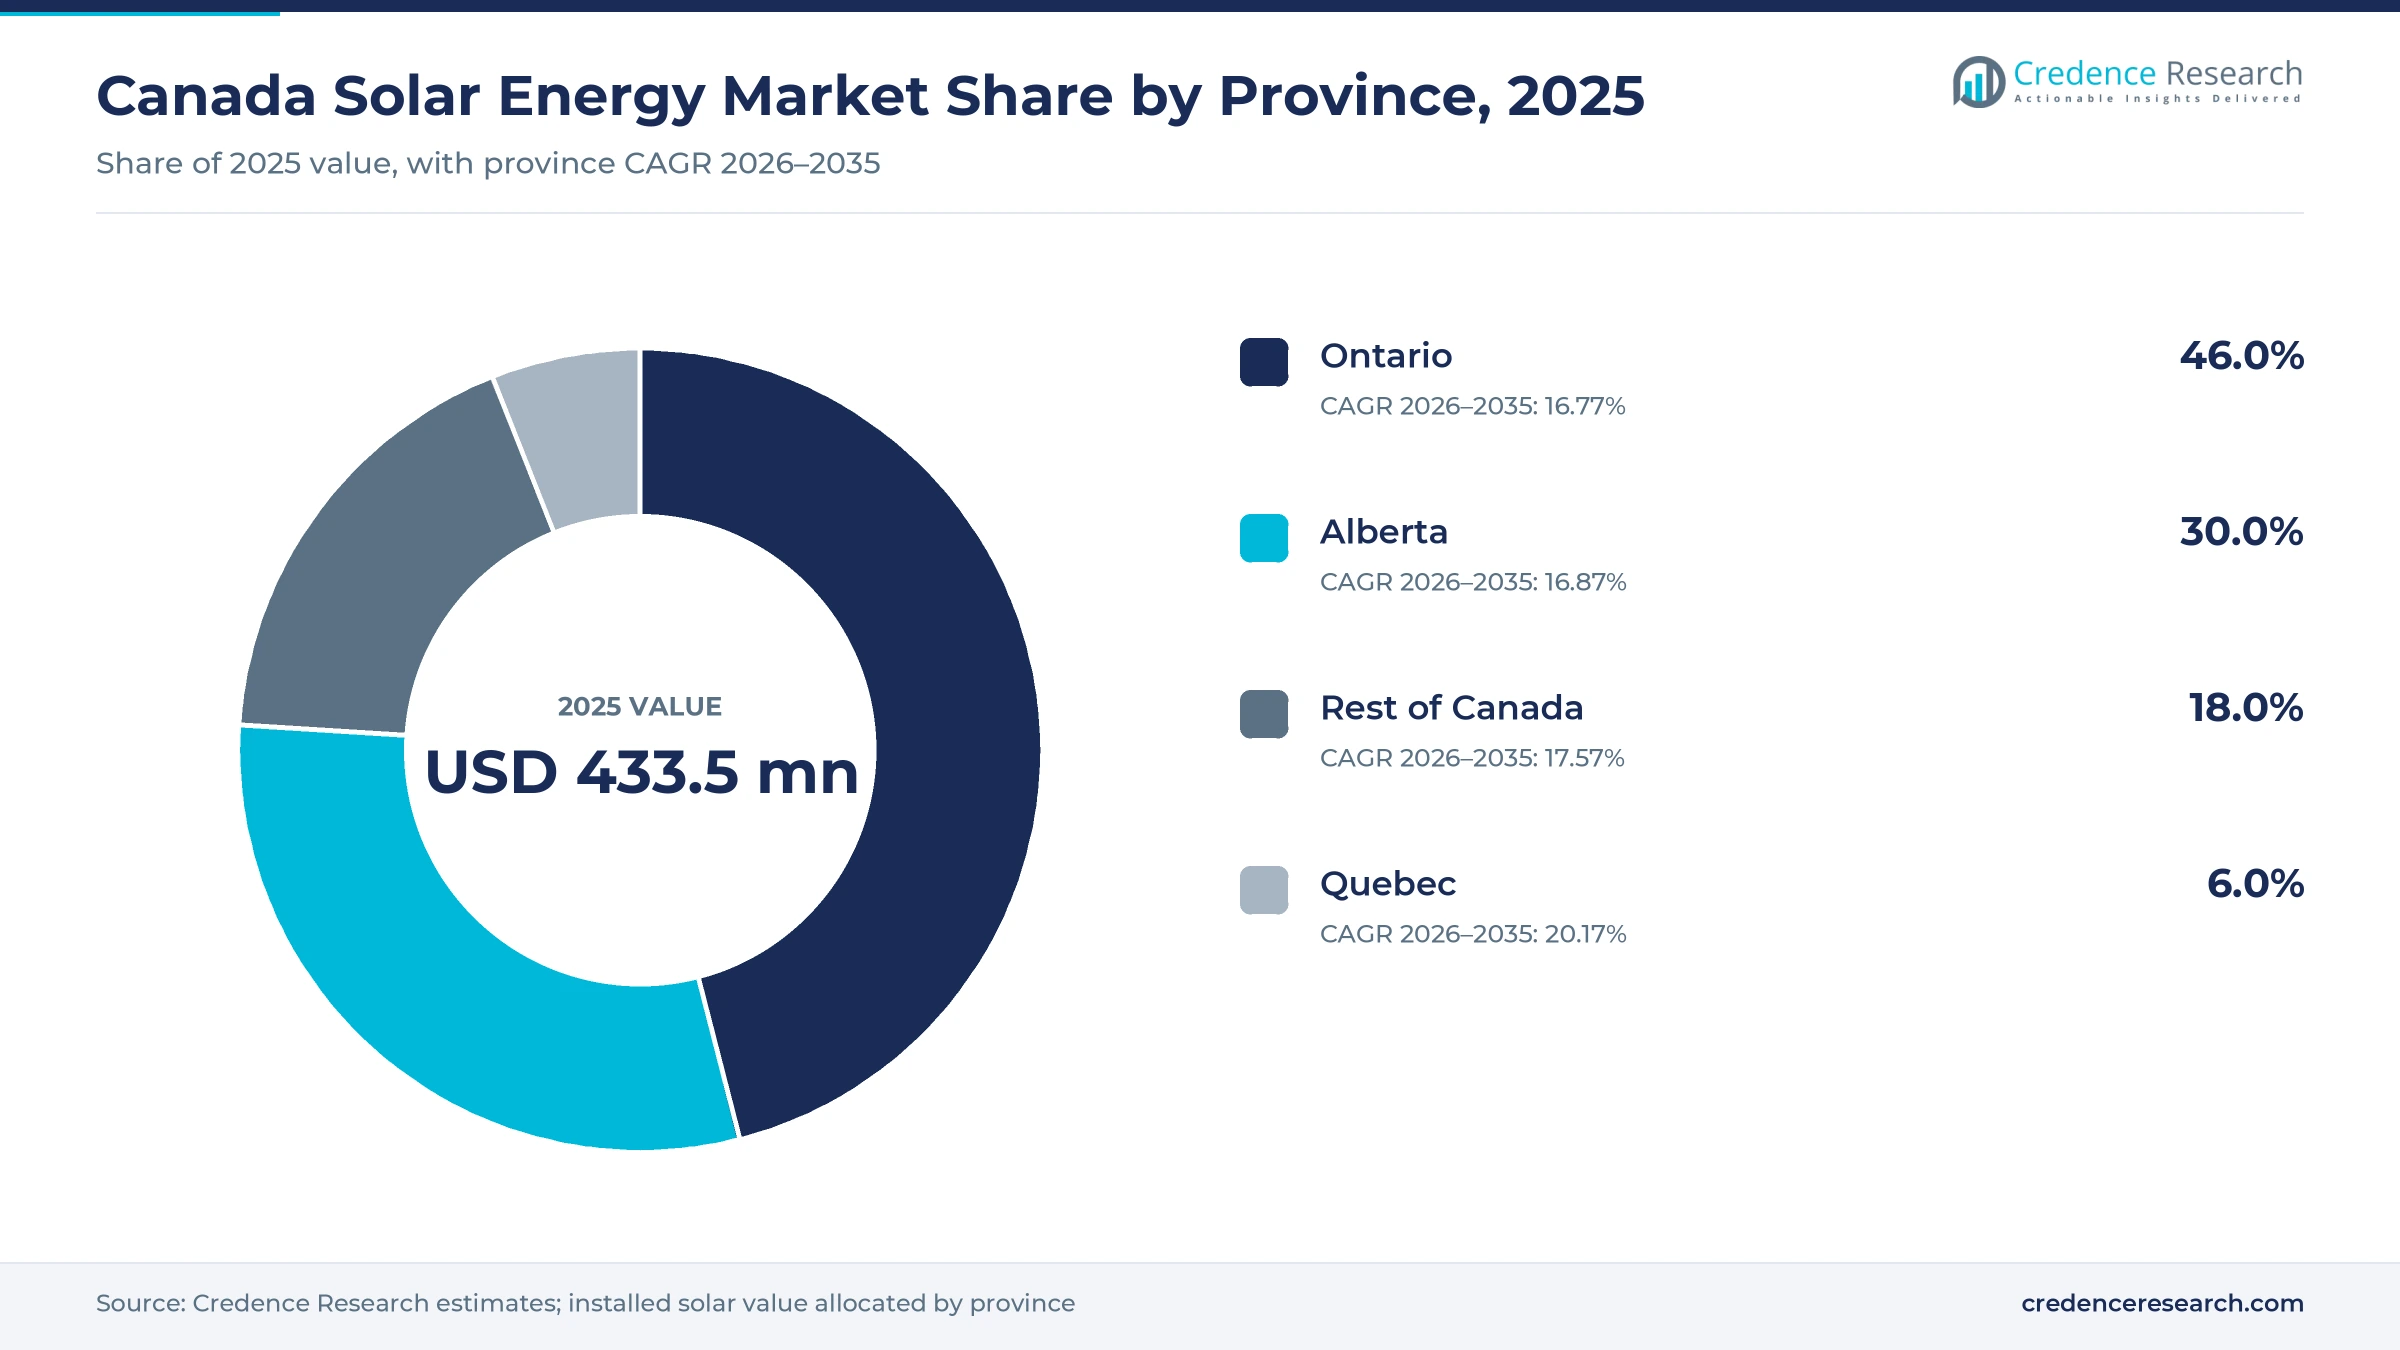
- Ontario held 46.0% of 2025 installed solar value, because the province combines a large rooftop base with the biggest pipeline of contracted plants.
- Rooftop PV led technologies with 52.0% of 2025 value, as utility-scale additions fell to only 57 MW nationwide during 2025.
- Ontario contracted 915.1 MW from 12 solar projects in April 2026 under its LT2 Window 1 procurement, with service expected by May 2030.
- Hydro-Québec launched a 300 MW solar tender in May 2025 and targets 3 GW of solar by 2035, which opens a new provincial market.
Rooftop PV and household owners lead installed value
Why does rooftop PV lead installed value?
Based on technology, the market is categorized into fixed-tilt ground-mounted PV, single-axis tracker PV, rooftop PV and building-integrated PV. Rooftop PV led with 52.0% of 2025 value, because household and commercial arrays kept installing while utility-scale additions paused. Single-Axis Tracker PV grows fastest at 18.61% a year, as new tendered plants in Ontario, Alberta and Quebec use trackers to raise output during long summer days.
Which application gains the most share?
Based on application, the market is categorized into grid supply, behind-the-meter load offset, net-metered self-generation and community solar. Net-Metered Self-Generation led with 38.0% of 2025 value, because homeowners and farms size systems to credit surplus power against their bills. Grid Supply grows fastest at 17.94% a year, as provincial tenders award long-term contracts for large plants that sell power directly to the grid.
Who buys most solar capacity in Canada?
Based on end user, the market is categorized into utilities and IPPs, commercial property owners, industrial facilities and households. Households led with 35.0% of 2025 value, because rebates and net metering made rooftop arrays the most common purchase during a slow utility year. Utilities and IPPs grows fastest at 18.03% a year, as independent producers and their Indigenous partners build contracted plants.
How does project scale shift over the forecast?
Based on project scale, the market is categorized into large utility scale above 20 MW, mid-scale ground mount of 1 to 20 MW, commercial systems of 100 kW to 1 MW and small systems below 100 kW. Small Systems below 100 kW led with 34.0% of 2025 value, because rooftop installs carried the year. Large Utility Scale above 20 MW grows fastest at 18.12% a year, as tendered plants reach construction.
| Segment Group | Leading Sub-segment | Share, 2025 | Fastest-growing Sub-segment | CAGR, 2026–2035 |
|---|---|---|---|---|
| By Technology | Rooftop PV | 52.0% | Single-Axis Tracker PV | 18.61% |
| By Application | Net-Metered Self-Generation | 38.0% | Grid Supply | 17.94% |
| By End User | Households | 35.0% | Utilities and IPPs | 18.03% |
| By Project Scale | Small Systems below 100 kW | 34.0% | Large Utility Scale above 20 MW | 18.12% |
Request a Free Sample
Fill in your details and we'll send you a free sample report.
- Sample data tables & charts
- Research methodology
Tax credits and provincial tenders restart utility builds
How do federal tax credits lower project hurdle rates?
Federal capital incentives lower project hurdle rates, because a refundable credit cuts the upfront cost that developers must finance before a plant earns revenue. The clean technology investment tax credit covers up to 30% of eligible investment in solar energy systems and stationary storage, according to the Department of Finance Canada. A separate clean electricity credit of up to 15% covers low-emitting generation, storage and interprovincial transmission once its enabling law takes effect. On Feb. 13, 2026, the department also opened consultations on a possible domestic content rule, with comments due by March 13, 2026. As a result, single-axis tracker PV grows at 18.61% a year, the fastest technology in this report.
How do provincial tenders restart utility-scale demand?
Provincial procurement restarts utility-scale demand, because long-term contracts give developers the revenue certainty that lenders require. In April 2026, the Independent Electricity System Operator contracted 1,315.10 MW across 14 projects in its LT2 Window 1, including 915.10 MW from 12 solar projects, according to IESO results. The weighted average solar price was about $86.71 per MWh, and every project has an Indigenous equity partnership. Hydro-Québec also launched a 300 MW solar tender in May 2025 as part of its goal of 3 GW of solar by 2035. In turn, utilities and IPPs grow at 18.03% a year, the fastest end user in this report.
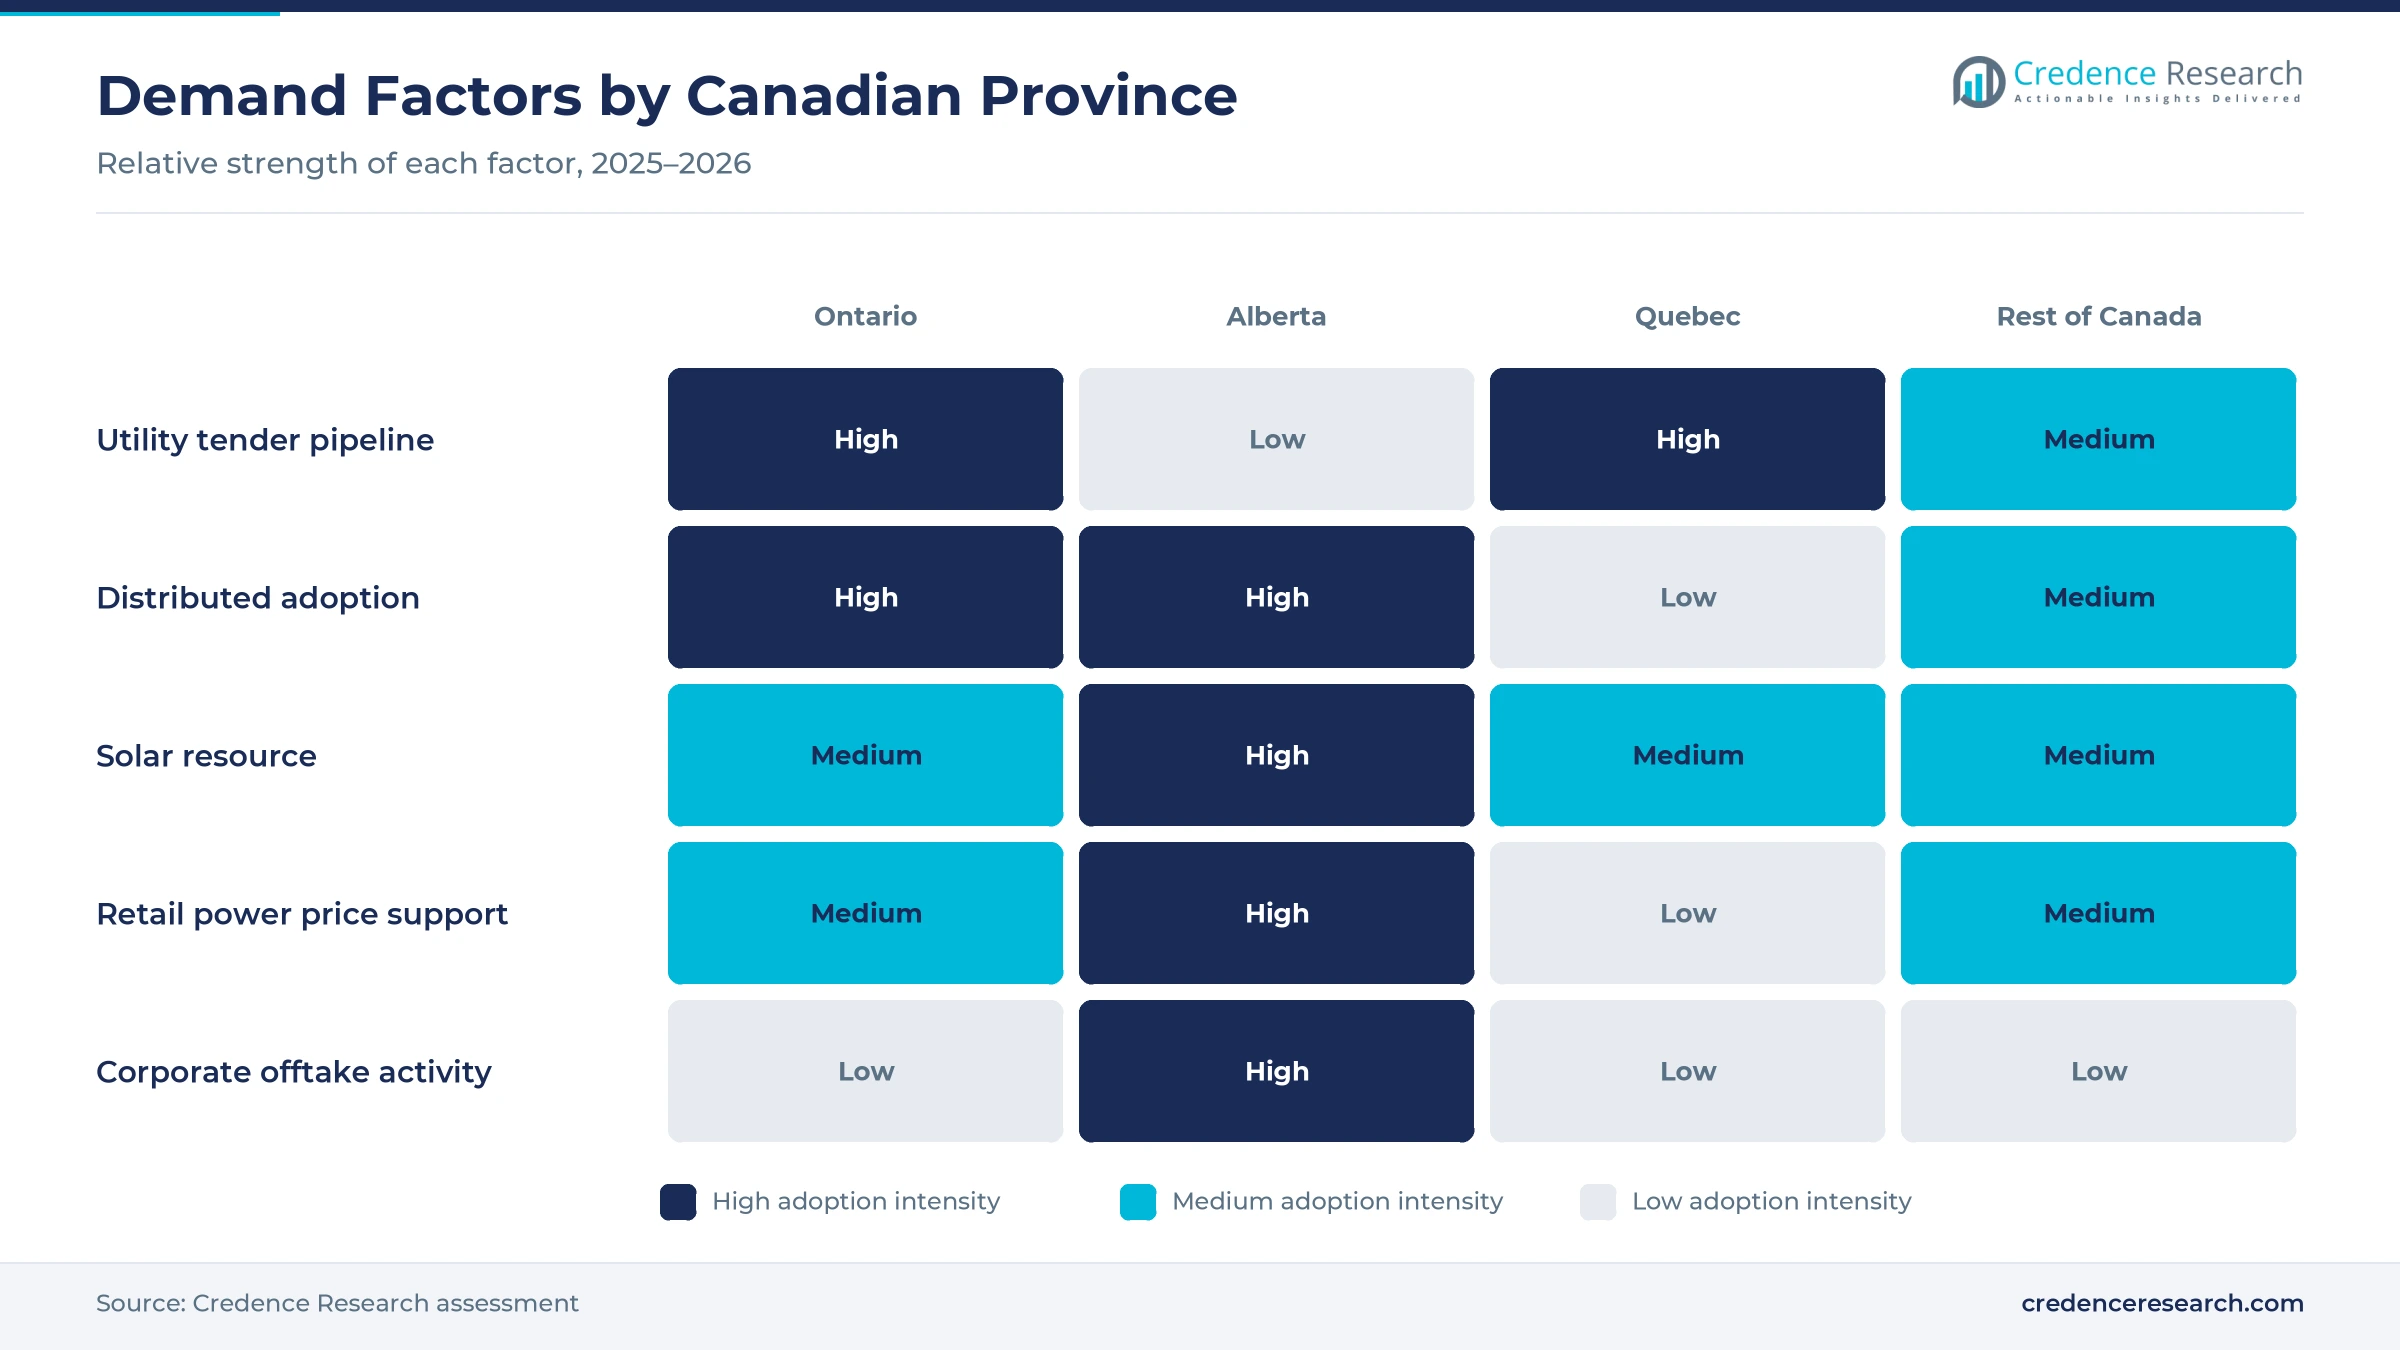
Why does behind-the-meter adoption sustain installers?
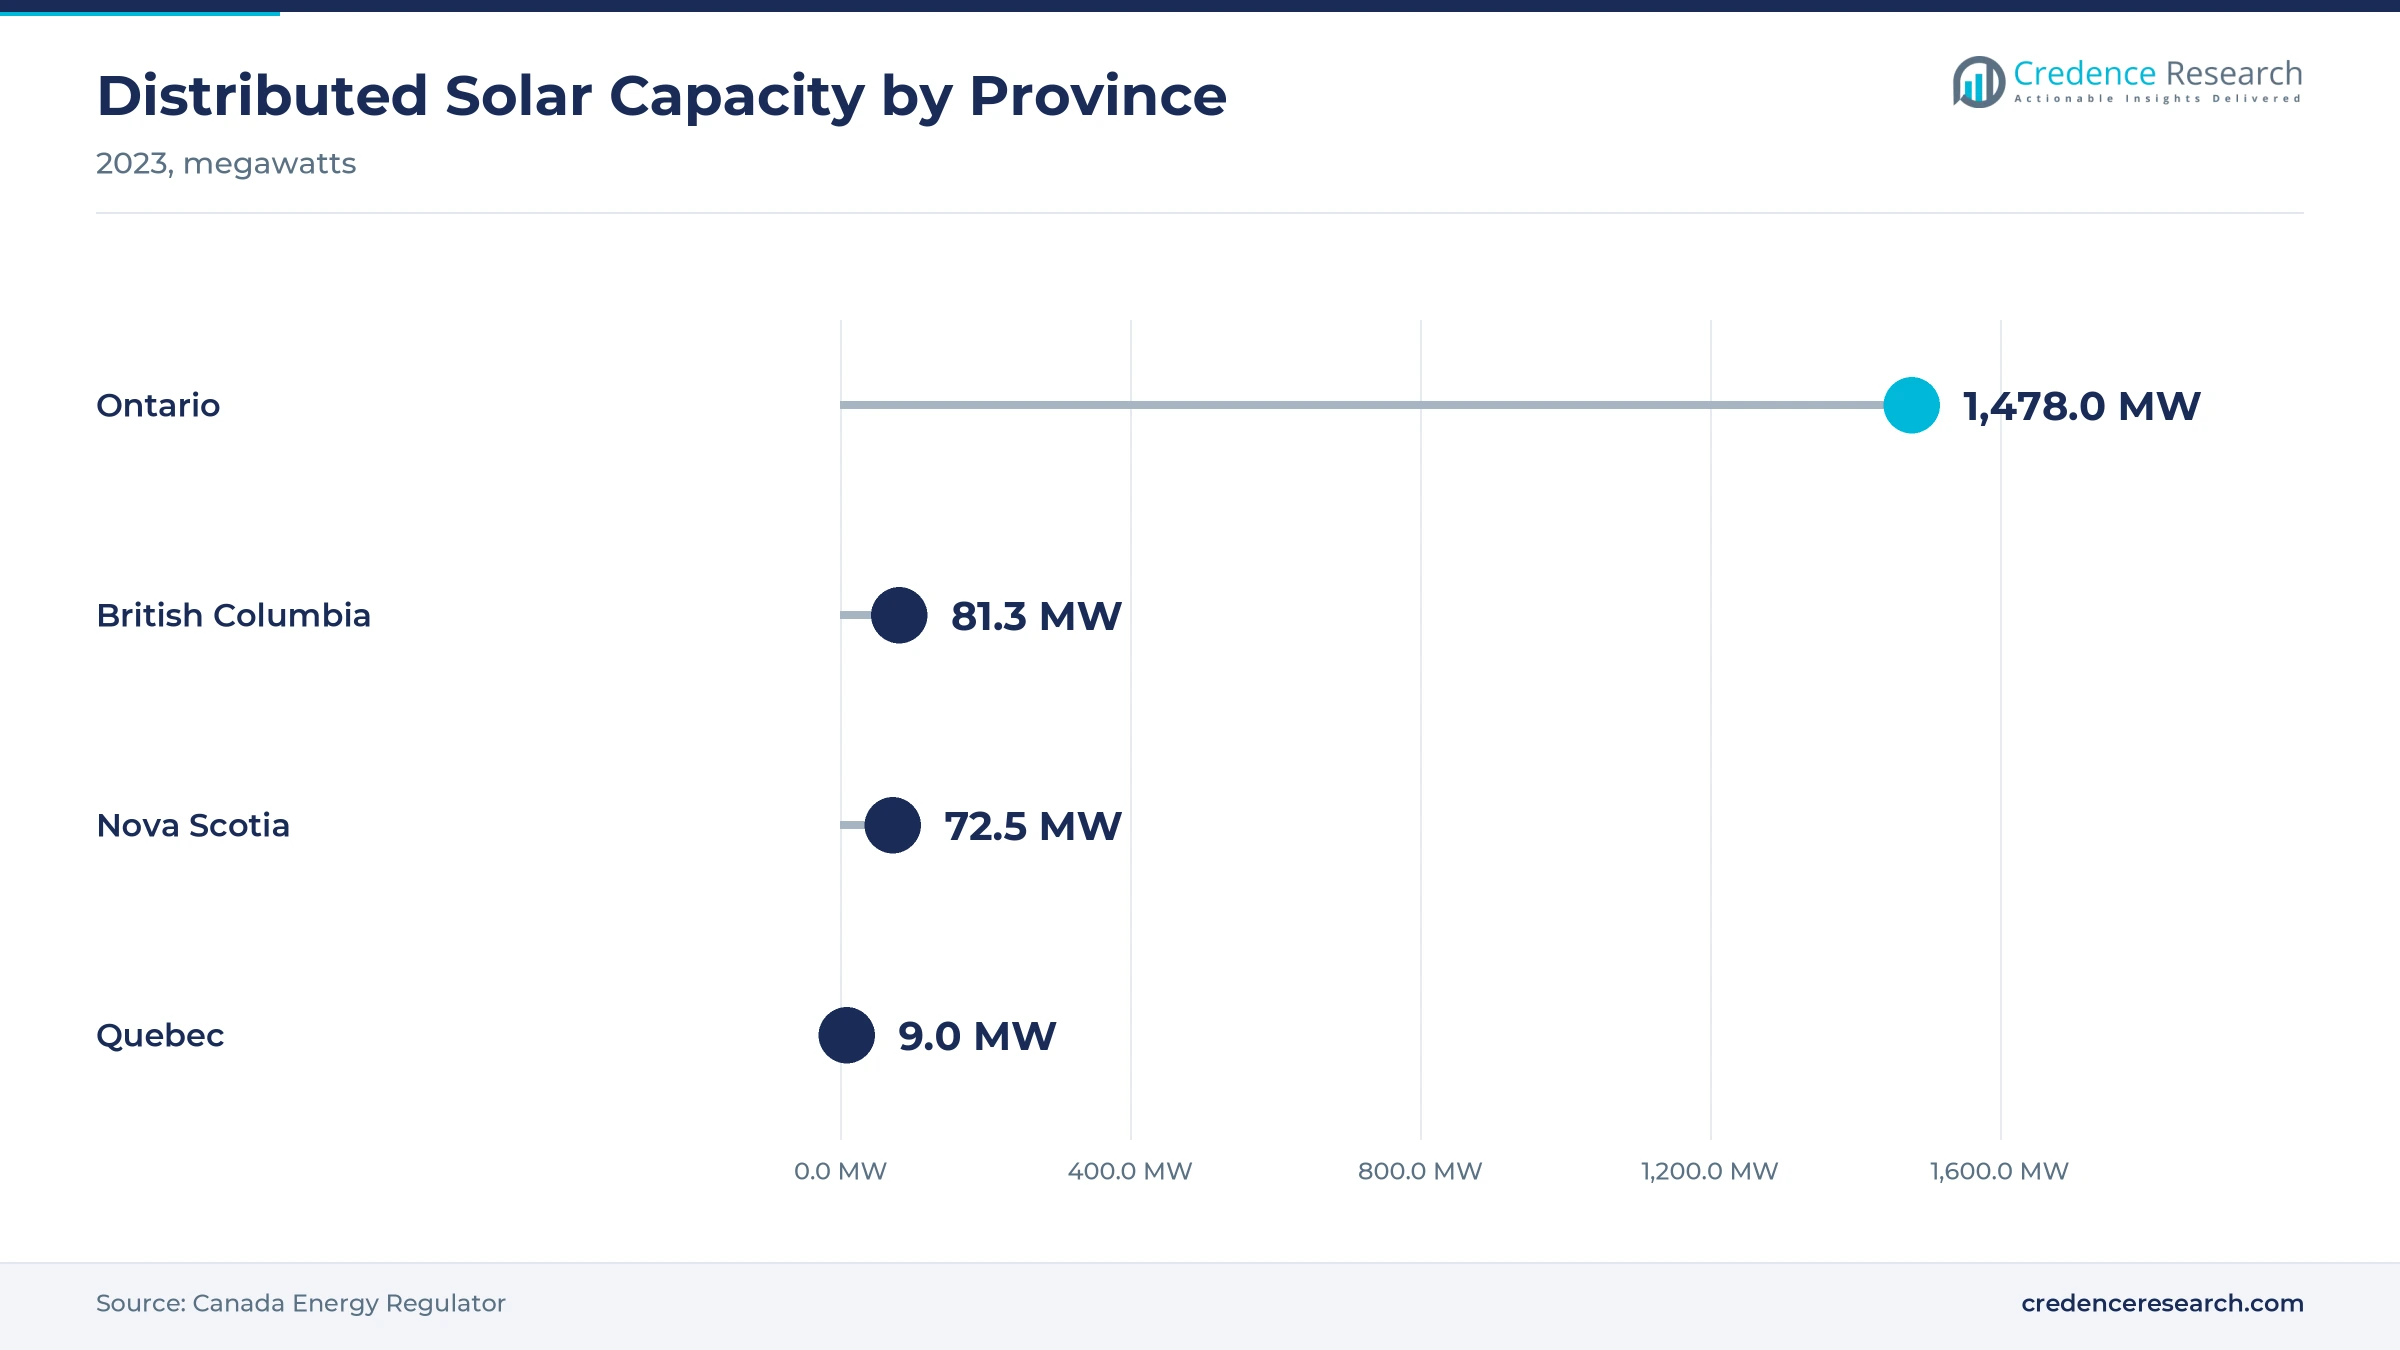
Behind-the-meter adoption sustains distributed throughput, because homeowners and businesses keep installing when utility tenders pause. Canada added only 57 MW of utility-scale solar in 2025, while Alberta alone reported about 100 MW of behind-the-meter installations, according to CanREA data reported by pv magazine. Ontario launched its Home Renovation Savings Program on Jan. 28, 2025, with rebates of up to 30% for rooftop solar and batteries, capped at CAD 10,000. Ontario also had 1,478 MW of distributed solar capacity in 2023, within the largest provincial wind and solar fleet. As a result, rooftop PV held 52.0% of 2025 value, the largest technology share.
How does Alberta's open market support new plants?
Alberta's open power market supports new plants, because developers can sign corporate power purchase agreements without waiting for a provincial tender. Provincial solar capacity reached 1,421 MW, and the 465 MW Travers Solar Project became the largest solar installation in Canada, according to the Canada Energy Regulator. Alberta microgeneration capacity also rose to 335 MW by August 2025 from 258 MW a year earlier, with solar making up almost all of it. The province completed its full exit from coal-fired power in 2024, which leaves more room for new supply. Therefore, Alberta held 30.0% of 2025 installed value, the second-largest provincial share.
Batteries, Indigenous equity and trackers reshape projects
How is battery pairing shifting solar project design?
Battery pairing is shifting solar project design, because storage lets owners move midday output into evening peaks when power is worth more. Canada's utility-scale storage fleet was nearing 1 GW by the end of 2025, and distributors reported more battery sales with solar than they expected. Ontario's rebate covers rooftop solar and batteries together, which pushes households toward hybrid systems. CanREA counts about 25 GW of operating solar, wind and storage, with renewables meeting 9.7% of total electricity demand. Non-hydro renewables also supplied 7.9% of electricity production in 2021, up from 7.0% in 2016, according to World Bank data. As a result, installers increasingly quote battery energy storage with every new array, which lifts the average value of each project.
Why is Indigenous equity rising in new solar contracts?
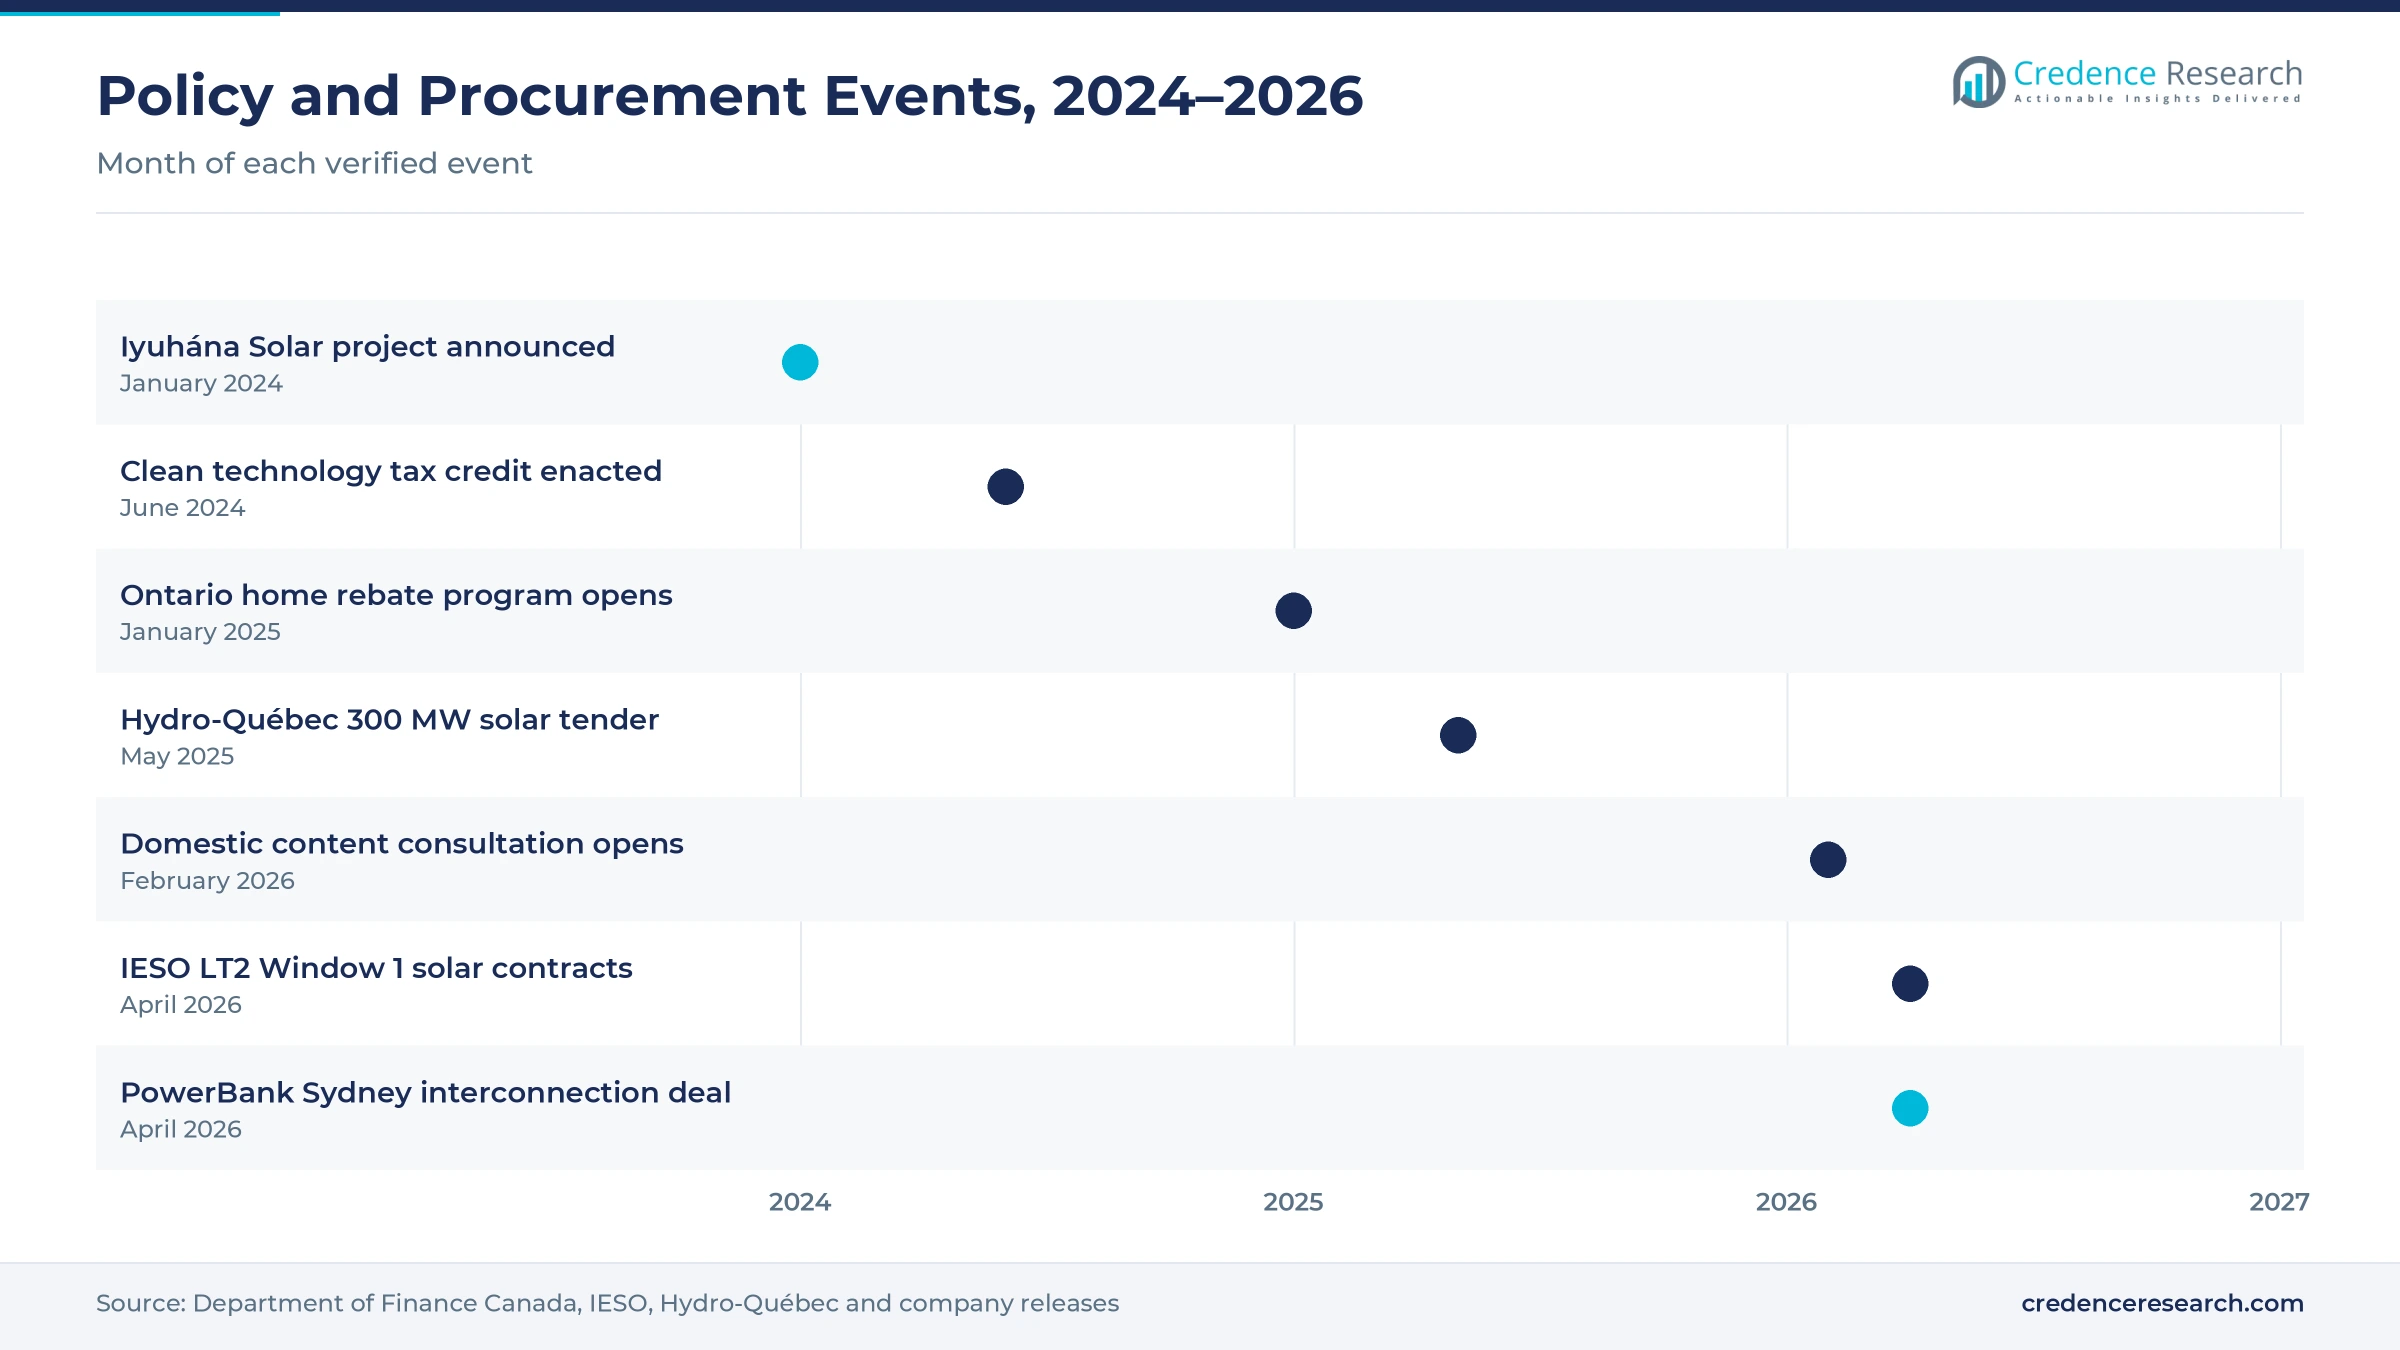
Indigenous equity is rising in new solar contracts, because almost every major 2025 procurement in Canada set participation or ownership criteria or incentives. All 14 projects in Ontario's LT2 Window 1 carry an Indigenous equity partnership of about 50% to 51%. In January 2024, Greenwood Sustainable Infrastructure announced the 100 MW Iyuhána Solar project in Saskatchewan with Ocean Man First Nation, under a 25-year agreement with SaskPower, with commercial operation expected in December 2026. A 32 MW Indigenous-owned solar site in Saskatchewan was also among the 2025 examples. Therefore, partnership structure now shapes which developers win tenders across the country.
Can single-axis trackers open a utility-scale opening?
Single-axis trackers offer a clear opening, because tendered plants in southern Ontario, Alberta and Quebec need more energy per hectare to meet contract prices. Ontario's 915.1 MW of new solar contracts and Hydro-Québec's 300 MW tender create a pipeline that did not exist two years ago. About 750 MW of solar has also broken ground and is scheduled to run before 2030. Large utility-scale projects above 20 MW grow at 18.12% a year, the fastest project scale in this report. In turn, suppliers of single-axis trackers and EPC builders with cold-climate experience can capture a growing share of capital spending.
Is there room to grow community solar programs?
Community solar offers an opening, because renters and small businesses without suitable roofs can buy bill credits from a shared array. Community solar grows faster than net-metered self-generation in this report, as more provinces open shared-array programs. On April 30, 2026, PowerBank Corporation signed the interconnection agreement for its 2.43 MW Sydney community project in Nova Scotia, one of four contracts awarded under that province's program. Hydro-Québec also plans 300 MW of distributed solar over ten years, including 125,000 new customer installations. As a result, developers that combine distributed generation sites with simple subscription offers can reach new customer groups.
Low power prices, grid queues and winters slow some builds
How do low power prices limit project returns?
Low power prices limit project returns in provinces where hydroelectric supply keeps retail rates among the lowest in North America. Solar output earns less in these markets, so payback periods for rooftop and commercial systems stretch beyond what many owners accept. As a result, uptake in Quebec, Manitoba and British Columbia stays small without utility programs. Utility tenders and rebates narrow this gap, but they depend on provincial budgets and policy choices.
Why do grid queues and permitting slow builds?
Grid queues and permitting slow builds, because new plants must wait for interconnection studies, environmental review and municipal approval before construction. Ontario's LT2 Window 1 projects are not expected in service until May 2030, which shows how long the path from contract to power can be. Therefore, developers carry costs for several years before revenue starts. Earlier engagement with communities and utilities can shorten these timelines over time.
How do northern winters affect solar output?
Northern winters affect solar output, because short days, snow cover and low sun angles cut generation for several months each year. Owners must plan for lower winter revenue and higher maintenance, such as snow clearing on ground-mounted arrays. In turn, project models need conservative yield estimates that raise the price developers bid in tenders. Bifacial modules and steeper tilt angles help, because reflected light from snow adds some winter output.
Why does trade policy create module cost risk?
Trade policy creates module cost risk, because most photovoltaic modules and many components installed in Canada are imported. A possible domestic content requirement for the federal tax credits, now under consultation, could change which equipment qualifies for the full credit. As a result, developers face uncertainty when they lock in supply contracts for projects that will be built years later. Clear rules and lead times would help buyers plan purchases.
Ontario leads while Quebec grows fastest from a small base
| Province | Value, 2025 (USD million) | Share, 2025 | CAGR, 2026–2035 |
|---|---|---|---|
| Ontario | 199.4 | 46.0% | 16.77% |
| Alberta | 130.1 | 30.0% | 16.87% |
| Rest of Canada | 78.0 | 18.0% | 17.57% |
| Quebec | 26.0 | 6.0% | 20.17% |
Why does Ontario lead installed solar value?
Ontario held 46.0% of 2025 value and grows at 16.77% a year, supported by the country's largest distributed base and a new wave of contracted plants. Wind and solar made up 13.2% and 5.3% of Ontario's installed capacity in 2023, giving the province the largest installed wind and solar fleet in Canada. Its LT2 Window 1 results added 12 solar contracts in April 2026. As a result, Ontario remains the main market for both rooftop installers and utility-scale builders.
How does Alberta keep its utility-scale lead?
Alberta held 30.0% of 2025 value and grows at 16.87% a year, supported by strong sunshine in the south and a deregulated power market. Developers sign corporate offtake agreements directly with buyers, and the Travers project shows how large single sites can be. BluEarth Renewables also acquired Alberta solar projects from Canadian Solar to grow its provincial fleet. However, changes to land-use rules and market design could slow new approvals in the coming years.
Why does Quebec grow fastest from a small base?
Quebec held 6.0% of 2025 value and grows at 20.17% a year, the fastest pace among the provinces in this report. Installed solar capacity in Quebec was only 12 MW, so new utility programs change the market quickly. Hydro-Québec launched a 300 MW tender in May 2025 and plans 300 MW of customer-sited solar over ten years. In turn, Quebec moves from a hydro-only system toward a mix that adds solar for summer and daytime demand.
What drives demand in the rest of Canada?
The rest of Canada held 18.0% of 2025 value and grows at 17.57% a year, led by Saskatchewan, British Columbia and Nova Scotia. SaskPower contracts such as the 100 MW Iyuhána project add utility-scale demand, while British Columbia had 81.3 MW of distributed solar in 2023. Nova Scotia adds community projects, and remote northern communities use solar to cut diesel use. Therefore, the smaller provinces add steady demand through targeted utility and community programs.
Tenders, tax credits and new projects mark 2024 to 2026
| Development | Status and market relevance |
|---|---|
| In June 2024, Bill C-59 received royal assent and enacted the federal clean technology investment tax credit of up to 30%. | Lowers the upfront cost of solar and storage projects acquired through 2033 |
| In January 2025, Ontario launched its Home Renovation Savings Program with rebates of up to 30% for rooftop solar and batteries. | Supports household and small business demand for rooftop systems |
| In May 2025, Hydro-Québec launched a 300 MW solar tender as part of its plan for 3 GW of solar by 2035. | Opens the first large utility-scale solar market in Quebec |
| In April 2026, the IESO contracted 915.10 MW from 12 solar projects in its LT2 Window 1 procurement. | Creates a large pipeline of Ontario plants due in service by May 2030 |
| In April 2026, PowerBank Corporation signed the interconnection agreement for its Sydney community project in Nova Scotia. | Moves a community solar project toward construction under the provincial program |
Trackers, bifacial modules and storage change project design
- Single-axis trackers follow the sun from east to west, which raises annual output for ground-mounted plants and helps them meet tender prices.
- Bifacial modules capture light reflected from snow and ground cover, which adds winter output on open sites across the Prairies and Ontario.
- Hybrid inverters with batteries let homes and businesses store solar power for evening use and backup during outages.
- Remote monitoring platforms track performance, snow losses and faults across many small systems, which cuts maintenance visits for owners.
Need a Custom Version of This Report?
Tailor the scope, geography, or segments to your exact requirements.
- Custom geography or segment scope
- Direct access to our analyst team
Developers, EPC builders and module suppliers compete
Competition in the Canada solar energy market combines independent power producers, EPC builders and module and system suppliers. Developers such as Greenwood Sustainable Infrastructure and BluEarth Renewables compete for tenders and corporate offtake contracts, often with Indigenous partners that hold large equity stakes. Canadian Solar has developed and sold Alberta projects to other owners, while PowerBank Corporation focuses on community and commercial projects in Nova Scotia and other markets. EPC builders that install utility-scale and commercial arrays compete on cold-climate experience, labor availability and schedule control. Rivals compete on bid price, partnership structure, interconnection position, equipment sourcing and the ability to finance projects through long development periods. Module suppliers also watch the federal consultation on domestic content, because qualifying equipment could command a price premium.
Companies profiled and their roles in this market
| Company | Type | Role in the market |
|---|---|---|
| Greenwood Sustainable Infrastructure | Independent power producer | Developing the 100 MW Iyuhána Solar project with Ocean Man First Nation for SaskPower |
| BluEarth Renewables | Independent power producer | Acquired Alberta solar projects from Canadian Solar to grow its provincial fleet |
| Canadian Solar Inc. | Module supplier and developer | Developed Alberta solar projects and sold them to long-term owners |
| PowerBank Corporation | Community and commercial developer | Signed the interconnection agreement for the Sydney community project in Nova Scotia |
Credence Research view on procurement and rooftop demand
Credence Research's view is that Canada solar energy spending will grow strongly as provincial tenders turn into construction and federal tax credits lower the cost of capital. Ontario and Quebec procurements give utility-scale builders a pipeline that was missing in 2025, while rooftop demand keeps installers busy in the meantime. Indigenous equity partnerships have become a standard feature of winning bids. However, long interconnection timelines and possible domestic content rules could delay spending, so developers that secure grid positions and equipment early should gain the most.
How the installed solar value estimate was built
The report uses 2025 as the base year on a calendar basis, with values in USD million at current prices. Market values come from the Credence Research model, which starts from annual solar capacity additions and applies installed cost assumptions by project scale and technology. Provincial, segment and application splits are Credence Research estimates built from capacity, procurement and distributed adoption data. Sources used are World Bank data, Canada Energy Regulator and Department of Finance Canada releases, IESO procurement results, industry association data, trade press and company announcements, and no interviews or surveys were used.
Strong growth through 2035 as tendered projects connect
Canada solar energy spending is expected to reach USD 2.09 billion by 2035, a 17.17% CAGR during 2026–2035, as tendered plants are built and rooftop adoption continues. Growth should rise sharply after 2027 as Ontario and Quebec contracts move into construction ahead of their in-service dates. After that, Hydro-Québec's customer-sited program and new provincial calls should add further demand. Faster grid connections and stable tax credits would lift this outlook, while delays or trade restrictions would lower it.
Frequently Asked Questions
How big is the Canada solar energy market?
Which province leads solar spending?
Which province grows fastest?
Which technology holds the largest share?
How much utility-scale solar did Canada add in 2025?
What federal incentive supports solar projects?
Who are the leading solar companies in Canada?
What did Ontario procure in its LT2 Window 1?
Table of Content
Chapter 1 Market Segmentation
- 1.1 Segmentation Framework
- 1.1.1 Product and Service Classification
- 1.1.2 Application and End-Use Classification
- 1.1.3 Technology and Solution Classification
- 1.1.4 Customer and Distribution Channel Classification
- 1.1.5 Geographic Segmentation
- 1.1.6 Market Segment Definitions and Boundaries
- 1.2 By Technology
- 1.2.1 Rooftop PV
- 1.2.2 Fixed-Tilt Ground-Mounted PV
- 1.2.3 Single-Axis Tracker PV
- 1.2.4 Building-Integrated PV
- 1.3 By Application
- 1.3.1 Net-Metered Self-Generation
- 1.3.2 Grid Supply
- 1.3.3 Behind-the-Meter Load Offset
- 1.3.4 Community Solar
- 1.4 By End User
- 1.4.1 Households
- 1.4.2 Utilities and IPPs
- 1.4.3 Commercial Property Owners
- 1.4.4 Industrial Facilities
- 1.5 By Project Scale
- 1.5.1 Small Systems below 100 kW
- 1.5.2 Large Utility Scale above 20 MW
- 1.5.3 Commercial Systems 100 kW-1 MW
- 1.5.4 Mid-Scale Ground Mount 1-20 MW
- 1.6 By Province
- 1.6.1 Ontario
- 1.6.2 Alberta
- 1.6.3 Quebec
- 1.6.4 Rest of Canada
Chapter 2 Introduction
- 2.1 Report Objectives and Scope
- 2.2 Product Definition and Industry Terminology
- 2.3 Market Inclusions and Exclusions
- 2.4 Research Process
- 2.4.1 Primary Research and Expert Interviews
- 2.4.2 Secondary Research and Source Review
- 2.4.3 Top-Down and Bottom-Up Estimation
- 2.4.4 Data Triangulation and Verification
- 2.5 Market Size Measurement Basis
- 2.5.1 2025: USD 433.5 million → 2035: USD 2.09 billion
- 2.6 Historical and Forecast Reference Periods
- 2.6.1 Historical Period: 2018-2025
- 2.6.2 Base Year: 2025
- 2.6.3 Forecast Period: 2025-2035
- 2.7 Research Assumptions and Limitations
Chapter 3 Executive Summary
- 3.1 Market Snapshot and Key Findings
- 3.2 Base-Year Market Size, 2025
- 3.3 Forecast Market Size, 2035
- 3.4 Revenue and Volume Growth Outlook
- 3.5 Key Demand and Supply Indicators
- 3.6 Leading Market Segments
- 3.7 Fastest-Growing Market Opportunities
- 3.8 Regional Performance Highlights
- 3.9 Technology and Industry Transformation
- 3.10 Competitive Landscape Summary
- 3.11 Analyst View and Strategic Implications
Chapter 4 Canada Solar Energy Market Trends and Developments
- 4.1 Historical Industry Development, 2018-2025
- 4.2 Recent Market Trends and Developments
- 4.3 Demand and Customer Behavior Trends
- 4.4 Technology and Product Innovation
- 4.5 Artificial Intelligence, Automation and Digitalization
- 4.6 Local Manufacturing and Supply Chain Realignment
- 4.7 Industry Partnerships, Mergers and Acquisitions
- 4.8 Sustainability and Circular Economy Developments
- 4.9 Government and Private Sector Investment Trends
- 4.10 Emerging Business Models and Commercialization
- 4.11 Industry Developments and Announcements
Chapter 5 Canada Solar Energy Market Production, Supply and Demand Analysis
- 5.1 Demand Trend and Consumption Analysis, 2018-2025
- 5.2 Demand Forecast, 2025-2035
- 5.3 Production and Output Trend, 2018-2025
- 5.4 Production and Output Forecast, 2025-2035
- 5.5 Installed Capacity and Capacity Utilization
- 5.6 Company-Wise Production Plants and Statistics
- 5.6.1 Installed Production Capacity
- 5.6.2 Actual Production
- 5.6.3 Planned Capacity and Expansion Targets
- 5.7 Supply Chain Structure and Procurement Trends
- 5.8 Supply-Demand Gap and Bottlenecks
- 5.9 Import Dependence and Sourcing Structure
- 5.10 Contract Manufacturing and Outsourcing
- 5.11 Regional Supply and Demand Concentration
Chapter 6 Canada Solar Energy Market Pricing Analysis
- 6.1 Pricing Structure and Measurement
- 6.2 Historical Pricing Trends, 2018-2025
- 6.3 Pricing Outlook, 2025-2035
- 6.4 Average Selling Price and Unit Economics
- 6.5 Pricing by Product and Market Segment
- 6.6 Geographic Pricing Differences
- 6.7 Key Input, Energy, Labor and Logistics Costs
- 6.8 Contract Pricing and Purchasing Models
- 6.9 Pricing Sensitivity and Competitive Positioning
- 6.10 Price, Margin and Profitability Implications
Chapter 7 Canada Solar Energy Market Dynamics
- 7.1 Market Growth Drivers
- 7.1.1 Demand-Side Drivers
- 7.1.2 Technology and Innovation Drivers
- 7.1.3 Infrastructure and Investment Drivers
- 7.1.4 Regulatory and Policy Drivers
- 7.2 Market Restraints
- 7.2.1 Cost and Affordability Constraints
- 7.2.2 Technology and Adoption Barriers
- 7.2.3 Supply Chain and Operational Constraints
- 7.3 Market Challenges
- 7.3.1 Competitive Pressure and Margin Erosion
- 7.3.2 Skills, Infrastructure and Implementation Gaps
- 7.4 Emerging Market Opportunities
- 7.5 Market Dynamics Impact and Time-Horizon Assessment
Chapter 8 Canada Solar Energy Value Chain Analysis
- 8.1 Industry Value Chain Overview
- 8.2 Upstream Suppliers and Critical Inputs
- 8.3 Technology and Component Providers
- 8.4 Manufacturing or Service Delivery
- 8.5 Distribution, Channel Partners and Integrators
- 8.6 Downstream Applications and End Users
- 8.7 Value Addition and Profit Pools
- 8.8 Vertical Integration and Outsourcing
- 8.9 Supplier Concentration and Risk
- 8.10 Supply Chain Localization and Resilience
Chapter 9 Canada Solar Energy Market Regulations and Policies
- 9.1 Relevant Laws, Standards and Compliance Frameworks
- 9.2 Product, Service, Safety and Quality Requirements
- 9.3 Government Policies, Incentives and Subsidies
- 9.4 Imports, Exports and Trade Barriers
- 9.5 Public Procurement and Local Content Requirements
- 9.6 Environmental and Sustainability Compliance
- 9.7 Upcoming Policy Changes and Market Implications
Chapter 10 Canada Solar Energy Market Hotspots and Opportunities
- 10.1 Market Opportunity Mapping and Growth Hotspots
- 10.2 High-Growth Applications and Customer Groups
- 10.3 Underserved Markets and White-Space Opportunities
- 10.4 Emerging Technology and Product Opportunities
- 10.5 New Capacity and Investment Hotspots
- 10.6 Market Entry and Expansion Opportunities
- 10.7 Distribution and Partnership Opportunities
- 10.8 Near-Term and Long-Term Commercial Potential
- 10.9 Opportunity Attractiveness and Execution Risks
Chapter 11 Canada Solar Energy Market Outlook, 2025-2035
- 11.1 Market Size and Analysis
- 11.1.1 Revenue (Market Measurement: 2025: USD 433.5 million → 2035: USD 2.09 billion)
- 11.1.2 Market Volume and Quantity Sold
- 11.1.3 Historical Market Size, 2018-2025
- 11.1.4 Base-Year Market Size, 2025
- 11.2 Market Forecast, 2025-2035
- 11.2.1 Revenue Forecast to 2035
- 11.2.2 Volume Forecast to 2035
- 11.2.3 CAGR and Year-on-Year Growth
- 11.2.4 Incremental Revenue Opportunity
- 11.3 Forecast Assumptions and Scenario Analysis
- 11.3.1 Base-Case Forecast
- 11.3.2 Optimistic and Conservative Scenarios
- 11.3.3 Technology, Pricing and Policy Sensitivities
- 11.4 Market Attractiveness and Growth Outlook
Chapter 12 Canada Solar Energy Market Segmentation and Outlook
- 12.1 Segmentation Summary and Market Shares, 2025
- 12.2 Largest and Fastest-Growing Segments
- 12.3 By Technology - Market Size and Forecast, 2025-2035
- 12.3.1 Segment Definition and Scope
- 12.3.2 Historical Market Size, 2018-2025
- 12.3.3 Revenue Forecast, 2025-2035
- 12.3.4 Volume Forecast, 2025-2035
- 12.3.5 Base-Year Market Share, 2025
- 12.3.6 Segment CAGR and Growth Drivers
- 12.3.7 Subsegment Market Size and Forecast
- 12.3.7.1 Rooftop PV
- 12.3.7.2 Fixed-Tilt Ground-Mounted PV
- 12.3.7.3 Single-Axis Tracker PV
- 12.3.7.4 Building-Integrated PV
- 12.3.8 Subsegment Pricing and Adoption Trends
- 12.3.9 Leading Suppliers and Competition
- 12.3.10 Regional Demand and Opportunities
- 12.4 By Application - Market Size and Forecast, 2025-2035
- 12.4.1 Segment Definition and Scope
- 12.4.2 Historical Market Size, 2018-2025
- 12.4.3 Revenue Forecast, 2025-2035
- 12.4.4 Volume Forecast, 2025-2035
- 12.4.5 Base-Year Market Share, 2025
- 12.4.6 Segment CAGR and Growth Drivers
- 12.4.7 Subsegment Market Size and Forecast
- 12.4.7.1 Net-Metered Self-Generation
- 12.4.7.2 Grid Supply
- 12.4.7.3 Behind-the-Meter Load Offset
- 12.4.7.4 Community Solar
- 12.4.8 Subsegment Pricing and Adoption Trends
- 12.4.9 Leading Suppliers and Competition
- 12.4.10 Regional Demand and Opportunities
- 12.5 By End User - Market Size and Forecast, 2025-2035
- 12.5.1 Segment Definition and Scope
- 12.5.2 Historical Market Size, 2018-2025
- 12.5.3 Revenue Forecast, 2025-2035
- 12.5.4 Volume Forecast, 2025-2035
- 12.5.5 Base-Year Market Share, 2025
- 12.5.6 Segment CAGR and Growth Drivers
- 12.5.7 Subsegment Market Size and Forecast
- 12.5.7.1 Households
- 12.5.7.2 Utilities and IPPs
- 12.5.7.3 Commercial Property Owners
- 12.5.7.4 Industrial Facilities
- 12.5.8 Subsegment Pricing and Adoption Trends
- 12.5.9 Leading Suppliers and Competition
- 12.5.10 Regional Demand and Opportunities
- 12.6 By Project Scale - Market Size and Forecast, 2025-2035
- 12.6.1 Segment Definition and Scope
- 12.6.2 Historical Market Size, 2018-2025
- 12.6.3 Revenue Forecast, 2025-2035
- 12.6.4 Volume Forecast, 2025-2035
- 12.6.5 Base-Year Market Share, 2025
- 12.6.6 Segment CAGR and Growth Drivers
- 12.6.7 Subsegment Market Size and Forecast
- 12.6.7.1 Small Systems below 100 kW
- 12.6.7.2 Large Utility Scale above 20 MW
- 12.6.7.3 Commercial Systems 100 kW-1 MW
- 12.6.7.4 Mid-Scale Ground Mount 1-20 MW
- 12.6.8 Subsegment Pricing and Adoption Trends
- 12.6.9 Leading Suppliers and Competition
- 12.6.10 Regional Demand and Opportunities
- 12.7 By Province - Market Size and Forecast, 2025-2035
- 12.7.1 Segment Definition and Scope
- 12.7.2 Historical Market Size, 2018-2025
- 12.7.3 Revenue Forecast, 2025-2035
- 12.7.4 Volume Forecast, 2025-2035
- 12.7.5 Base-Year Market Share, 2025
- 12.7.6 Segment CAGR and Growth Drivers
- 12.7.7 Subsegment Market Size and Forecast
- 12.7.7.1 Ontario
- 12.7.7.2 Alberta
- 12.7.7.3 Quebec
- 12.7.7.4 Rest of Canada
- 12.7.8 Subsegment Pricing and Adoption Trends
- 12.7.9 Leading Suppliers and Competition
- 12.7.10 Regional Demand and Opportunities
- 12.8 Segment Growth Comparison
- 12.9 Segment Attractiveness and Priority Matrix
Chapter 13 Canada Solar Energy End-Use and Application Market Outlook
- 13.1 End-Use Industry and Customer Demand Structure
- 13.2 Leading Applications and Customer Groups
- 13.3 End-Use Market Size, Share and Forecast
- 13.4 Major End-Use Industry Deep Dives
- 13.4.1 Customer Requirements and Use Cases
- 13.4.2 Demand and Replacement Cycles
- 13.4.3 Technical and Regulatory Considerations
- 13.4.4 Purchasing and Procurement Models
- 13.4.5 Leading Vendors and Distribution Channels
- 13.4.6 Forecast and Commercial Opportunities
- 13.5 Emerging Applications and Cross-Segment Demand
- 13.6 End-Use Industry Investment Priorities
Chapter 14 Canada Solar Energy Geographic Market Outlook, 2025-2035
- 14.1 Regional Market Size and Country-Level Shares, 2025
- 14.2 Country Market Size Comparison, 2025
- 14.3 Country Market Forecasts, 2025-2035
- 14.4 Subregional Industrial and Demand Clusters
- 14.5 Intra-Regional Pricing and Cost Differences
- 14.6 Cross-Border Trade and Supply Networks
- 14.7 Regional Supply and Demand Balances
- 14.8 Country Opportunity Comparison and Prioritization
Note: Every listed country is covered on the structure shown under the first country.
Chapter 15 Canada Solar Energy Technology, Innovation and Sustainability Outlook
- 15.1 Technology Landscape and Maturity
- 15.2 Product, Process and Service Innovation
- 15.3 AI, Automation and Digital Tools in the Industry
- 15.4 Technology Adoption and Performance Benchmarking
- 15.5 Innovation Pipeline and R&D Investment
- 15.6 Patent and Intellectual Property Trends
- 15.7 Energy Efficiency and Resource Management
- 15.8 Sustainability, Recycling and Circularity
- 15.9 Technology Roadmap, 2025-2035
- 15.10 Risks of Obsolescence and Technology Substitution
Chapter 16 Canada Solar Energy Market Key Strategic Imperatives
- 16.1 Growth and Market Entry Priorities
- 16.2 High-Return Products and Segments
- 16.3 Pricing, Profitability and Cost Optimization
- 16.4 Technology Investment and Product Differentiation
- 16.5 Supply Chain Localization and Resilience
- 16.6 Distribution and Customer Acquisition
- 16.7 Partnership, Acquisition and Capacity Strategy
- 16.8 Regional Expansion Priorities
- 16.9 Short-, Medium- and Long-Term Actions
Chapter 17 Competition Outlook
- 17.1 Industry Competition Characteristics
- 17.2 Market Structure and Concentration
- 17.3 Market Share and Competitive Positioning, 2025
- 17.4 Company-Wise Revenue and Product Benchmarking
- 17.5 Production and Service Capacity Benchmarking
- 17.6 Technology, Pricing and Differentiation
- 17.7 Regional Footprint and Distribution Strength
- 17.8 Mergers, Acquisitions and Strategic Alliances
- 17.9 New Entrants and Competitive Threats
- 17.10 Porter's Five Forces and Industry Attractiveness
- 17.11 Competitive Outlook, 2025-2035
Chapter 18 Company Profiles
- 18.1 Company Coverage and Selection Criteria
- 18.2 PCL Construction
- 18.2.1 Business Description
- 18.2.2 Company Ownership and Geographic Presence
- 18.2.3 Product and Service Portfolio
- 18.2.4 Manufacturing and Operating Footprint
- 18.2.5 Production Capacity and Expansion Plans
- 18.2.6 Financial Performance and Investment
- 18.2.7 Market Share and Competitive Position
- 18.2.8 Technology and Innovation Capabilities
- 18.2.9 Strategic Alliances or Partnerships
- 18.2.10 Recent Developments
- 18.2.11 Growth Strategy and Outlook
- 18.3 Borea Construction ULC
- 18.4 GOLDBECK SOLAR
- 18.5 Canadian Solar Inc.
- 18.6 Potentia Renewables Inc.
- 18.7 BluEarth Renewables
- 18.8 Elemental Energy Renewables Inc.
- 18.9 PowerBank Corporation
- 18.10 Greenwood Sustainable Infrastructure
- 18.11 Amp Energy
- 18.12 Other Relevant Market Participants
Note: Every listed company is profiled on the structure shown under the first company. The company list is preliminary and may change based on research findings, market developments, data availability and client requirements.
Chapter 19 Disclaimer
- 19.1 Research and Forecast Disclaimer
- 19.2 Data Source and Estimation Limitations
Note: The depth of individual sections depends on data availability for this market. Volume, capacity, trade and other unit-based metrics are included where applicable.

