
Efficiency rules and fast hubs reshape Australian charging
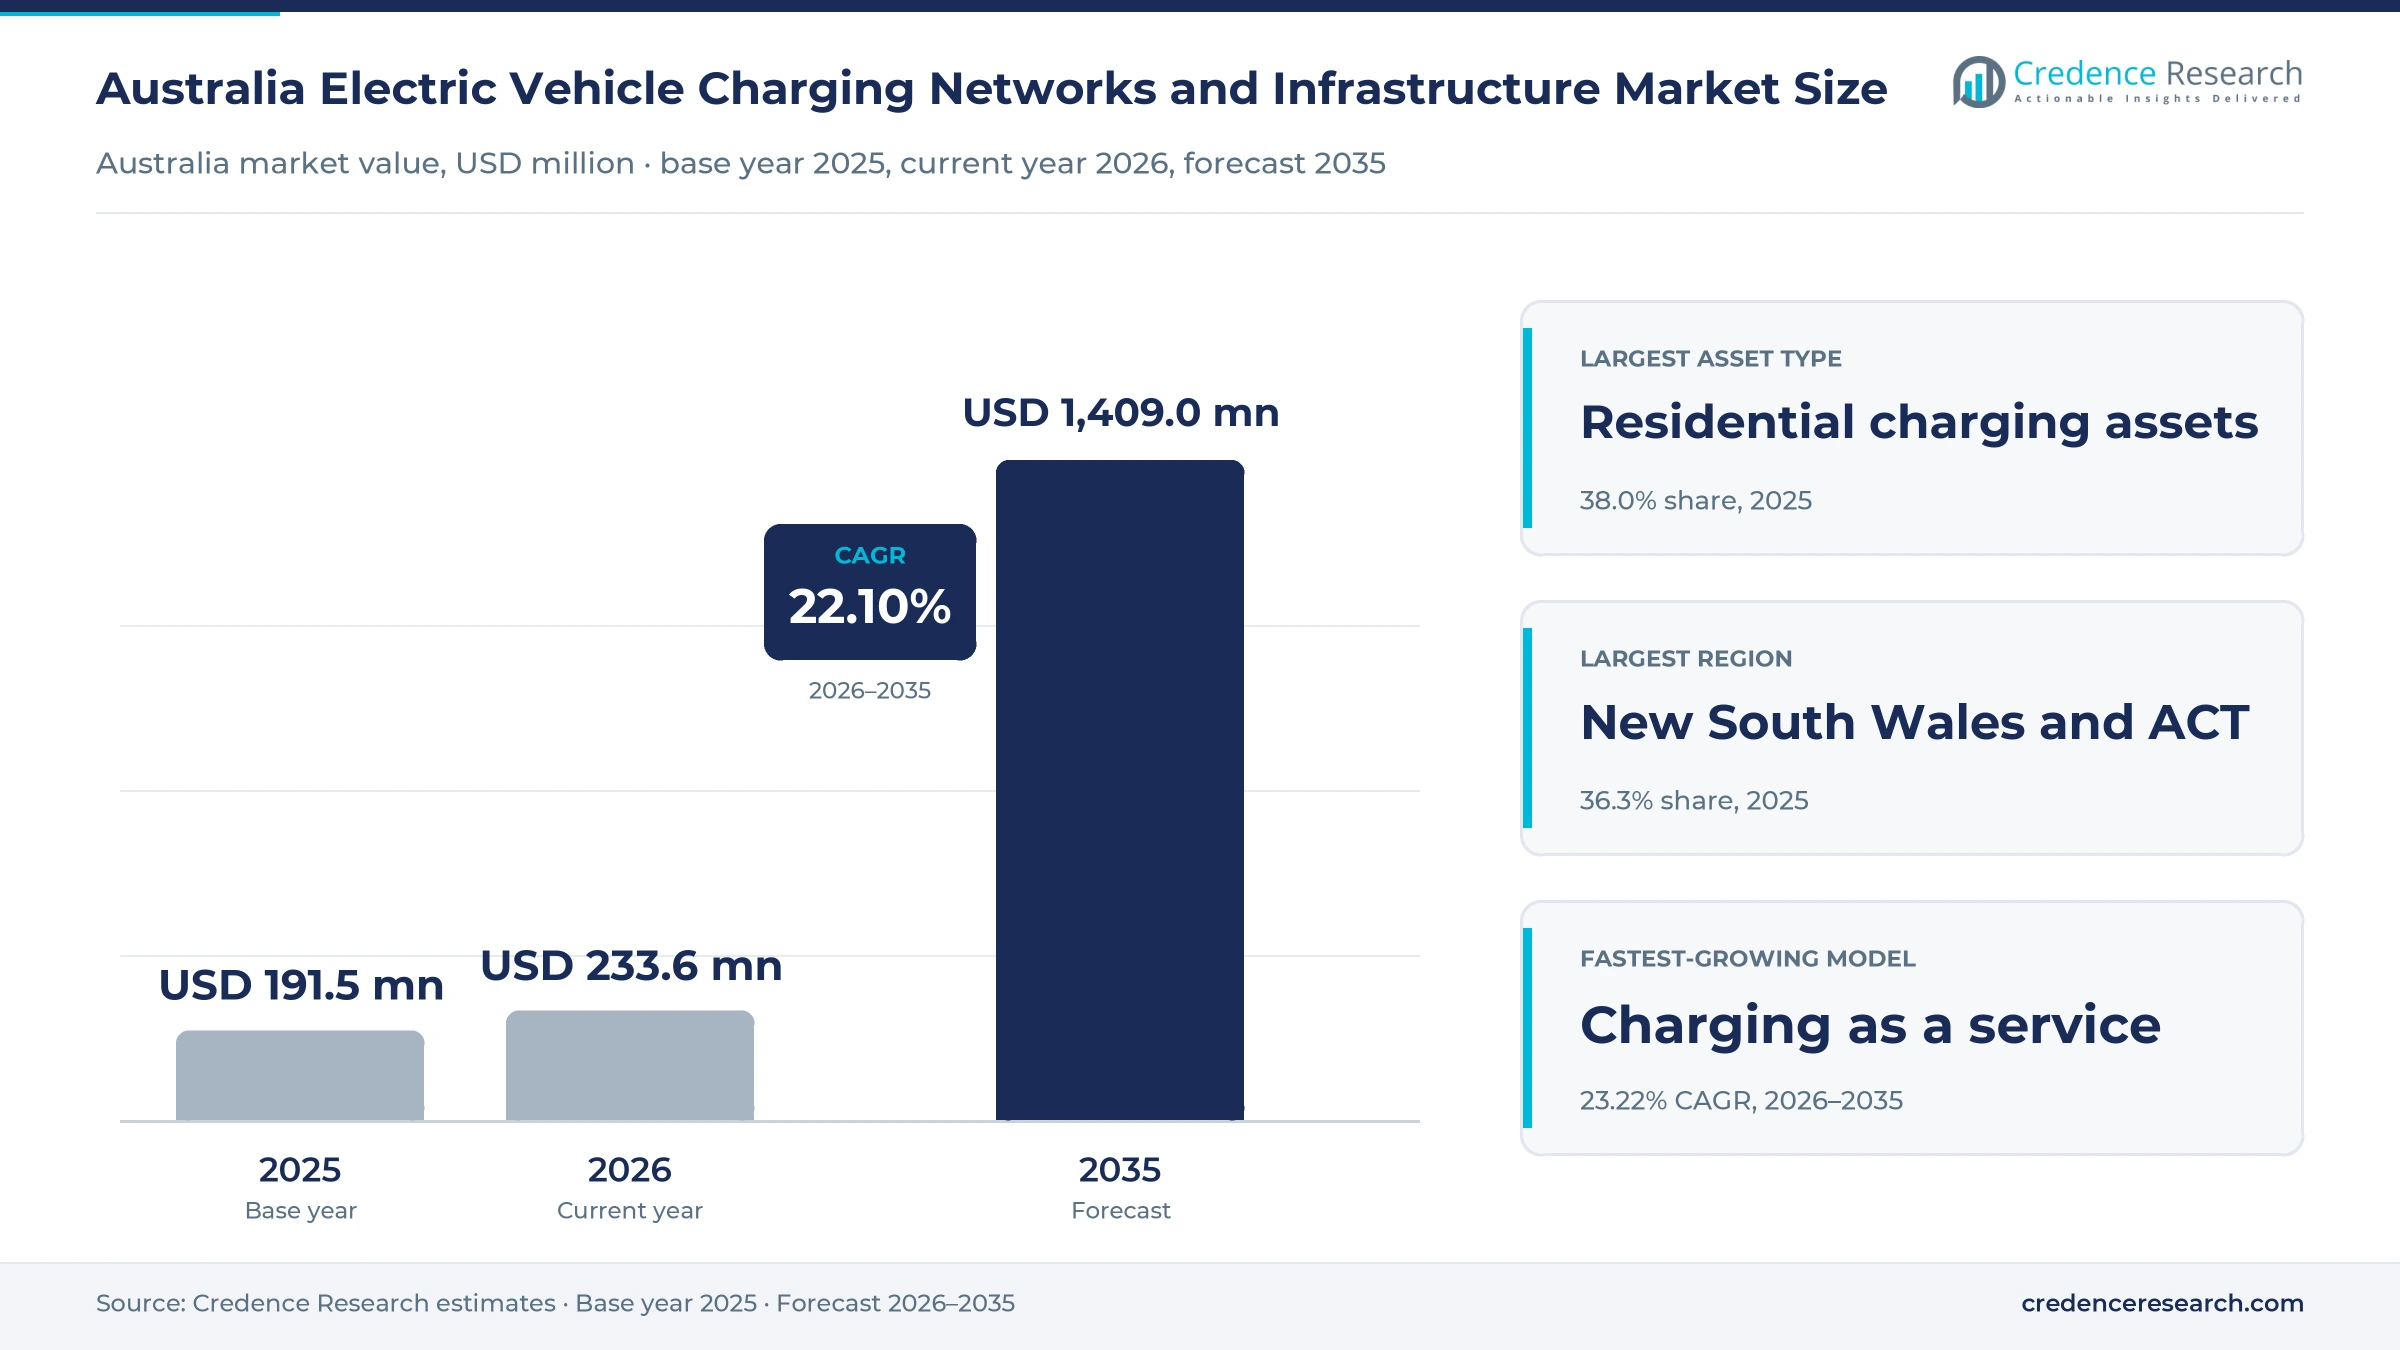
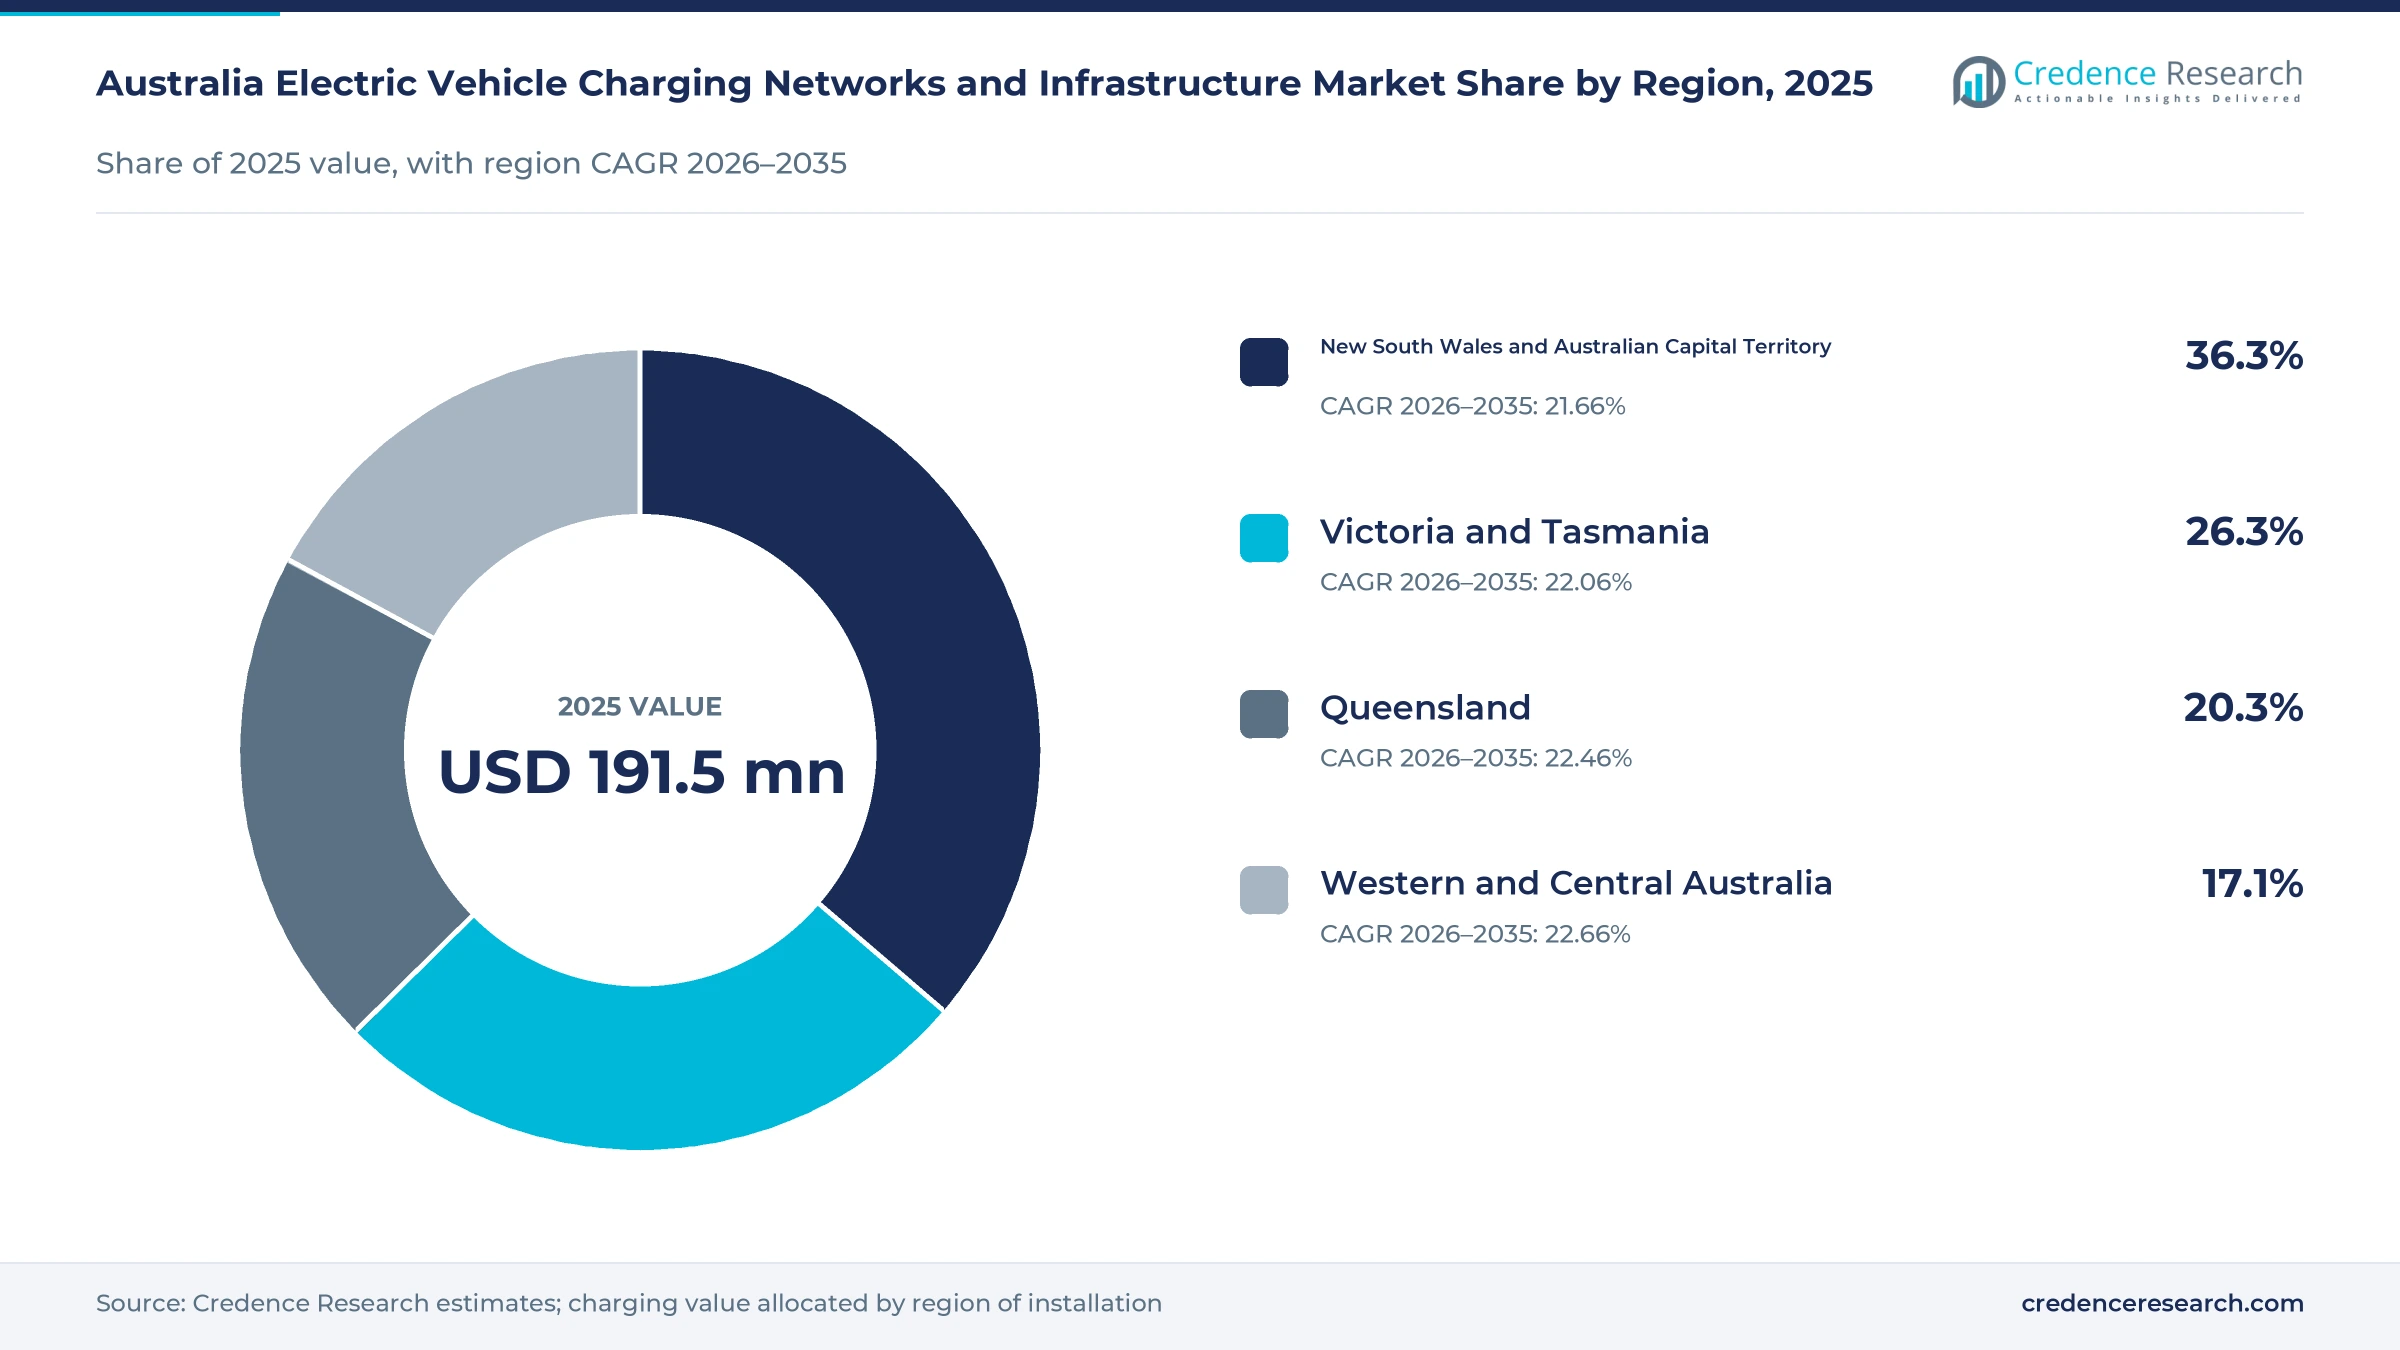
The Australia electric vehicle charging networks and infrastructure market was valued at USD 191.5 million in 2025 and is projected to increase from USD 233.6 million in 2026 to USD 1.41 billion by 2035, registering a CAGR of 22.10% during 2026–2035. Demand comes from households, fleet operators, retailers and highway operators that install home chargers, depot chargers and public fast-charging hubs as electric car sales rise under the New Vehicle Efficiency Standard. New South Wales and the Australian Capital Territory held the largest regional share, 36.3% in 2025, because Sydney and Canberra have the largest electric car fleets and kerbside programs. Western and Central Australia is the fastest-growing zone at 22.66% a year, as highway corridors and fast-growing Perth suburbs fill coverage gaps. Fuel retailers, specialist operators and software providers compete for sites and contracts. Consolidation also gathered pace in October 2026, when a major fuel retailer agreed to buy one of the largest fast-charging operators.
Which charging assets and services does the estimate cover?
The estimate measures spending on charging equipment, installation, network operation and charging software in Australia. It covers home chargers, fleet depot chargers, public rapid-charging hubs and destination chargers at shops, hotels and car parks. Values include turnkey purchases, charging-as-a-service contracts, energy sales by charge point operators and software subscriptions paid by site hosts and fleets.
The estimate excludes electric vehicles themselves, onboard vehicle chargers, grid upgrades paid for by distribution networks and electricity sold through household retail bills. The value chain runs from charger makers and software providers through installers and charge point operators to households, fleets and site hosts that buy or lease charging capacity.
Australia Electric Vehicle Charging Networks and Infrastructure Market Insights
- The Australia electric vehicle charging networks and infrastructure market was valued at USD 191.5 million in 2025 and is projected to reach USD 1.41 billion by 2035, registering a CAGR of 22.10% during 2026–2035.
- New South Wales and the Australian Capital Territory held a 36.3% share of 2025 value, because Sydney and Canberra have the largest electric car fleets.
- Residential charging assets led with a 38.0% share of 2025 value, because most electric car owners charge overnight at home.
- Australia had 1,272 fast-charging locations and at least 4,192 high-power public plugs by mid-2025, up 20% and 22% from a year earlier.
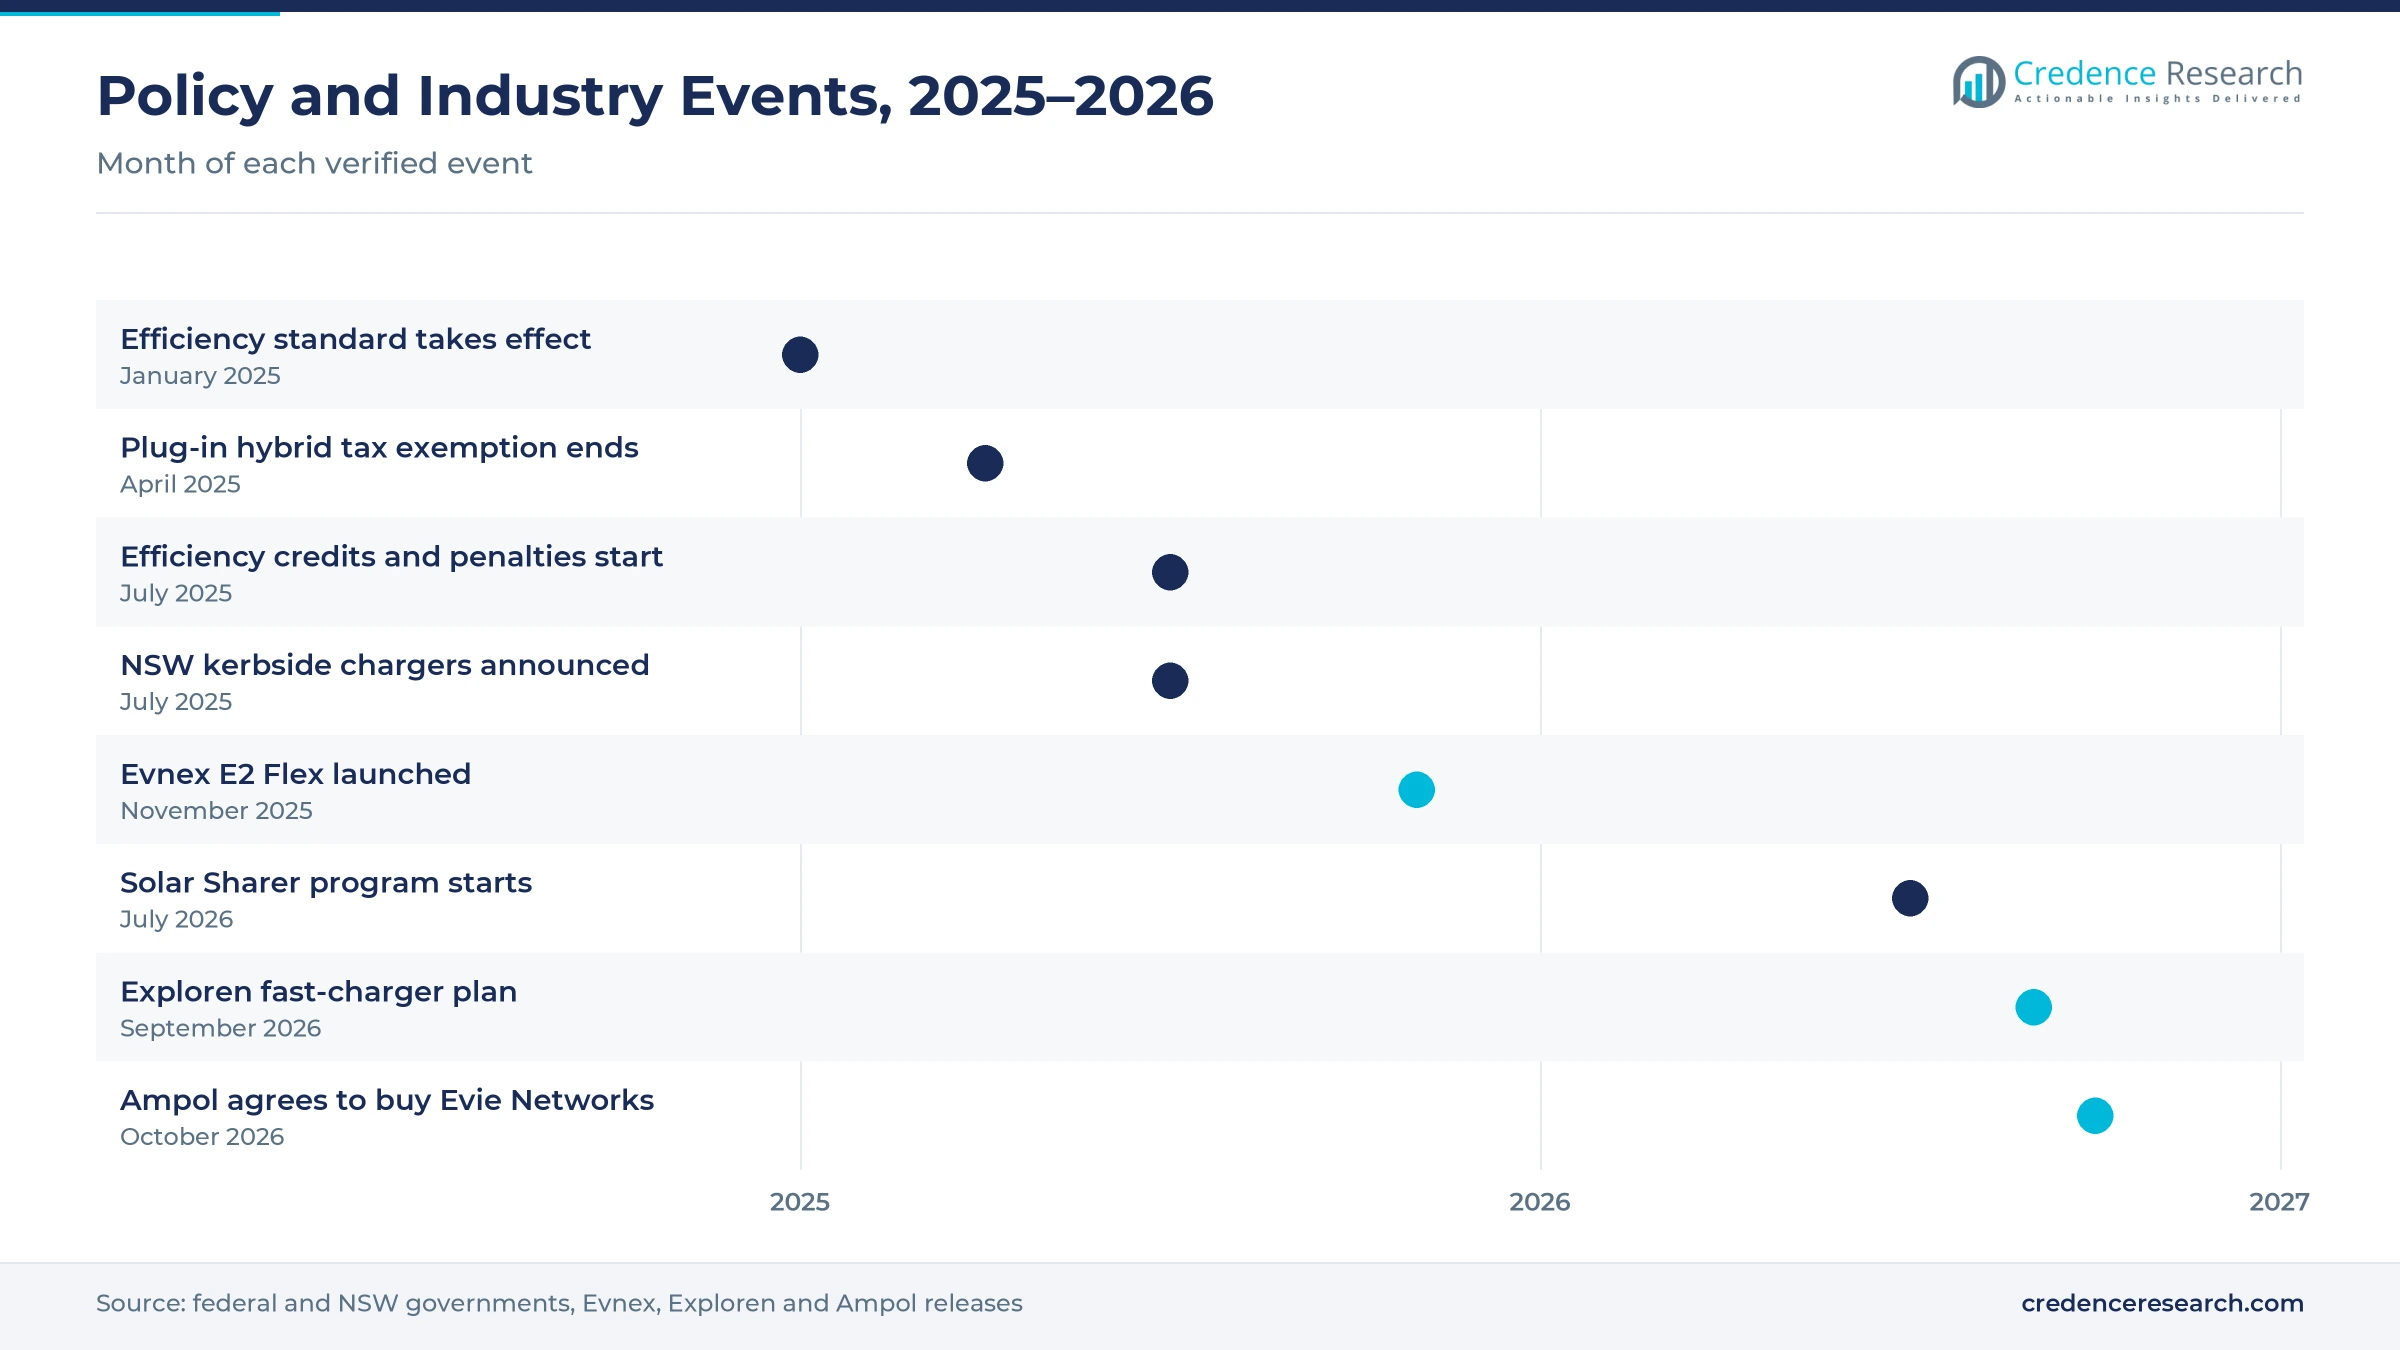
- The New Vehicle Efficiency Standard began on Jan. 1, 2025, and carmakers started earning credits or accruing penalties from July 1, 2025.
Home chargers lead while fleet depots grow fastest
Why do residential chargers lead spending?
Based on asset type, the market is categorized into residential charging assets, fleet depot assets, public rapid charging assets and destination charging assets. Residential charging assets led with a 38.0% share of 2025 value, because most owners charge overnight in garages and driveways. Fleet depot assets grow fastest at 23.07% a year, as delivery, trade and corporate fleets electrify vans and pool cars.
How does fleet transport outpace household demand?
Based on end-use sector, the market is categorized into household mobility, fleet transport, retail and hospitality, and public transport corridors. Household mobility led with a 40.0% share of 2025 value, because private buyers own most electric cars. Fleet transport grows fastest at 22.93% a year, as tax incentives and emissions targets push businesses to electrify vehicles.
Why is charging as a service growing fastest?
Based on contracting model, the market is categorized into turnkey purchase, charging as a service, energy sales and software subscription. Turnkey purchase led with a 45.0% share of 2025 value, because households and small sites buy chargers outright. Charging as a service grows fastest at 23.22% a year, as fleets prefer monthly fees over upfront capital spending.
Why does network software grow faster than hardware?
Based on technology, the market is categorized into AC charging, DC charging and network management software. DC charging led with a 46.0% share of 2025 value, because public hubs use costly high-power units. Network management software grows fastest at 22.98% a year, as operators, fleets and households manage charging around tariffs, solar output and grid limits.
| Segment Group | Leading Sub-segment | Share, 2025 | Fastest-growing Sub-segment | CAGR, 2026–2035 |
|---|---|---|---|---|
| By Asset Type | Residential charging assets | 38.0% | Fleet depot assets | 23.07% |
| By End-Use Sector | Household mobility | 40.0% | Fleet transport | 22.93% |
| By Contracting Model | Turnkey purchase | 45.0% | Charging as a service | 23.22% |
| By Technology | DC charging | 46.0% | Network management software | 22.98% |
Request a Free Sample
Fill in your details and we'll send you a free sample report.
- Sample data tables & charts
- Research methodology
Vehicle rules, public funding and fleet charging lift demand
How does vehicle supply and efficiency regulation lift demand?
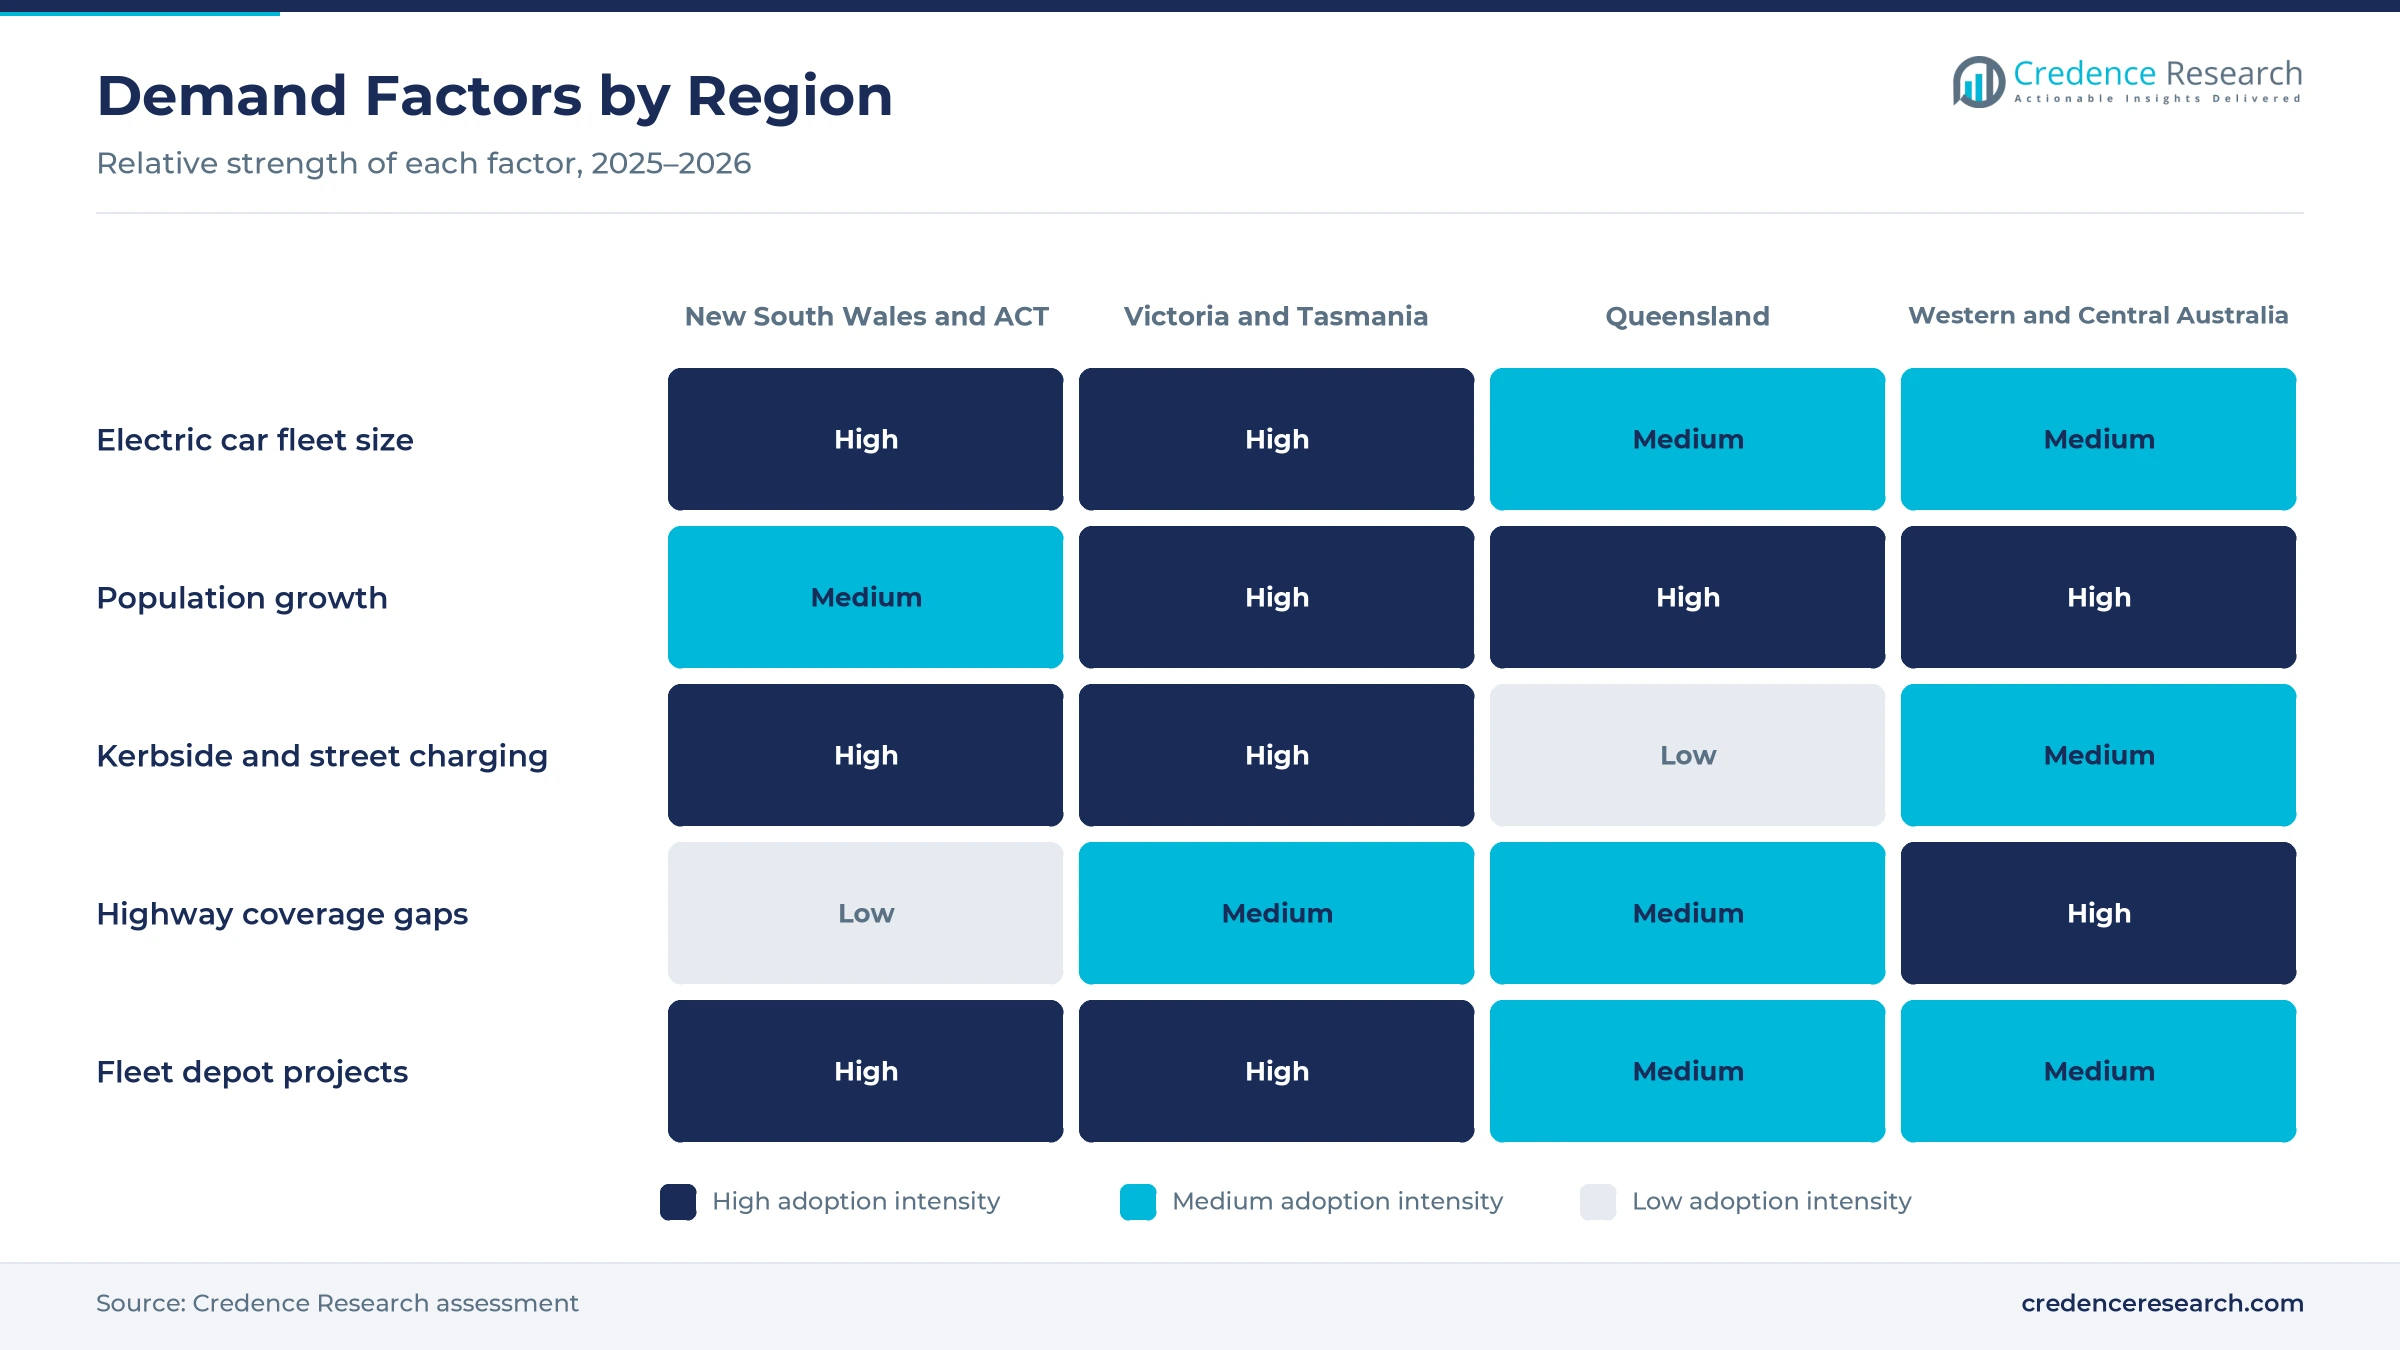
Vehicle supply and efficiency regulation lifts charging demand, because carmakers must sell more low-emission models to meet national targets. The New Vehicle Efficiency Standard began on Jan. 1, 2025, and carmakers started earning credits or accruing penalties from July 1, 2025, according to the Department of Infrastructure. The standard aims to cut passenger vehicle emissions by over 60% by 2030. Electric cars reached about 15% of new car sales in Australia in 2025, according to the International Energy Agency. The fringe benefits tax exemption for electric cars, law since Dec. 12, 2022, also supports leased vehicles. As a result, residential charging assets hold a 38.0% share of 2025 value.
Why does coordinated public infrastructure deployment matter?
Coordinated public infrastructure deployment matters, because drivers buy electric cars only when they trust highway and urban charging. Australia had 1,272 fast-charging locations by mid-2025, up 20% from June 2024, and at least 4,192 high-power plugs, according to the Electric Vehicle Council report. A federal grant of A$39.3 million to the NRMA funds 117 new fast chargers, aiming for one charger every 150 km on national highways. The federal government also allocated A$60 million for charging at car dealerships under the Driving the Nation fund. In turn, public rapid charging assets gain value as highway gaps close.
How do managed charging and fleet integration raise spending?
Managed charging and fleet integration raise spending, because fleets and households need chargers that respond to tariffs, depot loads and solar output. The Australian Renewable Energy Agency gave JET Charge A$12 million toward a A$24.9 million charging-as-a-service project for more than 3,100 new electric vehicles, according to ARENA. Fleet operators pay a subscription while JET Charge installs and maintains the chargers. In November 2025, Evnex launched its E2 Flex home charger with overload protection and off-peak scheduling. As a result, charging as a service grows at 23.22% a year, as fleets link chargers with fleet management systems.
Why does a growing electric car fleet expand the base?
A growing electric car fleet expands the charging base, because each new vehicle needs a home, depot or public charging option. Electric cars made up 12.1% of new car sales in the first half of 2025, up from 9.61% in 2024, and June reached almost 16%. About 72,758 battery and plug-in hybrid cars were sold in those six months, up 24.4% year on year. The national electric fleet passed 370,000 vehicles, with more than 150 models on sale. Australia's population also reached 27.92 million at March 31, 2026, which widens the pool of future buyers. In turn, household mobility holds a 40.0% share of 2025 value.
Network consolidation and high-power hubs reshape charging
How is the rise of network consolidation changing competition?
The rise of network consolidation is changing competition, because fuel retailers want ready-built fast-charging sites. On Oct. 1, 2026, Ampol agreed to acquire Evie Networks, which ran about 340 sites with more than 1,030 charging bays in July 2026. The combined network would hold about 1,425 bays across more than 400 sites, subject to competition clearance, with completion expected in the first half of 2027. Ampol had already nearly doubled its own charging bays to 356 in the half-year to June 2026. As a result, public rapid charging assets increasingly sit with a few large operators that can fund sites with low early use.
Why is the shift to high-power DC hubs gaining ground?
The shift to high-power DC hubs is gaining ground, because drivers want shorter stops and operators want more sessions per site. In September 2026, Exploren said it would invest A$30 million over two years in more than 600 new DC fast chargers, many rated above 200 kW. Exploren had already acquired Engie's Australian and New Zealand network in 2025, which added more than 200 locations. Tesla runs about 131 Supercharger sites in Australia, and about two-thirds are open to other brands. In turn, DC charging holds a 46.0% share of 2025 value, as hubs replace single chargers at highway stops.
Can kerbside charging open room for apartment dwellers?
Kerbside charging can open room for apartment dwellers, because many city residents lack a garage or driveway. On July 9, 2025, the NSW Government announced 549 new kerbside chargers across 130 suburbs, backed by A$2.8 million, according to the NSW Government. JOLT runs about 98 street sites in Sydney, Melbourne and Adelaide, giving each driver 7 kWh free every 24 hours. About two-thirds of Australian households also lack rooftop solar, which limits cheap home charging. As a result, destination and street chargers gain councils, retailers and advertisers as new hosts, while some sites pair chargers with energy storage systems.
Is there room for software in solar-led charging?
Solar-led charging creates room for software, because chargers can shift demand into cheap daytime hours. The federal Solar Sharer program, starting in July 2026 in NSW, southeast Queensland and South Australia, gives eligible homes three free daytime hours of power. Evnex designed its E2 Flex charger to schedule charging into those hours, starting on grid power and adding solar later. Exploren also works as a software platform for other operators as well as running its own sites, and it cites about 5,500 plugs across public, fleet and apartment sites. Evnex launched the E2 Flex on Nov. 25, 2025, and Chargefox gives drivers one app across many owners. In turn, network management software grows at 22.98% a year, as operators join demand response programs.
Grid connections, low use and coverage gaps slow returns
How do grid connection costs slow new hubs?
Grid connection costs slow new hubs, because high-power sites often need new transformers and long approval times from distribution networks. Regional towns face the highest costs per charger because local lines are weaker. As a result, some planned sites open late or with fewer bays. Operators respond with batteries, load management and shared connections, and they work with networks on smart grid upgrades that let chargers draw power more flexibly.
Why does low use weigh on operator returns?
Low use weighs on operator returns, because fast chargers cost a lot to install while early sites see few daily sessions. Ampol, for example, still expects its charging business to break even only toward the end of 2028. In turn, investors favor busy urban and highway sites and avoid thin regional routes. Operators respond with grants, retail partnerships and pricing plans that lift session numbers, while fleets sign contracts that guarantee steady use.
How do reliability problems hurt driver trust?
Reliability problems hurt driver trust, because a broken charger on a long route can leave drivers stranded or waiting. Queues at popular hubs during holidays add to the frustration. As a result, some buyers delay switching to electric cars. Operators respond with remote monitoring, faster repair contracts, more bays per site and live status data in apps, which help drivers plan stops and reduce the risk of arriving at an offline charger.
Why do coverage gaps persist outside major cities?
Coverage gaps persist outside major cities, because long distances and low traffic make remote sites hard to fund. The Electric Vehicle Council rated the Queensland, Tasmanian and Northern Territory governments 3 out of 10 for their electric vehicle policies in 2025. In turn, drivers in those areas face longer gaps between fast chargers. Federal highway grants and motoring club networks respond by funding sites in towns that private operators would not build alone.
New South Wales leads while the west grows fastest
| Region | Value, 2025 (USD million) | Share, 2025 | CAGR, 2026–2035 |
|---|---|---|---|
| New South Wales and Australian Capital Territory | 69.5 | 36.3% | 21.66% |
| Victoria and Tasmania | 50.4 | 26.3% | 22.06% |
| Queensland | 38.9 | 20.3% | 22.46% |
| Western and Central Australia | 32.7 | 17.1% | 22.66% |
Why does new South Wales hold the largest share?
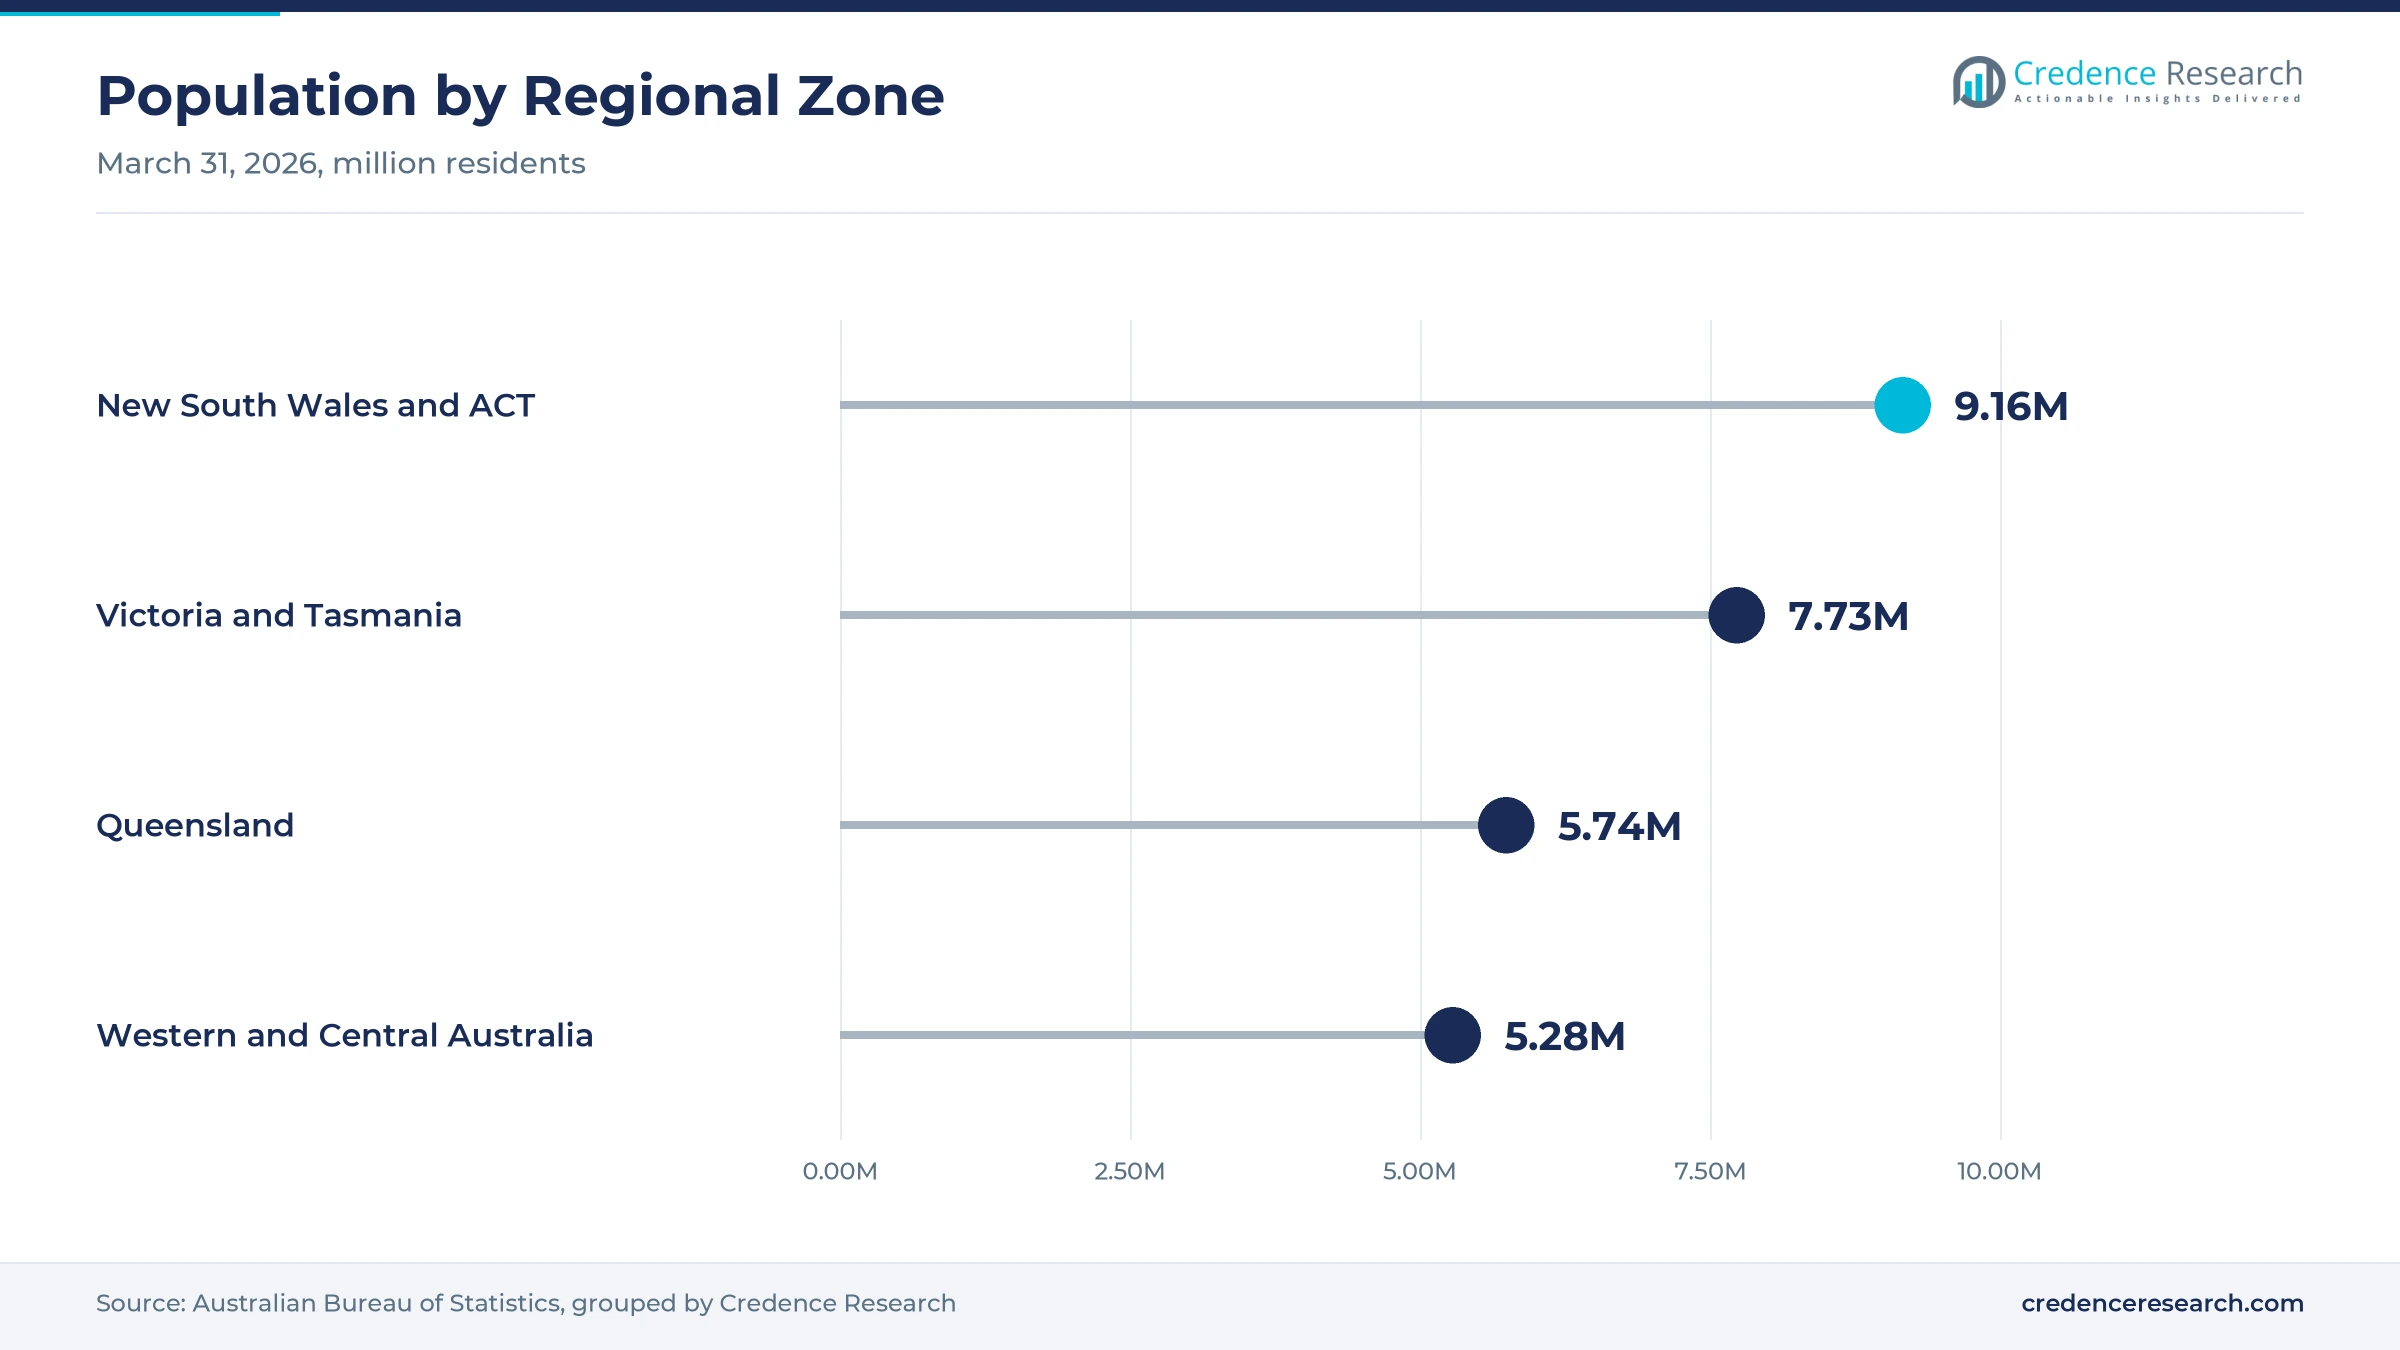
New South Wales and the Australian Capital Territory held a 36.3% share of 2025 value and grow at 21.66% a year, because Sydney and Canberra have the largest electric car fleets and the most public chargers. The two jurisdictions had about 9.16 million residents in March 2026. The 549 new kerbside chargers across 130 NSW suburbs add street capacity for apartment dwellers. However, growth is slower than in the west because the charging base is already larger.
How do Victoria and Tasmania build out charging?
Victoria and Tasmania held a 26.3% share of 2025 value and grow at 22.06% a year, because Melbourne has a large electric car fleet and dense street charging. Victoria's population grew 1.6% in the year to March 2026, which adds future buyers. NRMA highway sites at Wycheproof, Ouyen, Mildura and Marong link regional Victoria to Adelaide. As a result, highway and urban sites both expand, while Tasmania adds tourist routes.
Why is Queensland gaining share?
Queensland held a 20.3% share of 2025 value and grows at 22.46% a year, because Brisbane, the Gold Coast and the Sunshine Coast attract new residents and electric car buyers. Queensland had about 5.74 million residents in March 2026 and grew 1.6% over the year. The Solar Sharer program also covers southeast Queensland from July 2026, which supports daytime home charging. In turn, home and destination chargers gain value across the southeast corner.
What drives growth in Western and Central Australia?
Western and Central Australia held a 17.1% share of 2025 value and grows fastest at 22.66% a year, because Western Australia had the fastest population growth at 2.1%. NRMA sites at Port Pirie in South Australia and Mataranka in the Northern Territory fill long highway gaps. As a result, operators add hubs in Perth and Adelaide suburbs while grants extend coverage along remote corridors.
Efficiency rules and network deals marked 2025 and 2026
| Development | Status and market relevance |
|---|---|
| In January 2025, the New Vehicle Efficiency Standard took effect, with credits and penalties starting on July 1, 2025. | Pushes carmakers to supply more electric models |
| In April 2025, the fringe benefits tax exemption ended for new plug-in hybrid leases. | Focuses tax support on battery electric cars |
| In July 2025, the NSW Government announced 549 new kerbside chargers across 130 suburbs. | Adds street charging for residents without driveways |
| In September 2026, Exploren announced plans to invest A$30 million in more than 600 new DC fast chargers. | Expands high-power public capacity over two years |
| In October 2026, Ampol agreed to acquire Evie Networks. | Would create a network of about 1,425 bays across more than 400 sites |
Fast DC hubs, smart home units and software change charging
- High-power DC chargers deliver 150 kW to 350 kW, which shortens highway stops, lifts sessions per site and suits long trips between regional towns.
- Smart home chargers schedule charging around off-peak tariffs and solar output, which lowers running costs for households and protects home circuits from overload.
- Network management software lets operators monitor uptime, set prices and balance loads across many sites from one platform, which cuts repair times and grid charges.
- Kerbside power-pole chargers mount on existing street infrastructure, which brings charging to residents without driveways at a lower cost than new hubs.
Need a Custom Version of This Report?
Tailor the scope, geography, or segments to your exact requirements.
- Custom geography or segment scope
- Direct access to our analyst team
Fuel retailers, specialists and automakers compete for sites
Competition includes fuel retailers, specialist operators, carmakers and software providers. Ampol runs AmpCharge on its forecourts and agreed in October 2026 to buy Evie Networks, which ran about 340 sites. Exploren operates its own fast-charging network and supplies software to other operators. Tesla runs about 131 Supercharger sites, while BP Pulse runs about 70 highway sites. Chargefox, owned by motoring clubs including the NRMA, gives drivers one app across many owners. JOLT funds street chargers with advertising, JET Charge sells fleet charging as a service, and Evnex supplies smart home and fleet chargers. Rivals compete on site location, charging speed, uptime, price per kWh and fleet contract terms. Fuel retailers use existing forecourts and convenience stores to attract drivers, while specialists sign long leases with shopping centers, councils and fast-food chains. Software platforms also matter, because site hosts want remote control of pricing, access and energy use.
Companies profiled and their roles in this market
| Company | Type | Role in the market |
|---|---|---|
| Evie Networks | Fast-charging operator | Runs about 340 sites; agreed sale to Ampol in October 2026 |
| Ampol AmpCharge | Fuel retailer network | Nearly doubled forecourt charging bays to 356 by mid-2026 |
| Exploren | Operator and software provider | Plans more than 600 new DC fast chargers |
| Tesla Supercharger Australia | Carmaker network | Runs about 131 sites, many open to other brands |
| JOLT | Street charging operator | Offers 7 kWh free daily at street sites |
| BP Pulse Australia | Fuel retailer network | Runs about 70 highway rest-stop sites |
| JET Charge | Fleet charging provider | Sells charging as a service with ARENA support |
| Evnex | Charger maker | Launched E2 Flex smart home charger in November 2025 |
Credence Research view on Australian charging build-out
Credence Research's view is that Australian charging spending will grow quickly because efficiency rules push more electric cars into the market and fleets move from trials to full depots. Home chargers remain the base of spending, while fleet depots, charging as a service and software gain share. Consolidation among fast-charging operators will favor groups that can fund sites with low early use. However, grid connection costs, low utilization and regional gaps will slow returns. Operators with strong sites, high uptime and fleet contracts should gain share fastest.
Sales data, grant records and network counts anchor sizing
The report uses 2025 as the base year on a calendar basis, and market values come from the Credence Research model. That model combines electric car sales and fleet data, public charging counts, federal and state grant records, population statistics, International Energy Agency data and company information on networks and products. Segment splits and regional growth rates are Credence Research estimates, while regional shares follow the client-defined split. Sources used are public reports, official statistics, trade press and company websites, and no interviews or surveys were used.
Fleet charging and high-power hubs carry spending to 2035
Spending on charging networks and infrastructure in Australia is expected to reach USD 1.41 billion by 2035, a 22.10% CAGR during 2026–2035, as efficiency rules, fleet electrification and high-power hubs keep demand rising. Growth should be fastest through 2030 while carmakers work toward the efficiency targets and fleets build depots. After that, software, energy sales and charging as a service will carry more value as hardware prices fall. Slower vehicle sales would lower this outlook, while faster fleet adoption would raise it. Operators with busy sites and fleet contracts are expected to gain the most.
Frequently Asked Questions
How big is the Australia electric vehicle charging networks and infrastructure market?
Which asset type leads charging spending in Australia?
Which region leads Australian charging spending?
How many public fast-charging locations does Australia have?
What drives charging demand in Australia?
Which contracting model is growing fastest?
Who are the leading charging companies in Australia?
What are the main challenges for charging operators?
Table of Content
Chapter 1 Market Segmentation
- 1.1 Segmentation Framework
- 1.1.1 Product and Service Classification
- 1.1.2 Application and End-Use Classification
- 1.1.3 Technology and Solution Classification
- 1.1.4 Customer and Distribution Channel Classification
- 1.1.5 Geographic Segmentation
- 1.1.6 Market Segment Definitions and Boundaries
- 1.2 By Asset Type
- 1.2.1 Residential charging assets
- 1.2.2 Fleet depot assets
- 1.2.3 Public rapid charging assets
- 1.2.4 Destination charging assets
- 1.3 By End-Use Sector
- 1.3.1 Household mobility
- 1.3.2 Fleet transport
- 1.3.3 Retail and hospitality
- 1.3.4 Public transport corridors
- 1.4 By Contracting Model
- 1.4.1 Turnkey purchase
- 1.4.2 Charging as a service
- 1.4.3 Energy sales
- 1.4.4 Software subscription
- 1.5 By Technology
- 1.5.1 AC charging
- 1.5.2 DC charging
- 1.5.3 Network management software
Chapter 2 Introduction
- 2.1 Report Objectives and Scope
- 2.2 Product Definition and Industry Terminology
- 2.3 Market Inclusions and Exclusions
- 2.4 Research Process
- 2.4.1 Primary Research and Expert Interviews
- 2.4.2 Secondary Research and Source Review
- 2.4.3 Top-Down and Bottom-Up Estimation
- 2.4.4 Data Triangulation and Verification
- 2.5 Market Size Measurement Basis
- 2.5.1 2025: USD 191.5 million → 2035: USD 1.41 billion
- 2.6 Historical and Forecast Reference Periods
- 2.6.1 Historical Period: 2018-2025
- 2.6.2 Base Year: 2025
- 2.6.3 Forecast Period: 2025-2035
- 2.7 Research Assumptions and Limitations
Chapter 3 Executive Summary
- 3.1 Market Snapshot and Key Findings
- 3.2 Base-Year Market Size, 2025
- 3.3 Forecast Market Size, 2035
- 3.4 Revenue and Volume Growth Outlook
- 3.5 Key Demand and Supply Indicators
- 3.6 Leading Market Segments
- 3.7 Fastest-Growing Market Opportunities
- 3.8 Regional Performance Highlights
- 3.9 Technology and Industry Transformation
- 3.10 Competitive Landscape Summary
- 3.11 Analyst View and Strategic Implications
Chapter 4 Australia Electric Vehicle Charging Networks and Infrastructure Market Trends and Developments
- 4.1 Historical Industry Development, 2018-2025
- 4.2 Recent Market Trends and Developments
- 4.3 Demand and Customer Behavior Trends
- 4.4 Technology and Product Innovation
- 4.5 Artificial Intelligence, Automation and Digitalization
- 4.6 Local Manufacturing and Supply Chain Realignment
- 4.7 Industry Partnerships, Mergers and Acquisitions
- 4.8 Sustainability and Circular Economy Developments
- 4.9 Government and Private Sector Investment Trends
- 4.10 Emerging Business Models and Commercialization
- 4.11 Industry Developments and Announcements
Chapter 5 Australia Electric Vehicle Charging Networks and Infrastructure Market Production, Supply and Demand Analysis
- 5.1 Demand Trend and Consumption Analysis, 2018-2025
- 5.2 Demand Forecast, 2025-2035
- 5.3 Production and Output Trend, 2018-2025
- 5.4 Production and Output Forecast, 2025-2035
- 5.5 Installed Capacity and Capacity Utilization
- 5.6 Company-Wise Production Plants and Statistics
- 5.6.1 Installed Production Capacity
- 5.6.2 Actual Production
- 5.6.3 Planned Capacity and Expansion Targets
- 5.7 Supply Chain Structure and Procurement Trends
- 5.8 Supply-Demand Gap and Bottlenecks
- 5.9 Import Dependence and Sourcing Structure
- 5.10 Contract Manufacturing and Outsourcing
- 5.11 Regional Supply and Demand Concentration
Chapter 6 Australia Electric Vehicle Charging Networks and Infrastructure Market Pricing Analysis
- 6.1 Pricing Structure and Measurement
- 6.2 Historical Pricing Trends, 2018-2025
- 6.3 Pricing Outlook, 2025-2035
- 6.4 Average Selling Price and Unit Economics
- 6.5 Pricing by Product and Market Segment
- 6.6 Geographic Pricing Differences
- 6.7 Key Input, Energy, Labor and Logistics Costs
- 6.8 Contract Pricing and Purchasing Models
- 6.9 Pricing Sensitivity and Competitive Positioning
- 6.10 Price, Margin and Profitability Implications
Chapter 7 Australia Electric Vehicle Charging Networks and Infrastructure Market Dynamics
- 7.1 Market Growth Drivers
- 7.1.1 Demand-Side Drivers
- 7.1.2 Technology and Innovation Drivers
- 7.1.3 Infrastructure and Investment Drivers
- 7.1.4 Regulatory and Policy Drivers
- 7.2 Market Restraints
- 7.2.1 Cost and Affordability Constraints
- 7.2.2 Technology and Adoption Barriers
- 7.2.3 Supply Chain and Operational Constraints
- 7.3 Market Challenges
- 7.3.1 Competitive Pressure and Margin Erosion
- 7.3.2 Skills, Infrastructure and Implementation Gaps
- 7.4 Emerging Market Opportunities
- 7.5 Market Dynamics Impact and Time-Horizon Assessment
Chapter 8 Australia Electric Vehicle Charging Networks and Infrastructure Value Chain Analysis
- 8.1 Industry Value Chain Overview
- 8.2 Upstream Suppliers and Critical Inputs
- 8.3 Technology and Component Providers
- 8.4 Manufacturing or Service Delivery
- 8.5 Distribution, Channel Partners and Integrators
- 8.6 Downstream Applications and End Users
- 8.7 Value Addition and Profit Pools
- 8.8 Vertical Integration and Outsourcing
- 8.9 Supplier Concentration and Risk
- 8.10 Supply Chain Localization and Resilience
Chapter 9 Australia Electric Vehicle Charging Networks and Infrastructure Market Regulations and Policies
- 9.1 Relevant Laws, Standards and Compliance Frameworks
- 9.2 Product, Service, Safety and Quality Requirements
- 9.3 Government Policies, Incentives and Subsidies
- 9.4 Imports, Exports and Trade Barriers
- 9.5 Public Procurement and Local Content Requirements
- 9.6 Environmental and Sustainability Compliance
- 9.7 Upcoming Policy Changes and Market Implications
Chapter 10 Australia Electric Vehicle Charging Networks and Infrastructure Market Hotspots and Opportunities
- 10.1 Market Opportunity Mapping and Growth Hotspots
- 10.2 High-Growth Applications and Customer Groups
- 10.3 Underserved Markets and White-Space Opportunities
- 10.4 Emerging Technology and Product Opportunities
- 10.5 New Capacity and Investment Hotspots
- 10.6 Market Entry and Expansion Opportunities
- 10.7 Distribution and Partnership Opportunities
- 10.8 Near-Term and Long-Term Commercial Potential
- 10.9 Opportunity Attractiveness and Execution Risks
Chapter 11 Australia Electric Vehicle Charging Networks and Infrastructure Market Outlook, 2025-2035
- 11.1 Market Size and Analysis
- 11.1.1 Revenue (Market Measurement: 2025: USD 191.5 million → 2035: USD 1.41 billion)
- 11.1.2 Market Volume and Quantity Sold
- 11.1.3 Historical Market Size, 2018-2025
- 11.1.4 Base-Year Market Size, 2025
- 11.2 Market Forecast, 2025-2035
- 11.2.1 Revenue Forecast to 2035
- 11.2.2 Volume Forecast to 2035
- 11.2.3 CAGR and Year-on-Year Growth
- 11.2.4 Incremental Revenue Opportunity
- 11.3 Forecast Assumptions and Scenario Analysis
- 11.3.1 Base-Case Forecast
- 11.3.2 Optimistic and Conservative Scenarios
- 11.3.3 Technology, Pricing and Policy Sensitivities
- 11.4 Market Attractiveness and Growth Outlook
Chapter 12 Australia Electric Vehicle Charging Networks and Infrastructure Market Segmentation and Outlook
- 12.1 Segmentation Summary and Market Shares, 2025
- 12.2 Largest and Fastest-Growing Segments
- 12.3 By Asset Type - Market Size and Forecast, 2025-2035
- 12.3.1 Segment Definition and Scope
- 12.3.2 Historical Market Size, 2018-2025
- 12.3.3 Revenue Forecast, 2025-2035
- 12.3.4 Volume Forecast, 2025-2035
- 12.3.5 Base-Year Market Share, 2025
- 12.3.6 Segment CAGR and Growth Drivers
- 12.3.7 Subsegment Market Size and Forecast
- 12.3.7.1 Residential charging assets
- 12.3.7.2 Fleet depot assets
- 12.3.7.3 Public rapid charging assets
- 12.3.7.4 Destination charging assets
- 12.3.8 Subsegment Pricing and Adoption Trends
- 12.3.9 Leading Suppliers and Competition
- 12.3.10 Regional Demand and Opportunities
- 12.4 By End-Use Sector - Market Size and Forecast, 2025-2035
- 12.4.1 Segment Definition and Scope
- 12.4.2 Historical Market Size, 2018-2025
- 12.4.3 Revenue Forecast, 2025-2035
- 12.4.4 Volume Forecast, 2025-2035
- 12.4.5 Base-Year Market Share, 2025
- 12.4.6 Segment CAGR and Growth Drivers
- 12.4.7 Subsegment Market Size and Forecast
- 12.4.7.1 Household mobility
- 12.4.7.2 Fleet transport
- 12.4.7.3 Retail and hospitality
- 12.4.7.4 Public transport corridors
- 12.4.8 Subsegment Pricing and Adoption Trends
- 12.4.9 Leading Suppliers and Competition
- 12.4.10 Regional Demand and Opportunities
- 12.5 By Contracting Model - Market Size and Forecast, 2025-2035
- 12.5.1 Segment Definition and Scope
- 12.5.2 Historical Market Size, 2018-2025
- 12.5.3 Revenue Forecast, 2025-2035
- 12.5.4 Volume Forecast, 2025-2035
- 12.5.5 Base-Year Market Share, 2025
- 12.5.6 Segment CAGR and Growth Drivers
- 12.5.7 Subsegment Market Size and Forecast
- 12.5.7.1 Turnkey purchase
- 12.5.7.2 Charging as a service
- 12.5.7.3 Energy sales
- 12.5.7.4 Software subscription
- 12.5.8 Subsegment Pricing and Adoption Trends
- 12.5.9 Leading Suppliers and Competition
- 12.5.10 Regional Demand and Opportunities
- 12.6 By Technology - Market Size and Forecast, 2025-2035
- 12.6.1 Segment Definition and Scope
- 12.6.2 Historical Market Size, 2018-2025
- 12.6.3 Revenue Forecast, 2025-2035
- 12.6.4 Volume Forecast, 2025-2035
- 12.6.5 Base-Year Market Share, 2025
- 12.6.6 Segment CAGR and Growth Drivers
- 12.6.7 Subsegment Market Size and Forecast
- 12.6.7.1 AC charging
- 12.6.7.2 DC charging
- 12.6.7.3 Network management software
- 12.6.8 Subsegment Pricing and Adoption Trends
- 12.6.9 Leading Suppliers and Competition
- 12.6.10 Regional Demand and Opportunities
- 12.7 Segment Growth Comparison
- 12.8 Segment Attractiveness and Priority Matrix
Chapter 13 Australia Electric Vehicle Charging Networks and Infrastructure End-Use and Application Market Outlook
- 13.1 End-Use Industry and Customer Demand Structure
- 13.2 Leading Applications and Customer Groups
- 13.3 End-Use Market Size, Share and Forecast
- 13.4 Major End-Use Industry Deep Dives
- 13.4.1 Customer Requirements and Use Cases
- 13.4.2 Demand and Replacement Cycles
- 13.4.3 Technical and Regulatory Considerations
- 13.4.4 Purchasing and Procurement Models
- 13.4.5 Leading Vendors and Distribution Channels
- 13.4.6 Forecast and Commercial Opportunities
- 13.5 Emerging Applications and Cross-Segment Demand
- 13.6 End-Use Industry Investment Priorities
Chapter 14 Australia Electric Vehicle Charging Networks and Infrastructure Geographic Market Outlook, 2025-2035
- 14.1 Domestic Market Distribution and Demand Clusters
- 14.2 State- or Province-Wise Market Size and Forecast, 2025-2035
- 14.3 City and Metropolitan Market Outlook
- 14.4 Industrial, Manufacturing and Commercial Clusters
- 14.5 Geographic Concentration of Key End Users
- 14.6 Local Pricing and Purchasing Differences
- 14.7 Domestic Production Facilities and Capacity Map
- 14.8 Local Infrastructure and Project Pipeline
- 14.9 State-Level Policy and Incentive Differences
- 14.10 Subnational Investment Hotspots and Opportunities
- 14.11 Distribution and Logistics Networks
- 14.12 Domestic Competitive Footprint
Chapter 15 Australia Electric Vehicle Charging Networks and Infrastructure Technology, Innovation and Sustainability Outlook
- 15.1 Technology Landscape and Maturity
- 15.2 Product, Process and Service Innovation
- 15.3 AI, Automation and Digital Tools in the Industry
- 15.4 Technology Adoption and Performance Benchmarking
- 15.5 Innovation Pipeline and R&D Investment
- 15.6 Patent and Intellectual Property Trends
- 15.7 Energy Efficiency and Resource Management
- 15.8 Sustainability, Recycling and Circularity
- 15.9 Technology Roadmap, 2025-2035
- 15.10 Risks of Obsolescence and Technology Substitution
Chapter 16 Australia Electric Vehicle Charging Networks and Infrastructure Market Key Strategic Imperatives
- 16.1 Growth and Market Entry Priorities
- 16.2 High-Return Products and Segments
- 16.3 Pricing, Profitability and Cost Optimization
- 16.4 Technology Investment and Product Differentiation
- 16.5 Supply Chain Localization and Resilience
- 16.6 Distribution and Customer Acquisition
- 16.7 Partnership, Acquisition and Capacity Strategy
- 16.8 Regional Expansion Priorities
- 16.9 Short-, Medium- and Long-Term Actions
Chapter 17 Competition Outlook
- 17.1 Industry Competition Characteristics
- 17.2 Market Structure and Concentration
- 17.3 Market Share and Competitive Positioning, 2025
- 17.4 Company-Wise Revenue and Product Benchmarking
- 17.5 Production and Service Capacity Benchmarking
- 17.6 Technology, Pricing and Differentiation
- 17.7 Regional Footprint and Distribution Strength
- 17.8 Mergers, Acquisitions and Strategic Alliances
- 17.9 New Entrants and Competitive Threats
- 17.10 Porter's Five Forces and Industry Attractiveness
- 17.11 Competitive Outlook, 2025-2035
Chapter 18 Company Profiles
- 18.1 Company Coverage and Selection Criteria
- 18.2 JET Charge
- 18.2.1 Business Description
- 18.2.2 Company Ownership and Geographic Presence
- 18.2.3 Product and Service Portfolio
- 18.2.4 Manufacturing and Operating Footprint
- 18.2.5 Production Capacity and Expansion Plans
- 18.2.6 Financial Performance and Investment
- 18.2.7 Market Share and Competitive Position
- 18.2.8 Technology and Innovation Capabilities
- 18.2.9 Strategic Alliances or Partnerships
- 18.2.10 Recent Developments
- 18.2.11 Growth Strategy and Outlook
- 18.3 Chargefox
- 18.4 Evie Networks
- 18.5 Exploren
- 18.6 Tesla Supercharger Australia
- 18.7 NRMA Electric
- 18.8 Ampol AmpCharge
- 18.9 JOLT
- 18.10 BP Pulse Australia
- 18.11 Evnex
- 18.12 Other Relevant Market Participants
Note: Every listed company is profiled on the structure shown under the first company. The company list is preliminary and may change based on research findings, market developments, data availability and client requirements.
Chapter 19 Disclaimer
- 19.1 Research and Forecast Disclaimer
- 19.2 Data Source and Estimation Limitations
Note: The depth of individual sections depends on data availability for this market. Volume, capacity, trade and other unit-based metrics are included where applicable.

