Market Overview:
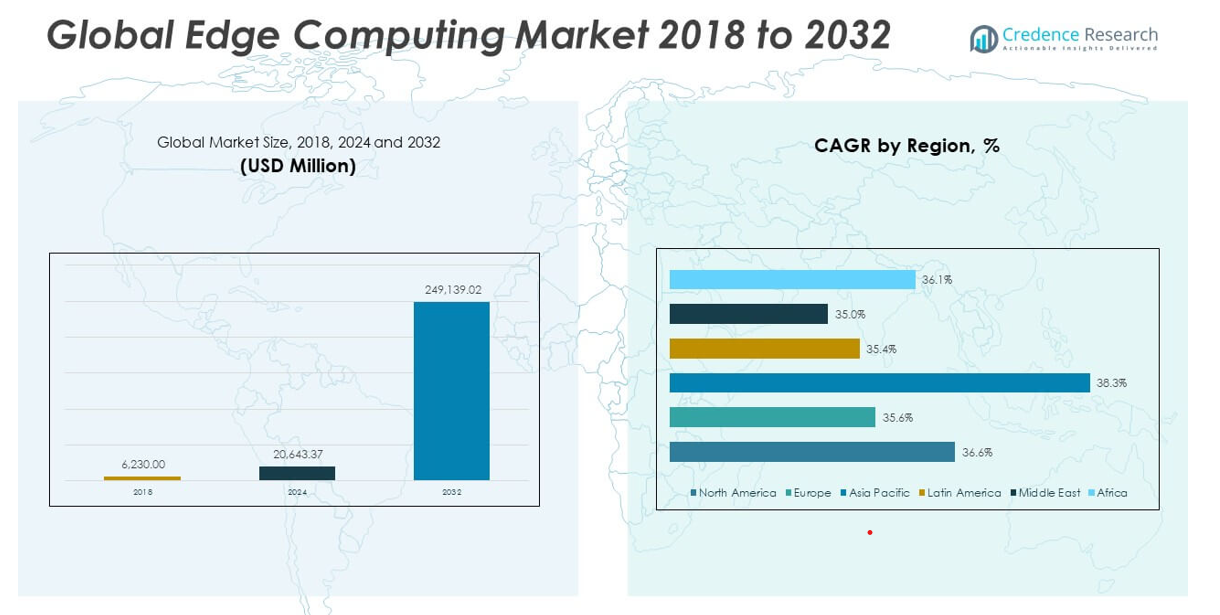
The Edge Computing Market size was valued at USD 6,230.00 million in 2018 to USD 20,643.37 million in 2024 and is anticipated to reach USD 2,49,139.02 million by 2032, at a CAGR of 36.61% during the forecast period.
| REPORT ATTRIBUTE |
DETAILS |
| Historical Period |
2020-2023 |
| Base Year |
2024 |
| Forecast Period |
2025-2032 |
| Edge Computing Market Size 2024 |
USD 20,643.37 million |
| Edge Computing Market, CAGR |
36.61% |
| Edge Computing Market Size 2032 |
USD 2,49,139.02 million |
The edge computing market is experiencing strong momentum due to the rapid expansion of IoT devices across industries, which necessitates faster and localized data processing to minimize latency and reduce bandwidth usage. The ongoing deployment of 5G networks is further enabling real-time, high-speed data transmission, supporting applications such as autonomous vehicles, augmented reality, and industrial automation. Growing concerns around data privacy and regulatory compliance are pushing organizations to process sensitive data closer to the source. Additionally, advancements in edge hardware, along with the integration of AI and machine learning capabilities at the edge, are driving adoption by enabling intelligent decision-making without relying on centralized cloud systems.
North America leads the edge computing market, supported by early adoption, a strong presence of cloud service providers, and high digital maturity across industries. The Asia-Pacific region is emerging as the fastest-growing market, fueled by large-scale 5G infrastructure rollouts, rapid urbanization, and increasing investments in smart city and industrial IoT initiatives. Europe follows closely, driven by technological innovation and demand from sectors such as automotive, healthcare, and manufacturing. Latin America, the Middle East, and Africa are gradually expanding their edge computing capabilities, supported by digital transformation efforts and infrastructure development initiatives aimed at enhancing connectivity and operational efficiency.
Market Insights:
- The Edge Computing Market is witnessing rapid growth, rising from USD 6,230.00 million in 2018 to USD 20,643.37 million in 2024, and is projected to reach USD 2,49,139.02 million by 2032, growing at a CAGR of 36.61%.
- The expanding IoT ecosystem across industries is driving the need for localized, low-latency data processing, making edge computing essential for applications in manufacturing, retail, and transportation.
- 5G deployment is accelerating adoption, enabling real-time, high-bandwidth applications like connected vehicles, augmented reality, and industrial automation, supported by mobile edge computing (MEC).
- Data privacy regulations and sovereignty requirements are encouraging enterprises to adopt edge architectures, ensuring compliance by keeping sensitive data within local boundaries.
- AI integration at the edge is enabling real-time intelligence, allowing businesses to automate operations, detect anomalies, and deliver faster decision-making without relying on cloud latency.
- High deployment costs and system complexity remain challenges, particularly for SMEs, due to the need for distributed infrastructure, specialized hardware, and reliable power and security setups.
- North America leads the global market, followed by fast-growing Asia-Pacific and technologically advanced Europe, while Latin America, the Middle East, and Africa expand through digital transformation efforts.
Access crucial information at unmatched prices!
Request your sample report today & start making informed decisions powered by Credence Research Inc.!
Download Sample
Market Drivers:
Expansion of IoT Ecosystems Demands Faster and Localized Data Processing
The rapid expansion of Internet of Things (IoT) ecosystems across industries is a major catalyst for the growth of the Edge Computing Market. Connected devices across sectors such as manufacturing, healthcare, transportation, and retail are generating massive volumes of data that require immediate processing. Traditional cloud models often struggle to deliver real-time responsiveness due to latency and bandwidth constraints. Edge computing addresses this challenge by moving computation closer to the data source, enabling faster decision-making and improved operational efficiency. It enhances data security by minimizing transmission and reducing exposure to centralized data breaches. Organizations are increasingly turning to edge infrastructure to support smart manufacturing lines, predictive maintenance, and sensor-driven applications.
- For example, Rockwell Automation’s OptixEdge gateway, launched in June 2025, processes data directly at the machine level, enabling real-time analysis and decision-making on production lines.
5G Rollout Creates Scalable Infrastructure for Edge Application Deployment
The global rollout of 5G networks is creating a scalable foundation for deploying edge computing solutions. With its ultra-low latency, high throughput, and device density support, 5G enables mission-critical applications such as autonomous vehicles, smart cities, and augmented reality. The Edge Computing Market is benefiting from this synergy, as enterprises invest in edge infrastructure to complement their 5G investments. Telecom operators are integrating edge nodes within their networks to support mobile edge computing (MEC), offering real-time services with enhanced performance. This convergence of technologies allows for greater reliability and supports distributed application architectures. It is accelerating innovation across sectors that demand seamless, responsive computing environments.
Data Sovereignty and Privacy Regulations Encourage Localized Processing
Stringent data sovereignty and privacy regulations across regions are pushing enterprises to rethink data management strategies. The Edge Computing Market is gaining traction due to its ability to process and store data locally, helping organizations comply with laws that restrict cross-border data flow. Governments and regulatory bodies in Europe, North America, and Asia-Pacific are enforcing policies that prioritize data localization, especially in sensitive industries like finance and healthcare. Edge architecture aligns with these requirements by keeping data at or near its point of origin, reducing the risk of exposure. It also enables faster compliance reporting and monitoring. Businesses are increasingly leveraging edge systems to balance performance with regulatory alignment.
Integration of AI at the Edge Enhances Real-Time Decision-Making Capabilities
Artificial intelligence is becoming a core component of edge computing systems, transforming the way data is processed and acted upon in real time. The Edge Computing Market is evolving rapidly as AI models are now deployed directly on edge devices, enabling intelligent automation without reliance on central servers. This integration allows organizations to detect anomalies, predict outcomes, and respond to events instantly. Industries such as retail, logistics, and energy are adopting AI-enabled edge systems to improve customer experience, optimize operations, and reduce downtime. It supports use cases where latency and connectivity are critical constraints. The combination of edge and AI is driving the next generation of adaptive, resilient computing infrastructure.
- For instance, Dell NativeEdge was deployed in a national grocery chain to provide centralized monitoring and lifecycle management across 1,100 stores, 275 trucks, and 55 warehouses, ensuring regulatory compliance and operational efficiency by processing sensitive data locally.
Market Trends:
Growing Shift Toward Industry-Specific Edge Solutions with Vertical Customization
Enterprises are increasingly adopting edge computing architectures tailored to the specific requirements of their industry verticals. The Edge Computing Market is witnessing a clear trend where companies no longer seek generic edge platforms but demand solutions optimized for use cases such as remote oilfield monitoring, precision agriculture, or automated retail checkout. Vendors are responding by creating industry-specific hardware and software bundles that align with operational workflows, environmental conditions, and regulatory standards. This customization improves deployment efficiency and boosts ROI. It also reduces integration complexity by offering edge-native analytics, device management, and compliance features. Organizations benefit from faster implementation and more targeted performance outcomes.
- For example, Hewlett Packard Enterprise (HPE)has developed the Edgeline EL8000 Converged Edge System, a ruggedized platform specifically designed for industrial and energy sector deployments. This system supports up to four Intel Xeon Scalable processors and offers up to 3 TB of memory in a compact chassis, enabling real-time analytics and operational technology (OT) integration at remote or harsh sites.
Rise of Edge-to-Cloud Integration to Ensure Unified Data Management
Organizations are increasingly implementing integrated edge-to-cloud architectures to unify data flow, analytics, and orchestration across distributed systems. The Edge Computing Market is advancing toward a hybrid computing model where edge nodes perform real-time tasks, while centralized cloud systems manage long-term analytics, storage, and policy enforcement. This trend addresses the need for scalability, governance, and cross-location synchronization. Vendors are investing in platforms that facilitate seamless coordination between edge and cloud layers, using centralized dashboards and APIs. Enterprises prefer this approach to avoid data silos and enable consistent application behavior across environments. It provides the agility to shift workloads dynamically between edge and cloud, based on performance and cost considerations.
- For example, AWS extends its cloud to the edge with AWS Outposts and AWS Wavelength, providing single-digit millisecond latencies for 5G and IoT applications. AWS Snow Family devices, such as Snowball Edge, offer up to 104 vCPUs and 28 TB of usable storage for disconnected or rugged edge environments. These solutions maintain consistent developer experience and security controls across cloud and edge, supporting unified data management and orchestration.
Increased Adoption of Containerization and Microservices at the Edge
Containerization and microservices are becoming standard architectural choices in edge deployments due to their modularity and scalability. The Edge Computing Market is experiencing a surge in lightweight, portable application frameworks that run efficiently on constrained edge devices. This trend supports agile development and continuous deployment, allowing faster innovation and adaptation to changing requirements. It also enables better resource utilization and easier management of distributed systems. Companies are embracing Kubernetes and other orchestration tools to manage edge workloads with cloud-like efficiency. These technologies simplify updates, ensure resilience, and promote interoperability across vendor ecosystems. The shift is redefining how edge applications are designed and maintained.
Surging Demand for Zero-Touch Provisioning and Remote Lifecycle Management
The need for scalable, remote edge infrastructure is driving interest in zero-touch provisioning and automated device management. The Edge Computing Market is adopting tools that enable IT teams to deploy, configure, and monitor edge nodes without on-site intervention. This trend is critical for large-scale rollouts across geographically dispersed sites, such as retail chains, logistics hubs, and field operations. Enterprises require consistent policies, rapid fault resolution, and centralized visibility, which these systems deliver. It reduces operational costs and minimizes downtime. Vendors are enhancing edge platforms with AI-driven monitoring, automated firmware updates, and self-healing capabilities to support these evolving requirements.
Market Challenges Analysis:
High Infrastructure Costs and Complexity of Deployment at Scale
One of the primary challenges in the Edge Computing Market is the significant upfront investment required to establish a robust and scalable edge infrastructure. Organizations must allocate capital for edge servers, gateways, sensors, and connectivity solutions, all of which demand careful configuration and integration. Unlike centralized cloud models, edge computing environments require distributed hardware across multiple locations, which increases deployment complexity. Businesses often face difficulties managing power supply, environmental conditions, and physical security for edge nodes in remote or harsh locations. The lack of standardized deployment frameworks further complicates the process, requiring custom solutions that raise costs and implementation timelines. These challenges can slow adoption, especially among small to mid-sized enterprises with limited resources.
Security Vulnerabilities and Limited Visibility Across Distributed Edge Networks
Managing cybersecurity across a dispersed edge infrastructure remains a critical concern for stakeholders. The Edge Computing Market faces increasing pressure to address data integrity, access control, and threat detection in decentralized environments. Edge nodes often operate in unmonitored or physically exposed settings, making them vulnerable to tampering, unauthorized access, or physical damage. It becomes difficult for IT teams to maintain consistent security protocols and real-time monitoring across hundreds or thousands of devices. Fragmented device ecosystems and inconsistent firmware versions create additional risks that malicious actors can exploit. Organizations must invest in advanced security frameworks, endpoint protection, and automated patching systems to safeguard edge assets, which adds complexity to lifecycle management.
Market Opportunities:
Emergence of Smart Cities and Intelligent Transportation Systems Creates Scalable Edge Demand
The global shift toward smart city development presents a significant opportunity for the Edge Computing Market. Urban infrastructure increasingly relies on real-time data from traffic systems, surveillance networks, and public utilities, requiring localized processing to ensure speed and efficiency. Edge computing enables instant analytics and decision-making at the point of data generation, reducing the burden on centralized systems. Governments and municipalities are deploying intelligent transportation networks, autonomous traffic controls, and smart energy grids that depend on edge capabilities. It allows seamless service delivery and supports public safety, environmental monitoring, and energy optimization. This trend is opening long-term avenues for vendors to deliver tailored, large-scale edge solutions.
Expansion of Industrial IoT and Remote Operations Unlocks New Business Models
Industrial sectors such as oil and gas, manufacturing, and mining are embracing edge computing to power remote operations and asset monitoring. The Edge Computing Market is gaining traction in environments where cloud connectivity is unreliable or cost-prohibitive. It allows businesses to run analytics, detect anomalies, and automate processes locally, increasing uptime and operational resilience. This opportunity is especially critical for facilities in offshore, rural, or hazardous locations. Edge-driven automation and predictive maintenance reduce the need for on-site intervention and optimize resource usage. Enterprises are leveraging these capabilities to create new revenue streams and enhance operational intelligence.
Market Segmentation Analysis:
The Edge Computing Market is segmented by product, organization size, end-user, and application, each contributing uniquely to its growth.
By product, hardware dominates the market, driven by the widespread deployment of edge nodes, gateways, and servers to support real-time data processing at the network edge. Software and edge-managed platforms are growing steadily, offering orchestration, analytics, and remote management capabilities, while services play a critical role in deployment and maintenance.
- For example, Dell’s PowerEdge XR4000 is a rugged, edge-optimized server designed for real-time data processing in harsh environments. According to Dell’s official datasheet (2024), the XR4000 supports up to 16 cores per Intel Xeon D processor, up to 2 TB DDR4 ECC memory, and is tested for operation in temperatures from -5°C to 55°C.
By organization size, large enterprises lead the adoption due to their advanced digital infrastructure, while small and medium enterprises are rapidly embracing edge solutions to improve agility and reduce latency.
By end-user, the industrial sector holds a significant share due to strong demand for automation, predictive maintenance, and real-time control. Other major contributors include healthcare, manufacturing, telecom & IT, transportation, and retail, each leveraging edge computing to enable faster decision-making. The Edge Computing Market also serves emerging sectors like smart agriculture, wearables, and government services.
By application, industrial IoT and smart cities are key segments, followed by remote monitoring, connected cars, AR/VR, and video analytics. It continues to evolve with diverse use cases demanding scalable, decentralized computing solutions across industries.
- For example, Rockwell’s FactoryTalk Edge Gateway aggregates and contextualizes data from thousands of industrial assets. Rockwell’s 2024 product sheet highlights support for real-time data streamingand integration with cloud analytics.
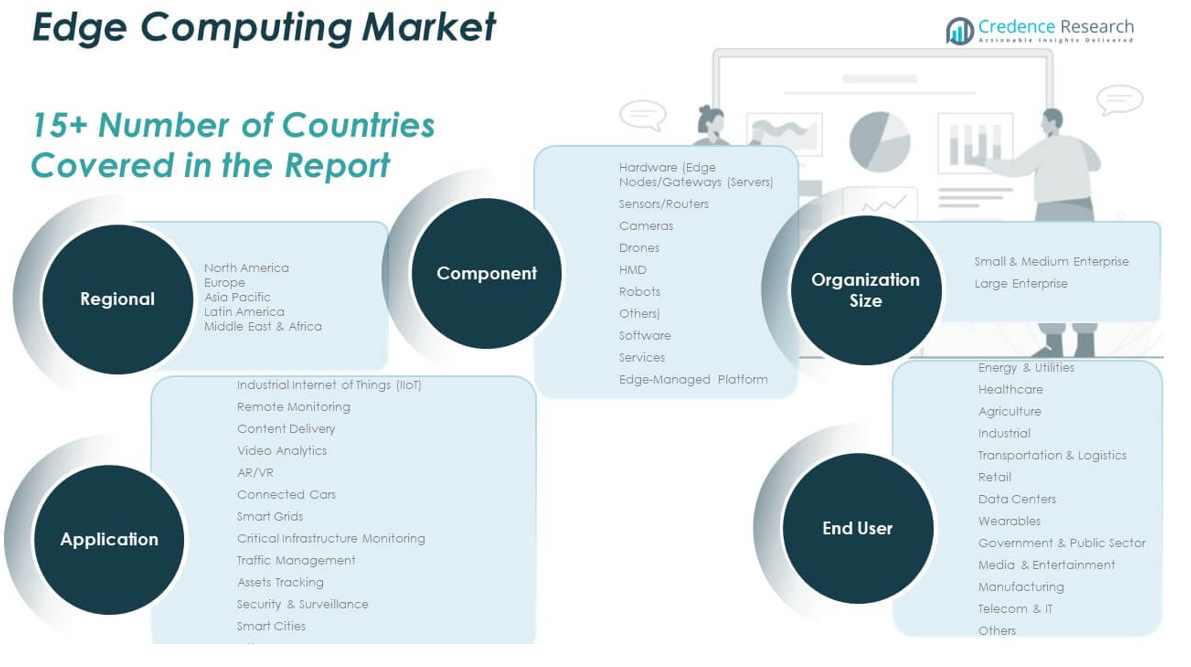
Segmentation:
By Product /Component
- Hardware (Edge Nodes/Gateways/Servers)
- Software
- Services
- Edge-Managed Platform
By Organization Size
- Small & Medium Enterprises (SMEs)
- Large Enterprises
By End-User
- Energy & Utilities
- Healthcare
- Agriculture
- Industrial
- Transportation & Logistics
- Retail
- Data Centers
- Wearables
- Government & Public Sector
- Media & Entertainment
- Manufacturing
- Telecom & IT
- Others
By Application
- Industrial Internet of Things (IIoT)
- Remote Monitoring
- Content Delivery
- Video Analytics
- AR/VR
- Connected Cars
- Smart Grids
- Critical Infrastructure Monitoring
- Traffic Management
- Asset Tracking
- Security & Surveillance
- Smart Cities
- Others
By Regional
- North America
- Europe
- Germany
- France
- U.K.
- Italy
- Spain
- Rest of Europe
- Asia Pacific
- China
- Japan
- India
- South Korea
- South-east Asia
- Rest of Asia Pacific
- Latin America
- Brazil
- Argentina
- Rest of Latin America
- Middle East & Africa
- GCC Countries
- South Africa
- Rest of the Middle East and Africa
Regional Analysis:
North America
The North America Edge Computing Market size was valued at USD 2,507.58 million in 2018 to USD 8,218.00 million in 2024 and is anticipated to reach USD 98,880.78 million by 2032, at a CAGR of 36.6% during the forecast period. North America holds the largest share in the global Edge Computing Market, accounting for nearly 38% of total revenue. It benefits from the presence of leading cloud service providers, high technology adoption rates, and mature digital infrastructure. Enterprises in the U.S. and Canada have been early adopters of edge-enabled use cases in manufacturing, retail, and automotive. It also sees strong investments in AI-driven edge applications and mobile edge computing. Government support for 5G and data sovereignty policies further accelerates regional growth.
Europe
The Europe Edge Computing Market size was valued at USD 1,513.89 million in 2018 to USD 4,805.21 million in 2024 and is anticipated to reach USD 54,499.82 million by 2032, at a CAGR of 35.6% during the forecast period. Europe accounts for nearly 21% of the global market share, with strong traction in industrial automation, connected vehicles, and energy management. Countries like Germany, France, and the U.K. lead adoption due to robust manufacturing ecosystems and growing focus on data protection regulations such as GDPR. The market is witnessing strategic collaborations among telecom operators and technology vendors to develop regional edge infrastructure. It benefits from EU-led initiatives in smart mobility and edge AI. The emphasis on decarbonization and efficiency further enhances demand for edge-based solutions.
Asia Pacific
The Asia Pacific Edge Computing Market size was valued at USD 1,326.99 million in 2018 to USD 4,620.93 million in 2024 and is anticipated to reach USD 61,764.25 million by 2032, at a CAGR of 38.3% during the forecast period. Asia Pacific holds nearly 24% of the global Edge Computing Market and represents the fastest-growing region. Rapid digital transformation, widespread IoT adoption, and large-scale 5G deployments in China, Japan, South Korea, and India drive demand. Governments are actively investing in smart cities, public safety, and connected infrastructure. It benefits from a large base of manufacturing and logistics operations that require localized data processing. Regional enterprises increasingly seek scalable and efficient edge solutions to support real-time analytics.
Latin America
The Latin America Edge Computing Market size was valued at USD 417.41 million in 2018 to USD 1,370.51 million in 2024 and is anticipated to reach USD 15,414.23 million by 2032, at a CAGR of 35.4% during the forecast period. Latin America accounts for approximately 8% of the global market and shows steady momentum as enterprises modernize their IT infrastructure. Brazil and Mexico lead regional adoption with growing interest from telecom, retail, and public sectors. It faces connectivity and power infrastructure limitations in rural areas, but urban centers are increasingly deploying smart infrastructure. Cloud providers are extending services into edge zones across the region. Demand for cost-effective, decentralized computing is expected to grow with rising mobile usage and e-commerce expansion.
Middle East
The Middle East Edge Computing Market size was valued at USD 256.68 million in 2018 to USD 800.83 million in 2024 and is anticipated to reach USD 8,795.98 million by 2032, at a CAGR of 35.0% during the forecast period. The Middle East contributes around 5% of the global Edge Computing Market and is witnessing early-stage but focused growth. Countries like the UAE and Saudi Arabia are investing in edge technologies as part of national digitization strategies. Use cases in oil and gas, smart cities, and surveillance systems are driving demand. It benefits from government-backed initiatives and tech partnerships supporting 5G and AI integration. Enterprises aim to enhance real-time visibility and reduce latency in critical operations. Local data residency requirements also support the shift toward edge infrastructure.
Africa
The Africa Edge Computing Market size was valued at USD 207.46 million in 2018 to USD 827.88 million in 2024 and is anticipated to reach USD 9,783.95 million by 2032, at a CAGR of 36.1% during the forecast period. Africa currently holds the smallest market share, close to 4%, but exhibits promising growth potential. Telecommunications infrastructure development and mobile penetration are key drivers. South Africa, Nigeria, and Kenya are leading in smart agriculture, fintech, and e-health deployments. It remains challenged by limited broadband reach and power reliability in remote areas. Governments and NGOs are actively supporting digital inclusion, which helps build edge readiness. Edge computing is increasingly seen as a solution to local processing needs in underconnected regions.
Shape Your Report to Specific Countries or Regions & Enjoy 30% Off!
Key Player Analysis:
- Emerson Electric
- Amazon Web Services (AWS), Inc.
- Aricent, Inc.
- Atos
- Cisco Systems, Inc.
- General Electric Company
- Hewlett Packard Enterprise Development
- Honeywell International Inc.
- Huawei Technologies Co., Ltd.
- IBM Corporation
- Intel Corporation
- Microsoft Corporation
- Rockwell Automation, Inc.
- SAP SE
- Siemens AG
Competitive Analysis:
The Edge Computing Market is highly competitive, with key players focusing on expanding their capabilities through partnerships, acquisitions, and innovative product development. Major companies such as Amazon Web Services, Microsoft Corporation, Google LLC, IBM Corporation, and Cisco Systems dominate the landscape by offering integrated edge-cloud solutions. It continues to attract emerging players and specialized vendors that provide industry-specific edge platforms and hardware. Market participants are investing in edge AI, zero-touch provisioning, and hybrid orchestration to differentiate their offerings. Telecom operators are also playing a critical role by embedding edge nodes into 5G infrastructure. The competition is intensifying as enterprises seek scalable, secure, and real-time data processing at the edge. Strategic alliances between cloud providers, network operators, and industrial players are shaping the future trajectory of this market. It remains dynamic, with continuous innovation driving new applications across verticals such as manufacturing, automotive, retail, and healthcare.
Recent Developments:
- In June 2025, IXAfrica, which operates East Africa’s first hyperscale, AI-ready data center, entered into a strategic partnership with global cloud-edge provider EdgeNext. This collaboration aims to accelerate digital infrastructure development across East Africa by combining EdgeNext’s global edge platform—including CDN, bare-metal cloud, and edge compute with IXAfrica’s advanced Nairobi campus.
- In March 2025, Indian semiconductor startup Netrasemiannounced the launch of its first AI-optimized system-on-chip (SoC) specifically designed for edge computing applications. This product launch marks a significant step for Netrasemi in addressing the growing demand for AI-enabled edge devices, supporting advanced data processing and analytics at the edge.
- In April 2025, Emerson Electriclaunched the DeltaV™ SaaS SCADA with Edge Connect, a new edge solution designed to simplify SCADA architecture and accelerate the integration of field devices with cloud-hosted supervisory control systems. This product leverages edge computing to provide rapid, secure data mobility and operational visibility, supporting safer and more flexible industrial control.
Market Concentration & Characteristics:
The Edge Computing Market exhibits moderate to high market concentration, with a few dominant players holding significant shares due to their established cloud, hardware, and networking portfolios. It is characterized by rapid technological advancement, strong reliance on partnerships, and a high degree of innovation. The market features a blend of global tech giants and niche vendors offering specialized edge solutions tailored to industry-specific needs. It continues to evolve with growing demand for low-latency processing, edge AI integration, and hybrid cloud-edge architectures. The competitive environment encourages continuous investment in R&D, product differentiation, and strategic alliances. It supports a wide range of applications across sectors such as manufacturing, energy, transportation, and healthcare, creating a dynamic and multi-layered ecosystem.
Report Coverage:
The research report offers an in-depth analysis based on product, organization size, end-user, and application. It details leading market players, providing an overview of their business, product offerings, investments, revenue streams, and key applications. Additionally, the report includes insights into the competitive environment, SWOT analysis, current market trends, as well as the primary drivers and constraints. Furthermore, it discusses various factors that have driven market expansion in recent years. The report also explores market dynamics, regulatory scenarios, and technological advancements that are shaping the industry. It assesses the impact of external factors and global economic changes on market growth. Lastly, it provides strategic recommendations for new entrants and established companies to navigate the complexities of the market.
Future Outlook:
- Edge computing will play a central role in enabling real-time AI across critical industries.
- Integration with 5G networks will expand low-latency applications in mobility and public safety.
- Industrial IoT deployments will drive demand for localized processing in manufacturing.
- Cloud-edge hybrid models will become standard for enterprise IT architecture.
- Retail, logistics, and healthcare sectors will scale edge deployments for operational efficiency.
- Growth in autonomous systems will require high-performance edge infrastructure.
- Energy-efficient edge hardware will gain traction to support sustainable computing goals.
- Telecom operators will monetize edge services through MEC-enabled solutions.
- Emerging economies will adopt edge computing to overcome infrastructure constraints.
- Security solutions for distributed edge environments will become a key investment area.


