
Market Overview
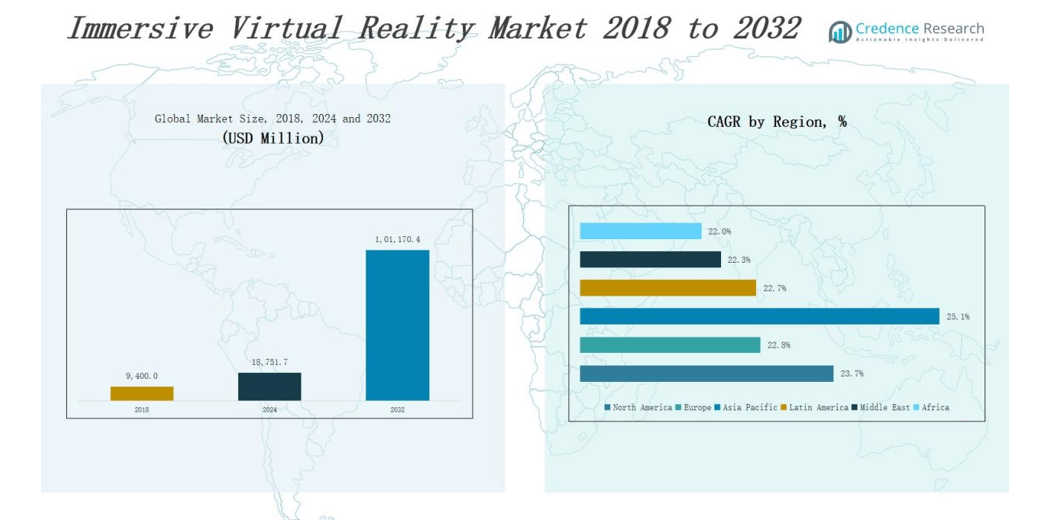
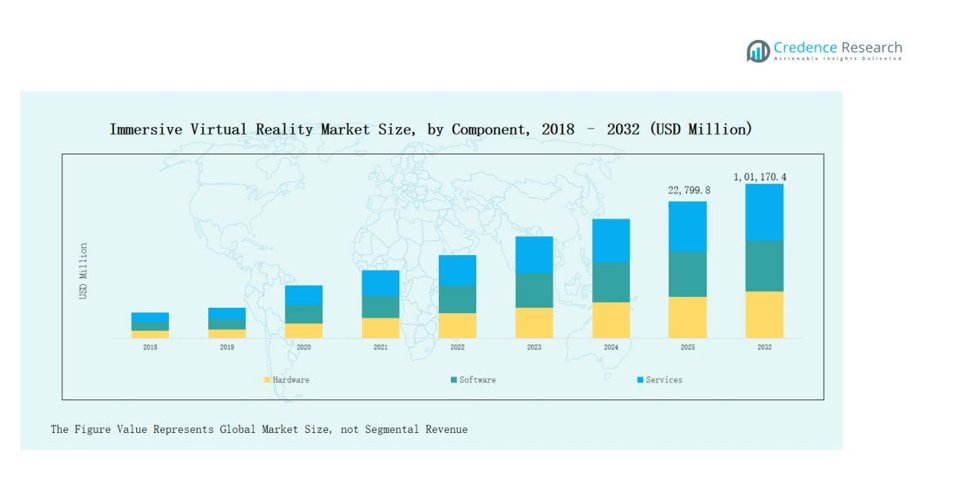
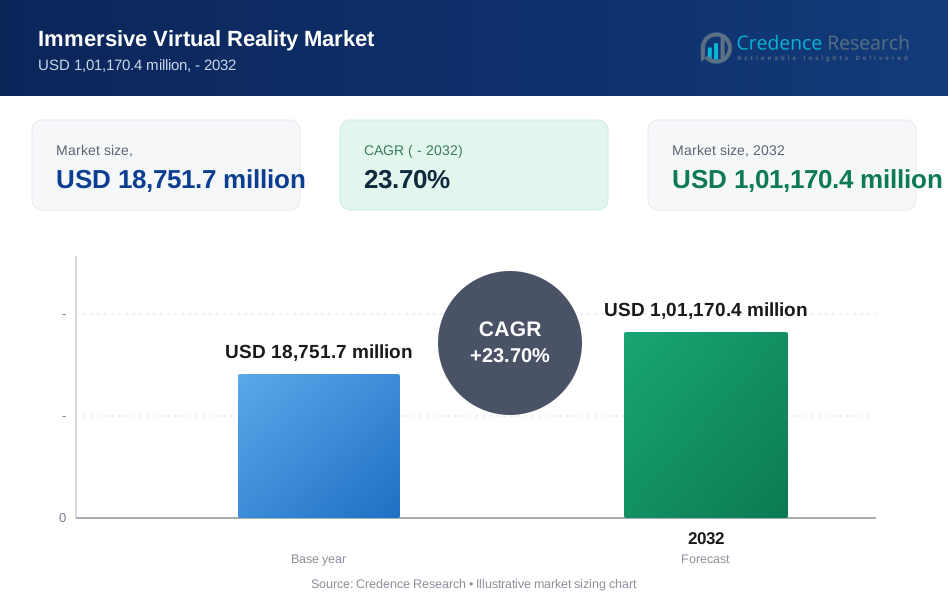
Immersive Virtual Reality Market size was valued at USD 9,400.0 million in 2018 to USD 18,751.7 million in 2024 and is anticipated to reach USD 1,01,170.4 million by 2032, at a CAGR of 23.7% during the forecast period.
| REPORT ATTRIBUTE | DETAILS |
|---|---|
| Historical Period | 2020-2023 |
| Base Year | 2024 |
| Forecast Period | 2025-2032 |
| Immersive Virtual Reality Market Size 2024 | USD 18,751.7 million |
| Immersive Virtual Reality Market, CAGR | 23.7% |
| Immersive Virtual Reality Market Size 2032 | USD 1,01,170.4 million |
The immersive virtual reality market is shaped by major players such as Meta Platforms, Sony Corporation, HTC Corporation, Samsung Electronics, Microsoft Corporation, and Varjo Technologies. These companies focus on advancing hardware performance, developing high-quality headsets, and expanding VR content ecosystems to capture consumer and enterprise demand. North America leads the immersive virtual reality market with a 33 percent share, supported by strong adoption in gaming, healthcare, and enterprise training, alongside significant investments from technology giants and favorable infrastructure for innovation.
Market Insights
- The Immersive Virtual Reality Market grew from USD 9,400.0 million in 2018 to USD 18,751.7 million in 2024, with strong global momentum.
- Market is projected to reach USD 1,01,170.4 million by 2032, expanding steadily at a robust CAGR of 23.7 percent.
- Major players include Meta Platforms, Sony Corporation, HTC Corporation, Samsung Electronics, Microsoft Corporation, and Varjo Technologies driving innovation in hardware and VR ecosystems.
- North America leads with 33 percent share in 2024, supported by gaming, healthcare, enterprise training, and strong technology infrastructure investments.
- Asia Pacific follows as fastest-growing with 25 percent share, fueled by 5G expansion, gaming adoption, and rising education and retail applications.
Market Segment Insights
By Component
Hardware dominates the immersive virtual reality market with a 61 percent share. Growth is supported by rising adoption of head-mounted displays, gesture-tracking devices, and high-resolution projectors. Demand is driven by expanding gaming applications, training simulations, and defense-based visualization programs. Hardware also benefits from rapid innovation in lightweight wearables, improved graphics, enhanced display technology, and strong integration with artificial intelligence and cloud platforms.
- For instance, Meta launched its Quest 3 headset in 2023 with a slimmer design and mixed‑reality passthrough powered by Qualcomm’s XR2 Gen 2 chipset
By Technology
Semi and fully immersive technologies lead the market with a 68 percent share. Their growth is fueled by rising demand for realistic simulations in gaming, defense, and enterprise training. These technologies deliver higher user engagement, making them preferred for education, medical training, and entertainment. Non-immersive systems maintain relevance in cost-sensitive industries but represent a smaller portion. Increasing adoption of fully immersive solutions in aerospace, automotive design, and healthcare drives overall expansion, supported by strong R&D investment.
- For instance, the U.S. Army adopted Microsoft’s Integrated Visual Augmentation System (IVAS), based on HoloLens 2, to improve soldier training through mixed and fully immersive simulations.
By End Use Vertical
Gaming dominates the immersive virtual reality market with a 32 percent share. Growth is driven by demand for interactive experiences, e-sports expansion, and VR-compatible game titles. Media and entertainment follow, supported by rising VR-based streaming and cinematic experiences. Education and healthcare also contribute significantly, using VR for immersive learning and medical simulations. Retail and e-commerce use cases are growing rapidly, focusing on virtual shopping, enhanced product visualization, and improving consumer engagement through immersive online platforms.
Market Overview
Rising Demand in Gaming and Entertainment
The gaming and entertainment sector is the largest growth driver of immersive virtual reality. High consumer demand for interactive experiences, coupled with the popularity of e-sports and VR-enabled games, fuels market expansion. Cinematic content, theme parks, and live concerts increasingly leverage VR to enhance customer engagement. Advancements in VR hardware, including lightweight headsets and improved resolution, further strengthen adoption. Global investments in immersive storytelling and 360-degree content ensure continued growth, positioning gaming and entertainment as the backbone of the immersive VR market.
- For instance, Walt Disney Imagineering has experimented with mixed reality attractions such as the Star Wars: Galaxy’s Edge integration, giving visitors VR-enhanced rides and interactive storytelling.
Expanding Use in Training and Education
Immersive virtual reality is transforming education and training across industries. In healthcare, VR-based simulations enable medical professionals to practice complex procedures in risk-free environments. In aerospace, defense, and manufacturing, VR delivers realistic simulations for skill development and safety training. Universities and schools increasingly adopt VR for interactive classrooms, enhancing learning retention and student engagement. The ability to replicate real-world scenarios drives demand across both corporate and academic sectors. This trend positions VR as a cost-effective and scalable solution for advanced learning applications.
- For instance, Stanford Medicine has used Osso VR’s surgical training platform, which studies show improves surgeon performance by up to 230% compared to traditional training methods.
Technological Advancements and Integration
Advancements in hardware, software, and connectivity accelerate immersive virtual reality adoption. High-resolution displays, faster processors, and gesture-tracking devices improve user experiences significantly. Integration with artificial intelligence, 5G networks, and cloud platforms further expands VR’s potential, enabling seamless streaming and multi-user collaboration. Companies continue investing heavily in research and development to reduce latency and enhance realism. These improvements attract industries such as retail, automotive, and real estate, where immersive design and visualization provide competitive advantages. Technology-driven innovation remains a critical driver of market growth globally.
Key Trends & Opportunities
Growth of Enterprise and Industrial Applications
While gaming leads adoption, enterprises increasingly embrace VR for business applications. Automotive firms use VR for design visualization, while retailers deploy immersive tools for product demonstrations and customer engagement. The healthcare sector invests in VR therapy and patient rehabilitation, opening new opportunities. Industrial training programs also benefit from VR, enhancing workforce safety and productivity. As companies seek to reduce costs and improve efficiency, enterprise-driven demand for VR applications creates significant growth opportunities, extending the market well beyond traditional entertainment use cases.
- For instance, IKEA launched its VR Kitchen Experience through Steam, allowing customers to test kitchen layouts in a virtual space ahead of purchase decisions.
Emergence of Cloud-Based and Social VR Platforms
Cloud-based VR solutions are gaining traction, offering scalable and cost-efficient platforms. With 5G deployment, users can access high-quality VR content with reduced latency, supporting real-time collaboration. Social VR platforms, which allow users to interact in shared digital environments, are expanding quickly. Businesses, entertainment providers, and educational institutions are leveraging this trend to create engaging experiences. These platforms foster community building, remote collaboration, and new revenue models, such as virtual events and VR advertising. The rise of cloud-driven, socially immersive VR is a major opportunity.
- For instance, NVIDIA’s CloudXR platform allows enterprises to stream VR and AR experiences from RTX-powered servers to lightweight devices, removing the need for high-end hardware.
Key Challenges
High Hardware and Deployment Costs
Immersive virtual reality systems remain costly, limiting adoption among consumers and small enterprises. High-end headsets, gesture-tracking devices, and supporting infrastructure create significant upfront investments. Businesses face additional expenses for software customization, training, and maintenance. Although prices are gradually falling, affordability continues to hinder large-scale penetration. Cost challenges are especially critical in emerging markets where purchasing power is lower. Without further reductions in hardware and deployment costs, widespread adoption across industries may remain constrained, slowing overall market growth potential in the coming years.
Health and Safety Concerns
Prolonged use of immersive VR devices often causes discomfort such as eye strain, motion sickness, and fatigue. These issues restrict usage time and raise concerns about long-term health impacts. In professional applications, employee safety becomes a key concern if VR-based training sessions lead to physical disorientation. Healthcare providers and regulators closely monitor these risks, which may delay adoption in sensitive industries. Addressing ergonomic design, reducing latency, and improving motion-tracking accuracy are critical to overcoming safety challenges. Until resolved, health risks remain a market restraint.
Content Limitations and Standardization Issues
The immersive VR market faces challenges from limited content availability and lack of standardization. High-quality VR content production requires significant investment, restricting variety across applications. Industries such as education and healthcare struggle with a shortage of tailored VR modules. In addition, interoperability issues across devices and platforms hinder seamless user experiences. The absence of universal standards slows integration between hardware, software, and applications. These limitations affect user adoption, particularly in enterprise environments. Overcoming content gaps and establishing standards is vital for sustainable market expansion.
Regional Analysis
North America
North America dominates the immersive virtual reality market, holding a 33 percent share in 2024. The region benefits from strong adoption of VR technologies in gaming, healthcare, and enterprise training. The U.S. drives growth with robust investments in content development, while Canada and Mexico expand industrial and educational VR applications. High spending on advanced headsets, coupled with a mature digital infrastructure, supports rapid adoption. With revenues rising from USD 3,243.0 million in 2018 to 34,400.8 million in 2032, North America maintains leadership with a strong CAGR of 23.7 percent.
Europe
Europe accounts for a 23 percent share of the immersive virtual reality market in 2024. Countries such as the UK, Germany, and France lead adoption, driven by gaming demand, educational applications, and healthcare simulations. The region also invests heavily in VR for automotive design and manufacturing training. Government initiatives supporting digital transformation and VR integration into enterprises strengthen the market base. Revenues are projected to grow from USD 2,312.4 million in 2018 to 22,434.8 million by 2032, reflecting a healthy CAGR of 22.8 percent during the forecast period.
Asia Pacific
Asia Pacific emerges as the fastest-growing region with a 25 percent share in 2024. China, Japan, and South Korea are leading markets, supported by strong electronics manufacturing and widespread gaming adoption. India and Southeast Asia show rising demand for VR-based education and retail applications. Expanding 5G networks and cost-effective headsets accelerate adoption across diverse sectors. Regional revenues are expected to rise from USD 2,509.8 million in 2018 to 30,698.2 million by 2032, at the highest CAGR of 25.1 percent, making Asia Pacific a key global growth hub.
Latin America
Latin America captures a 9 percent share of the immersive virtual reality market in 2024. Brazil leads the region, supported by gaming adoption, retail digitization, and VR-based entertainment services. Mexico and Argentina also contribute, with increasing uptake in education and enterprise training. Limited affordability remains a barrier, but falling hardware costs support broader usage. Market revenues are forecasted to rise from USD 676.8 million in 2018 to 6,766.3 million by 2032, registering a solid CAGR of 22.7 percent. Latin America shows strong potential for wider adoption in consumer and enterprise markets.
Middle East
The Middle East holds a 6 percent share of the immersive virtual reality market in 2024. Growth is supported by investments in VR entertainment, smart city initiatives, and advanced training systems in aviation and defense. GCC countries lead, while Israel drives innovation in medical VR applications. Increasing adoption in retail and real estate visualization also boosts the market. Revenues are expected to grow from USD 385.4 million in 2018 to 3,551.6 million in 2032, at a CAGR of 22.3 percent, reflecting steady regional demand.
Africa
Africa represents a 6 percent share of the immersive virtual reality market in 2024. South Africa leads adoption, supported by gaming, healthcare training, and e-learning platforms. Egypt and Nigeria show growing interest in VR for retail and educational purposes, though affordability remains a barrier. Rising investments in digital infrastructure and local content creation are expected to expand usage. Market revenues are projected to increase from USD 272.6 million in 2018 to 3,318.7 million in 2032, with a CAGR of 22.0 percent, highlighting gradual but steady growth across the continent.
Market Segmentations:
By Component
- Hardware
- Software
- Services
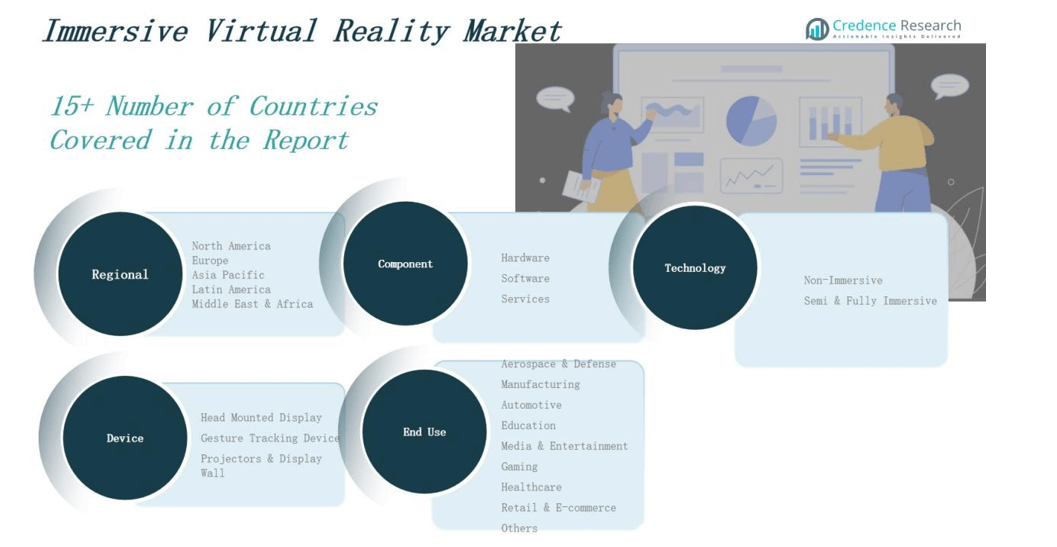
By Technology
- Non-Immersive
- Semi & Fully Immersive
By End Use Vertical
- Aerospace & Defence
- Manufacturing
- Automotive
- Education
- Media & Entertainment
- Gaming
- Healthcare
- Retail & E-commerce
- Others
By Device
- Head Mounted Display
- Gesture Tracking Device
- Projectors & Display Wall
By Region
- North America
- U.S.
- Canada
- Mexico
- Europe
- Germany
- France
- U.K.
- Italy
- Spain
- Rest of Europe
- Asia Pacific
- China
- Japan
- India
- South Korea
- South-east Asia
- Rest of Asia Pacific
- Latin America
- Brazil
- Argentina
- Rest of Latin America
- Middle East & Africa
- GCC Countries
- South Africa
- Rest of the Middle East and Africa
Competitive Landscape
The competitive landscape of the immersive virtual reality market is defined by the presence of global technology leaders and specialized innovators focusing on hardware, software, and services. Companies such as Microsoft Corporation, Meta, Sony Corporation, HTC Corporation, Samsung Electronics, and Google LLC dominate with extensive product portfolios and continuous investments in advanced VR headsets, gesture-tracking devices, and content ecosystems. These players emphasize strategic partnerships, acquisitions, and R&D to strengthen market positions and expand into enterprise, healthcare, and educational applications. Software providers like Unity Technologies, Autodesk, and EON Reality contribute significantly by offering platforms for VR content creation and enterprise solutions, while emerging firms like Magic Leap enhance competition with niche innovations. Intense rivalry centers on improving device affordability, reducing latency, and enhancing user immersion. With Asia Pacific and North America leading adoption, companies prioritize regional expansion and product differentiation, positioning immersive virtual reality as a fast-evolving and highly competitive global market.
Key Players
- Microsoft Corporation
- HTC Corporation
- Google LLC
- Magic Leap
- Meta
- Samsung Electronics Co., Ltd.
- Sony Corporation
- Unity Technologies
- Autodesk, Inc.
- EON Reality, Inc.
Recent Developments
- l In June 2025, Meta Platforms unveiled two experimental VR headsets Tiramisu and Boba 3. Tiramisu features ultra-high pixel density micro‑OLED panels (90 pixels per degree) and extreme brightness, requiring powerful GPUs and NVIDIA DLSS 3.
- l In August 2025, Shanghai-based DPVR introduced the P1 Max, designed for enterprise use with improved performance and cooling.
- In 2025, Meta Platforms collaborated with Anduril to develop EagleEye, a next-generation AR/VR helmet designed for U.S. military use, enhancing defense training and battlefield awareness.
- In 2025, Meta Platforms partnered with Disney, A24, and Lightstorm Entertainment to create exclusive VR content for its upcoming advanced headset “Loma
Market Concentration & Characteristics
The Immersive Virtual Reality Market shows a moderately concentrated structure with dominance by a few global technology leaders alongside several regional players. It is shaped by competition between hardware manufacturers, software developers, and service providers, where large firms such as Microsoft, Meta, Sony, and Samsung set industry standards through innovation and strong distribution networks. The market demonstrates high entry barriers due to significant investment needs in R&D, advanced hardware, and content development. It is characterized by rapid technological progress, frequent product launches, and strong focus on improving user experience through lightweight devices and seamless integration. Demand spans across gaming, healthcare, education, defense, and retail, creating opportunities for diverse participants. Strategic collaborations between enterprises, startups, and research institutes highlight the importance of ecosystem-driven growth. With North America and Asia Pacific leading adoption, the market reflects dynamic competition, high innovation intensity, and an increasing shift toward scalable enterprise applications and cloud-driven platforms.
Report Coverage
The research report offers an in-depth analysis based on Component, Tehcnology, End User Verical, Device and Region. It details leading market players, providing an overview of their business, product offerings, investments, revenue streams, and key applications. Additionally, the report includes insights into the competitive environment, SWOT analysis, current market trends, as well as the primary drivers and constraints. Furthermore, it discusses various factors that have driven market expansion in recent years. The report also explores market dynamics, regulatory scenarios, and technological advancements that are shaping the industry. It assesses the impact of external factors and global economic changes on market growth. Lastly, it provides strategic recommendations for new entrants and established companies to navigate the complexities of the market.
Future Outlook
- Demand for immersive gaming experiences will remain strong, supported by e-sports growth and VR-enabled titles.
- Healthcare adoption will expand, using VR for medical training, rehabilitation, therapy, and patient care applications.
- Education will increasingly integrate VR, offering interactive classrooms, immersive learning, and remote teaching experiences globally.
- Retailers will enhance customer engagement by adopting VR-based virtual shopping platforms and advanced product visualization solutions.
- Enterprises will utilize VR for design visualization, employee training, operational efficiency, and industrial safety improvement programs.
- Advancements in hardware will deliver lightweight designs, higher resolution displays, reduced latency, and affordable headset options.
- Cloud-based VR platforms will support scalability, enabling seamless collaboration, multi-user access, and immersive enterprise applications.
- Social VR environments will grow rapidly, creating new opportunities for remote interaction, entertainment, and digital communities.
- Asia Pacific adoption will surge, fueled by strong electronics production, gaming demand, and expanding 5G infrastructure.
- Content creation will accelerate, providing industry-specific solutions that reduce limitations and support wider immersive VR adoption.
Request a Free Sample
Fill in your details and we'll send you a free sample report.
- Sample data tables & charts
- Research methodology
Need a Custom Version of This Report?
Tailor the scope, geography, or segments to your exact requirements.
- Custom geography or segment scope
- Direct access to our analyst team
Frequently Asked Questions
What is the projected growth of the immersive VR market?
What are the main drivers of growth in the immersive VR market?
Which region is expected to grow the fastest?
What are the main challenges in the VR market?
Table of Content
Chapter 1. Report Introduction
- 1.1 Report Description & Purpose
- 1.1.1 Report Title & Market Definition
- 1.1.2 Unique Selling Propositions (USP) & Key Differentiators
- 1.1.3 Value Proposition for Stakeholders
- 1.2 Research Objectives
- 1.2.1 Market Sizing Objectives (Volume & Revenue)
- 1.2.2 Segmentation Objectives
- 1.2.3 Competitive Intelligence Objectives
- 1.2.4 Forecast & Scenario Objectives
- 1.3 Report Scope
- 1.3.1 Immersive Virtual Reality Scope – Types & Subtypes Covered
- 1.3.2 Geographic Scope – Regions & Countries Covered
- 1.3.3 Historical Period, Base Year & Forecast Period (the historical period; forecast to 2032)
- 1.3.4 Inclusions & Exclusions
- 1.4 HS Code & Classification Framework
- 1.5 Currency, Units & Pricing Basis
- 1.6 Target Stakeholders
- 1.7 Limitations & Assumptions
Chapter 2. Executive Summary
- 2.1 Global Immersive Virtual Reality Market Snapshot
- 2.1.1 Market Size – Historical (the historical period) & Forecast (2032) (base year: USD 18,751.7 million → 2032: USD 1,01,170.4 million)
- 2.1.2 Volume & Revenue – Global Totals
- 2.1.3 Key Market Highlights – Top Five Facts
- 2.2 Immersive Virtual Reality Market Segmentation Snapshot
- 2.2.1 Market Split by Region – vs. 2032
- 2.3 Competitive Snapshot
- 2.3.1 Top 10 Players by Revenue Share –
- 2.3.2 Top 10 Players by Volume Share –
- 2.3.3 Recent Strategic Developments (18-Month Summary)
- 2.4 Key Investment Highlights & Strategic Conclusions
Chapter 3. Immersive Virtual Reality Market Dynamics & Industry Analysis
- 3.1 Market Overview & Context
- 3.1.1 Immersive Virtual Reality Market Position in the Broader Automotive Value Chain
- 3.1.2 OEM vs. Replacement Market Dynamics
- 3.1.3 Market Maturity & Development Stage by Region
- 3.2 Immersive Virtual Reality Market Drivers
- 3.3 Immersive Virtual Reality Market Restraints & Challenges
- 3.4 Immersive Virtual Reality Market Opportunities
- 3.5 Porter's Five Forces Analysis
- 3.5.1 Threat of New Entrants
- 3.5.2 Bargaining Power of Suppliers
- 3.5.3 Bargaining Power of Buyers
- 3.5.4 Threat of Substitutes
- 3.5.5 Competitive Rivalry – Intensity Assessment
- 3.6 Immersive Virtual Reality Value Chain Analysis
- 3.6.1 Upstream – Raw Material/Input Suppliers
- 3.6.1.1 Raw Material/Input 1
- 3.6.1.2 Raw Material/Input 2
- 3.6.1.3 Raw Material/Input 3
- 3.6.2 Midstream – Production/Manufacturing/Service Delivery
- 3.6.2.1 Production/Process Overview
- 3.6.2.2 Key Facility Locations & Capacity by Manufacturer
- 3.6.3 Downstream – Distribution & End Consumer
- 3.6.3.1 Primary Channel – B2B/OEM
- 3.6.3.2 Secondary Channels – Dealer, Retail, Online, Direct
- 3.6.4 Value Chain Profitability Analysis
- 3.6.1 Upstream – Raw Material/Input Suppliers
- 3.7 PESTEL Analysis
- 3.7.1 Political Factors
- 3.7.2 Economic Factors
- 3.7.3 Social Factors
- 3.7.4 Technological Factors
- 3.7.5 Environmental Factors
- 3.7.6 Legal Factors
- 3.8 Immersive Virtual Reality Supply Chain Analysis
- 3.8.1 Raw Material/Input Supply Risk Assessment
- 3.8.2 Manufacturing Concentration Risk (Geographic Exposure)
- 3.8.3 Trade Disruption Impact Analysis
- 3.9 Regulatory & Policy Landscape
Note: The regulatory and policy landscape section covers regulations based on their applicability to the market, Immersive Virtual Reality category, geography, and scope of the study. Only regulatory frameworks with a material impact on operations, compliance, trade, sustainability, or market access are analyzed in detail.
Chapter 4. Key Investment Pockets & Opportunity Analysis
- 4.1 Immersive Virtual Reality Market Attractiveness Analysis
- 4.1.1 By Region – Investment Attractiveness Matrix (Volume × CAGR)
- 4.2 Absolute Revenue Growth Opportunity
- 4.2.1 By Region – Absolute USD Growth Through 2032
- 4.3 Incremental Volume Opportunity
- 4.3.1 By Region – Incremental Volume Through 2032
- 4.3.2 Segment – Incremental Volume
- 4.4 Emerging Submarket Opportunity Deep Dive (Subject to Applicability)
- 4.5 Emerging Market Opportunity Scorecards
- 4.5.1 United States
- 4.5.2 Europe
- 4.5.3 Asia
- 4.5.4 Middle East & Africa
Note: Emerging Market Opportunity Scorecards will be included based on relevance and strategic importance. Regions listed are indicative and may vary depending on data availability and market dynamics.
Chapter 5. Immersive Virtual Reality Import-Export Analysis & Trade Flows
- 5.1 Global Trade Overview
- 5.1.1 Global Export Value by Country (the historical period)
- 5.1.2 Global Export Volume by Country (the historical period)
- 5.1.3 Global Import Value by Country (the historical period)
- 5.1.4 Global Import Volume by Country (the historical period)
- 5.1.5 Net Trade Balance by Country (the historical period)
- 5.2 Export Analysis – Segment
- 5.2.1 Type 1 (HS Code)
- 5.2.2 Type 2 (HS Code)
- 5.2.3 Type 3 (HS Code)
- 5.2.4 Type 4 (HS Code)
- 5.2.5 Type 5 (HS Code)
- 5.3 Import Analysis – Segment
- 5.3.1 Type 1 (HS Code)
- 5.3.2 Type 2 (HS Code)
- 5.3.3 Type 3 (HS Code)
- 5.3.4 Type 4 (HS Code)
- 5.3.5 Type 5 (HS Code)
- 5.4 Average Unit Trade Prices
- 5.4.1 Average Export Price – Segment & Country
- 5.4.2 Average Import Price – Segment & Source Country
- 5.4.3 Price Trends (the historical period)
- 5.5 Key Trade Route Analysis
- 5.5.1 Trade Route 1
- 5.5.2 Trade Route 2
- 5.5.3 Trade Route 3
- 5.5.4 Trade Route 4
- 5.5.5 Trade Route 5
- 5.6 Trade Policy Impact Assessment
- 5.6.1 US Anti-Dumping & Section 301 Tariffs
- 5.6.2 EU Customs Union Impact
- 5.6.3 Major Free Trade Agreements
- 5.6.4 USMCA Rules of Origin
Note: Trade policy analysis will be included only where relevant to the Immersive Virtual Reality market.
Chapter 6. Competitive Landscape & Company Benchmarking
- 6.1 Immersive Virtual Reality Market Concentration & Structure
- 6.1.1 Herfindahl-Hirschman Index (HHI) – vs.
- 6.1.2 Tier 1, Tier 2 & Tier 3 Market Structure
- 6.1.3 Global, Regional & Local Player Dynamics
- 6.2 Immersive Virtual Reality Market Share Analysis –
- 6.2.1 Global Revenue Share by Company
- 6.2.2 Global Volume Share by Company
- 6.2.3 Regional Revenue Share
- 6.2.4 Market Share Evolution ( vs. )
- 6.2.5 OEM Segment Share by Company
- 6.2.6 Replacement Segment Share by Company
- 6.3 Production/Delivery Capacity & Facility Analysis
- 6.3.1 Global Installed Capacity
- 6.3.2 Capacity Utilization Rates
- 6.3.3 Production/Output Volume
- 6.3.4 Facility Locations & Capacity Map
- 6.3.5 Planned Capacity Additions
- 6.4 Immersive Virtual Reality Competitive Benchmarking Matrix
- 6.4.1 Revenue, Volume, CAGR & Profitability Comparison
- 6.4.2 Channel Revenue Mix
- 6.4.3 Geographic Revenue Exposure
- 6.4.4 R&D Intensity
- 6.4.5 Sustainability Maturity
- 6.5 Strategic Developments in Immersive Virtual Reality (Last 24 Months)
- 6.5.1 Mergers, Acquisitions & Divestments
- 6.5.2 New Immersive Virtual Reality Launches
- 6.5.3 Facility Expansions
- 6.5.4 Strategic Alliances, Joint Ventures & Partnerships
- 6.5.5 Distribution Expansion & Market Entry
- 6.5.6 Sustainability & ESG Initiatives
- 6.6 Competitive Strategy Mapping
- 6.6.1 Leader, Challenger, Follower & Niche Classification
- 6.6.2 Pricing Strategy Comparison
- 6.6.3 Channel Strategy Matrix
Note: Strategic developments are included based on their materiality and the availability of reliable information.
Chapter 7. Global Immersive Virtual Reality Market – By Distribution Channel
- 7.1 Segment Overview
- 7.1.1 Volume & Revenue Split by Channel ( & 2032)
- 7.1.2 Channel Mix Evolution (2032)
Chapter 8. Regional Market Analysis – Global Overview
- 8.1 Global Regional Overview
- 8.1.1 Regional Volume Share
- 8.1.2 Regional Revenue Share
- 8.1.3 Regional Volume by Region
- 8.1.4 Regional Revenue by Region
- 8.1.5 Regional Forecast Through 2032
- 8.2 Cross-Regional Segment Analysis
- 8.2.1 By Distribution Channel
- 8.2.2 By Brand/Price Tier
Chapter 9. North America Immersive Virtual Reality Market
- 9.1 United States
- 9.2 Canada
- 9.3 Mexico
Chapter 10. Europe Immersive Virtual Reality Market
- 10.1 Germany
- 10.2 France
- 10.3 Italy
- 10.4 United Kingdom
- 10.5 Spain
- 10.6 Poland
- 10.7 Russia
- 10.8 Netherlands
- 10.9 Belgium
- 10.10 Sweden
- 10.11 Denmark
- 10.12 Norway
- 10.13 Rest of Europe
Chapter 11. Asia Pacific Immersive Virtual Reality Market
- 11.1 China
- 11.2 India
- 11.3 Japan
- 11.4 South Korea
- 11.5 Thailand
- 11.6 Indonesia
- 11.7 Vietnam
- 11.8 Malaysia
- 11.9 Australia
- 11.10 Rest of Asia Pacific
Chapter 12. Latin America Immersive Virtual Reality Market
- 12.1 Brazil
- 12.2 Argentina
- 12.3 Colombia
- 12.4 Chile
- 12.5 Rest of Latin America
Chapter 13. Middle East Immersive Virtual Reality Market
- 13.1 Saudi Arabia
- 13.2 United Arab Emirates
- 13.3 Turkey
- 13.4 Israel
- 13.5 Iran
- 13.6 Rest of the Middle East
Chapter 14. Africa Immersive Virtual Reality Market
- 14.1 South Africa
- 14.2 Egypt
- 14.3 Nigeria
- 14.4 Morocco
- 14.5 Rest of Africa
Chapter 15. Immersive Virtual Reality Company Profiles
- 15.1 [Company 01]
- 15.1.1 Company Overview
- 15.1.2 Key Management Personnel
- 15.1.3 Products & Services Portfolio
- 15.1.4 Financial Performance
- 15.1.5 Key Market Focus & Geographic Presence
- 15.1.6 Recent Developments & Strategic Initiatives
Note: The company profile list is preliminary and may change based on research findings, market developments, data availability, and client requirements.
Chapter 16. Appendices
- Appendix A – List of Abbreviations & Acronyms
- Appendix B – Industry Classification Code Reference – Full Series
- Appendix C – Production & Capacity Data Tables
- Appendix D – End-Use & Demand Base Tables
- Appendix E – Consumption & Replacement Rate Assumptions
- Appendix F – ASP Reference Tables
- Appendix G – Manufacturing & Facility Database
- Appendix H – Import-Export Data Tables
- Appendix I – Regulatory Summary Tables
- Appendix J – Primary Research Participant List (Anonymized)
- Appendix K – Primary Research Questionnaire Framework
- Appendix L – Data Sources & Bibliography
- Appendix M – Market Size Divergence & Source Comparison
Chapter 17. Research Methodology
- 17.1 Research Framework & Philosophy
- 17.2 Secondary Research – Sources, Hierarchy & Data Extraction
- 17.3 Data Modeling – Bottom-Up & Top-Down Market Sizing
- 17.4 Primary Research – Stakeholder Framework, LOI & Sample Sizes
- 17.5 Forecast Methodology – Regression, Scenario & Sensitivity Analysis
- 17.6 Quality Control – Four-Layer Validation Framework
- 17.7 Limitations & Standard Assumptions
- 17.8 Disclaimer
