
Market Overview
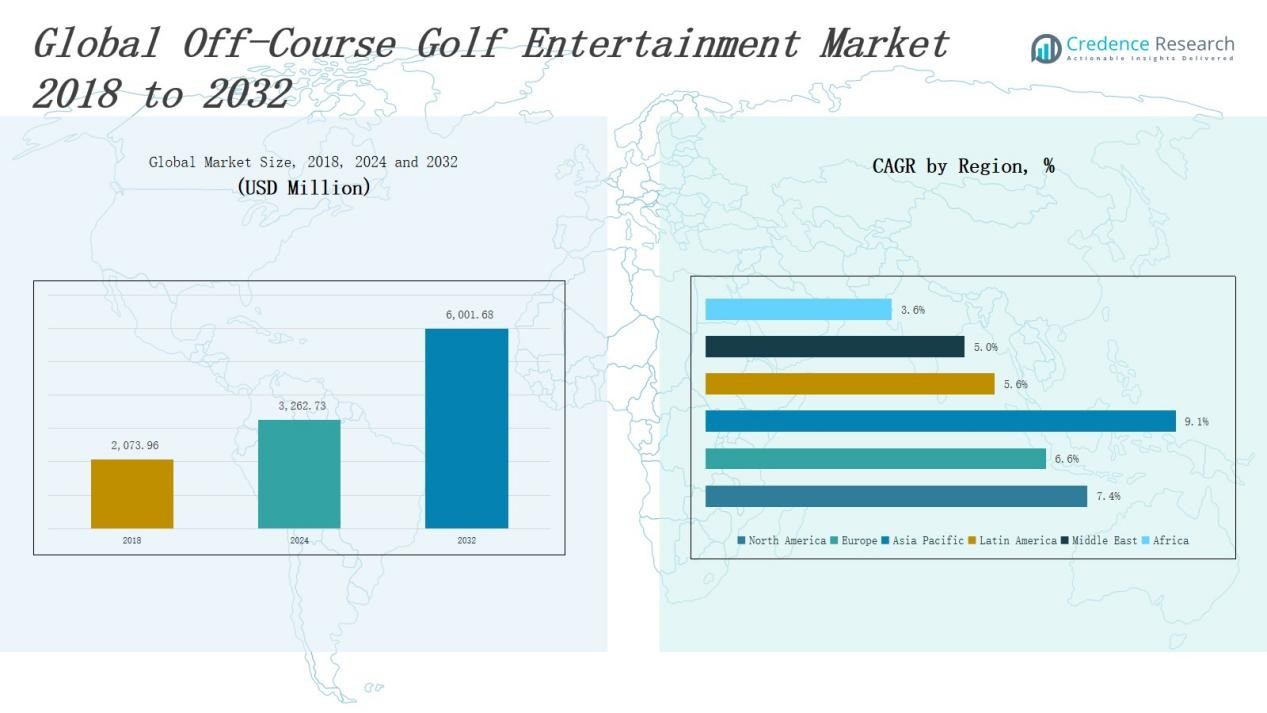
Off-Course Golf Entertainment Market size was valued at USD 2,073.96 million in 2018 to USD 3,262.73 million in 2024 and is anticipated to reach USD 6,001.68 million by 2032, at a CAGR of 7.37% during the forecast period.
| REPORT ATTRIBUTE | DETAILS |
|---|---|
| Historical Period | 2020-2024 |
| Base Year | 2024 |
| Forecast Period | 2025-2032 |
| Off-Course Golf Entertainment Market Size 2024 | USD 3,262.73 Million |
| Off-Course Golf Entertainment Market, CAGR | 7.37% |
| Off-Course Golf Entertainment Market Size 2032 | USD 6,001.68 Million |
The Off-Course Golf Entertainment Market features several prominent players driving innovation and growth. Leading companies such as Topgolf Entertainment Group, Drive Shack Inc., BigShots Golf, Five Iron Golf, The Golf Lounge, X-Golf, PGA Tour Superstore, TruGolf, Foresight Sports, and Full Swing Golf dominate the competitive landscape. These companies differentiate themselves through advanced technology integration, diverse entertainment offerings, and expansive venue networks that cater to a broad customer base. North America holds the leading regional position, commanding 45% of the global market share, fueled by strong consumer interest, established golfing culture, and significant investments in state-of-the-art golf entertainment venues. This regional dominance underscores the market’s robust growth potential and the critical role of key players in shaping industry dynamics.
Market Insights
- The Off-Course Golf Entertainment Market grew from USD 2,073.96 million in 2018 to USD 3,262.73 million in 2024 and is projected to reach USD 6,001.68 million by 2032, driven by a CAGR of 7.37%.
- Leading players such as Topgolf Entertainment Group, Drive Shack Inc., BigShots Golf, and others drive market growth through technology integration and expansive venue networks catering to diverse customers.
- North America dominates with 45% market share due to strong consumer interest, established golfing culture, and heavy investments in modern golf entertainment venues.
- Rising demand for experiential leisure and social engagement, technological advancements in simulators, and growth in corporate event hosting fuel market expansion.
- Asia Pacific is the fastest-growing region, supported by rapid urbanization, rising incomes, and increasing popularity of golf among younger demographics in countries like China and India.
Market Segment Insights
By Type of Entertainment Venue:
Golf Entertainment Centers dominate the segment, capturing the largest market share due to their comprehensive offerings that combine golf with social and dining experiences. Indoor Golf Simulators follow closely, driven by their year-round accessibility and technological advancements enhancing player engagement. Driving Ranges with Advanced Technology attract users seeking skill improvement supported by data analytics and interactive features. Virtual Golf and Simulator Leagues grow rapidly by tapping into competitive and community-driven play formats, especially appealing to younger audiences.
- For instance, Topgolf's interactive driving ranges have transformed the industry by integrating gamified driving levels and augmented reality features, which attract a younger and more diverse crowd.
By Customer Type:
Casual Golfers represent the dominant sub-segment, constituting the majority of market revenue through frequent, recreational participation. Millennials and Gen Z Groups show strong growth potential, propelled by their preference for technology-enhanced and social entertainment experiences that blend physical activity with digital interaction. Corporate and Group Events drive significant demand by leveraging golf entertainment venues for team building and client engagement, often contributing to peak-time revenues. The Others category, including families and seniors, supports a stable market base through diverse leisure offerings and flexible pricing models.
- For instance, Topgolf, a pioneer in technology-enhanced golf entertainment, expands its reach to Millennials and Gen Z by combining interactive golf games with social venues, driving significant visitor growth and digital engagement metrics.
Key Growth Drivers
Rising Demand for Experiential Leisure and Social Engagement
Consumers increasingly prioritize entertainment experiences that combine leisure with social interaction. Off-course golf entertainment venues offering immersive environments, including golf games alongside dining and social spaces, attract wider demographics beyond traditional golfers. This shift transforms golf into a versatile lifestyle activity, encouraging repeat visits and extended stays. Such experiential demand expands market size by appealing to casual players, groups, and families, creating sustained revenue growth for operators investing in multi-functional, socially engaging venues.
- For instance, Lengolf in Bangkok combines high-tech golf simulators with a bar and dining menu, creating a lively social atmosphere that attracts groups, corporate events, and casual players—emphasizing golf as an immersive, community-driven experience rather than merely a sport.
Technological Advancements Enhancing User Experience
Cutting-edge technologies like high-definition simulators, real-time analytics, and augmented reality elevate the realism and engagement of off-course golf entertainment. These innovations enable personalized coaching, skill tracking, and virtual competition, broadening appeal beyond conventional golf enthusiasts. Technology also enables year-round participation regardless of weather, increasing accessibility. The enhanced user experience attracts younger, tech-savvy consumers and encourages frequent visits, driving higher revenue and customer loyalty across diverse venue types.
- For instance, Five Iron Golf has revolutionized urban indoor golf venues using cutting-edge simulator technology paired with real-time analytics, providing immersive multi-player games and coaching opportunities that appeal to younger, tech-savvy audiences.
Growth in Corporate and Group Event Hosting
Corporate clients increasingly turn to off-course golf entertainment venues for team-building and client engagement activities. Customized event packages combining golf, dining, and social interaction cater to business needs for unique, interactive experiences. This segment generates consistent, high-value bookings and supports premium pricing strategies. The growing corporate demand strengthens market stability and encourages venues to develop specialized offerings, enhancing profitability while expanding brand presence within the business community.
Key Trends & Opportunities
Emergence of Virtual Golf and Simulator Leagues
Virtual golf leagues and simulator-based tournaments appeal to Millennials and Gen Z by combining competitive play with social interaction and digital convenience. These leagues enable remote participation, fostering community and engagement beyond physical venues. The subscription and membership models linked to virtual platforms offer recurring revenue streams. As this trend grows, operators can expand digital offerings, tapping into younger demographics and creating new market segments centered on online golf entertainment.
- For instance, Panasonic Corporation utilizes high-speed cameras and sensors in their golf simulators to replicate real-world playing conditions indoors, promoting year-round play regardless of outdoor weather.
Expansion of Multi-Use Golf Entertainment Venues
Off-course golf venues increasingly integrate dining, arcade games, and live entertainment to attract diverse audiences. This multi-use approach enhances customer experience and lengthens visit duration, driving higher spending per visit. By creating family-friendly and cross-generational environments, operators broaden market reach. The strategy also supports differentiation in a competitive landscape, providing opportunities for venues to increase foot traffic and establish themselves as comprehensive leisure destinations.
- For instance, Topgolf's multi-level complexes feature climate-controlled hitting bays alongside a full-service bar and renowned menu, complemented by interactive sports games and live events, enhancing overall customer engagement and extending visit duration.
Key Challenges
High Capital Investment and Operational Costs
Developing advanced golf entertainment venues demands significant initial capital for technology, infrastructure, and staffing. Maintaining sophisticated simulators and interactive systems requires ongoing investment, impacting profitability. These high costs present barriers for new entrants and limit rapid expansion. Smaller operators may struggle to sustain competitive offerings. Efficient cost management and strategic partnerships become critical for market participants to remain viable and grow in a capital-intensive environment.
Seasonal and Regional Demand Variability
Off-course golf entertainment markets experience fluctuations due to seasonal weather and regional differences in golf popularity. Indoor venues reduce weather dependency but cannot fully negate cultural and economic factors affecting demand. Operators must adapt offerings and marketing strategies to regional preferences and disposable income levels. Managing these variabilities requires flexible business models and targeted promotions to ensure consistent patronage throughout the year and across different geographic markets.
Competition from Alternative Leisure Activities
The market faces strong competition from esports, fitness centers, and digital entertainment platforms that vie for consumer attention and spending. Off-course golf venues must continuously innovate and offer differentiated, engaging experiences to retain customers. Failure to adapt risks losing market share to more rapidly evolving leisure activities. Strategic investments in technology, personalized experiences, and integrated social elements are essential to maintaining relevance and attracting diverse consumer segments in a crowded entertainment landscape.
Regional Analysis
North America
North America leads the Off-Course Golf Entertainment Market with a revenue of USD 1,408.52 million in 2024 and is projected to reach USD 2,598.12 million by 2032, reflecting a robust CAGR of 7.4%. The region’s dominance stems from a well-established golfing culture, high consumer spending power, and extensive investment in advanced golf entertainment venues. The U.S. and Canada drive demand through widespread adoption of technology-enhanced facilities and strong corporate event hosting. North America commands the largest market share globally, benefiting from mature infrastructure and continuous innovation.
Europe
Europe holds the second-largest market position, generating USD 936.79 million in 2024 with growth expected to reach USD 1,627.16 million by 2032 at a CAGR of 6.6%. Key markets such as the UK, Germany, and France contribute significantly due to rising interest in golf entertainment and expanding venue networks. European consumers increasingly favor multi-use leisure venues that combine golf with social experiences. Growth is supported by urbanization, tourism, and corporate demand, although market maturity slightly tempers expansion compared to emerging regions.
Asia Pacific
Asia Pacific represents the fastest-growing region, with market revenue rising from USD 647.59 million in 2024 to an estimated USD 1,357.10 million by 2032, achieving a CAGR of 9.1%. Rapid urbanization, rising disposable incomes, and growing popularity of golf among Millennials and Gen Z drive this dynamic growth. Countries like China, Japan, South Korea, and India lead regional expansion by investing heavily in modern golf entertainment venues and technology integration. Asia Pacific’s increasing focus on experiential leisure creates substantial opportunities for market players.
Latin America
Latin America’s market value stands at USD 142.05 million in 2024 and is forecasted to reach USD 229.12 million by 2032, growing at a CAGR of 5.6%. Brazil and Argentina dominate regional demand with rising urban populations and expanding middle-class segments adopting golf entertainment. Growth is supported by increasing investments in leisure infrastructure and corporate events. However, economic volatility and limited penetration in some countries moderate overall expansion, making market development gradual yet steady.
Middle East
The Middle East market is projected to grow from USD 81.37 million in 2024 to USD 125.67 million by 2032, at a CAGR of 5.0%. The GCC countries, particularly the UAE and Saudi Arabia, lead through large-scale investments in luxury golf entertainment complexes and tourism-driven demand. Rising corporate event hosting and affluent consumer segments support growth. However, geopolitical uncertainties and market fragmentation pose challenges. The region offers opportunities for premium venue development targeting high-net-worth individuals and international visitors.
Africa
Africa holds the smallest market share, valued at USD 46.43 million in 2024 and expected to reach USD 64.51 million by 2032 with a CAGR of 3.6%. South Africa and Egypt drive regional growth, supported by emerging golf tourism and leisure infrastructure investments. Market expansion faces challenges from limited disposable income, infrastructural constraints, and lower penetration of technology-driven golf entertainment venues. Nonetheless, increasing interest in golf and gradual economic development provide a foundation for future growth in select urban centers.
Market Segmentations:
By Type of Entertainment Venue
- Golf Entertainment Centers
- Indoor Golf Simulators
- Driving Ranges with Advanced Technology
- Virtual Golf and Simulator Leagues
- Others
By Customer Type
- Casual Golfers
- Millennials and Gen Z Groups
- Corporate/Group Events
- Others
By Region
- North America
- U.S.
- Canada
- Mexico
- Europe
- Germany
- France
- U.K.
- Italy
- Spain
- Rest of Europe
- Asia Pacific
- China
- Japan
- India
- South Korea
- South-east Asia
- Rest of Asia Pacific
- Latin America
- Brazil
- Argentina
- Rest of Latin America
- Middle East & Africa
- GCC Countries
- South Africa
- Rest of the Middle East and Africa
Competitive Landscape
The Off-Course Golf Entertainment Market features a competitive landscape characterized by established global players and emerging regional operators focused on innovation and expansion. Leading companies such as Topgolf Entertainment Group, Drive Shack Inc., BigShots Golf, and TruGolf differentiate themselves through advanced technology integration, diverse entertainment offerings, and extensive venue networks. These players emphasize enhancing customer experience via high-definition simulators, data analytics, and immersive social environments. Strategic initiatives like partnerships, acquisitions, and geographic expansion enable companies to capture broader market segments, including casual golfers, Millennials, and corporate clients. Additionally, smaller and regional operators adopt niche strategies by targeting local preferences and integrating multi-use leisure facilities. The market’s competitive intensity drives continuous investment in technology upgrades and service diversification. As demand for experiential and tech-enabled golf entertainment grows globally, companies focusing on innovation, customer engagement, and strategic growth are poised to strengthen their market position and sustain long-term profitability in this evolving sector.
Key Players
- Topgolf Entertainment Group
- Drive Shack Inc.
- BigShots Golf
- Five Iron Golf
- The Golf Lounge
- X-Golf
- PGA Tour Superstore
- TruGolf
- Foresight Sports
- Full Swing Golf
Recent Developments
- In September 2024, Topgolf partnered with SEGA of America to introduce an exclusive Sonic the Hedgehog™ game at all Topgolf venues across the U.S. and select international locations.
- In 2024, BigShots Golf announced plans to open four new venues in key U.S. cities and the UK, expanding its footprint to 12 locations globally.
- In August 2024, Five Iron Golf opened its largest venue at The Westin Dubai Mina Seyahi Beach Resort & Marina, featuring advanced Trackman Golf simulators and multisport bays.
- In October 2024, Full Swing partnered with PGA TOUR Superstore to provide cutting-edge launch monitors nationwide.
- In September 2024, Golf Genius launched an off-course technology solution specifically designed for indoor and entertainment golf venues.
Market Concentration & Characteristics
The Off-Course Golf Entertainment Market exhibits a moderately concentrated structure, dominated by a few key players that control a significant share of the global revenue. It features prominent companies like Topgolf Entertainment Group and Drive Shack Inc., which leverage extensive venue networks and advanced technology to maintain competitive advantages. The market combines large-scale operators with smaller regional players who cater to localized preferences and niche segments. It thrives on innovation, including high-tech simulators and integrated social experiences, which drive customer engagement and differentiation. Market entry requires substantial capital investment and expertise, limiting the number of new competitors. Despite this, evolving consumer preferences and growing demand for experiential leisure create opportunities for both established firms and emerging players. The competitive dynamics encourage continuous enhancement of service offerings and expansion into untapped regions, strengthening overall market growth while maintaining a balance between concentrated dominance and regional diversification.
Report Coverage
The research report offers an in-depth analysis based on Type of Entertainment Venue, Customer Type and Region. It details leading market players, providing an overview of their business, product offerings, investments, revenue streams, and key applications. Additionally, the report includes insights into the competitive environment, SWOT analysis, current market trends, as well as the primary drivers and constraints. Furthermore, it discusses various factors that have driven market expansion in recent years. The report also explores market dynamics, regulatory scenarios, and technological advancements that are shaping the industry. It assesses the impact of external factors and global economic changes on market growth. Lastly, it provides strategic recommendations for new entrants and established companies to navigate the complexities of the market.
Future Outlook
- The Off-Course Golf Entertainment Market will expand due to rising demand for technology-driven leisure activities.
- More venues will integrate advanced simulators to enhance player experience and attract diverse customers.
- Growth in corporate event hosting will provide steady revenue streams for entertainment centers.
- Virtual golf leagues and online competitions will become more popular, creating new engagement platforms.
- Multi-use entertainment venues combining golf with dining and social activities will increase market penetration.
- Expansion into emerging regions will open new opportunities for market players.
- Continuous innovation in technology will drive customer retention and attract younger demographics.
- Partnerships and acquisitions will shape competitive dynamics and accelerate geographic reach.
- Operators will focus on personalized services to improve user satisfaction and loyalty.
- Sustainability and eco-friendly venue designs will gain importance in future development strategies.
Request a Free Sample
Fill in your details and we'll send you a free sample report.
- Sample data tables & charts
- Research methodology
Need a Custom Version of This Report?
Tailor the scope, geography, or segments to your exact requirements.
- Custom geography or segment scope
- Direct access to our analyst team
Frequently Asked Questions
What is the current market size for Off-Course Golf Entertainment Market, and what is its projected size in 2032?
At what Compound Annual Growth Rate is the Off-Course Golf Entertainment Market projected to grow between 2025 and 2032?
Which Off-Course Golf Entertainment Market segment held the largest share in 2024?
What are the primary factors fueling the growth of the Off-Course Golf Entertainment Market?
Who are the leading companies in the Off-Course Golf Entertainment Market?
Which region commanded the largest share of the Off-Course Golf Entertainment Market market in 2024?
Table of Content
Chapter 1. Report Introduction
- 1.1 Report Description & Purpose
- 1.1.1 Report Title & Market Definition
- 1.1.2 Unique Selling Propositions (USP) & Key Differentiators
- 1.1.3 Value Proposition for Stakeholders
- 1.2 Research Objectives
- 1.2.1 Market Sizing Objectives (Volume & Revenue)
- 1.2.2 Segmentation Objectives
- 1.2.3 Competitive Intelligence Objectives
- 1.2.4 Forecast & Scenario Objectives
- 1.3 Report Scope
- 1.3.1 Off-Course Golf Entertainment Scope – Types & Subtypes Covered
- 1.3.2 Geographic Scope – Regions & Countries Covered
- 1.3.3 Historical Period, Base Year & Forecast Period (2024; forecast to 2032)
- 1.3.4 Inclusions & Exclusions
- 1.4 HS Code & Classification Framework
- 1.5 Currency, Units & Pricing Basis
- 1.6 Target Stakeholders
- 1.7 Limitations & Assumptions
Chapter 2. Executive Summary
- 2.1 Global Off-Course Golf Entertainment Market Snapshot
- 2.1.1 Market Size – Historical (2024) & Forecast (2024-2032) (2024: USD 38,516.22 million → 2032: USD 71,269.95 million)
- 2.1.2 Volume & Revenue – Global Totals
- 2.1.3 Key Market Highlights – Top Five Facts
- 2.2 Off-Course Golf Entertainment Market Segmentation Snapshot
- 2.2.1 Market Split by Region – 2024 vs. 2032
- 2.3 Competitive Snapshot
- 2.3.1 Top 10 Players by Revenue Share – 2024
- 2.3.2 Top 10 Players by Volume Share – 2024
- 2.3.3 Recent Strategic Developments (18-Month Summary)
- 2.4 Key Investment Highlights & Strategic Conclusions
Chapter 3. Off-Course Golf Entertainment Market Dynamics & Industry Analysis
- 3.1 Market Overview & Context
- 3.1.1 Off-Course Golf Entertainment Market Position in the Broader Automotive Value Chain
- 3.1.2 OEM vs. Replacement Market Dynamics
- 3.1.3 Market Maturity & Development Stage by Region
- 3.2 Off-Course Golf Entertainment Market Drivers
- 3.3 Off-Course Golf Entertainment Market Restraints & Challenges
- 3.4 Off-Course Golf Entertainment Market Opportunities
- 3.5 Porter's Five Forces Analysis
- 3.5.1 Threat of New Entrants
- 3.5.2 Bargaining Power of Suppliers
- 3.5.3 Bargaining Power of Buyers
- 3.5.4 Threat of Substitutes
- 3.5.5 Competitive Rivalry – Intensity Assessment
- 3.6 Off-Course Golf Entertainment Value Chain Analysis
- 3.6.1 Upstream – Raw Material/Input Suppliers
- 3.6.1.1 Raw Material/Input 1
- 3.6.1.2 Raw Material/Input 2
- 3.6.1.3 Raw Material/Input 3
- 3.6.2 Midstream – Production/Manufacturing/Service Delivery
- 3.6.2.1 Production/Process Overview
- 3.6.2.2 Key Facility Locations & Capacity by Manufacturer
- 3.6.3 Downstream – Distribution & End Consumer
- 3.6.3.1 Primary Channel – B2B/OEM
- 3.6.3.2 Secondary Channels – Dealer, Retail, Online, Direct
- 3.6.4 Value Chain Profitability Analysis
- 3.6.1 Upstream – Raw Material/Input Suppliers
- 3.7 PESTEL Analysis
- 3.7.1 Political Factors
- 3.7.2 Economic Factors
- 3.7.3 Social Factors
- 3.7.4 Technological Factors
- 3.7.5 Environmental Factors
- 3.7.6 Legal Factors
- 3.8 Off-Course Golf Entertainment Supply Chain Analysis
- 3.8.1 Raw Material/Input Supply Risk Assessment
- 3.8.2 Manufacturing Concentration Risk (Geographic Exposure)
- 3.8.3 Trade Disruption Impact Analysis
- 3.9 Regulatory & Policy Landscape
Note: The regulatory and policy landscape section covers regulations based on their applicability to the market, Off-Course Golf Entertainment category, geography, and scope of the study. Only regulatory frameworks with a material impact on operations, compliance, trade, sustainability, or market access are analyzed in detail.
Chapter 4. Key Investment Pockets & Opportunity Analysis
- 4.1 Off-Course Golf Entertainment Market Attractiveness Analysis
- 4.1.1 By Region – Investment Attractiveness Matrix (Volume × CAGR)
- 4.2 Absolute Revenue Growth Opportunity
- 4.2.1 By Region – Absolute USD Growth Through 2032
- 4.3 Incremental Volume Opportunity
- 4.3.1 By Region – Incremental Volume Through 2032
- 4.3.2 Segment – Incremental Volume
- 4.4 Emerging Submarket Opportunity Deep Dive (Subject to Applicability)
- 4.5 Emerging Market Opportunity Scorecards
- 4.5.1 United States
- 4.5.2 Europe
- 4.5.3 Asia
- 4.5.4 Middle East & Africa
Note: Emerging Market Opportunity Scorecards will be included based on relevance and strategic importance. Regions listed are indicative and may vary depending on data availability and market dynamics.
Chapter 5. Off-Course Golf Entertainment Import-Export Analysis & Trade Flows
- 5.1 Global Trade Overview
- 5.1.1 Global Export Value by Country (2024)
- 5.1.2 Global Export Volume by Country (2024)
- 5.1.3 Global Import Value by Country (2024)
- 5.1.4 Global Import Volume by Country (2024)
- 5.1.5 Net Trade Balance by Country (2024)
- 5.2 Export Analysis – Segment
- 5.2.1 Type 1 (HS Code)
- 5.2.2 Type 2 (HS Code)
- 5.2.3 Type 3 (HS Code)
- 5.2.4 Type 4 (HS Code)
- 5.2.5 Type 5 (HS Code)
- 5.3 Import Analysis – Segment
- 5.3.1 Type 1 (HS Code)
- 5.3.2 Type 2 (HS Code)
- 5.3.3 Type 3 (HS Code)
- 5.3.4 Type 4 (HS Code)
- 5.3.5 Type 5 (HS Code)
- 5.4 Average Unit Trade Prices
- 5.4.1 Average Export Price – Segment & Country
- 5.4.2 Average Import Price – Segment & Source Country
- 5.4.3 Price Trends (2024)
- 5.5 Key Trade Route Analysis
- 5.5.1 Trade Route 1
- 5.5.2 Trade Route 2
- 5.5.3 Trade Route 3
- 5.5.4 Trade Route 4
- 5.5.5 Trade Route 5
- 5.6 Trade Policy Impact Assessment
- 5.6.1 US Anti-Dumping & Section 301 Tariffs
- 5.6.2 EU Customs Union Impact
- 5.6.3 Major Free Trade Agreements
- 5.6.4 USMCA Rules of Origin
Note: Trade policy analysis will be included only where relevant to the Off-Course Golf Entertainment market.
Chapter 6. Competitive Landscape & Company Benchmarking
- 6.1 Off-Course Golf Entertainment Market Concentration & Structure
- 6.1.1 Herfindahl-Hirschman Index (HHI) – vs. 2024
- 6.1.2 Tier 1, Tier 2 & Tier 3 Market Structure
- 6.1.3 Global, Regional & Local Player Dynamics
- 6.2 Off-Course Golf Entertainment Market Share Analysis – 2024
- 6.2.1 Global Revenue Share by Company
- 6.2.2 Global Volume Share by Company
- 6.2.3 Regional Revenue Share
- 6.2.4 Market Share Evolution ( vs. 2024)
- 6.2.5 OEM Segment Share by Company
- 6.2.6 Replacement Segment Share by Company
- 6.3 Production/Delivery Capacity & Facility Analysis
- 6.3.1 Global Installed Capacity
- 6.3.2 Capacity Utilization Rates
- 6.3.3 Production/Output Volume
- 6.3.4 Facility Locations & Capacity Map
- 6.3.5 Planned Capacity Additions
- 6.4 Off-Course Golf Entertainment Competitive Benchmarking Matrix
- 6.4.1 Revenue, Volume, CAGR & Profitability Comparison
- 6.4.2 Channel Revenue Mix
- 6.4.3 Geographic Revenue Exposure
- 6.4.4 R&D Intensity
- 6.4.5 Sustainability Maturity
- 6.5 Strategic Developments in Off-Course Golf Entertainment (Last 24 Months)
- 6.5.1 Mergers, Acquisitions & Divestments
- 6.5.2 New Off-Course Golf Entertainment Launches
- 6.5.3 Facility Expansions
- 6.5.4 Strategic Alliances, Joint Ventures & Partnerships
- 6.5.5 Distribution Expansion & Market Entry
- 6.5.6 Sustainability & ESG Initiatives
- 6.6 Competitive Strategy Mapping
- 6.6.1 Leader, Challenger, Follower & Niche Classification
- 6.6.2 Pricing Strategy Comparison
- 6.6.3 Channel Strategy Matrix
Note: Strategic developments are included based on their materiality and the availability of reliable information.
Chapter 7. Global Off-Course Golf Entertainment Market – By Distribution Channel
- 7.1 Segment Overview
- 7.1.1 Volume & Revenue Split by Channel (2024 & 2032)
- 7.1.2 Channel Mix Evolution (2024-2032)
Chapter 8. Regional Market Analysis – Global Overview
- 8.1 Global Regional Overview
- 8.1.1 Regional Volume Share
- 8.1.2 Regional Revenue Share
- 8.1.3 Regional Volume by Region
- 8.1.4 Regional Revenue by Region
- 8.1.5 Regional Forecast Through 2032
- 8.2 Cross-Regional Segment Analysis
- 8.2.1 By Distribution Channel
- 8.2.2 By Brand/Price Tier
Chapter 9. North America Off-Course Golf Entertainment Market
- 9.1 United States
- 9.2 Canada
- 9.3 Mexico
Chapter 10. Europe Off-Course Golf Entertainment Market
- 10.1 Germany
- 10.2 France
- 10.3 Italy
- 10.4 United Kingdom
- 10.5 Spain
- 10.6 Poland
- 10.7 Russia
- 10.8 Netherlands
- 10.9 Belgium
- 10.10 Sweden
- 10.11 Denmark
- 10.12 Norway
- 10.13 Rest of Europe
Chapter 11. Asia Pacific Off-Course Golf Entertainment Market
- 11.1 China
- 11.2 India
- 11.3 Japan
- 11.4 South Korea
- 11.5 Thailand
- 11.6 Indonesia
- 11.7 Vietnam
- 11.8 Malaysia
- 11.9 Australia
- 11.10 Rest of Asia Pacific
Chapter 12. Latin America Off-Course Golf Entertainment Market
- 12.1 Brazil
- 12.2 Argentina
- 12.3 Colombia
- 12.4 Chile
- 12.5 Rest of Latin America
Chapter 13. Middle East Off-Course Golf Entertainment Market
- 13.1 Saudi Arabia
- 13.2 United Arab Emirates
- 13.3 Turkey
- 13.4 Israel
- 13.5 Iran
- 13.6 Rest of the Middle East
Chapter 14. Africa Off-Course Golf Entertainment Market
- 14.1 South Africa
- 14.2 Egypt
- 14.3 Nigeria
- 14.4 Morocco
- 14.5 Rest of Africa
Chapter 15. Off-Course Golf Entertainment Company Profiles
- 15.1 [Company 01]
- 15.1.1 Company Overview
- 15.1.2 Key Management Personnel
- 15.1.3 Products & Services Portfolio
- 15.1.4 Financial Performance
- 15.1.5 Key Market Focus & Geographic Presence
- 15.1.6 Recent Developments & Strategic Initiatives
Note: The company profile list is preliminary and may change based on research findings, market developments, data availability, and client requirements.
Chapter 16. Appendices
- Appendix A – List of Abbreviations & Acronyms
- Appendix B – Industry Classification Code Reference – Full Series
- Appendix C – Production & Capacity Data Tables
- Appendix D – End-Use & Demand Base Tables
- Appendix E – Consumption & Replacement Rate Assumptions
- Appendix F – ASP Reference Tables
- Appendix G – Manufacturing & Facility Database
- Appendix H – Import-Export Data Tables
- Appendix I – Regulatory Summary Tables
- Appendix J – Primary Research Participant List (Anonymized)
- Appendix K – Primary Research Questionnaire Framework
- Appendix L – Data Sources & Bibliography
- Appendix M – Market Size Divergence & Source Comparison
Chapter 17. Research Methodology
- 17.1 Research Framework & Philosophy
- 17.2 Secondary Research – Sources, Hierarchy & Data Extraction
- 17.3 Data Modeling – Bottom-Up & Top-Down Market Sizing
- 17.4 Primary Research – Stakeholder Framework, LOI & Sample Sizes
- 17.5 Forecast Methodology – Regression, Scenario & Sensitivity Analysis
- 17.6 Quality Control – Four-Layer Validation Framework
- 17.7 Limitations & Standard Assumptions
- 17.8 Disclaimer
