Automotive Turnover Box Market Size, Growth and Forecast 2032

Automotive Turnover Box market size was valued at USD 1,931.60 million in 2024 and is projected to reach USD 3,803.96 million by 2032.

Automotive Turnover Box Market By Type (Small Turnover Box, Large Turnover Box); By Application (Commercial Vehicles, Passenger Cars); By Material (Plastic, Metal, Others) – Growth, Share, Opportunities & Competitive Analysis, 2024 – 2032

SKU: CR15317Report Pages: 250Category: Automation & Process ControlReport Format: PDF, ExcelLast Updated: Jul 15Author: Sushant PhapalePreferred on

Market Report Metrics

Revenue, 2024 -
USD 1,931.60 million
Forecast Year -
2032
CAGR (2024–2032)
8.23%
Report Coverage
Global
REPORT ATTRIBUTE DETAILS
Historical Period 2020-2023
Base Year 2024
Forecast Period 2025-2032
Automotive Turnover Box Market Size 2024 USD 1,931.60 million
Automotive Turnover Box Market, CAGR 8.23%
Automotive Turnover Box Market Size 2032 USD 3,803.96 million

Market Overview:

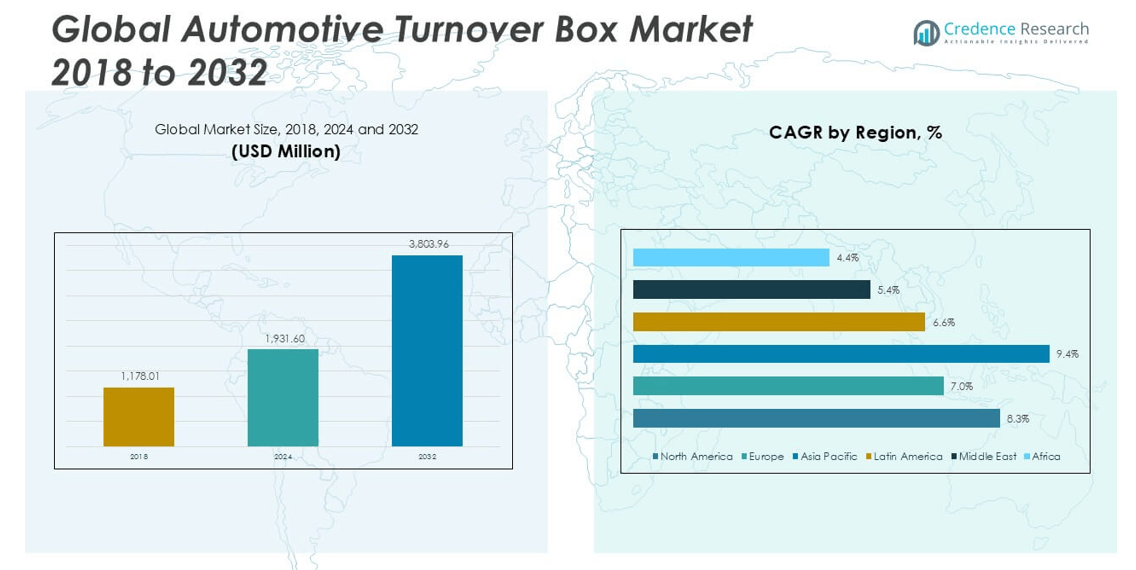
The Automotive Turnover Box market size was valued at USD 1,178.01 million in 2018, increased to USD 1,931.60 million in 2024, and is anticipated to reach USD 3,803.96 million by 2032, at a CAGR of 8.23% during the forecast period.

The Automotive Turnover Box market features key players such as Schoeller Allibert, ORBIS, DS Smith, and Georg Utz Holding, who lead the industry with advanced reusable packaging solutions tailored for automotive logistics. These companies emphasize durable materials, stackable designs, and compatibility with automation systems to support lean manufacturing. Regional manufacturers like Suzhou Dasen Plastic, Jiangsu Yujia, and Shenzhen Xingfeng Plastic contribute significantly to cost-effective and localized supply. North America stands as the leading region, commanding a 41.96% market share in 2024, supported by robust automotive production and widespread adoption of efficient packaging practices across OEMs and Tier 1 suppliers.

Automotive Turnover Box Market size

Market Insights

  • The Automotive Turnover Box market was valued at USD 1,931.60 million in 2024 and is projected to reach USD 3,803.96 million by 2032, growing at a CAGR of 8.23% during the forecast period.
  • Growing demand for reusable and durable packaging in automotive manufacturing, supported by lean production and logistics efficiency, is a key driver fueling market growth.
  • The market is witnessing trends like the integration of smart features such as RFID tracking and the rising preference for modular and customized turnover box designs.
  • North America leads the regional market with a 41.96% share in 2024, followed by Asia Pacific at 31.45%, while large turnover boxes and plastic material segments dominate in type and material categories respectively.
  • High initial investment costs and logistical inefficiencies in emerging economies continue to restrain widespread adoption, especially among small and medium-sized automotive suppliers.

Market Segmentation Analysis:

By Type:

The Large Turnover Box segment holds the dominant market share in the Automotive Turnover Box market, driven by the rising demand for durable and high-capacity storage solutions across automotive manufacturing and logistics chains. Large boxes are preferred due to their ability to carry heavy automotive components such as engine parts, transmissions, and body panels efficiently. Their compatibility with automated handling systems and ease of stacking further boosts adoption in large-scale assembly lines. In contrast, small turnover boxes are used primarily for compact parts, but their usage is limited in comparison to large boxes in high-volume operations.

  • For instance, ORBIS Corporation developed its BulkPak® HDMP series containers, which support static loads up to 15,000 lbs and dynamic loads of 2,500 lbs, making them suitable for transporting engine blocks and heavy drivetrain components in facilities operated by Ford and Toyota.

By Application:

Within the application segment, Passenger Cars represent the leading share of the market. This dominance is attributed to the high production volume and diverse range of parts associated with passenger vehicles, requiring organized and protected storage during manufacturing and assembly. OEMs increasingly utilize turnover boxes to streamline workflows and reduce damage risks during intra-factory transportation. While commercial vehicles also use these boxes, the volume is comparatively lower due to less frequent production cycles and a narrower range of parts handled on assembly lines.

  • For instance, Schoeller Allibert’s R‑KLT VDA containers, widely used in European passenger car facilities, support unit loads of up to 20 kg with stacking strength reaching 600 kg on the bottom container, enabling automated conveyors to handle multiple containers per move with minimal damage risk.

By Material:

Plastic turnover boxes account for the largest share in the material segment, owing to their lightweight properties, corrosion resistance, and ease of recycling. Their cost-effectiveness and durability make them ideal for frequent handling and long-term use in automotive environments. Plastic materials also offer design flexibility, allowing for custom shapes and compartments suited to various parts. In contrast, metal boxes, though more durable under extreme conditions, are heavier and costlier. The “Others” category, including composite or hybrid materials, remains niche but is gradually expanding due to emerging preferences for sustainable and high-performance alternatives.

Market Overview

Key Growth Driver Automotive Production and Supply Chain Expansion

The steady growth in global automotive production, particularly in emerging economies, is a key driver for the Automotive Turnover Box market. As automakers ramp up output to meet growing demand, the need for efficient, durable, and reusable packaging solutions for parts and components has increased. Turnover boxes enhance productivity in manufacturing facilities by streamlining part handling and reducing damage. Additionally, the expansion of supply chains and just-in-time delivery systems further propels the demand for standardized and stackable turnover boxes to support seamless logistics operations.

  • For instance, Toyota, which retained its position as the world’s largest automaker in 2024 by producing 10.6 million vehicles globally, including hybrids and Lexus models, underscores the scale at which manufacturers require robust logistics support.

Emphasis on Operational Efficiency and Lean Manufacturing

Automotive manufacturers are increasingly adopting lean manufacturing principles to minimize waste, optimize space, and improve workflow efficiency. Turnover boxes contribute significantly to these goals by allowing for precise inventory control, better space utilization, and reduced downtime in part retrieval. Their reusability and compatibility with automation systems also lower long-term costs, making them a preferred choice in smart factory environments. As OEMs and suppliers prioritize cost-effective production processes, the integration of turnover boxes in their operations continues to grow, driving overall market expansion.

  • For instance, at Toyota, the integration of Just‑In‑Time (JIT) and Kanban with automated guided vehicles (AGVs) and robotics increased production output from 200,000 units per month to 230,000 units per month, while reducing lead time from 10 days to 8 days clearly illustrating how lean automation paired with tools like turnover boxes boosts operational speed and part handling efficiency.

Adoption of Reusable and Sustainable Packaging Solutions

Environmental sustainability has become a critical focus across the automotive industry. Turnover boxes, especially those made from recyclable plastics, support green logistics initiatives by reducing reliance on single-use packaging. Their extended service life and ability to be reused across multiple production cycles contribute to waste reduction and lower carbon footprints. With growing regulatory pressure to adopt eco-friendly practices and rising corporate responsibility commitments, automakers and Tier 1 suppliers are increasingly shifting toward sustainable packaging solutions, thereby boosting demand for reusable turnover boxes.

Key Trends & Opportunities

Integration with Smart Manufacturing and Automation

The rise of Industry 4.0 and smart manufacturing practices is creating new opportunities in the Automotive Turnover Box market. Manufacturers are adopting turnover boxes designed for compatibility with automated guided vehicles (AGVs), robotic arms, and conveyor systems. These innovations enhance production efficiency and traceability, making turnover boxes not only storage tools but also integral components of automated workflows. The demand for RFID-tagged and barcode-integrated boxes is also growing, enabling real-time inventory monitoring and improved supply chain visibility.

  • For instance, at BMW’s Spartanburg plant, a fleet of more than 50 smart transport robots (STRs) performs around 3,500 missions per day, moving standardized M1 turnover boxes that cover about 165 distinct part numbers in the body‑shop logistics flow, demonstrating how automated box movement tightens part delivery consistency and throughput reliability.

Emergence of Customized and Modular Turnover Solutions

Customization and modularity are gaining traction as manufacturers seek tailored packaging solutions for diverse component sizes and shapes. Turnover boxes with adjustable compartments, ergonomic designs, and interlocking features are increasingly preferred to maximize space efficiency and part protection. This trend supports demand for innovative designs that address specific production line needs while maintaining standardization for logistics compatibility. Manufacturers who offer flexible, high-performance packaging designs are likely to capture a competitive edge in this evolving landscape.

Key Challenges

High Initial Investment and Replacement Costs

Despite long-term savings, the initial investment in high-quality turnover boxes can be substantial, especially for small and medium-sized enterprises. Cost factors related to customized designs, durable materials, and integrated technologies such as RFID can limit adoption. Additionally, losses due to box misplacement or wear-and-tear require periodic replacements, posing ongoing financial burdens. These cost-related concerns can restrain the market's growth, particularly in price-sensitive regions or among budget-constrained manufacturers.

Logistical Constraints and Space Utilization Issues

Efficient management and storage of turnover boxes remain a challenge, especially in facilities with limited space or poor organizational systems. Improper stacking or handling can lead to inefficiencies and accidental damage to parts or packaging. Inconsistent box sizes or lack of standardization across production and distribution units may further hinder seamless logistics operations. Addressing these operational constraints requires investment in training, infrastructure, and planning, which can deter rapid adoption among resource-limited players.

Environmental Concerns over Non-recyclable Materials

While plastic turnover boxes are widely adopted, concerns about non-recyclable variants or those made from mixed materials continue to surface. Improper disposal or limited recycling infrastructure can offset the sustainability benefits, attracting scrutiny from regulators and eco-conscious stakeholders. Manufacturers using non-recyclable materials may face increasing pressure to transition toward eco-friendly alternatives, which could involve reengineering products and supply chains adding complexity and cost to operations.

Regional Analysis

North America

North America dominated the Automotive Turnover Box market in 2024 with the highest market share of approximately 41.96%, valued at USD 810.69 million, up from USD 499.75 million in 2018. The region is projected to reach USD 1,601.08 million by 2032, registering a robust CAGR of 8.3%. Growth is fueled by the presence of established automotive OEMs, advanced manufacturing practices, and a strong focus on lean logistics. Additionally, the increasing integration of automation in warehousing and part handling supports the adoption of reusable turnover boxes. The region’s mature infrastructure and regulatory focus on sustainable packaging further enhance market expansion.

Europe

Europe held a significant market share of around 18.38% in 2024, with the market size rising from USD 228.93 million in 2018 to USD 355.63 million. The market is expected to reach USD 639.49 million by 2032, growing at a CAGR of 7.0%. The region’s emphasis on circular economy principles and stringent packaging waste directives drive demand for recyclable and reusable turnover boxes. European automotive hubs in Germany, France, and Italy continue to invest in sustainable and efficient manufacturing processes, further encouraging the use of standardized and modular storage solutions in automotive supply chains.

Asia Pacific

Asia Pacific is the fastest-growing region in the Automotive Turnover Box market, with a CAGR of 9.4% and a 2024 market share of approximately 31.45%. The market surged from USD 351.58 million in 2018 to USD 607.67 million in 2024 and is projected to hit USD 1,301.83 million by 2032. Rapid industrialization, increasing vehicle production in China, India, and Japan, and expanding automotive supply chains are key contributors. The region’s adoption of smart manufacturing practices and investment in logistics infrastructure significantly drive the demand for reusable, stackable, and durable turnover boxes.

Latin America

Latin America accounted for about 4.67% of the global Automotive Turnover Box market in 2024, reaching a market value of USD 90.10 million, up from USD 55.64 million in 2018. The region is projected to grow at a CAGR of 6.6%, reaching USD 157.05 million by 2032. Growth is mainly attributed to the automotive manufacturing expansion in Mexico and Brazil, where cost-effective production processes are being paired with structured logistics systems. The need for reusable and space-efficient packaging solutions to enhance productivity and reduce operational waste is gradually strengthening turnover box adoption across the region.

Middle East

The Middle East held a modest market share of 2.08% in 2024, with the market size growing from USD 27.37 million in 2018 to USD 40.22 million. It is anticipated to reach USD 64.00 million by 2032, with a CAGR of 5.4%. Growth in this region is supported by the development of industrial and automotive hubs in the UAE and Saudi Arabia. The demand for efficient component handling in assembly units and improved warehouse operations is increasing, but market penetration remains limited due to infrastructure constraints and low awareness regarding reusable packaging systems.

Africa

Africa had the smallest share of the global Automotive Turnover Box market in 2024, accounting for around 1.41%, with the market size rising from USD 14.73 million in 2018 to USD 27.29 million. It is forecasted to reach USD 40.50 million by 2032, at a CAGR of 4.4%. Although the region is still in the early stages of automotive industrialization, ongoing investments in local vehicle assembly and supply chain development present long-term opportunities. However, adoption remains slow due to high upfront costs, underdeveloped logistics infrastructure, and limited awareness of the operational benefits of reusable packaging systems.

Automotive Turnover Box Market segmentation

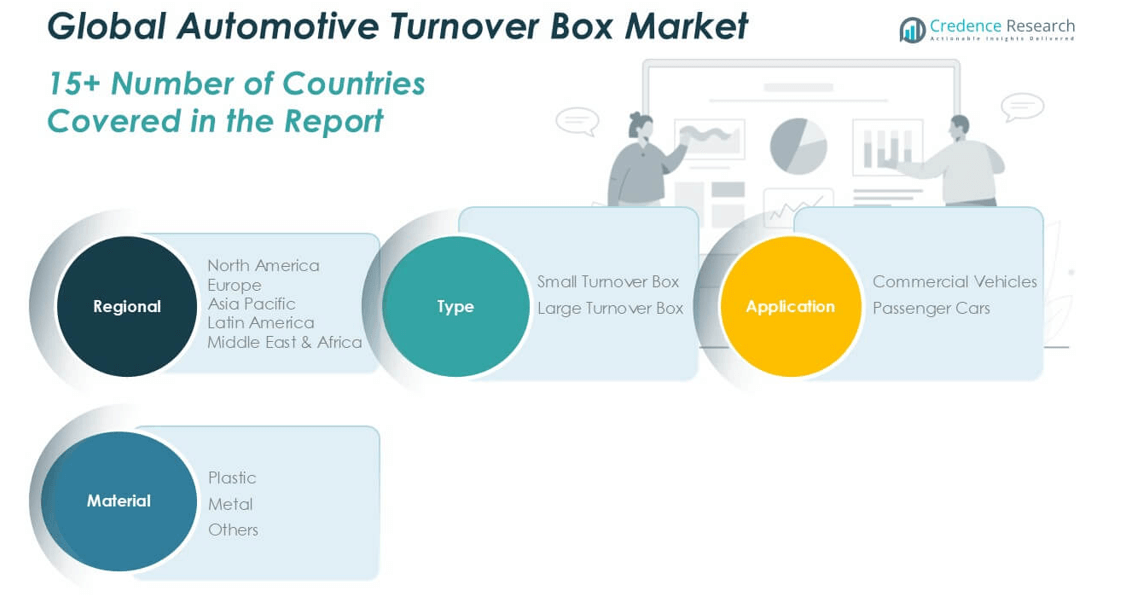
Market Segmentations:

By Type

  • Small Turnover Box
  • Large Turnover Box

By Application

  • Commercial Vehicles
  • Passenger Cars

By Material

  • Plastic
  • Metal
  • Others

By Geography

  • North America
    • U.S.
    • Canada
    • Mexico
  • Europe
    • Germany
    • France
    • U.K.
    • Italy
    • Spain
    • Rest of Europe
  • Asia Pacific
    • China
    • Japan
    • India
    • South Korea
    • South-east Asia
    • Rest of Asia Pacific
  • Latin America
    • Brazil
    • Argentina
    • Rest of Latin America
  • Middle East & Africa
    • GCC Countries
    • South Africa
    • Rest of the Middle East and Africa

Competitive Landscape

The competitive landscape of the Automotive Turnover Box market is characterized by the presence of both global and regional players focusing on innovation, product customization, and strategic partnerships to strengthen their market positions. Leading companies such as Schoeller Allibert, ORBIS, DS Smith, and Georg Utz Holding dominate the market by offering advanced, reusable packaging solutions tailored to the needs of automotive manufacturers and logistics providers. These players emphasize durable materials, ergonomic designs, and integration with automated handling systems to enhance operational efficiency. Additionally, regional manufacturers like Suzhou Dasen Plastic, Jiangsu Yujia, and Shenzhen Xingfeng Plastic cater to local demand through cost-effective and flexible offerings. Many companies are also investing in sustainable product development, leveraging recyclable plastics and eco-friendly processes. Mergers, acquisitions, and collaborations are common strategies aimed at expanding global reach and improving technological capabilities. The market remains moderately consolidated, with innovation and customer-specific solutions serving as key differentiators among competitors.

Key Player Analysis

  • Schoeller Allibert
  • ORBIS
  • DS Smith
  • Georg Utz Holding
  • Kronus
  • Suzhou Dasen Plastic
  • Jiangsu Yujia
  • Ningbo Joy Smart Technology
  • Suzhou First Plastic
  • Shenzhen Xingfeng Plastic

Recent Developments

  • In September 2024, NXP Semiconductors released the MC33777, an advanced battery junction box integrated circuit (IC) designed specifically for electric vehicles (EVs). This innovative IC consolidates key pack-level functions into one device, streamlining battery management systems (BMS) and boosting overall system efficiency.
  • In July 2024, ON Semiconductor announced that it had secured a substantial multi-year agreement with Volkswagen Group, positioning itself as the primary supplier of a comprehensive power box solution for the automaker's next-generation electric vehicles.
  • In June 2022, Hitachi Astemo, Ltd. introduced a prototype of steer-by-wire technology for vehicles, which controls tire movement electronically rather than mechanically, using steering wheel inputs. This prototype not only facilitates seamless and effortless steering wheel maneuvers but also incorporates a fail-safe feature to ensure uninterrupted operation in case of system failure.

Market Concentration & Characteristics

The Automotive Turnover Box Market exhibits a moderately concentrated structure, with a mix of established global players and competitive regional manufacturers. Leading companies such as Schoeller Allibert, ORBIS, and Georg Utz Holding command a significant portion of the market due to their broad product portfolios, strong distribution networks, and advanced manufacturing capabilities. It reflects characteristics of a mature industrial packaging sector, where innovation, sustainability, and customization drive differentiation. The market favors firms that can offer high-quality, reusable solutions compatible with automated systems and lean manufacturing processes. Regional players strengthen their position by offering cost-effective products tailored to local operational needs. Competitive intensity remains high, driven by OEM preferences for durable, space-efficient, and stackable solutions that improve internal logistics. Standardization, ease of handling, and recyclability have become critical purchasing factors. It continues to evolve with increasing adoption of returnable transit packaging and integration of digital features such as RFID and barcode tracking. Strategic alliances and investments in design innovation are shaping product development across core regions.

Report Coverage

The research report offers an in-depth analysis based on Type, Application, Material and Geography. It details leading market players, providing an overview of their business, product offerings, investments, revenue streams, and key applications. Additionally, the report includes insights into the competitive environment, SWOT analysis, current market trends, as well as the primary drivers and constraints. Furthermore, it discusses various factors that have driven market expansion in recent years. The report also explores market dynamics, regulatory scenarios, and technological advancements that are shaping the industry. It assesses the impact of external factors and global economic changes on market growth. Lastly, it provides strategic recommendations for new entrants and established companies to navigate the complexities of the market.

Future Outlook

  1. The market will continue to grow steadily, driven by the expansion of automotive manufacturing worldwide.
  2. Demand for reusable and durable packaging solutions will rise across OEMs and Tier 1 suppliers.
  3. Asia Pacific is expected to remain the fastest-growing region due to industrial growth and automotive exports.
  4. Plastic turnover boxes will maintain dominance due to their lightweight and recyclable properties.
  5. Manufacturers will invest more in automation-compatible and standardized box designs.
  6. RFID and barcode integration will become more common to support real-time inventory tracking.
  7. Customization will gain traction, with modular and application-specific box solutions in higher demand.
  8. Sustainability initiatives will push companies to adopt eco-friendly materials and circular packaging models.
  9. Logistics efficiency and warehouse space optimization will remain key priorities influencing purchases.
  10. Strategic collaborations and capacity expansions will shape competitive positioning in the global market.
Automotive Turnover Box Market Size, Growth and Forecast 2032
Report Attribute Details
Details
Historical Period
-
Base Year
2024
Forecast Period
2024–2032
Automotive Turnover Box Size 2024
USD 1,931.60 million
Automotive Turnover Box CAGR
8.23%
Automotive Turnover Box Size 2032
USD 3,803.96 million

Request a Free Sample

Fill in your details and we'll send you a free sample report.

  • Sample data tables & charts
  • Research methodology

Need a Custom Version of This Report?

Tailor the scope, geography, or segments to your exact requirements.

  • Custom geography or segment scope
  • Direct access to our analyst team

Frequently Asked Questions

What is the current size of the Automotive Turnover Box Market?
The Automotive Turnover Box Market was valued at USD 1,931.60 million in 2024 and is projected to reach USD 3,803.96 million by 2032.
What are the key segments within the Automotive Turnover Box Market?
The market is segmented by Type (Small, Large), Application (Passenger Cars, Commercial Vehicles), and Material (Plastic, Metal, Others).
What are some challenges faced by the Automotive Turnover Box Market?
High initial investment costs, logistical inefficiencies, and environmental concerns over non-recyclable materials are major challenges.
Who are the major players in the Automotive Turnover Box Market?
Key players include Schoeller Allibert, ORBIS, DS Smith, Georg Utz Holding, and Suzhou Dasen Plastic.

Table of Content

Chapter 1. Report Introduction

  • 1.1 Report Description & Purpose
    • 1.1.1 Report Title & Market Definition
    • 1.1.2 Unique Selling Propositions (USP) & Key Differentiators
    • 1.1.3 Value Proposition for Stakeholders
  • 1.2 Research Objectives
    • 1.2.1 Market Sizing Objectives (Volume & Revenue)
    • 1.2.2 Segmentation Objectives
    • 1.2.3 Competitive Intelligence Objectives
    • 1.2.4 Forecast & Scenario Objectives
  • 1.3 Report Scope
    • 1.3.1 Automotive Turnover Box Scope – Types & Subtypes Covered
    • 1.3.2 Geographic Scope – Regions & Countries Covered
    • 1.3.3 Historical Period, Base Year & Forecast Period (2024; forecast to 2032)
    • 1.3.4 Inclusions & Exclusions
  • 1.4 HS Code & Classification Framework
  • 1.5 Currency, Units & Pricing Basis
  • 1.6 Target Stakeholders
  • 1.7 Limitations & Assumptions

Chapter 2. Executive Summary

  • 2.1 Global Automotive Turnover Box Market Snapshot
    • 2.1.1 Market Size – Historical (2024) & Forecast (2024-2032) (2024: USD 1,931.60 million → 2032: USD 3,803.96 million)
    • 2.1.2 Volume & Revenue – Global Totals
    • 2.1.3 Key Market Highlights – Top Five Facts
  • 2.2 Automotive Turnover Box Market Segmentation Snapshot
    • 2.2.1 Market Split by Region – 2024 vs. 2032
  • 2.3 Competitive Snapshot
    • 2.3.1 Top 10 Players by Revenue Share – 2024
    • 2.3.2 Top 10 Players by Volume Share – 2024
    • 2.3.3 Recent Strategic Developments (18-Month Summary)
  • 2.4 Key Investment Highlights & Strategic Conclusions

Chapter 3. Automotive Turnover Box Market Dynamics & Industry Analysis

  • 3.1 Market Overview & Context
    • 3.1.1 Automotive Turnover Box Market Position in the Broader Automotive Value Chain
    • 3.1.2 OEM vs. Replacement Market Dynamics
    • 3.1.3 Market Maturity & Development Stage by Region
  • 3.2 Automotive Turnover Box Market Drivers
  • 3.3 Automotive Turnover Box Market Restraints & Challenges
  • 3.4 Automotive Turnover Box Market Opportunities
  • 3.5 Porter's Five Forces Analysis
    • 3.5.1 Threat of New Entrants
    • 3.5.2 Bargaining Power of Suppliers
    • 3.5.3 Bargaining Power of Buyers
    • 3.5.4 Threat of Substitutes
    • 3.5.5 Competitive Rivalry – Intensity Assessment
  • 3.6 Automotive Turnover Box Value Chain Analysis
    • 3.6.1 Upstream – Raw Material/Input Suppliers
      • 3.6.1.1 Raw Material/Input 1
      • 3.6.1.2 Raw Material/Input 2
      • 3.6.1.3 Raw Material/Input 3
    • 3.6.2 Midstream – Production/Manufacturing/Service Delivery
      • 3.6.2.1 Production/Process Overview
      • 3.6.2.2 Key Facility Locations & Capacity by Manufacturer
    • 3.6.3 Downstream – Distribution & End Consumer
      • 3.6.3.1 Primary Channel – B2B/OEM
      • 3.6.3.2 Secondary Channels – Dealer, Retail, Online, Direct
    • 3.6.4 Value Chain Profitability Analysis
  • 3.7 PESTEL Analysis
    • 3.7.1 Political Factors
    • 3.7.2 Economic Factors
    • 3.7.3 Social Factors
    • 3.7.4 Technological Factors
    • 3.7.5 Environmental Factors
    • 3.7.6 Legal Factors
  • 3.8 Automotive Turnover Box Supply Chain Analysis
    • 3.8.1 Raw Material/Input Supply Risk Assessment
    • 3.8.2 Manufacturing Concentration Risk (Geographic Exposure)
    • 3.8.3 Trade Disruption Impact Analysis
  • 3.9 Regulatory & Policy Landscape

Note: The regulatory and policy landscape section covers regulations based on their applicability to the market, Automotive Turnover Box category, geography, and scope of the study. Only regulatory frameworks with a material impact on operations, compliance, trade, sustainability, or market access are analyzed in detail.

Chapter 4. Key Investment Pockets & Opportunity Analysis

  • 4.1 Automotive Turnover Box Market Attractiveness Analysis
    • 4.1.1 By Region – Investment Attractiveness Matrix (Volume × CAGR)
  • 4.2 Absolute Revenue Growth Opportunity
    • 4.2.1 By Region – Absolute USD Growth Through 2032
  • 4.3 Incremental Volume Opportunity
    • 4.3.1 By Region – Incremental Volume Through 2032
    • 4.3.2 Segment – Incremental Volume
  • 4.4 Emerging Submarket Opportunity Deep Dive (Subject to Applicability)
  • 4.5 Emerging Market Opportunity Scorecards
    • 4.5.1 United States
    • 4.5.2 Europe
    • 4.5.3 Asia
    • 4.5.4 Middle East & Africa

Note: Emerging Market Opportunity Scorecards will be included based on relevance and strategic importance. Regions listed are indicative and may vary depending on data availability and market dynamics.

Chapter 5. Automotive Turnover Box Import-Export Analysis & Trade Flows

  • 5.1 Global Trade Overview
    • 5.1.1 Global Export Value by Country (2024)
    • 5.1.2 Global Export Volume by Country (2024)
    • 5.1.3 Global Import Value by Country (2024)
    • 5.1.4 Global Import Volume by Country (2024)
    • 5.1.5 Net Trade Balance by Country (2024)
  • 5.2 Export Analysis – Segment
    • 5.2.1 Type 1 (HS Code)
    • 5.2.2 Type 2 (HS Code)
    • 5.2.3 Type 3 (HS Code)
    • 5.2.4 Type 4 (HS Code)
    • 5.2.5 Type 5 (HS Code)
  • 5.3 Import Analysis – Segment
    • 5.3.1 Type 1 (HS Code)
    • 5.3.2 Type 2 (HS Code)
    • 5.3.3 Type 3 (HS Code)
    • 5.3.4 Type 4 (HS Code)
    • 5.3.5 Type 5 (HS Code)
  • 5.4 Average Unit Trade Prices
    • 5.4.1 Average Export Price – Segment & Country
    • 5.4.2 Average Import Price – Segment & Source Country
    • 5.4.3 Price Trends (2024)
  • 5.5 Key Trade Route Analysis
    • 5.5.1 Trade Route 1
    • 5.5.2 Trade Route 2
    • 5.5.3 Trade Route 3
    • 5.5.4 Trade Route 4
    • 5.5.5 Trade Route 5
  • 5.6 Trade Policy Impact Assessment
    • 5.6.1 US Anti-Dumping & Section 301 Tariffs
    • 5.6.2 EU Customs Union Impact
    • 5.6.3 Major Free Trade Agreements
    • 5.6.4 USMCA Rules of Origin

Note: Trade policy analysis will be included only where relevant to the Automotive Turnover Box market.

Chapter 6. Competitive Landscape & Company Benchmarking

  • 6.1 Automotive Turnover Box Market Concentration & Structure
    • 6.1.1 Herfindahl-Hirschman Index (HHI) – vs. 2024
    • 6.1.2 Tier 1, Tier 2 & Tier 3 Market Structure
    • 6.1.3 Global, Regional & Local Player Dynamics
  • 6.2 Automotive Turnover Box Market Share Analysis – 2024
    • 6.2.1 Global Revenue Share by Company
    • 6.2.2 Global Volume Share by Company
    • 6.2.3 Regional Revenue Share
    • 6.2.4 Market Share Evolution ( vs. 2024)
    • 6.2.5 OEM Segment Share by Company
    • 6.2.6 Replacement Segment Share by Company
  • 6.3 Production/Delivery Capacity & Facility Analysis
    • 6.3.1 Global Installed Capacity
    • 6.3.2 Capacity Utilization Rates
    • 6.3.3 Production/Output Volume
    • 6.3.4 Facility Locations & Capacity Map
    • 6.3.5 Planned Capacity Additions
  • 6.4 Automotive Turnover Box Competitive Benchmarking Matrix
    • 6.4.1 Revenue, Volume, CAGR & Profitability Comparison
    • 6.4.2 Channel Revenue Mix
    • 6.4.3 Geographic Revenue Exposure
    • 6.4.4 R&D Intensity
    • 6.4.5 Sustainability Maturity
  • 6.5 Strategic Developments in Automotive Turnover Box (Last 24 Months)
    • 6.5.1 Mergers, Acquisitions & Divestments
    • 6.5.2 New Automotive Turnover Box Launches
    • 6.5.3 Facility Expansions
    • 6.5.4 Strategic Alliances, Joint Ventures & Partnerships
    • 6.5.5 Distribution Expansion & Market Entry
    • 6.5.6 Sustainability & ESG Initiatives
  • 6.6 Competitive Strategy Mapping
    • 6.6.1 Leader, Challenger, Follower & Niche Classification
    • 6.6.2 Pricing Strategy Comparison
    • 6.6.3 Channel Strategy Matrix

Note: Strategic developments are included based on their materiality and the availability of reliable information.

Chapter 7. Global Automotive Turnover Box Market – By Distribution Channel

  • 7.1 Segment Overview
    • 7.1.1 Volume & Revenue Split by Channel (2024 & 2032)
    • 7.1.2 Channel Mix Evolution (2024-2032)

Chapter 8. Regional Market Analysis – Global Overview

  • 8.1 Global Regional Overview
    • 8.1.1 Regional Volume Share
    • 8.1.2 Regional Revenue Share
    • 8.1.3 Regional Volume by Region
    • 8.1.4 Regional Revenue by Region
    • 8.1.5 Regional Forecast Through 2032
  • 8.2 Cross-Regional Segment Analysis
    • 8.2.1 By Distribution Channel
    • 8.2.2 By Brand/Price Tier

Chapter 9. North America Automotive Turnover Box Market

  • 9.1 United States
  • 9.2 Canada
  • 9.3 Mexico

Chapter 10. Europe Automotive Turnover Box Market

  • 10.1 Germany
  • 10.2 France
  • 10.3 Italy
  • 10.4 United Kingdom
  • 10.5 Spain
  • 10.6 Poland
  • 10.7 Russia
  • 10.8 Netherlands
  • 10.9 Belgium
  • 10.10 Sweden
  • 10.11 Denmark
  • 10.12 Norway
  • 10.13 Rest of Europe

Chapter 11. Asia Pacific Automotive Turnover Box Market

  • 11.1 China
  • 11.2 India
  • 11.3 Japan
  • 11.4 South Korea
  • 11.5 Thailand
  • 11.6 Indonesia
  • 11.7 Vietnam
  • 11.8 Malaysia
  • 11.9 Australia
  • 11.10 Rest of Asia Pacific

Chapter 12. Latin America Automotive Turnover Box Market

  • 12.1 Brazil
  • 12.2 Argentina
  • 12.3 Colombia
  • 12.4 Chile
  • 12.5 Rest of Latin America

Chapter 13. Middle East Automotive Turnover Box Market

  • 13.1 Saudi Arabia
  • 13.2 United Arab Emirates
  • 13.3 Turkey
  • 13.4 Israel
  • 13.5 Iran
  • 13.6 Rest of the Middle East

Chapter 14. Africa Automotive Turnover Box Market

  • 14.1 South Africa
  • 14.2 Egypt
  • 14.3 Nigeria
  • 14.4 Morocco
  • 14.5 Rest of Africa

Chapter 15. Automotive Turnover Box Company Profiles

  • 15.1 [Company 01]
    • 15.1.1 Company Overview
    • 15.1.2 Key Management Personnel
    • 15.1.3 Products & Services Portfolio
    • 15.1.4 Financial Performance
    • 15.1.5 Key Market Focus & Geographic Presence
    • 15.1.6 Recent Developments & Strategic Initiatives

Note: The company profile list is preliminary and may change based on research findings, market developments, data availability, and client requirements.

Chapter 16. Appendices

  • Appendix A – List of Abbreviations & Acronyms
  • Appendix B – Industry Classification Code Reference – Full Series
  • Appendix C – Production & Capacity Data Tables
  • Appendix D – End-Use & Demand Base Tables
  • Appendix E – Consumption & Replacement Rate Assumptions
  • Appendix F – ASP Reference Tables
  • Appendix G – Manufacturing & Facility Database
  • Appendix H – Import-Export Data Tables
  • Appendix I – Regulatory Summary Tables
  • Appendix J – Primary Research Participant List (Anonymized)
  • Appendix K – Primary Research Questionnaire Framework
  • Appendix L – Data Sources & Bibliography
  • Appendix M – Market Size Divergence & Source Comparison

Chapter 17. Research Methodology

  • 17.1 Research Framework & Philosophy
  • 17.2 Secondary Research – Sources, Hierarchy & Data Extraction
  • 17.3 Data Modeling – Bottom-Up & Top-Down Market Sizing
  • 17.4 Primary Research – Stakeholder Framework, LOI & Sample Sizes
  • 17.5 Forecast Methodology – Regression, Scenario & Sensitivity Analysis
  • 17.6 Quality Control – Four-Layer Validation Framework
  • 17.7 Limitations & Standard Assumptions
  • 17.8 Disclaimer

Methodology

Meet the Team

Sushant Phapale
Sushant Phapale

ICT & Automation Expert

Sushant is an expert in ICT, automation, and electronics with a passion for innovation and market trends.

Related Topics

Directional Drilling Services Market Size, Growth and Forecast 2032

The Directional Drilling Services Market size was estimated at USD 31,250.70 million in 2025 and is expected to reach USD 44,783.30 million by 2032, growing at a CAGR of 6.18% from 2025 to 2032

Hydraulics Market Size, Share, Analysis, Trends and Forecast 2032

The global hydraulics market was valued at USD 46,140 million in 2024 and is projected to reach USD 59,824.9 million by 2032, expanding at a CAGR of 3.3% during the forecast period.

Wood Processing Machines Market Size, Share and Forecast 2032

The wood processing machines market was valued at USD 5,277 million in 2024 and is expected to reach USD 7,707.7 million by 2032, growing at a CAGR of 4.85% during the forecast period.

Laser Welding Machine Market Size, Growth and Forecast 2032

The global laser welding machine market was valued at USD 3,176 million in 2024 and is anticipated to reach USD 4,899.9 million by 2032.

HVAC System Market Size, Growth, Share and Forecast 2032

The global HVAC system market size was valued at USD 165,873 million in 2024 and is projected to reach USD 254,562.7 million by 2032.

Mobile Robotics Market Size, Share, Growth and Forecast 2032

The Mobile Robotics Market size was valued at USD 25,390 million in 2024 and is anticipated to reach USD 111372.8 million by 2032, at a CAGR of 20.3 % during the forecast period.