Antibodies and peptide hormones carry most biologic value
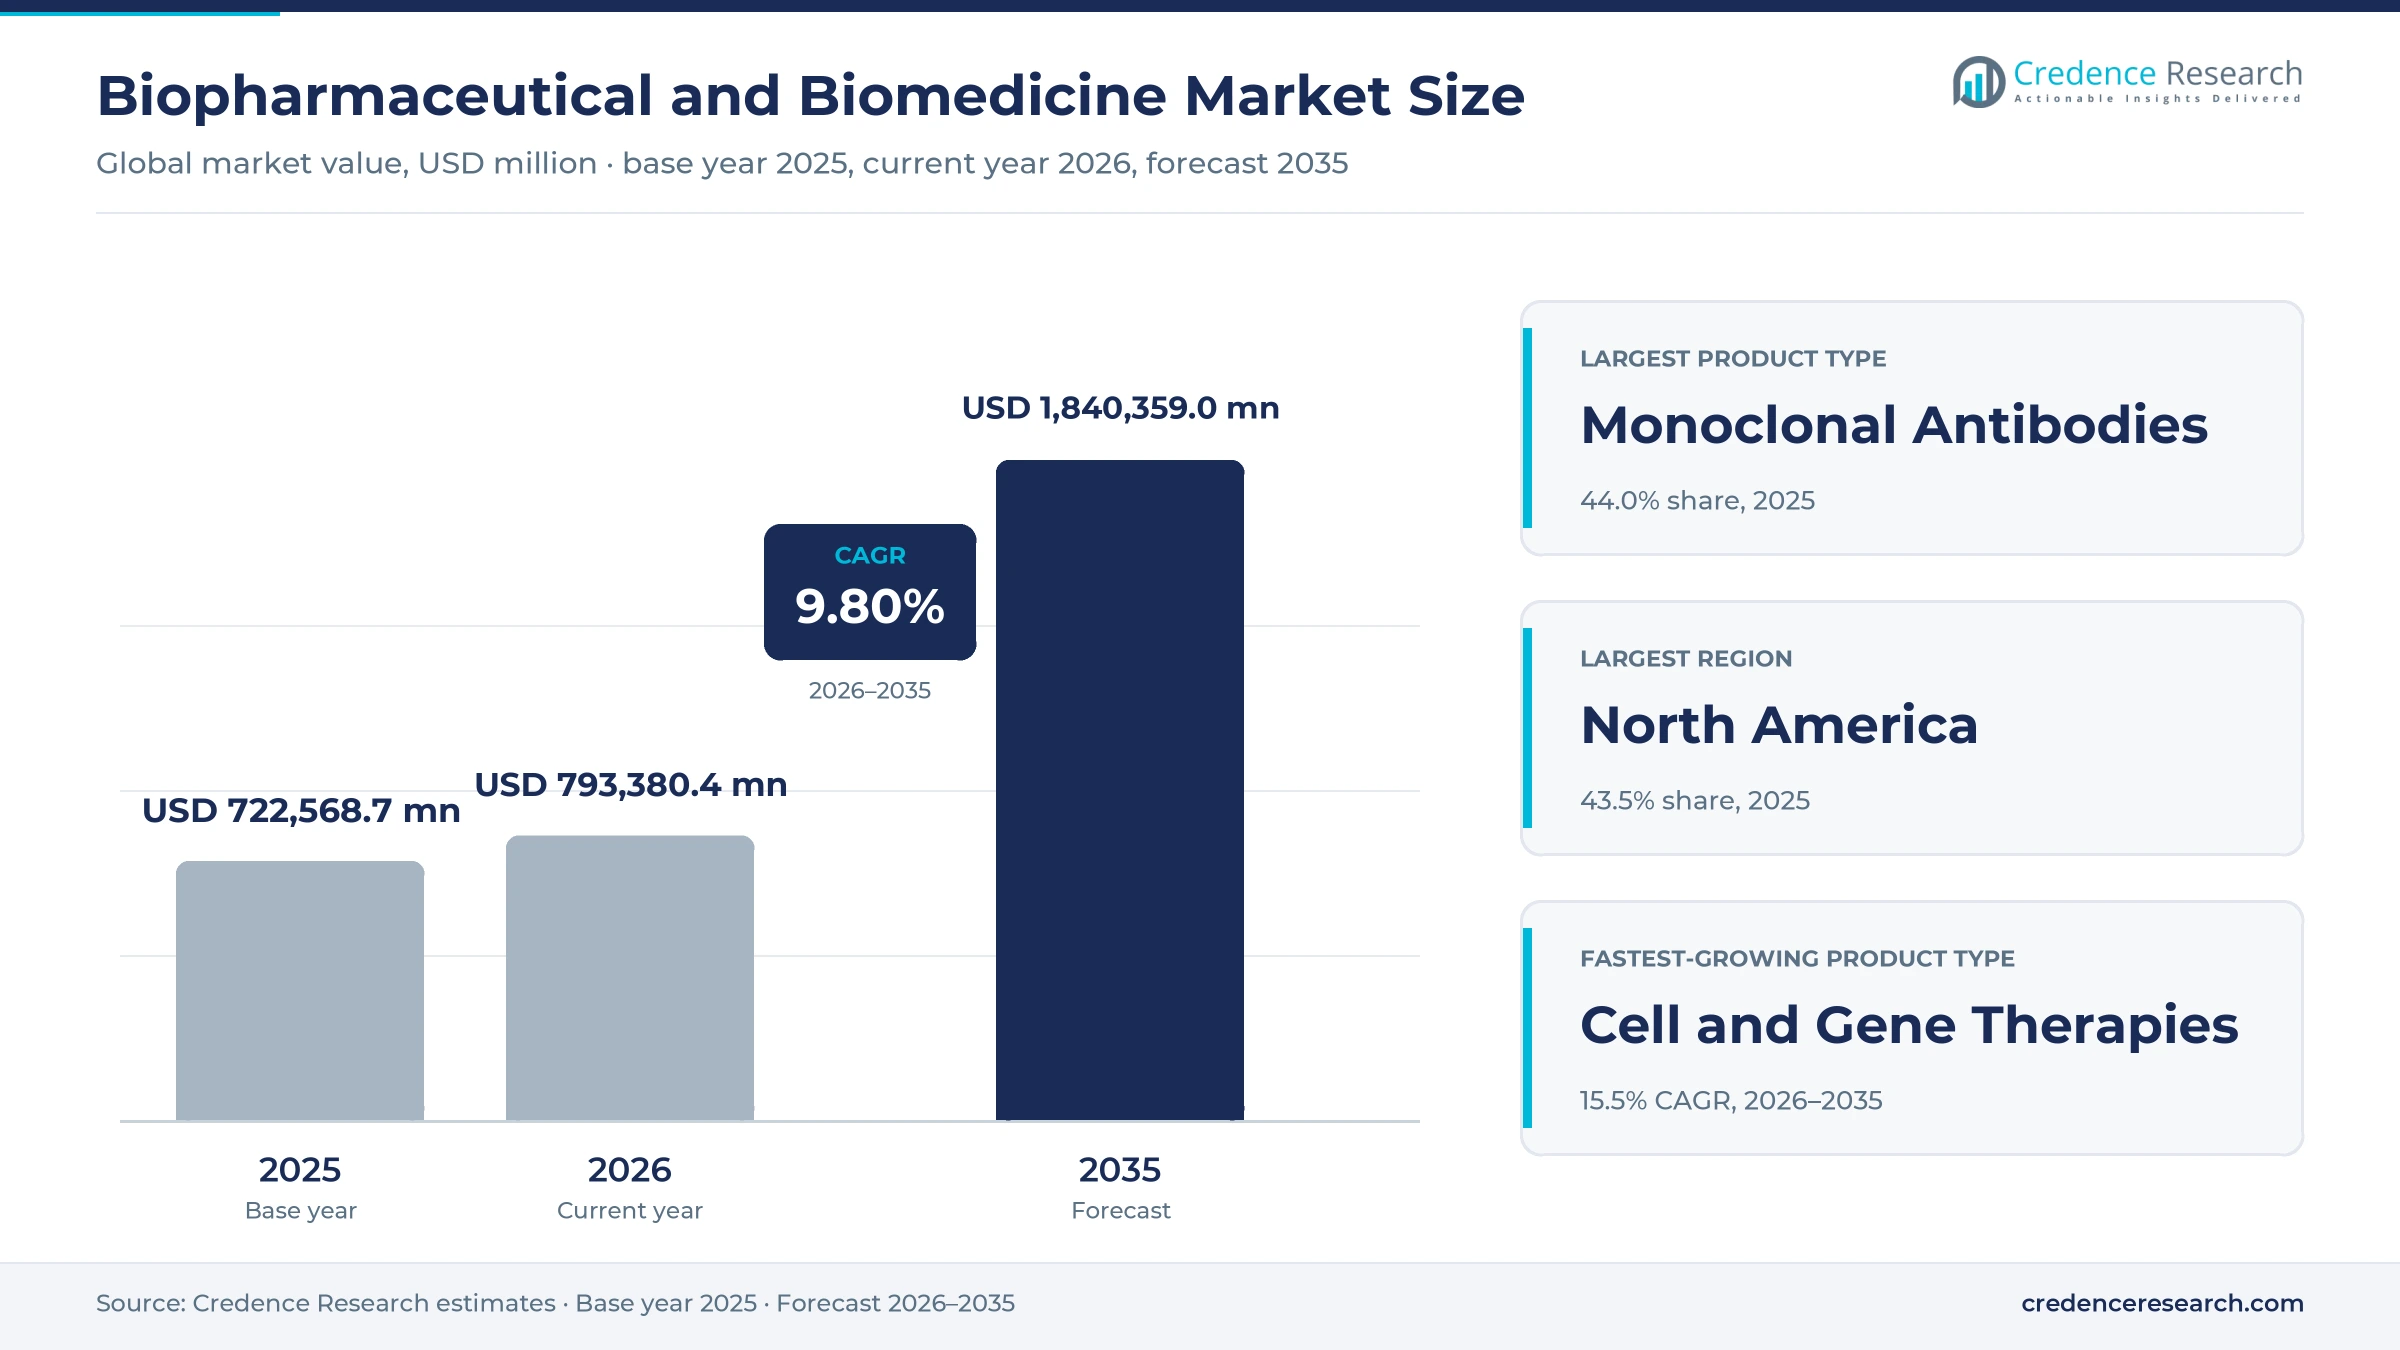
The global biopharmaceutical and biomedicine market was valued at USD 722.57 billion in 2025 and is projected to increase from USD 793.38 billion in 2026 to USD 1,840.36 billion by 2035, registering a CAGR of 9.80% during 2026–2035. Demand rests on monoclonal antibodies for cancer and immune disorders, recombinant proteins and peptide hormones for diabetes and obesity, vaccines, plasma-derived products and a small but fast-rising group of cell and gene therapies. North America held the largest regional share, 43.5% in 2025, because high list prices, early launches and specialty pharmacy distribution concentrate value there. Asia Pacific is the fastest-growing region at 11.5% a year, as Chinese developers win domestic approvals and Korean contract plants add capacity. The commercial change shaping the forecast is a policy squeeze on price, with Medicare negotiation reaching injectable biologics and peptide hormones from 2027 while U.S. tariff and procurement rules push sponsors to build plants closer to American patients.
Which medicines does the estimate count, and who buys them?
The estimate counts manufacturer sales of medicines produced in or derived from living systems, including originator antibodies and antibody-drug conjugates, recombinant proteins and peptide hormones, vaccines, biosimilars, cell and gene therapies, nucleic acid medicines and blood and plasma products. Hospitals, specialty pharmacies, retail pharmacies and national vaccine and tender programs buy these products, while public and private payers decide most net prices through rebates, negotiation and reimbursement lists.
Laboratory tools, reagents, instruments, contract manufacturing fees and diagnostic kits sit outside the estimate, although the earlier edition of this report listed several tool suppliers among its players. They form the supply chain that feeds the market rather than the medicines patients receive. Contract manufacturers appear in the analysis only where their capacity changes the cost or timing of supply for the companies that sell the finished product.
Biopharmaceutical and Biomedicine Market Insights
- The market is valued at USD 722.57 billion in 2025 and is projected to reach USD 1,840.36 billion by 2035, growing at a 9.80% CAGR as antibody, peptide and cell therapy launches add value.
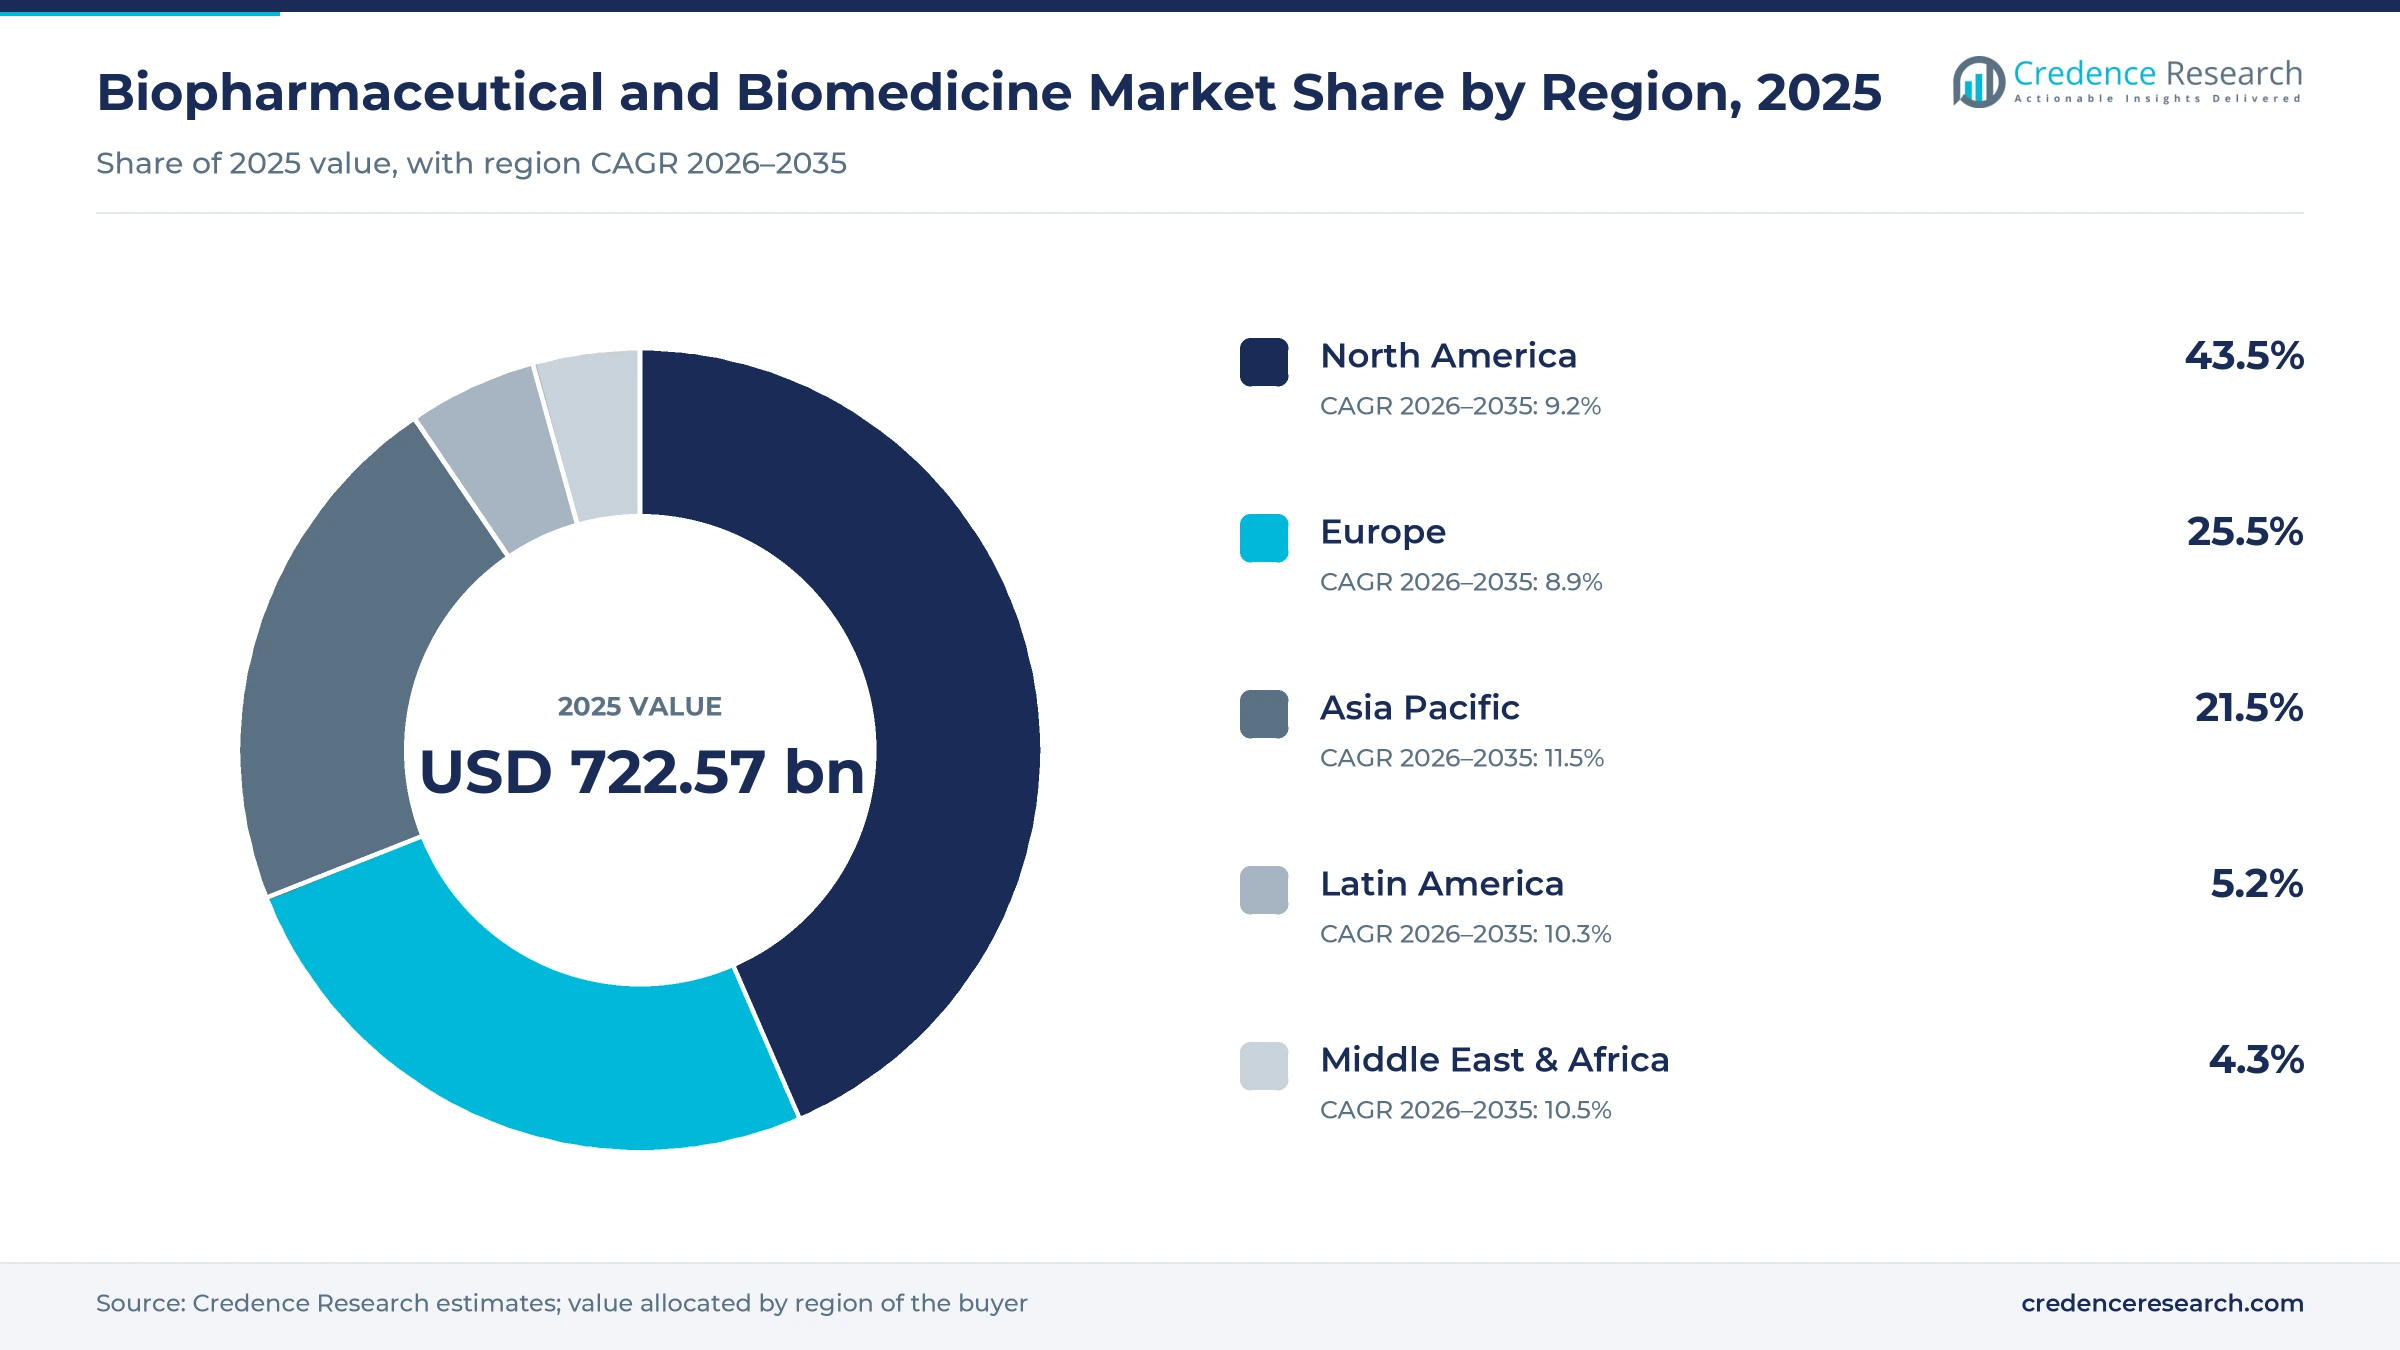
- North America led with 43.5% of 2025 value, because high U.S. prices and early launches concentrate spending on biologic medicines there.
- Monoclonal Antibodies held 44.0% of 2025 value, while cell and gene therapies grow fastest at 15.5% a year.
- Medicare negotiated prices for 15 drugs that take effect in 2027, including a 71% cut for semaglutide products, according to NPR.
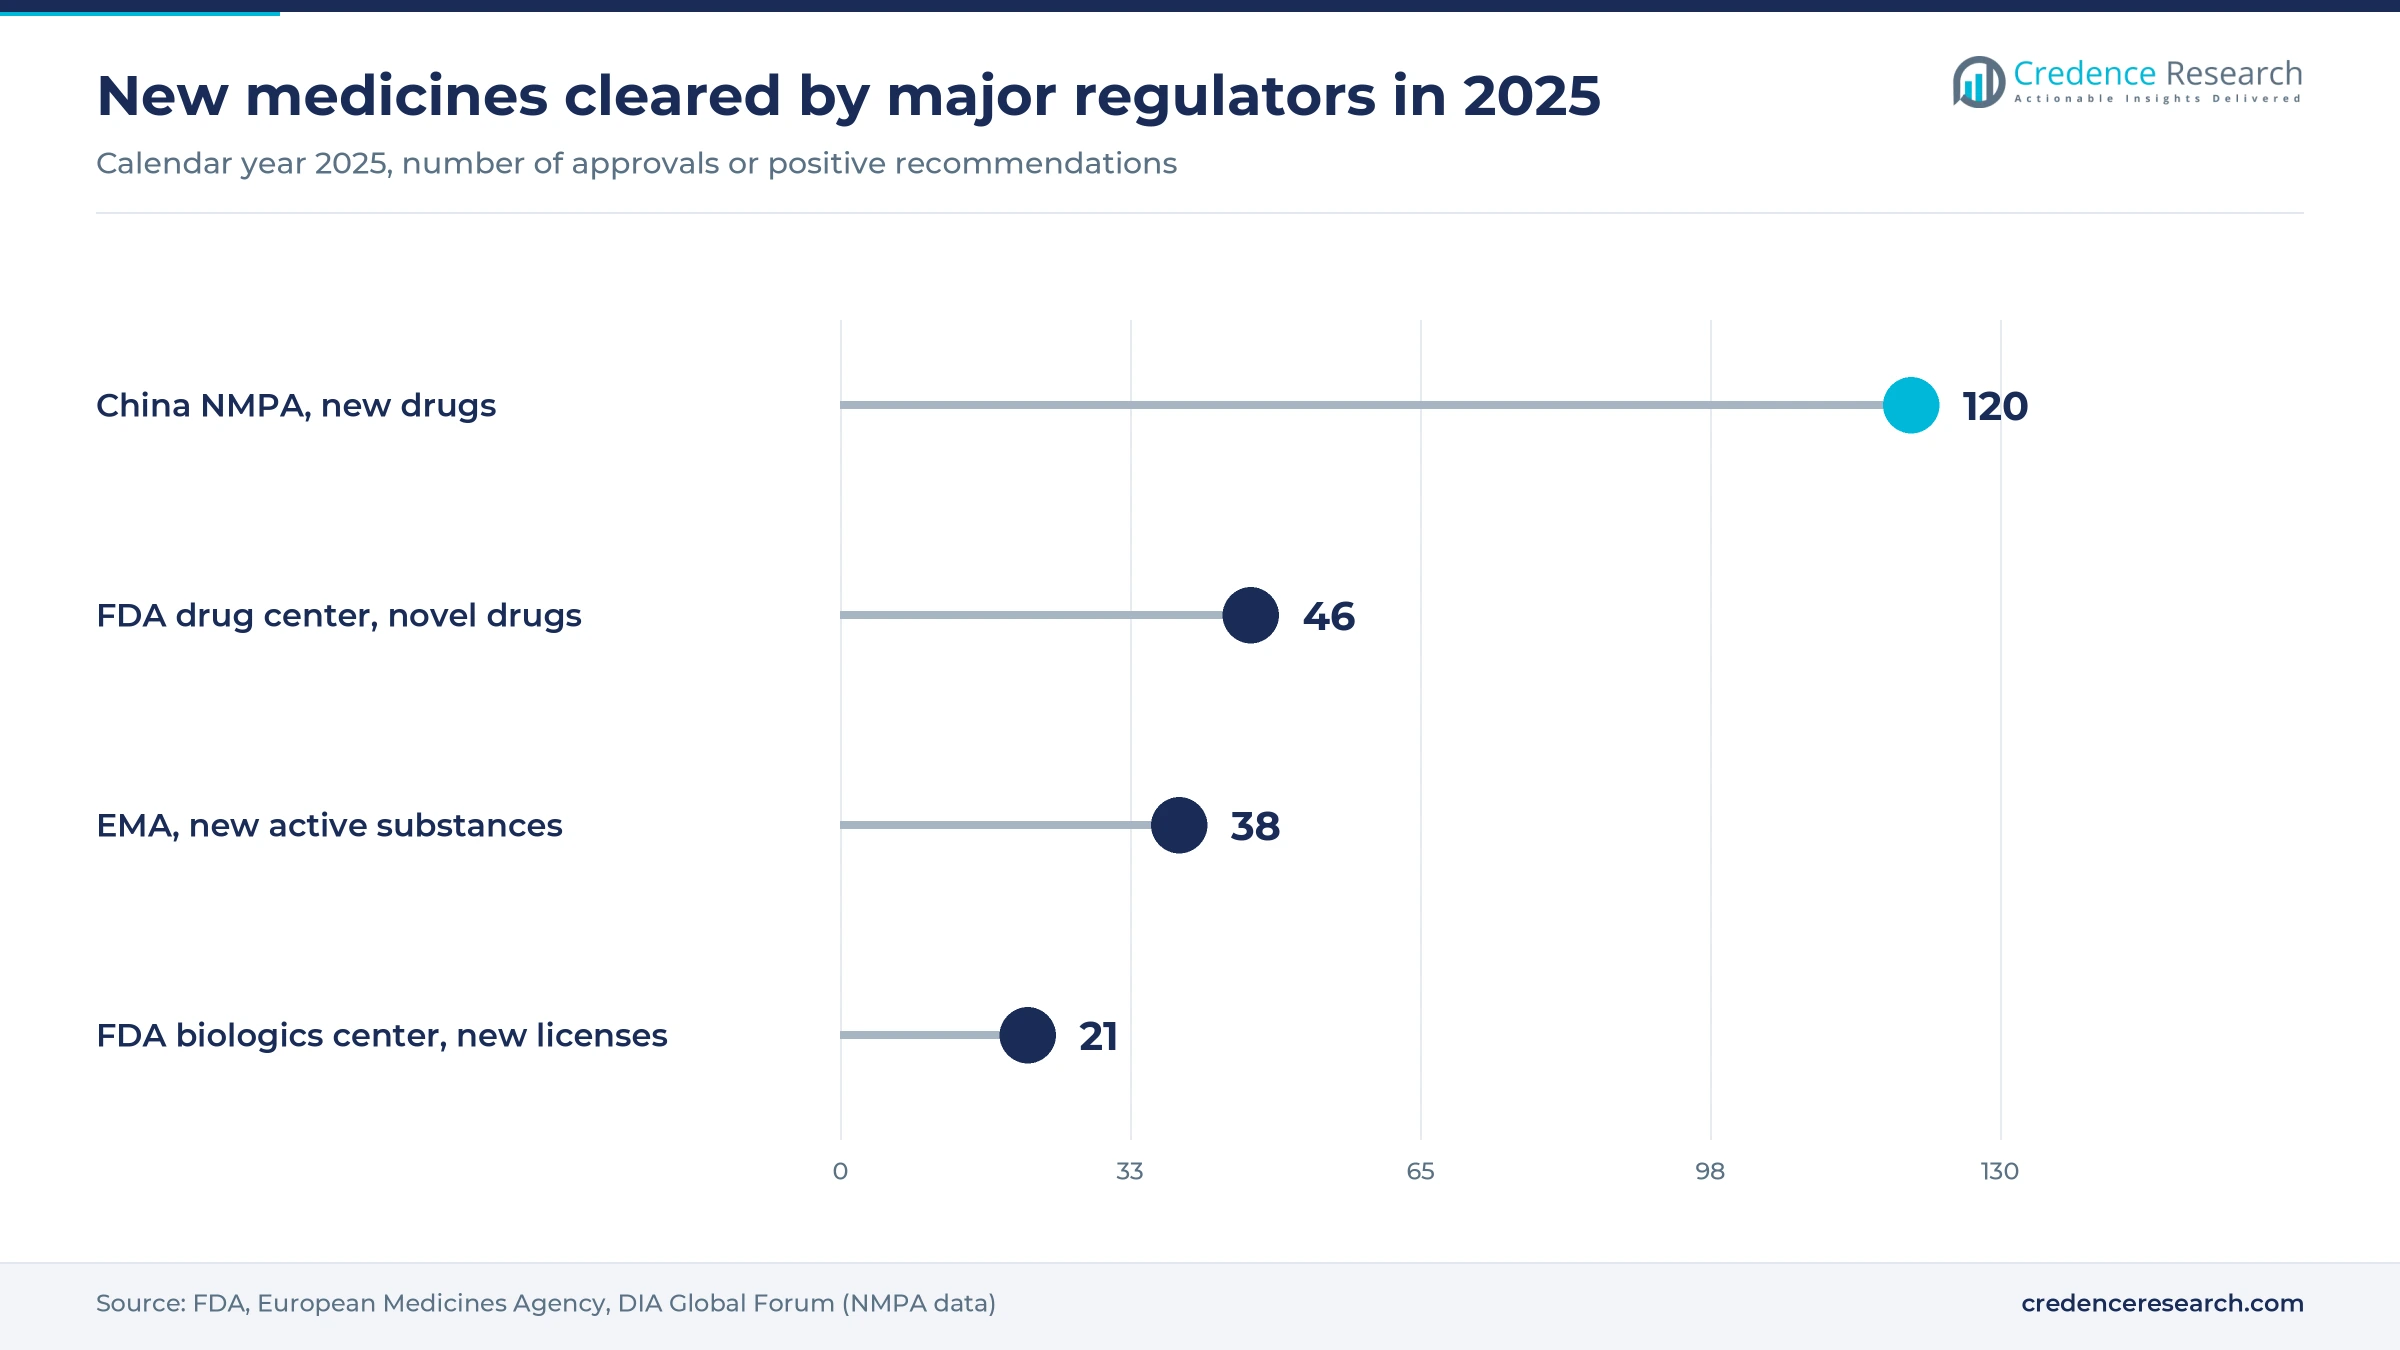
- China's regulator approved 120 new drugs in 2025 for the first time in triple digits, 40 of them biologics, according to the DIA Global Forum.
Antibodies lead while cell and gene therapies grow fastest
Why do antibodies keep the largest product share?
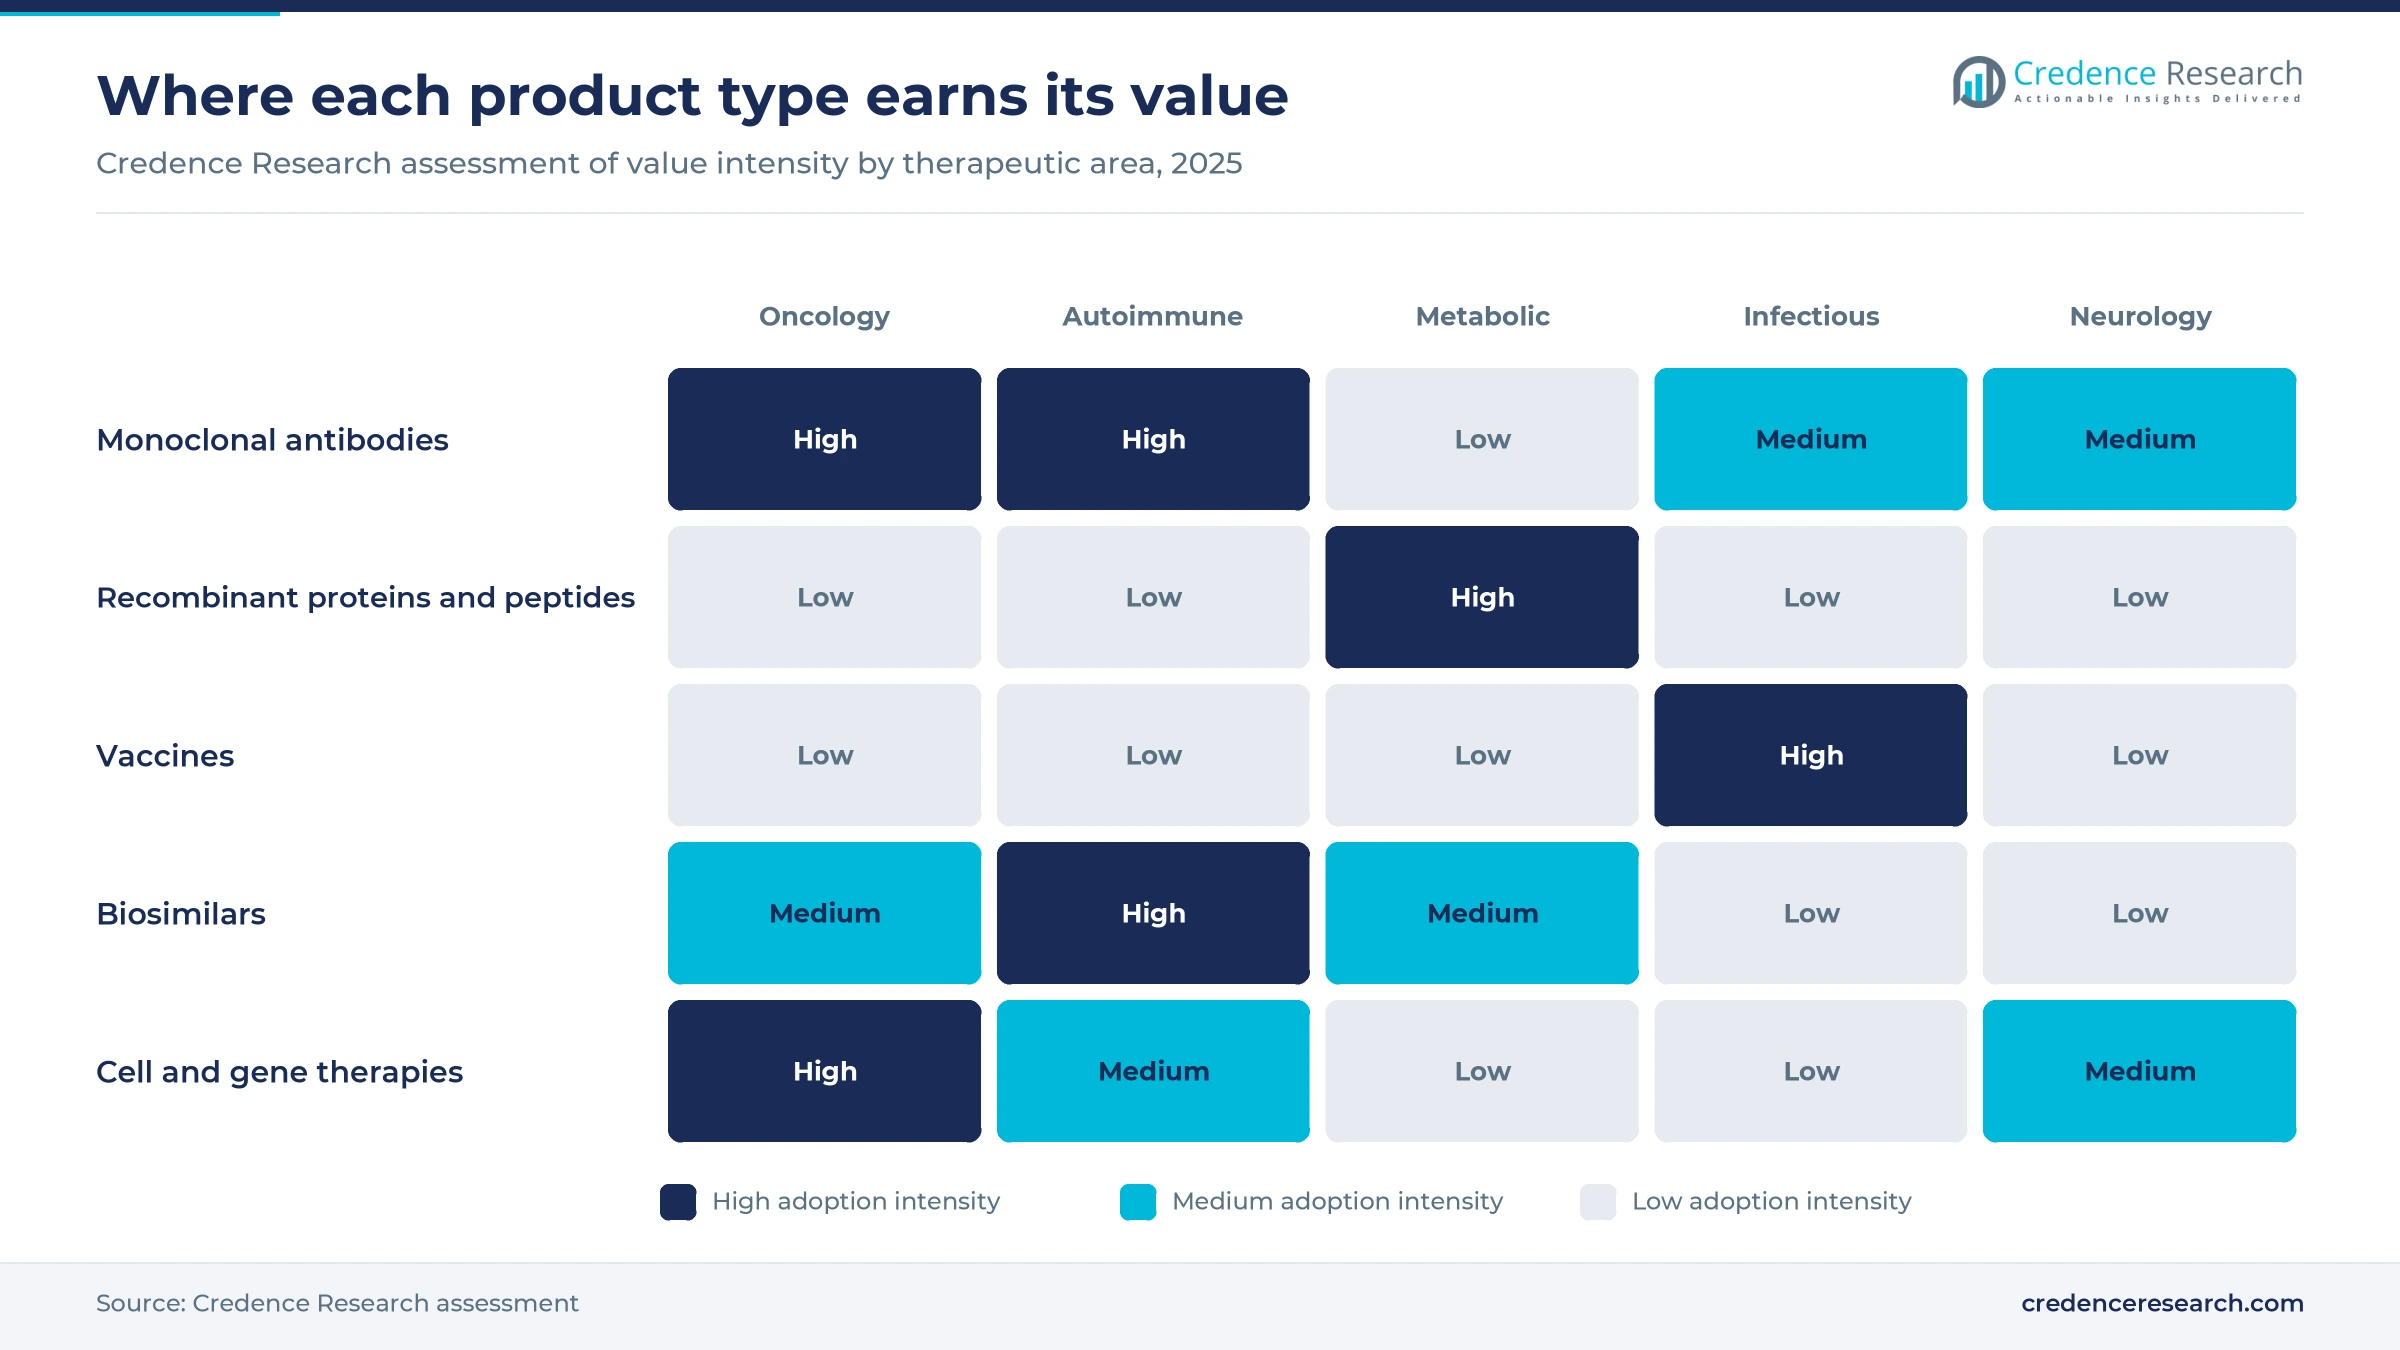
Based on product type, the market is categorized into monoclonal antibodies, recombinant proteins and peptide hormones, vaccines, biosimilars, cell and gene therapies, nucleic acid therapeutics and blood and plasma products. Monoclonal Antibodies led with 44.0% of 2025 value because antibodies span cancer, immunology and neurology, and 11 of the 46 novel drugs cleared by FDA's drug center in 2025 carried the antibody naming stem, two of them conjugates. Cell and gene therapies grow fastest at 15.5% a year, as FDA's biologics center licensed three gene therapies and two cell therapies in 2025, among them Zevaskyn on April 28, 2025. Complex manufacturing still limits how many patients each approval reaches.
How does cancer care hold the largest therapeutic share?
Based on therapeutic area, the market is categorized into oncology, autoimmune and inflammatory diseases, metabolic and cardiovascular diseases, infectious diseases, neurological disorders, rare diseases, hematology and others. Oncology led with 32.0% of 2025 value because cancer antibodies are priced per cycle and used for months, and five of FDA's 11 antibody approvals in 2025 treated cancers, from Datroway on Jan. 17, 2025 to the myeloma bispecific Lynozyfic on July 2, 2025. Neurological disorders grow fastest at 12.3% a year, as anti-amyloid antibodies move into long-term maintenance dosing, and FDA approved the weekly Leqembi Iqlik autoinjector for at-home maintenance treatment of early Alzheimer's disease on Aug. 29, 2025.
Why do large pharmaceutical companies keep most of the value?
Based on developer, the market is categorized into large pharmaceutical companies, mid-size and emerging biotechnology companies, and biosimilar manufacturers. Large Pharmaceutical Companies led with 68.0% of 2025 value because they own global launch, payer and manufacturing networks and keep buying late-stage assets, as when Novartis completed its Avidity Biosciences acquisition in February 2026. Biosimilar manufacturers grow fastest at 12.1% a year, as the European Medicines Agency recommended 41 biosimilars among the 104 medicines it backed in 2025. Emerging biotechnology companies increasingly reach patients through licensing deals rather than their own sales forces.
| Segment Group | Leading Sub-segment | Share, 2025 | Fastest-growing Sub-segment | CAGR, 2026–2035 |
|---|---|---|---|---|
| By Product Type | Monoclonal Antibodies | 44.0% | Cell and Gene Therapies | 15.5% |
| By Therapeutic Area | Oncology | 32.0% | Neurological Disorders | 12.3% |
| By Developer | Large Pharmaceutical Companies | 68.0% | Biosimilar Manufacturers | 12.1% |
List prices fall as payers and self-pay channels push back
Biologic pricing works on two layers, a published list price and a confidential net price after rebates, discounts and statutory negotiation. Chronic therapies such as peptide hormones and antibodies are priced per month or per dose, while gene therapies carry a single charge per patient, often tied to outcomes agreements with payers. Net prices are moving down through three channels at once, Medicare negotiation, direct self-pay programs that bypass insurance and biosimilar competition. Originators protect margin by shifting patients to new formulations and indications, while payers gain leverage whenever two or more interchangeable products exist.
| Product or channel | Typical price or fee | Basis |
|---|---|---|
| Wegovy (semaglutide) self-pay, Novo Nordisk | USD 349 per month, USD 199 for the first two fills | Novo Nordisk pricing reported by pharmaphorum, November 2025 |
| Mounjaro and Zepbound (tirzepatide) self-pay through TrumpRx, Eli Lilly | USD 299 to 449 per month by dose | Eli Lilly pricing reported by pharmaphorum, November 2025 |
| Ozempic, Wegovy and Rybelsus, Medicare negotiated price | USD 274 per month from 2027, against list prices near USD 1,000 | Centers for Medicare and Medicaid Services, reported by NPR, November 2025 |
| Itvisma one-time gene therapy for spinal muscular atrophy, Novartis | USD 2.59 million per patient | Managed Healthcare Executive, November 2025 |
Request a Free Sample
Fill in your details and we'll send you a free sample report.
- Sample data tables & charts
- Research methodology
Deals, new plants and steady approvals sustain growth
Late-stage antibody deals move value to launch-ready owners
Large acquirers are paying for late-stage antibodies because a product close to approval converts research spending into sales within a few years, and owners with global commercial teams extract more value from each launch. Genmab completed its tender offer for Merus on Dec. 12, 2025 at USD 97 a share in cash, with about 94.2% of shares tendered, according to its SEC filing. The main asset, the bispecific antibody petosemtamab for head and neck cancer, carries two Breakthrough Therapy designations, and Genmab expects to launch it in 2027, subject to trial results and approval. Oncology already accounts for 32.0% of 2025 value, so cancer antibody deals add directly to the largest pool of spending, while sellers of earlier-stage assets face tougher terms.
New mammalian and injectable capacity lowers supply risk
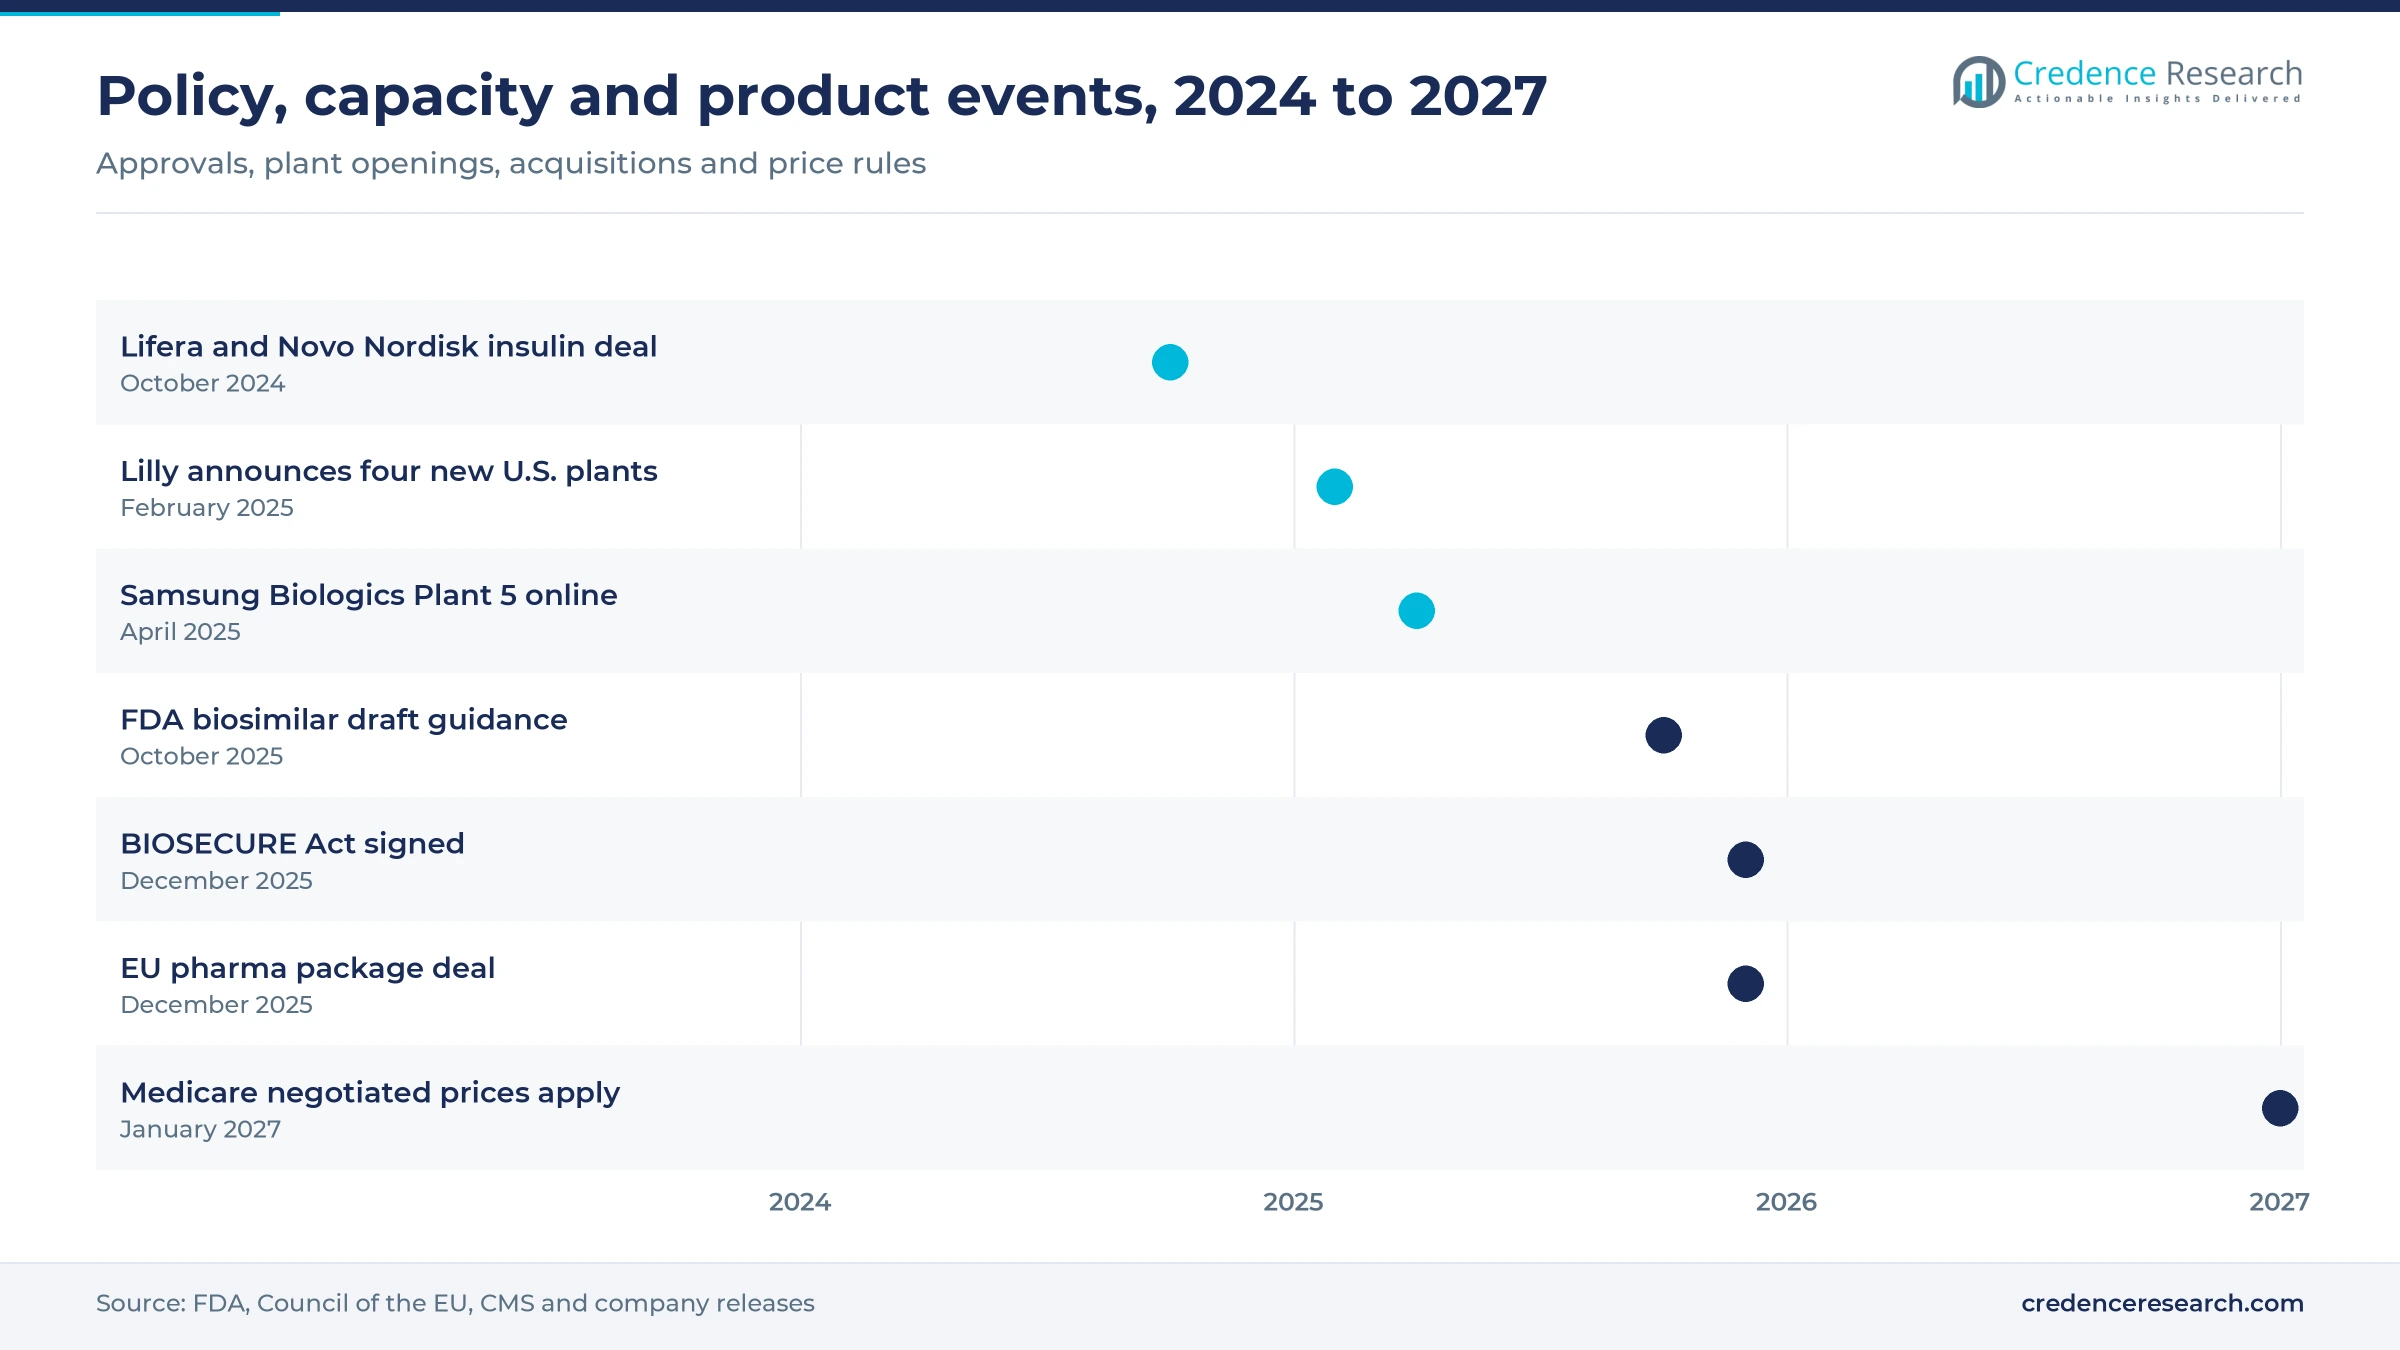
Manufacturing capacity sets the ceiling on how fast a successful biologic can reach patients, and the industry is adding it on both sides of the Pacific. Samsung Biologics opened Plant 5 in Songdo in April 2025, adding 180,000 liters and lifting its total to 784,000 liters, the company says, which deepens the pool of biologics contract manufacturing available to sponsors. Eli Lilly said on Feb. 26, 2025 that it would build four new U.S. sites, one of them extending its injectable network, taking its U.S. commitments since 2020 above USD 50 billion. Antibodies already hold 44.0% of value, so large-scale cell culture capacity serves the biggest product class first and reduces the shortage risk that delays launches.
Regulators keep a steady flow of new biologic approvals
A stable approval rate in the two largest regulated markets keeps refilling the list of products that payers must reimburse, offsetting revenue lost to biosimilars and price cuts. FDA's drug center approved 46 novel drugs in 2025, including new antibodies for severe asthma, generalized myasthenia gravis and the prevention of hereditary angioedema attacks. The European Medicines Agency recommended 104 medicines in 2025, 38 of them with a new active substance, and 16 of its recommendations addressed rare diseases. Rare disease products often reach premium prices with small patient numbers, so this approval mix supports value growth even when volume rises slowly, favoring sponsors with specialist sales teams.
China turns from importer into a source of new biologics
China now adds approvals and exportable assets rather than only consuming imported medicines, which enlarges both its domestic market and the global pipeline. The National Medical Products Administration approved 120 new drugs in 2025, reaching triple digits for the first time, according to the DIA Global Forum, and 40 of those were biologics, including 18 monoclonal antibodies. Domestic companies accounted for 63 approvals, or 52%, ahead of imports. The IQVIA Institute projects Chinese medicine use reaching an index of 196 by 2030 against 100 in 2020, the fastest rise of any major market. Multinational buyers increasingly license Chinese antibodies for Western trials, which spreads this pipeline beyond Asia Pacific.
Self-injection, leaner biosimilar rules and local production
Biologics shift toward subcutaneous and self-administered use
Originators are shifting antibodies and peptides from infusion chairs toward injections that patients or nurses give in minutes, to cut treatment time and extend franchise life. FDA approved Merck's Keytruda Qlex, a subcutaneous pembrolizumab co-formulated with berahyaluronidase alfa, on Sept. 19, 2025 for adult and pediatric solid tumor uses of the intravenous form. The Leqembi autoinjector noted above brings the same shift to Alzheimer's maintenance care at home. Novo Nordisk cut its self-pay Wegovy price on Nov. 17, 2025 and said the product is sold through about 70,000 pharmacies and telehealth partners, pharmaphorum reported. These formats move spending from hospital outpatient budgets toward pharmacy channels and favor companies with device and formulation expertise.
Biosimilar developers shift to analytics-led programs
Biosimilar developers are shifting from large comparative trials toward analytical comparability packages, because regulators now accept that sensitive laboratory tests detect product differences better than efficacy studies. FDA issued draft guidance on Oct. 29, 2025 proposing that such trials are generally no longer needed, and HHS put their average cost at about USD 24 million and their duration at one to three years. The agency also no longer generally recommends switching studies for interchangeability. FDA approved several denosumab biosimilars referencing Prolia and Xgeva during 2025, according to Pharmacy Times. Lower development costs open the market for biosimilars to mid-size producers and support biosimilar manufacturers growing at 12.1% a year.
Cell therapy for autoimmune disease is an emerging opening
Autoimmune disease is the clearest new market for engineered cell therapies, because a single course that resets the immune system could replace years of chronic biologic treatment. FDA biologics chief Vinay Prasad and two colleagues wrote in the Annals of Internal Medicine in February 2026 that the agency would carefully shepherd autoimmune CAR-T studies case by case, according to Fierce Biotech. In the CARLYSLE study of obecabtagene autoleucel, five of six lupus patients on the lower dose reached remission, University College London reported in June 2026. Cell and gene therapies grow at 15.5% a year, and developers of gene and cell therapy platforms with scalable allogeneic or rapid manufacturing gain most if long-term safety holds.
Local production programs open supply roles in emerging markets
Governments outside the main markets are paying for local biologic production to secure supply and keep spending at home, an opening for companies willing to transfer technology. Lifera, owned by Saudi Arabia's Public Investment Fund, agreed with Novo Nordisk in October 2024 to localize more than half of the kingdom's insulin needs, according to the Saudi Gazette. Brazil approved four Instituto Butantan production partnerships in October 2025 for cancer and multiple sclerosis drugs and RSV and mRNA vaccines, the Federal Pharmacy Council reported. Japan targets biosimilar shares above 80% for at least 60% of eligible ingredients by fiscal 2029, and Alfresa agreed on Oct. 6, 2025 to co-develop biosimilars for a planned domestic plant. Licensors and local partners gain protected public demand in return.
Price negotiation, tariffs and shorter exclusivity weigh
Medicare negotiation now reaches high-spend biologics and peptides
Statutory negotiation cuts the net price of the highest-spend products in the largest market, and peptide hormones are now inside it. Medicare announced lower prices for 15 drugs on Nov. 26, 2025, effective in 2027, including a 71% cut for Ozempic, Wegovy and Rybelsus, NPR reported. The agency estimated savings of about USD 12 billion had the prices applied in 2024. Originators of blockbuster biologics with large Medicare populations are the most exposed, and they will respond by shifting patients to newer formulations before selection.
Tariffs and BIOSECURE raise sourcing and compliance costs
U.S. trade and procurement rules now make the location of manufacturing a commercial variable rather than an operational detail. A 100% tariff on branded or patented imports was announced for Oct. 1, 2025, with an exemption for companies building U.S. plants, but it was paused on Sept. 30, 2025 for most makers during pricing talks, law firm Manatt reported. The BIOSECURE Act, signed on Dec. 18, 2025, requires a federal list of biotechnology companies of concern by December 2026. Mid-size sponsors that rely on Chinese contract manufacturers and lack U.S. plants carry the greatest cost of adjustment.
Shorter EU exclusivity tightens originator payback in Europe
Regulatory protection determines how long an originator earns its launch price before biosimilars arrive, and the EU is trimming that window. Under the provisional agreement reached by the Council and Parliament on Dec. 11, 2025, new medicines receive eight years of data protection and one year of market protection, extendable by one more year for products meeting set conditions, and the deal still needs formal adoption before it applies. Originators of European biologics with modest patent cover are most exposed, while biosimilar makers gain earlier entry.
Slow biosimilar uptake and private labels squeeze challengers
Biosimilar makers face a market where substitution is slow and pharmacy benefit managers capture much of the price difference. HHS said in October 2025 that biosimilars hold below 20% market share and that only about 10% of biologics losing patent protection in the next decade have a biosimilar in development. CVS Health's Cordavis unit launched a Humira biosimilar at a list price 80% below the original in April 2023, BioSpace reported. Independent biosimilar makers without a private-label partner are most exposed to this pricing.
North America leads as China lifts Asia Pacific growth
| Region | Value, 2025 (USD billion) | Share, 2025 | CAGR, 2026–2035 |
|---|---|---|---|
| North America | 314.32 | 43.5% | 9.2% |
| Europe | 184.26 | 25.5% | 8.9% |
| Asia Pacific | 155.35 | 21.5% | 11.5% |
| Latin America | 37.57 | 5.2% | 10.3% |
| Middle East & Africa | 31.07 | 4.3% | 10.5% |
North America leads on price, launches and specialty channels
North America held 43.5% of 2025 value and grows at 9.2% a year, because the United States combines the highest prices with the earliest launches. HHS said biologics took 51% of U.S. drug spending in 2024 while accounting for about 5% of prescriptions, a gap that explains the region's weight. Lilly's plant program and the tariff exemption for companies building locally, both described above, are pulling capacity onshore. Medicare negotiation from 2027 keeps the regional growth rate below the global average.
Europe balances strong approvals with tighter price control
Europe held 25.5% of 2025 value and grows at 8.9% a year, the slowest of the five regions. The European Medicines Agency approval flow and the large number of biosimilar recommendations noted above give European payers early competition, and national health technology assessment bodies hold launch prices well below U.S. levels. The pending pharma package would shorten exclusivity further once it is formally adopted. The region still hosts major originators and biosimilar producers, including Novo Nordisk, Novartis, Roche, Sanofi, Genmab and Sandoz, which keeps manufacturing and export value high.
Asia Pacific grows fastest as China builds its own pipeline
Asia Pacific held 21.5% of 2025 value and is the fastest-growing region at 11.5% a year. China's record approval count and its domestic majority, discussed above, add new products to a market where use is growing fastest. South Korea supplies cell culture capacity to global sponsors through Samsung Biologics, and Japan's biosimilar target pushes local substitution for antibodies. Price controls through China's national reimbursement list limit value per patient, so growth comes mainly from wider access rather than high prices.
Latin America builds public production around Brazil
Latin America held 5.2% of 2025 value and grows at 10.3% a year, led by Brazil and Mexico. Brazil's public partnership model, including the Butantan projects described above, ties technology transfer to guaranteed purchases by the national health system. Public data on biologic spending by country are limited, so this share is a Credence Research estimate built from public procurement and approval records rather than a reported statistic. Currency swings and tender pricing keep value per patient low.
Middle East and Africa start from insulin, vaccines and plasma
The Middle East and Africa held 4.3% of 2025 value and grow at 10.5% a year, from the smallest base. Gulf states, led by Saudi Arabia through the Lifera insulin agreement noted earlier, are funding local fill and finish and technology transfer, while most of Africa relies on donor-funded vaccines. No regional statistic separates biologic spending, so the share is a Credence Research estimate carrying the widest uncertainty of any region.
Key approvals and deals of 2025 and 2026
| Development | Status and market relevance |
|---|---|
| In September 2025, FDA approved Merck's Keytruda Qlex for subcutaneous use across most solid tumor indications of intravenous pembrolizumab. | Approval granted Sept. 19, 2025; it extends the franchise into a faster injection format ahead of patent expiry. |
| In November 2025, FDA approved Novartis' Itvisma, a new onasemnogene abeparvovec gene therapy for spinal muscular atrophy. | Approval granted Nov. 24, 2025, with commercial availability from December 2025. |
| In December 2025, Genmab accepted for payment about 94.2% of Merus shares tendered in its USD 97 a share cash offer. | Tender offer completed Dec. 12, 2025, with a subsequent offering period that ran to Dec. 29, 2025. |
| In February 2026, Novartis completed its acquisition of Avidity Biosciences and its antibody oligonucleotide conjugate platform. | Completed acquisition announced Feb. 27, 2026, with planned launches before 2030. |
Conjugates, bispecifics and cell therapies widen options
- Antibody-drug conjugates attach a cytotoxic payload to an antibody so that tumor cells receive the drug while healthy tissue sees less of it.
- Bispecific antibodies bind two targets at once, for example a tumor antigen and a T-cell receptor, as in the myeloma therapy Lynozyfic.
- Subcutaneous co-formulations combine an antibody with a hyaluronidase enzyme so that large doses can be injected under the skin in minutes.
- Antibody oligonucleotide conjugates use an antibody to carry RNA medicines into muscle tissue, an approach now in late-stage neuromuscular trials.
- CAR-T and gene-modified cell therapies reprogram a patient's or donor's immune cells and are moving from blood cancers into autoimmune disease.
Need a Custom Version of This Report?
Tailor the scope, geography, or segments to your exact requirements.
- Custom geography or segment scope
- Direct access to our analyst team
Originators defend franchises as biosimilar makers scale
Competition in the biopharmaceutical and biomedicine market is decided by pipeline renewal, manufacturing scale and the ability to defend net price as policy pressure rises. Merck & Co., Roche, AstraZeneca and Johnson & Johnson compete mainly in oncology and immunology antibodies. Novo Nordisk and Eli Lilly compete in peptide hormones for diabetes and obesity, where self-pay prices and plant capacity now decide share. AbbVie, Amgen and Sanofi defend immunology and bone franchises against biosimilars while building next-generation products. Novartis and Genmab are buying late-stage platforms, from antibody oligonucleotide conjugates to bispecific antibodies. Sandoz and Amgen lead among biosimilar suppliers, competing on price, interchangeability and supply reliability with payers and pharmacy benefit managers.
How is supply organized between originators and challengers?
The supply side of biologic medicines is organized in three layers. About a dozen large originators control most patent-protected value through franchises in monoclonal antibodies, peptide hormones and vaccines, backed by in-house plants and global payer teams. Mid-size and emerging biotechnology companies supply much of the innovation but usually license or sell assets before launch. Biosimilar makers such as Sandoz and Amgen compete on cost and supply reliability once exclusivity ends. Entry barriers are highest in manufacturing and clinical evidence, and margins sit with originators until biosimilar or negotiated prices arrive, while contract manufacturers earn fees rather than product margins.
Companies profiled and their roles in this market
| Company | Type | Role in the market |
|---|---|---|
| F. Hoffmann-La Roche Ltd | Originator | Sells oncology, neurology and immunology antibodies through Roche and Genentech |
| Merck & Co., Inc. | Originator | Markets the pembrolizumab oncology franchise and vaccines |
| Johnson & Johnson | Originator | Sells immunology and oncology antibodies, including the ustekinumab franchise |
| AbbVie Inc. | Originator | Sells immunology antibodies and defends the adalimumab franchise against biosimilars |
| Amgen Inc. | Originator and biosimilar maker | Sells bone, oncology and inflammation biologics and the Amjevita biosimilar |
| Novo Nordisk A/S | Originator | Makes insulin and semaglutide products for diabetes and obesity |
| Eli Lilly and Company | Originator | Sells tirzepatide and insulin for diabetes and obesity |
| Sanofi | Originator | Sells immunology antibodies, insulins and vaccines |
| AstraZeneca PLC | Originator | Sells oncology and respiratory antibodies and conjugates |
| Pfizer Inc. | Originator and biosimilar maker | Sells vaccines, oncology biologics and biosimilars such as Abrilada |
| Novartis AG | Originator | Sells gene therapies, cell therapies and RNA medicines |
| Genmab A/S | Originator | Develops antibody and bispecific antibody cancer therapies |
| CSL Limited | Originator | Plasma-derived therapies and influenza vaccines |
| Sandoz Group AG | Biosimilar maker | Supplies biosimilars including the adalimumab biosimilar Hyrimoz |
Pricing policy, not science, now sets the growth ceiling
Credence Research's view is that the biopharmaceutical and biomedicine market will keep growing faster than total medicine spending, but that price policy now sets its ceiling more than science does. Antibodies and peptide hormones carry most of the value, and both face negotiated or self-pay prices in the United States from 2027. Growth therefore depends on how quickly new formats, from subcutaneous antibodies to conjugates and engineered cells, replace products losing price protection. Companies with manufacturing scale, U.S. plants and a deep late-stage pipeline are best placed, while single-product biotechs and import-reliant sponsors carry the most risk.
Earlier value rolled forward and checked against spending
The report uses 2025 as the base year and forecasts to 2035. The earlier published value for the biopharmaceutical and biomedicine market was rolled forward from 2022 at its own growth rate and then checked top down against the biologics share of U.S. drug spending reported by HHS and the global spending outlook of the IQVIA Institute. The resulting 2025 value of USD 722.57 billion covers manufacturer sales of biologic medicines and excludes tools, reagents and service fees. The scope is wider than many published estimates because it includes peptide hormones, vaccines and plasma-derived products. Regional and segment shares are Credence Research estimates built from approval records, pricing disclosures and company releases. Sources used are regulator documents, government releases, company filings and press releases, and named trade press. No interviews or surveys were conducted for this edition of the report.
Launch flow and price rules decide the path to 2035
Through 2035 value growth should come from new formats and therapeutic areas rather than from price increases on existing products. Cancer antibodies remain the largest pool, while neurology and autoimmune cell therapies add the fastest new spending if safety data hold. Negotiated Medicare prices from 2027 and wider self-pay channels will lower net prices for peptide hormones, even as patient numbers grow. China should keep adding approved biologics and licensed assets, lifting Asia Pacific. Companies that combine U.S. manufacturing, biosimilar defense and late-stage pipelines should gain share.
What would move growth above or below the base case?
The range of outcomes depends mainly on how far price policy spreads and on whether new modalities scale. If Medicare negotiation, self-pay discounts and European exclusivity cuts all bite harder than expected, value growth slows even as patient numbers rise. If cell therapies win autoimmune approvals and Chinese assets move quickly into Western markets, growth runs above the base case. Antibody demand in cancer supports value in all three cases.
| Scenario | CAGR, 2026–2035 | Value, 2035 | What has to hold |
|---|---|---|---|
| Downside | 7.8% | USD 1,559.73 billion | Negotiated and self-pay prices spread across more biologics and EU exclusivity cuts apply early |
| Base | 9.80% | USD 1,840.36 billion | Approval flow stays near 2025 levels and price cuts are offset by new launches |
| Upside | 11.0% | USD 2,029.50 billion | Autoimmune cell therapies are approved and licensed Chinese antibodies launch in the West |
Frequently Asked Questions
How big is the biopharmaceuticals market?
What does the biopharmaceutical and biomedicine market include?
Which product type holds the largest share?
Which product type is growing fastest?
How large is the U.S. biopharmaceuticals market within the total?
What is the biopharma market forecast to 2035?
Which companies lead the market?
How do price policies affect biologic medicines?
Table of Content
Chapter 1 Market Segmentation
- 1.1 Segmentation Framework
- 1.1.1 Product and Service Classification
- 1.1.2 Application and End-Use Classification
- 1.1.3 Technology and Solution Classification
- 1.1.4 Customer and Distribution Channel Classification
- 1.1.5 Geographic Segmentation
- 1.1.6 Market Segment Definitions and Boundaries
- 1.2 By Product Type
- 1.2.1 Monoclonal Antibodies
- 1.2.2 Recombinant Proteins and Peptide Hormones
- 1.2.3 Vaccines
- 1.2.4 Biosimilars
- 1.2.5 Cell and Gene Therapies
- 1.2.6 Nucleic Acid Therapeutics
- 1.2.7 Blood and Plasma Products
- 1.3 By Therapeutic Area
- 1.3.1 Oncology
- 1.3.2 Autoimmune and Inflammatory Diseases
- 1.3.3 Metabolic and Cardiovascular Diseases
- 1.3.4 Infectious Diseases
- 1.3.5 Neurological Disorders
- 1.3.6 Rare Diseases
- 1.3.7 Hematology
- 1.3.8 Others
- 1.4 By Developer
- 1.4.1 Large Pharmaceutical Companies
- 1.4.2 Mid-Size and Emerging Biotechnology Companies
- 1.4.3 Biosimilar Manufacturers
Chapter 2 Introduction
- 2.1 Report Objectives and Scope
- 2.2 Product Definition and Industry Terminology
- 2.3 Market Inclusions and Exclusions
- 2.4 Research Process
- 2.4.1 Primary Research and Expert Interviews
- 2.4.2 Secondary Research and Source Review
- 2.4.3 Top-Down and Bottom-Up Estimation
- 2.4.4 Data Triangulation and Verification
- 2.5 Market Size Measurement Basis
- 2.5.1 2025: USD 722.57 billion → 2035: USD 1,840.36 billion
- 2.6 Historical and Forecast Reference Periods
- 2.6.1 Historical Period: 2018-2025
- 2.6.2 Base Year: 2025
- 2.6.3 Forecast Period: 2025-2035
- 2.7 Research Assumptions and Limitations
Chapter 3 Executive Summary
- 3.1 Market Snapshot and Key Findings
- 3.2 Base-Year Market Size, 2025
- 3.3 Forecast Market Size, 2035
- 3.4 Revenue and Volume Growth Outlook
- 3.5 Key Demand and Supply Indicators
- 3.6 Leading Market Segments
- 3.7 Fastest-Growing Market Opportunities
- 3.8 Regional Performance Highlights
- 3.9 Technology and Industry Transformation
- 3.10 Competitive Landscape Summary
- 3.11 Analyst View and Strategic Implications
Chapter 4 Global Biopharmaceutical and Biomedicine Market Trends and Developments
- 4.1 Historical Industry Development, 2018-2025
- 4.2 Recent Market Trends and Developments
- 4.3 Demand and Customer Behavior Trends
- 4.4 Technology and Product Innovation
- 4.5 Artificial Intelligence, Automation and Digitalization
- 4.6 Local Manufacturing and Supply Chain Realignment
- 4.7 Industry Partnerships, Mergers and Acquisitions
- 4.8 Sustainability and Circular Economy Developments
- 4.9 Government and Private Sector Investment Trends
- 4.10 Emerging Business Models and Commercialization
- 4.11 Industry Developments and Announcements
Chapter 5 Global Biopharmaceutical and Biomedicine Market Production, Supply and Demand Analysis
- 5.1 Demand Trend and Consumption Analysis, 2018-2025
- 5.2 Demand Forecast, 2025-2035
- 5.3 Production and Output Trend, 2018-2025
- 5.4 Production and Output Forecast, 2025-2035
- 5.5 Installed Capacity and Capacity Utilization
- 5.6 Company-Wise Production Plants and Statistics
- 5.6.1 Installed Production Capacity
- 5.6.2 Actual Production
- 5.6.3 Planned Capacity and Expansion Targets
- 5.7 Supply Chain Structure and Procurement Trends
- 5.8 Supply-Demand Gap and Bottlenecks
- 5.9 Import Dependence and Sourcing Structure
- 5.10 Contract Manufacturing and Outsourcing
- 5.11 Regional Supply and Demand Concentration
Chapter 6 Global Biopharmaceutical and Biomedicine Market Pricing Analysis
- 6.1 Pricing Structure and Measurement
- 6.2 Historical Pricing Trends, 2018-2025
- 6.3 Pricing Outlook, 2025-2035
- 6.4 Average Selling Price and Unit Economics
- 6.5 Pricing by Product and Market Segment
- 6.6 Geographic Pricing Differences
- 6.7 Key Input, Energy, Labor and Logistics Costs
- 6.8 Contract Pricing and Purchasing Models
- 6.9 Pricing Sensitivity and Competitive Positioning
- 6.10 Price, Margin and Profitability Implications
Chapter 7 Global Biopharmaceutical and Biomedicine Market Dynamics
- 7.1 Market Growth Drivers
- 7.1.1 Demand-Side Drivers
- 7.1.2 Technology and Innovation Drivers
- 7.1.3 Infrastructure and Investment Drivers
- 7.1.4 Regulatory and Policy Drivers
- 7.2 Market Restraints
- 7.2.1 Cost and Affordability Constraints
- 7.2.2 Technology and Adoption Barriers
- 7.2.3 Supply Chain and Operational Constraints
- 7.3 Market Challenges
- 7.3.1 Competitive Pressure and Margin Erosion
- 7.3.2 Skills, Infrastructure and Implementation Gaps
- 7.4 Emerging Market Opportunities
- 7.5 Market Dynamics Impact and Time-Horizon Assessment
Chapter 8 Global Biopharmaceutical and Biomedicine Value Chain Analysis
- 8.1 Industry Value Chain Overview
- 8.2 Upstream Suppliers and Critical Inputs
- 8.3 Technology and Component Providers
- 8.4 Manufacturing or Service Delivery
- 8.5 Distribution, Channel Partners and Integrators
- 8.6 Downstream Applications and End Users
- 8.7 Value Addition and Profit Pools
- 8.8 Vertical Integration and Outsourcing
- 8.9 Supplier Concentration and Risk
- 8.10 Supply Chain Localization and Resilience
Chapter 9 Global Biopharmaceutical and Biomedicine Market Regulations and Policies
- 9.1 Relevant Laws, Standards and Compliance Frameworks
- 9.2 Product, Service, Safety and Quality Requirements
- 9.3 Government Policies, Incentives and Subsidies
- 9.4 Imports, Exports and Trade Barriers
- 9.5 Public Procurement and Local Content Requirements
- 9.6 Environmental and Sustainability Compliance
- 9.7 Upcoming Policy Changes and Market Implications
Chapter 10 Global Biopharmaceutical and Biomedicine Market Hotspots and Opportunities
- 10.1 Market Opportunity Mapping and Growth Hotspots
- 10.2 High-Growth Applications and Customer Groups
- 10.3 Underserved Markets and White-Space Opportunities
- 10.4 Emerging Technology and Product Opportunities
- 10.5 New Capacity and Investment Hotspots
- 10.6 Market Entry and Expansion Opportunities
- 10.7 Distribution and Partnership Opportunities
- 10.8 Near-Term and Long-Term Commercial Potential
- 10.9 Opportunity Attractiveness and Execution Risks
Chapter 11 Global Biopharmaceutical and Biomedicine Market Outlook, 2025-2035
- 11.1 Market Size and Analysis
- 11.1.1 Revenue (Market Measurement: 2025: USD 722.57 billion → 2035: USD 1,840.36 billion)
- 11.1.2 Market Volume and Quantity Sold
- 11.1.3 Historical Market Size, 2018-2025
- 11.1.4 Base-Year Market Size, 2025
- 11.2 Market Forecast, 2025-2035
- 11.2.1 Revenue Forecast to 2035
- 11.2.2 Volume Forecast to 2035
- 11.2.3 CAGR and Year-on-Year Growth
- 11.2.4 Incremental Revenue Opportunity
- 11.3 Forecast Assumptions and Scenario Analysis
- 11.3.1 Base-Case Forecast
- 11.3.2 Optimistic and Conservative Scenarios
- 11.3.3 Technology, Pricing and Policy Sensitivities
- 11.4 Market Attractiveness and Growth Outlook
Chapter 12 Global Biopharmaceutical and Biomedicine Market Segmentation and Outlook
- 12.1 Segmentation Summary and Market Shares, 2025
- 12.2 Largest and Fastest-Growing Segments
- 12.3 By Product Type - Market Size and Forecast, 2025-2035
- 12.3.1 Segment Definition and Scope
- 12.3.2 Historical Market Size, 2018-2025
- 12.3.3 Revenue Forecast, 2025-2035
- 12.3.4 Volume Forecast, 2025-2035
- 12.3.5 Base-Year Market Share, 2025
- 12.3.6 Segment CAGR and Growth Drivers
- 12.3.7 Subsegment Market Size and Forecast
- 12.3.7.1 Monoclonal Antibodies
- 12.3.7.2 Recombinant Proteins and Peptide Hormones
- 12.3.7.3 Vaccines
- 12.3.7.4 Biosimilars
- 12.3.7.5 Cell and Gene Therapies
- 12.3.7.6 Nucleic Acid Therapeutics
- 12.3.7.7 Blood and Plasma Products
- 12.3.8 Subsegment Pricing and Adoption Trends
- 12.3.9 Leading Suppliers and Competition
- 12.3.10 Regional Demand and Opportunities
- 12.4 By Therapeutic Area - Market Size and Forecast, 2025-2035
- 12.4.1 Segment Definition and Scope
- 12.4.2 Historical Market Size, 2018-2025
- 12.4.3 Revenue Forecast, 2025-2035
- 12.4.4 Volume Forecast, 2025-2035
- 12.4.5 Base-Year Market Share, 2025
- 12.4.6 Segment CAGR and Growth Drivers
- 12.4.7 Subsegment Market Size and Forecast
- 12.4.7.1 Oncology
- 12.4.7.2 Autoimmune and Inflammatory Diseases
- 12.4.7.3 Metabolic and Cardiovascular Diseases
- 12.4.7.4 Infectious Diseases
- 12.4.7.5 Neurological Disorders
- 12.4.7.6 Rare Diseases
- 12.4.7.7 Hematology
- 12.4.7.8 Others
- 12.4.8 Subsegment Pricing and Adoption Trends
- 12.4.9 Leading Suppliers and Competition
- 12.4.10 Regional Demand and Opportunities
- 12.5 By Developer - Market Size and Forecast, 2025-2035
- 12.5.1 Segment Definition and Scope
- 12.5.2 Historical Market Size, 2018-2025
- 12.5.3 Revenue Forecast, 2025-2035
- 12.5.4 Volume Forecast, 2025-2035
- 12.5.5 Base-Year Market Share, 2025
- 12.5.6 Segment CAGR and Growth Drivers
- 12.5.7 Subsegment Market Size and Forecast
- 12.5.7.1 Large Pharmaceutical Companies
- 12.5.7.2 Mid-Size and Emerging Biotechnology Companies
- 12.5.7.3 Biosimilar Manufacturers
- 12.5.8 Subsegment Pricing and Adoption Trends
- 12.5.9 Leading Suppliers and Competition
- 12.5.10 Regional Demand and Opportunities
- 12.6 Segment Growth Comparison
- 12.7 Segment Attractiveness and Priority Matrix
Chapter 13 Global Biopharmaceutical and Biomedicine Geographic Market Outlook, 2025-2035
- 13.1 Regional Market Size and Share, 2025
- 13.2 Regional Market Forecast, 2025-2035
- 13.3 Regional Pricing, Production and Demand Differences
- 13.4 North America
- 13.4.1 United States
- 13.4.2 Canada
- 13.4.3 Mexico
- 13.5 Europe
- 13.5.1 Germany
- 13.5.2 France
- 13.5.3 Italy
- 13.5.4 United Kingdom
- 13.5.5 Spain
- 13.5.6 Poland
- 13.5.7 Russia
- 13.5.8 Netherlands
- 13.5.9 Belgium
- 13.5.10 Sweden
- 13.5.11 Denmark
- 13.5.12 Norway
- 13.5.13 Rest of Europe
- 13.6 Asia Pacific
- 13.6.1 China
- 13.6.2 India
- 13.6.3 Japan
- 13.6.4 South Korea
- 13.6.5 Thailand
- 13.6.6 Indonesia
- 13.6.7 Vietnam
- 13.6.8 Malaysia
- 13.6.9 Australia
- 13.6.10 Rest of Asia Pacific
- 13.7 Latin America
- 13.7.1 Brazil
- 13.7.2 Argentina
- 13.7.3 Colombia
- 13.7.4 Chile
- 13.7.5 Rest of Latin America
- 13.8 Middle East
- 13.8.1 Saudi Arabia
- 13.8.2 United Arab Emirates
- 13.8.3 Turkey
- 13.8.4 Israel
- 13.8.5 Iran
- 13.8.6 Rest of the Middle East
- 13.9 Africa
- 13.9.1 South Africa
- 13.9.2 Egypt
- 13.9.3 Nigeria
- 13.9.4 Morocco
- 13.9.5 Rest of Africa
- 13.10 Regional Investment, Policy and Supply Chain Differences
- 13.11 Regional Competitive Landscape
- 13.12 Geographic Growth Hotspots
Chapter 14 Global Biopharmaceutical and Biomedicine Technology, Innovation and Sustainability Outlook
- 14.1 Technology Landscape and Maturity
- 14.2 Product, Process and Service Innovation
- 14.3 AI, Automation and Digital Tools in the Industry
- 14.4 Technology Adoption and Performance Benchmarking
- 14.5 Innovation Pipeline and R&D Investment
- 14.6 Patent and Intellectual Property Trends
- 14.7 Energy Efficiency and Resource Management
- 14.8 Sustainability, Recycling and Circularity
- 14.9 Technology Roadmap, 2025-2035
- 14.10 Risks of Obsolescence and Technology Substitution
Chapter 15 Global Biopharmaceutical and Biomedicine Market Key Strategic Imperatives
- 15.1 Growth and Market Entry Priorities
- 15.2 High-Return Products and Segments
- 15.3 Pricing, Profitability and Cost Optimization
- 15.4 Technology Investment and Product Differentiation
- 15.5 Supply Chain Localization and Resilience
- 15.6 Distribution and Customer Acquisition
- 15.7 Partnership, Acquisition and Capacity Strategy
- 15.8 Regional Expansion Priorities
- 15.9 Short-, Medium- and Long-Term Actions
Chapter 16 Competition Outlook
- 16.1 Industry Competition Characteristics
- 16.2 Market Structure and Concentration
- 16.3 Market Share and Competitive Positioning, 2025
- 16.4 Company-Wise Revenue and Product Benchmarking
- 16.5 Production and Service Capacity Benchmarking
- 16.6 Technology, Pricing and Differentiation
- 16.7 Regional Footprint and Distribution Strength
- 16.8 Mergers, Acquisitions and Strategic Alliances
- 16.9 New Entrants and Competitive Threats
- 16.10 Porter's Five Forces and Industry Attractiveness
- 16.11 Competitive Outlook, 2025-2035
Chapter 17 Company Profiles
- 17.1 Company Coverage and Selection Criteria
- 17.2 F. Hoffmann-La Roche Ltd
- 17.2.1 Business Description
- 17.2.2 Company Ownership and Geographic Presence
- 17.2.3 Product and Service Portfolio
- 17.2.4 Manufacturing and Operating Footprint
- 17.2.5 Production Capacity and Expansion Plans
- 17.2.6 Financial Performance and Investment
- 17.2.7 Market Share and Competitive Position
- 17.2.8 Technology and Innovation Capabilities
- 17.2.9 Strategic Alliances or Partnerships
- 17.2.10 Recent Developments
- 17.2.11 Growth Strategy and Outlook
- 17.3 Merck & Co., Inc.
- 17.4 Johnson & Johnson
- 17.5 AbbVie Inc.
- 17.6 Amgen Inc.
- 17.7 Novo Nordisk A/S
- 17.8 Eli Lilly and Company
- 17.9 Sanofi
- 17.10 AstraZeneca PLC
- 17.11 Pfizer Inc.
- 17.12 Novartis AG
- 17.13 Genmab A/S
- 17.14 CSL Limited
- 17.15 Sandoz Group AG
- 17.16 Other Relevant Market Participants
Note: Every listed company is profiled on the structure shown under the first company. The company list is preliminary and may change based on research findings, market developments, data availability and client requirements.
Chapter 18 Disclaimer
- 18.1 Research and Forecast Disclaimer
- 18.2 Data Source and Estimation Limitations
Note: The depth of individual sections depends on data availability for this market. Volume, capacity, trade and other unit-based metrics are included where applicable.