
CAR-T, gene editing and one-time cures reshape care
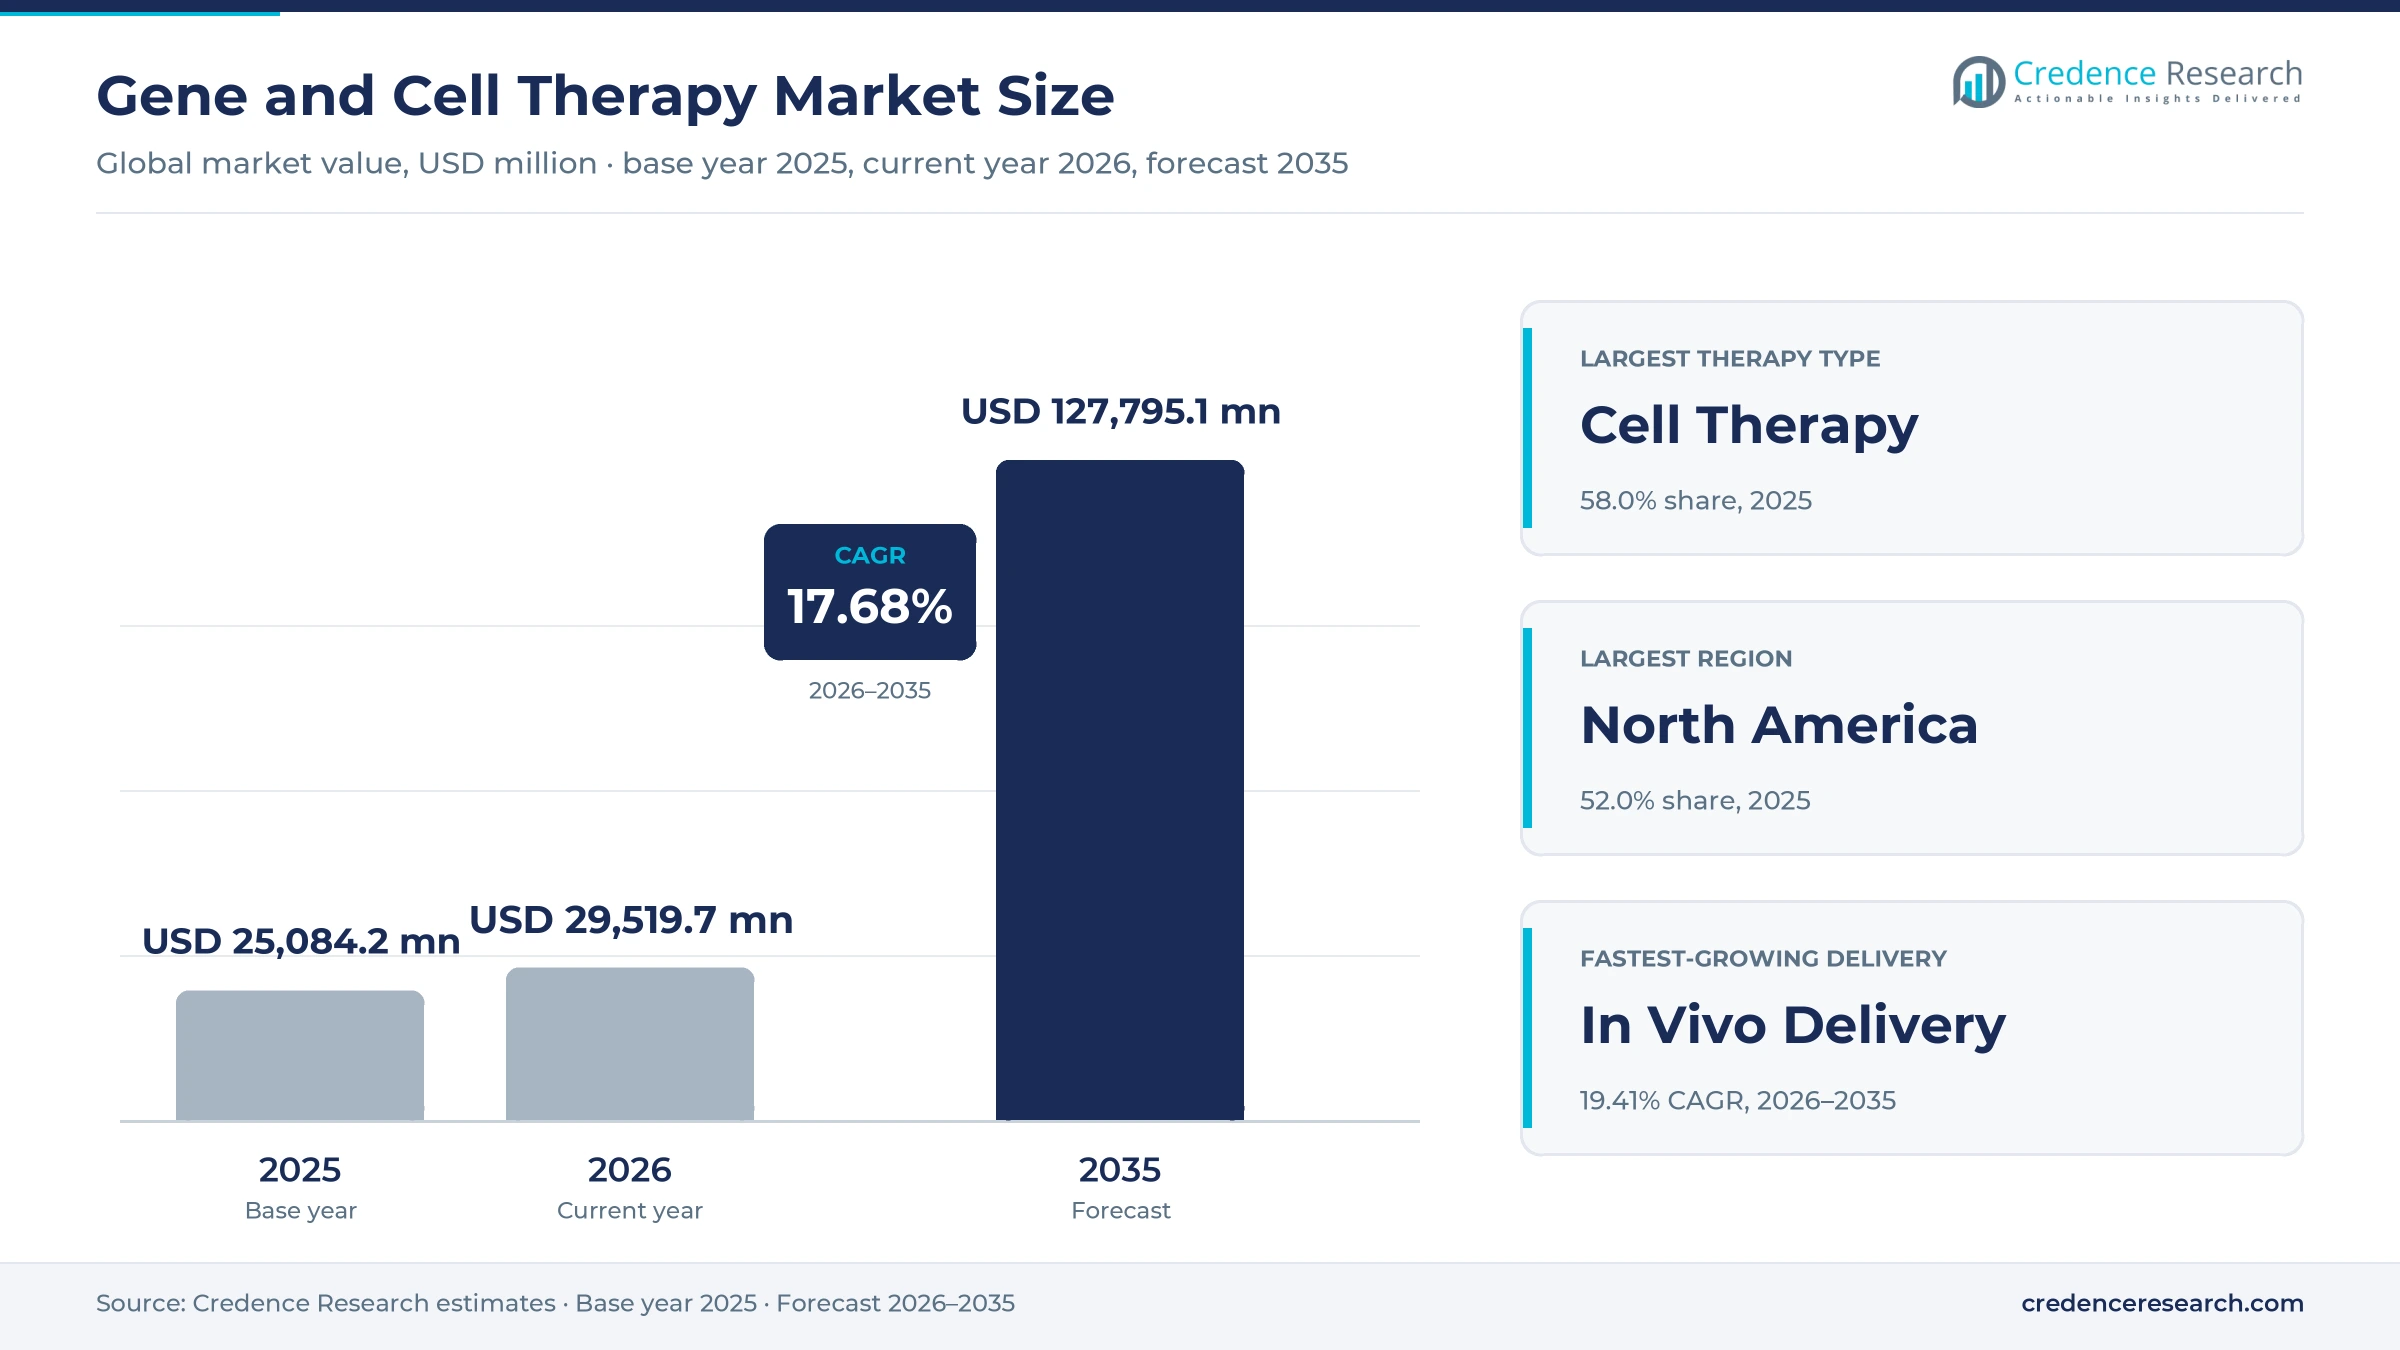
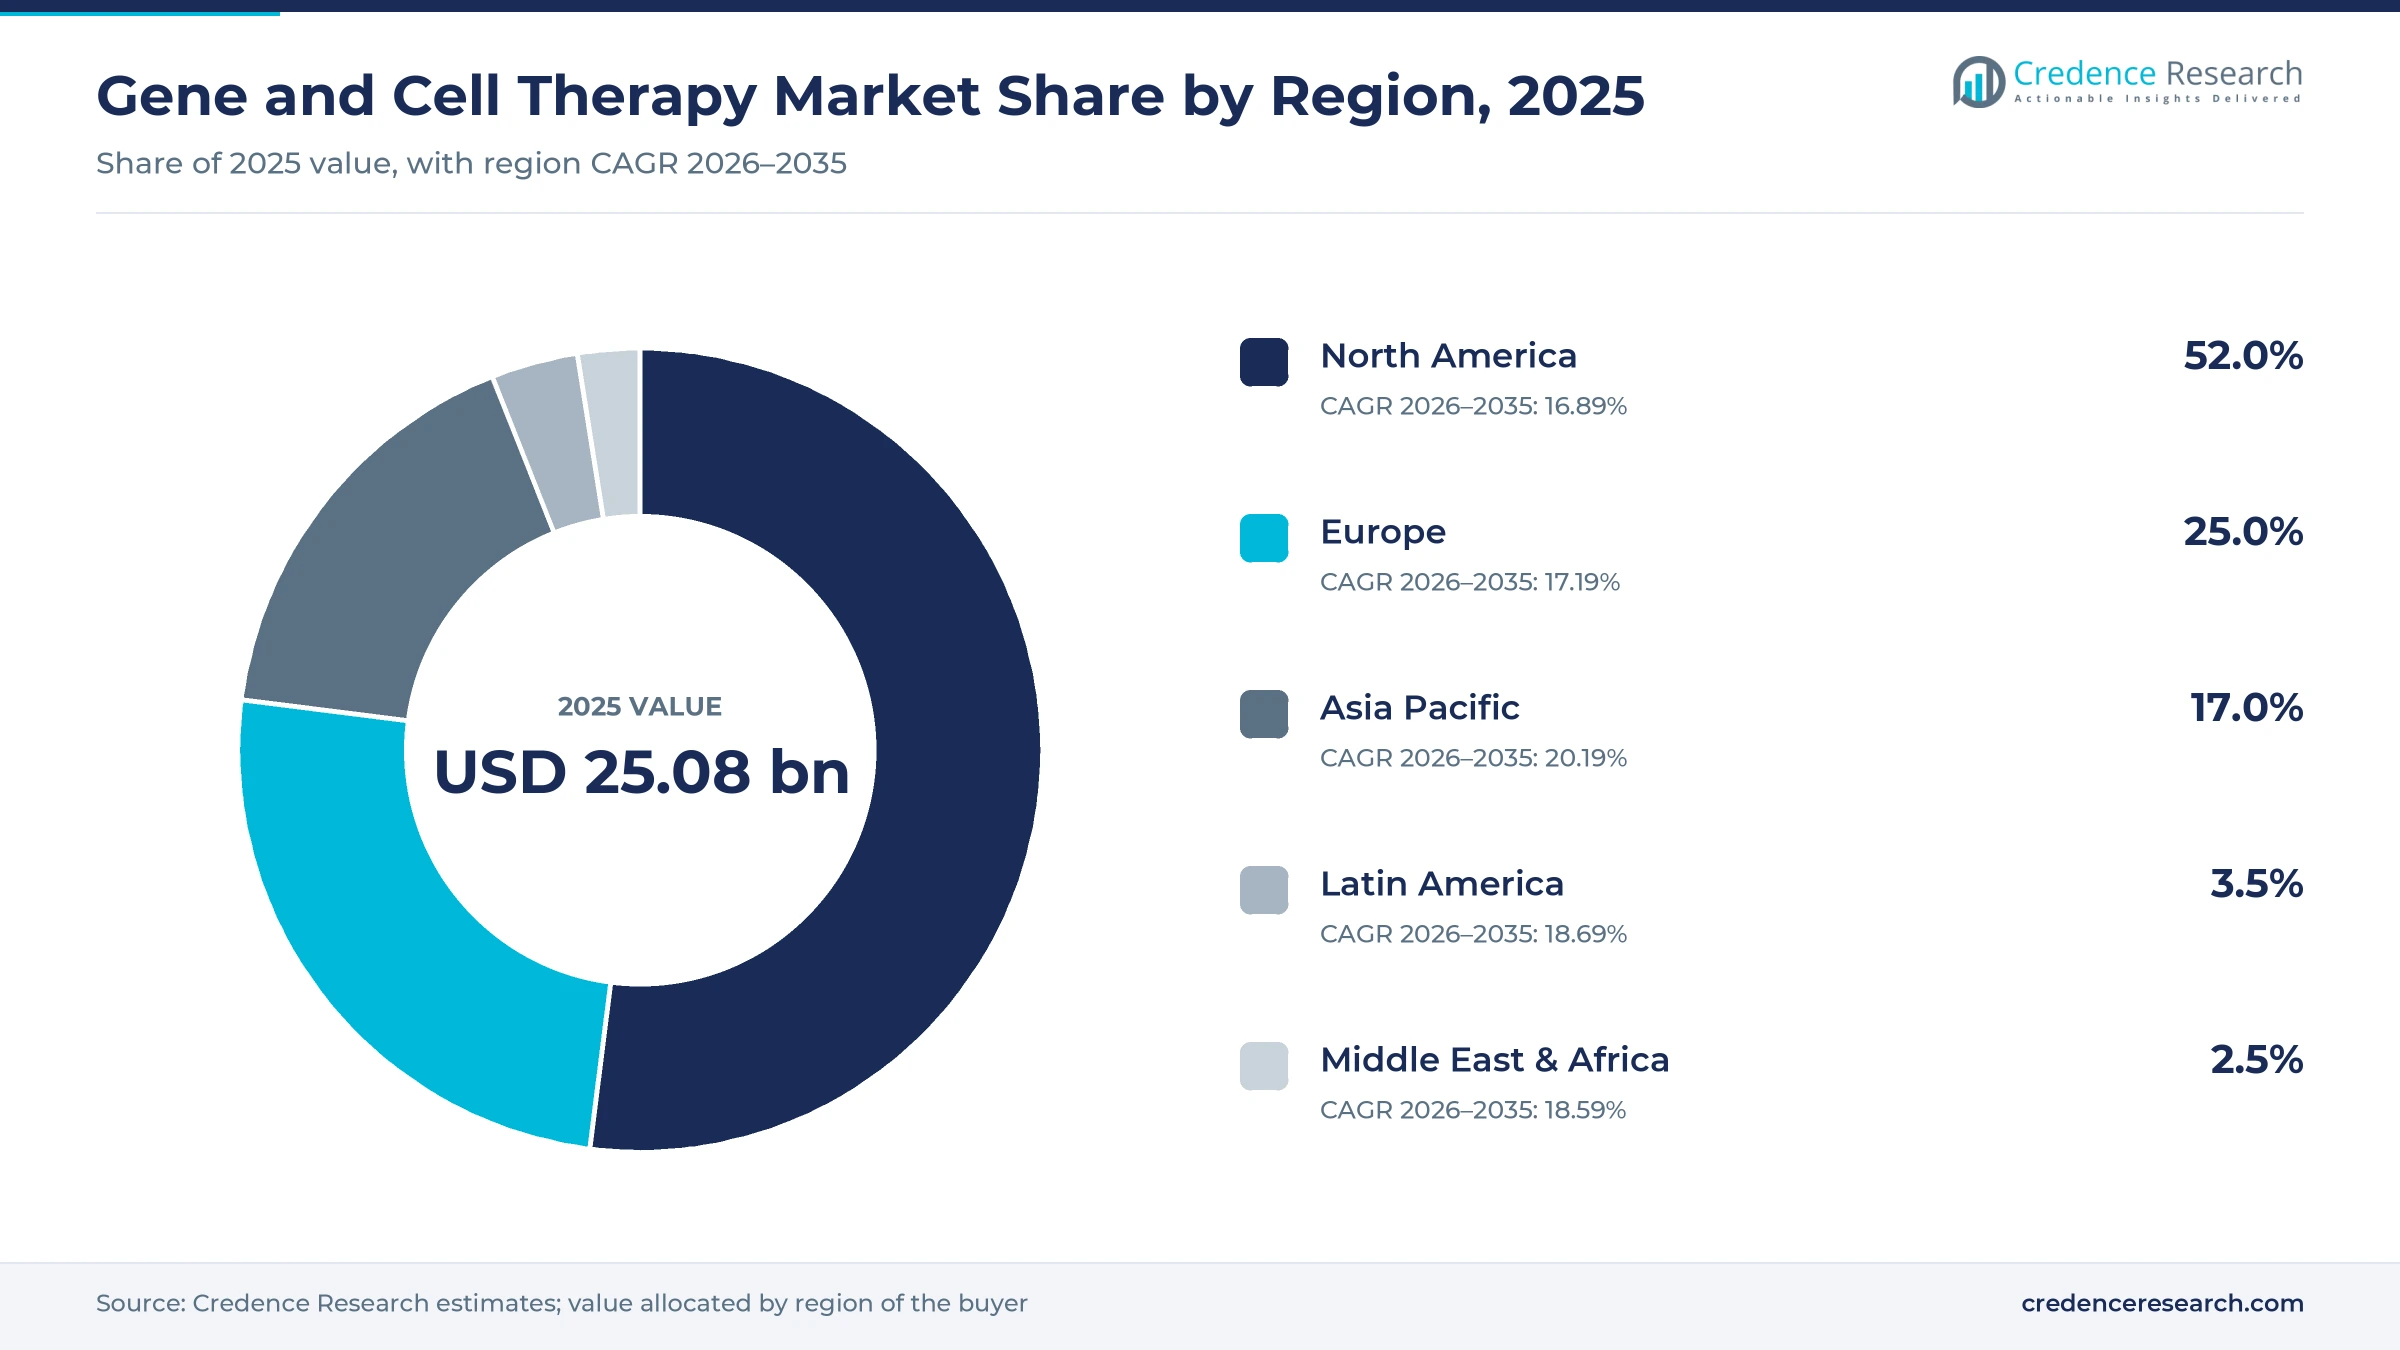
The global gene and cell therapy market was valued at USD 25.08 billion in 2025 and is projected to increase from USD 29.52 billion in 2026 to USD 127.80 billion by 2035, registering a CAGR of 17.68% during 2026–2035. Demand comes from blood cancers treated with CAR-T products, inherited blood disorders such as sickle cell disease and beta thalassemia, and rare neuromuscular, eye and skin conditions, treated at specialized hospitals and transplant centers. North America held the largest regional share, 52.0% in 2025, on early FDA approvals, many qualified treatment centers and payer coverage for one-time treatments. Asia Pacific is the fastest-growing region at 20.19% a year, as China, Japan and South Korea expand clinical programs and local manufacturing. The main change came in June 2025, when the FDA removed the risk program for approved autologous CAR-T products.
Which engineered products count toward market value?
The market counts manufacturer revenue from approved products that modify, replace or add genes, or that use living cells as the treatment. It covers CAR-T and engineered T cell receptor products, gene-edited blood stem cells, and gene transfer using viral vectors given into a vein, the spine, the eye or onto the skin. Buyers include hospitals, transplant centers, research institutes running early-access programs, and public and private payers.
The scope excludes contract manufacturing services, research reagents, vector production for third parties and unmodified stem cell transplants. The value chain runs from vector and cell processing through product release, cold-chain shipping and administration at certified centers.
Gene and Cell Therapy Market Insights
- The gene and cell therapy market grows from USD 25.08 billion in 2025 to USD 127.80 billion by 2035, a 17.68% CAGR over 2026–2035, as CAR-T use widens and gene editing reaches more patients.
- North America held 52.0% of global gene and cell therapy value in 2025, backed by early FDA approvals and many certified treatment centers.
- Cell therapy led therapy types with 58.0% of 2025 value, because CAR-T products for lymphoma, leukemia and myeloma are the largest product group.
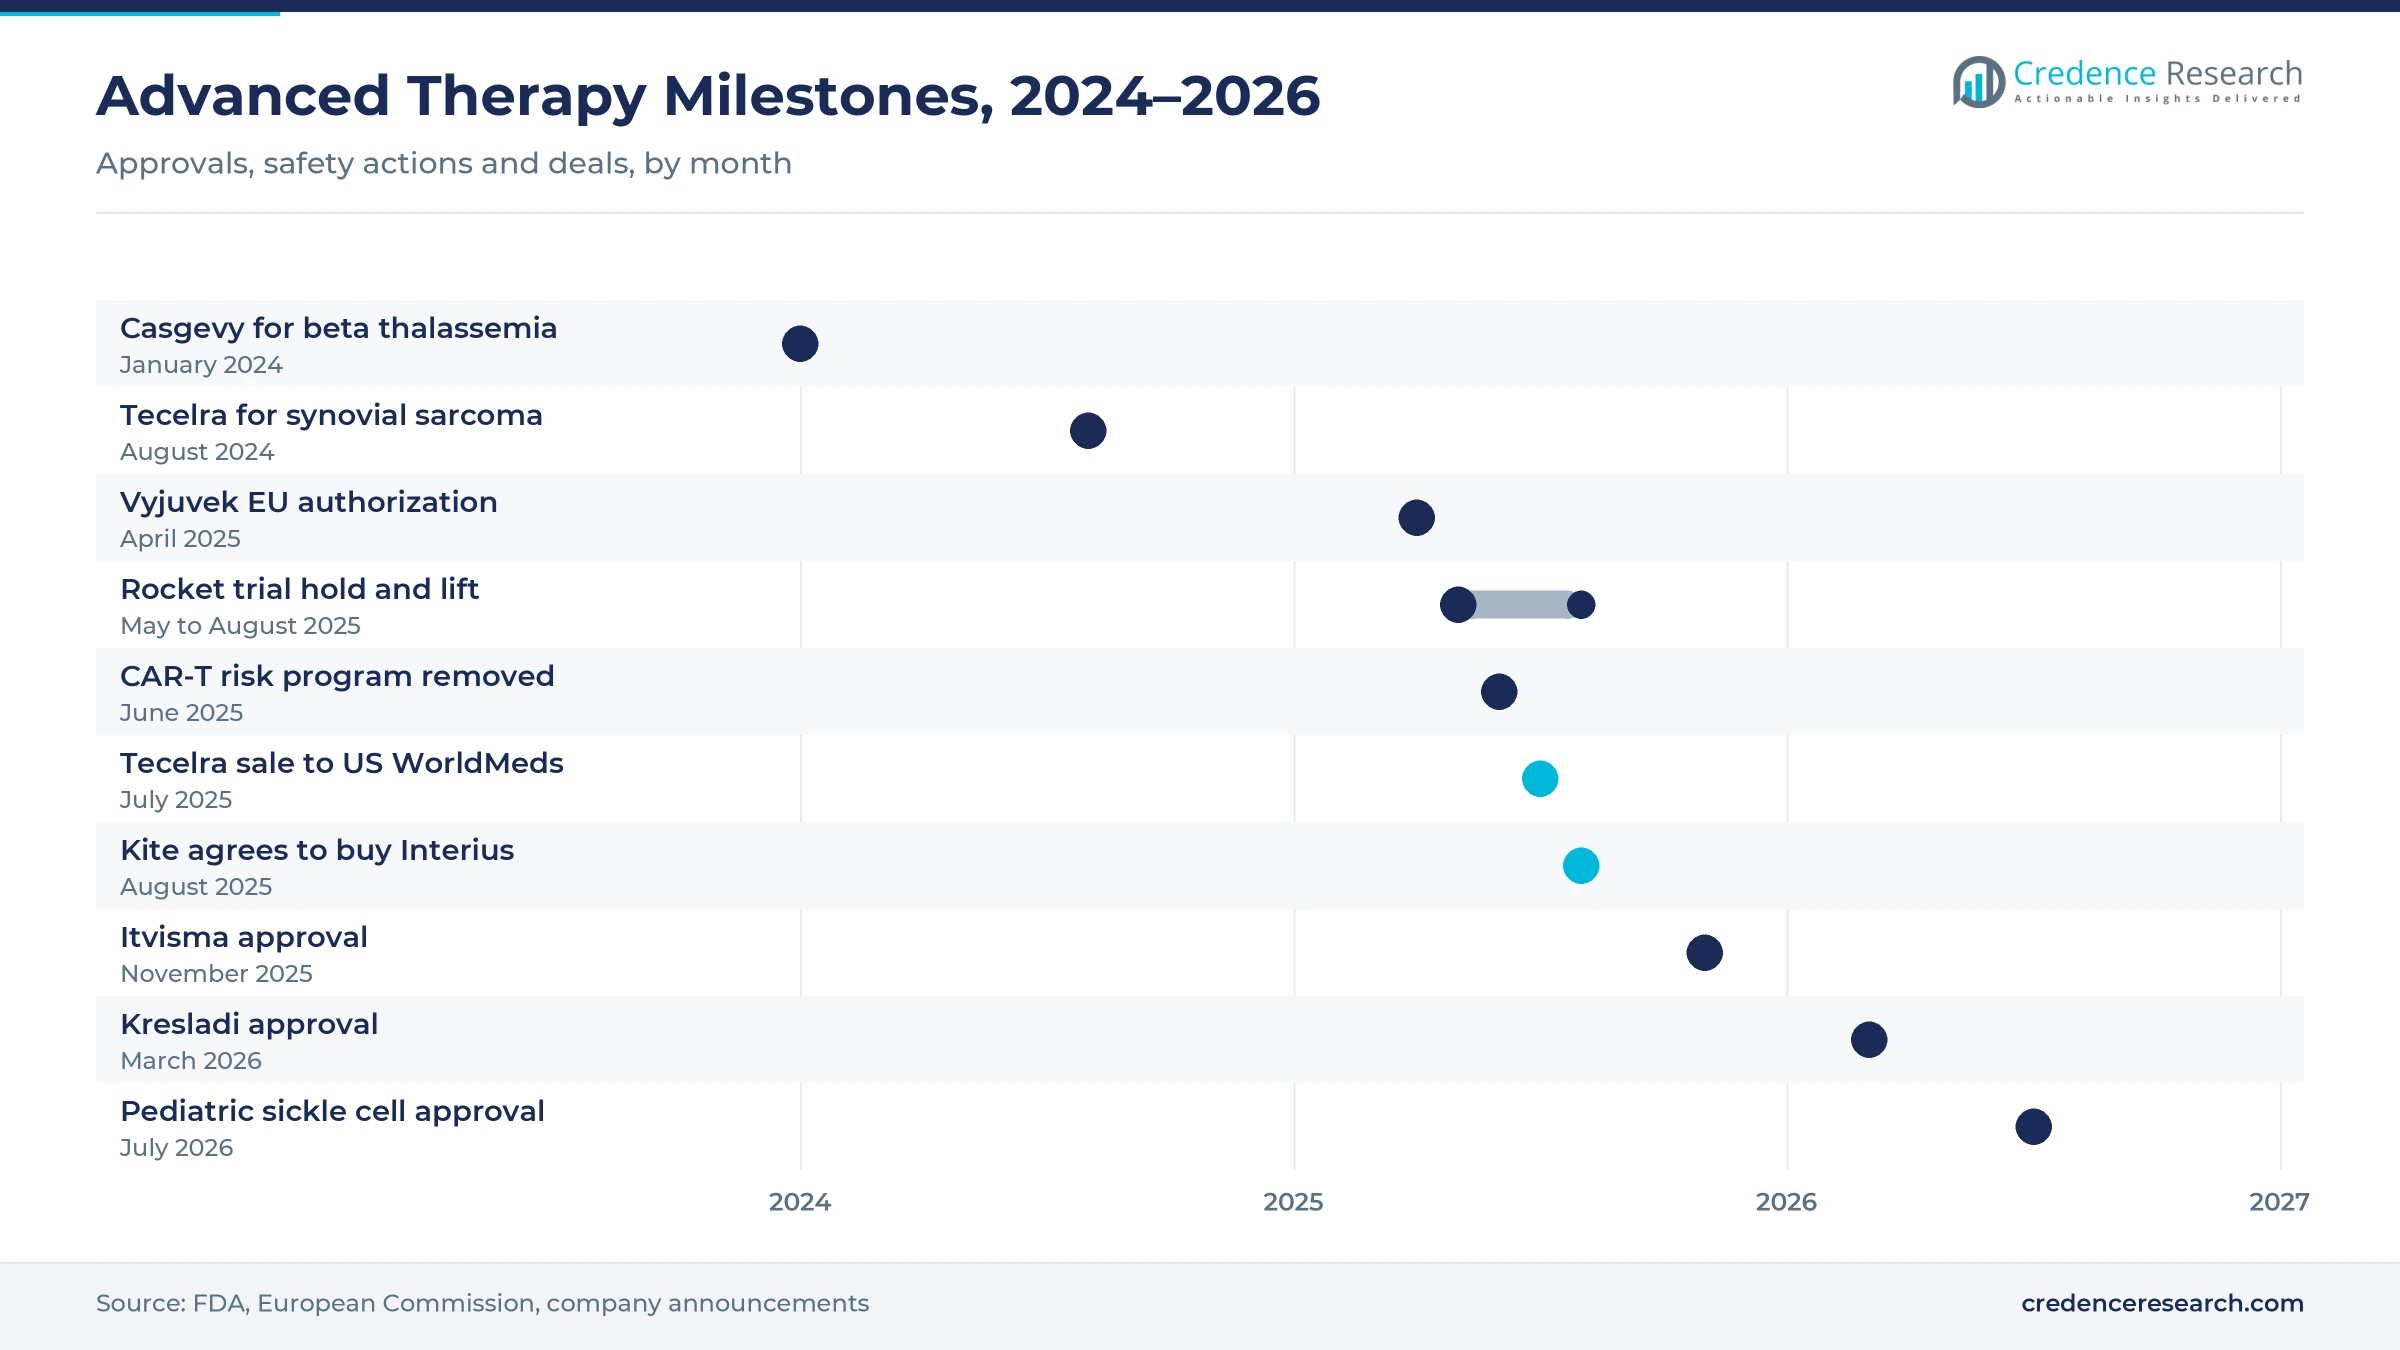
- The FDA approved Casgevy for transfusion-dependent beta thalassemia in January 2024 and Tecelra, the first engineered TCR product for a solid tumor, in August 2024.
- Kite agreed to acquire Interius BioTherapeutics in August 2025, showing how large companies buy into in vivo CAR-T engineering.
Cell products and oncology lead the advanced therapy mix
Why do cell products hold the larger share?
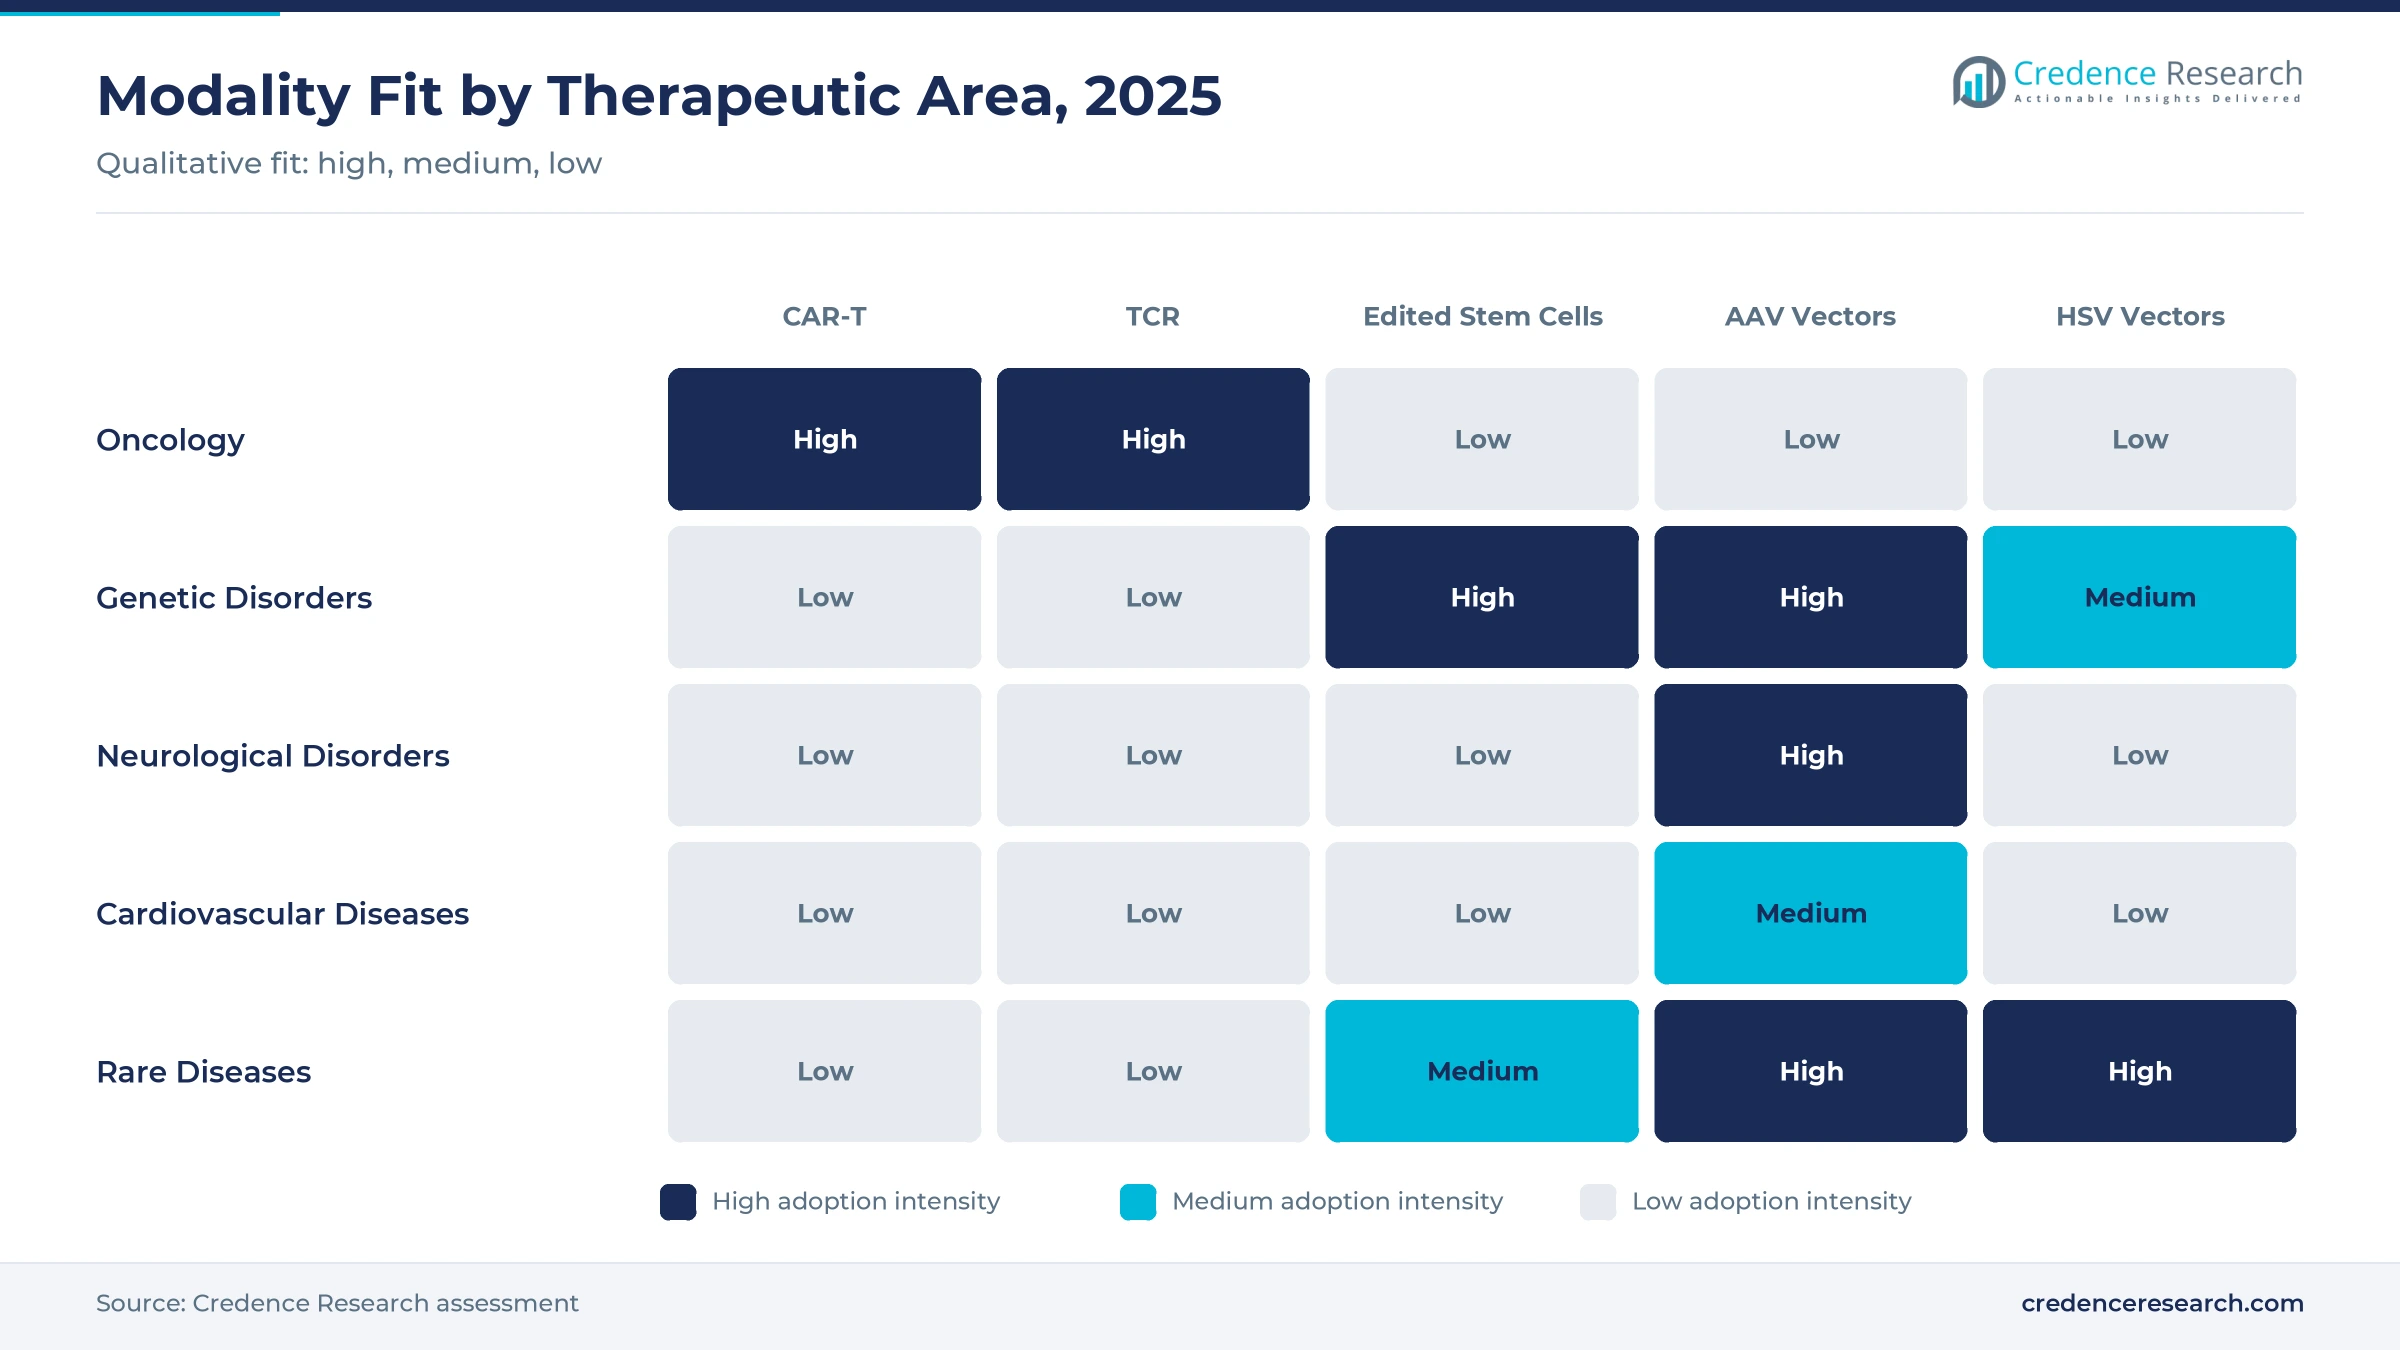
Based on therapy type, the market is categorized into cell therapy and gene therapy. Cell Therapy led with a 58.0% share of 2025 value, because approved CAR-T products such as Yescarta, Kymriah, Breyanzi and Abecma treat thousands of blood cancer patients each year. Gene Therapy grows fastest at 18.81% a year, as gene-edited and vector-based products reach patients with inherited disorders.
Why does oncology lead while inherited disease grows faster?
Based on therapeutic area, the market is categorized into oncology, genetic disorders, neurological disorders, cardiovascular diseases and rare diseases. Oncology led with a 51.0% share of 2025 value, because CAR-T products dominate approved use. Genetic Disorders grow fastest at 19.06% a year, as one-time treatments for sickle cell disease and beta thalassemia scale up at treatment centers.
How do ex vivo and in vivo methods divide value?
Based on delivery method, the market is categorized into in vivo delivery and ex vivo delivery. Ex Vivo Delivery led with a 66.0% share of 2025 value, because CAR-T and edited stem cell products are made from cells collected and modified outside the body. In Vivo Delivery grows fastest at 19.41% a year, as vectors given by infusion, spinal injection or topical gel avoid complex cell manufacturing.
Why do hospitals account for most use?
Based on end user, the market is categorized into hospitals and research institutes. Hospitals led with 84.0% of 2025 value, because cell collection, conditioning chemotherapy, infusion and monitoring for side effects take place at certified hospital centers. Hospitals also grow faster at 17.77% a year, as more community cancer centers qualify to give CAR-T products.
| Segment Group | Leading Sub-segment | Share, 2025 | Fastest-growing Sub-segment | CAGR, 2026–2035 |
|---|---|---|---|---|
| By Therapy Type | Cell Therapy | 58.0% | Gene Therapy | 18.81% |
| By Therapeutic Area | Oncology | 51.0% | Genetic Disorders | 19.06% |
| By Delivery Method | Ex Vivo Delivery | 66.0% | In Vivo Delivery | 19.41% |
| By End User | Hospitals | 84.0% | Hospitals | 17.77% |
Request a Free Sample
Fill in your details and we'll send you a free sample report.
- Sample data tables & charts
- Research methodology
New approvals, eased CAR-T rules and blood cancer demand
How do new approvals widen the patient base?
Regulators have approved advanced therapies for diseases that previously had only supportive care, which brings new patient groups into treatment. On Jan. 16, 2024, Vertex announced FDA approval of Casgevy for transfusion-dependent beta thalassemia in patients 12 and older, following its earlier sickle cell approval. In November 2025, the FDA approved Novartis's Itvisma, an intrathecal form of its gene replacement for spinal muscular atrophy in patients 2 and older. Each approval adds a premium product with a defined patient pool, and both labels cover patients who had few or no options before 2024.
Why does removing the CAR-T risk program raise access?
Regulatory relief is making CAR-T products easier to deliver outside large academic centers. On June 26, 2025, the FDA eliminated the risk evaluation and mitigation strategies for approved BCMA- and CD19-directed autologous CAR-T products, including Abecma, Breyanzi, Carvykti, Kymriah, Tecartus and Yescarta. Labels now advise patients to stay near a health care facility and avoid driving for two weeks. As a result, more hospitals can qualify, which shortens waiting lists and lifts treated volumes.
How does blood cancer burden support CAR-T demand?
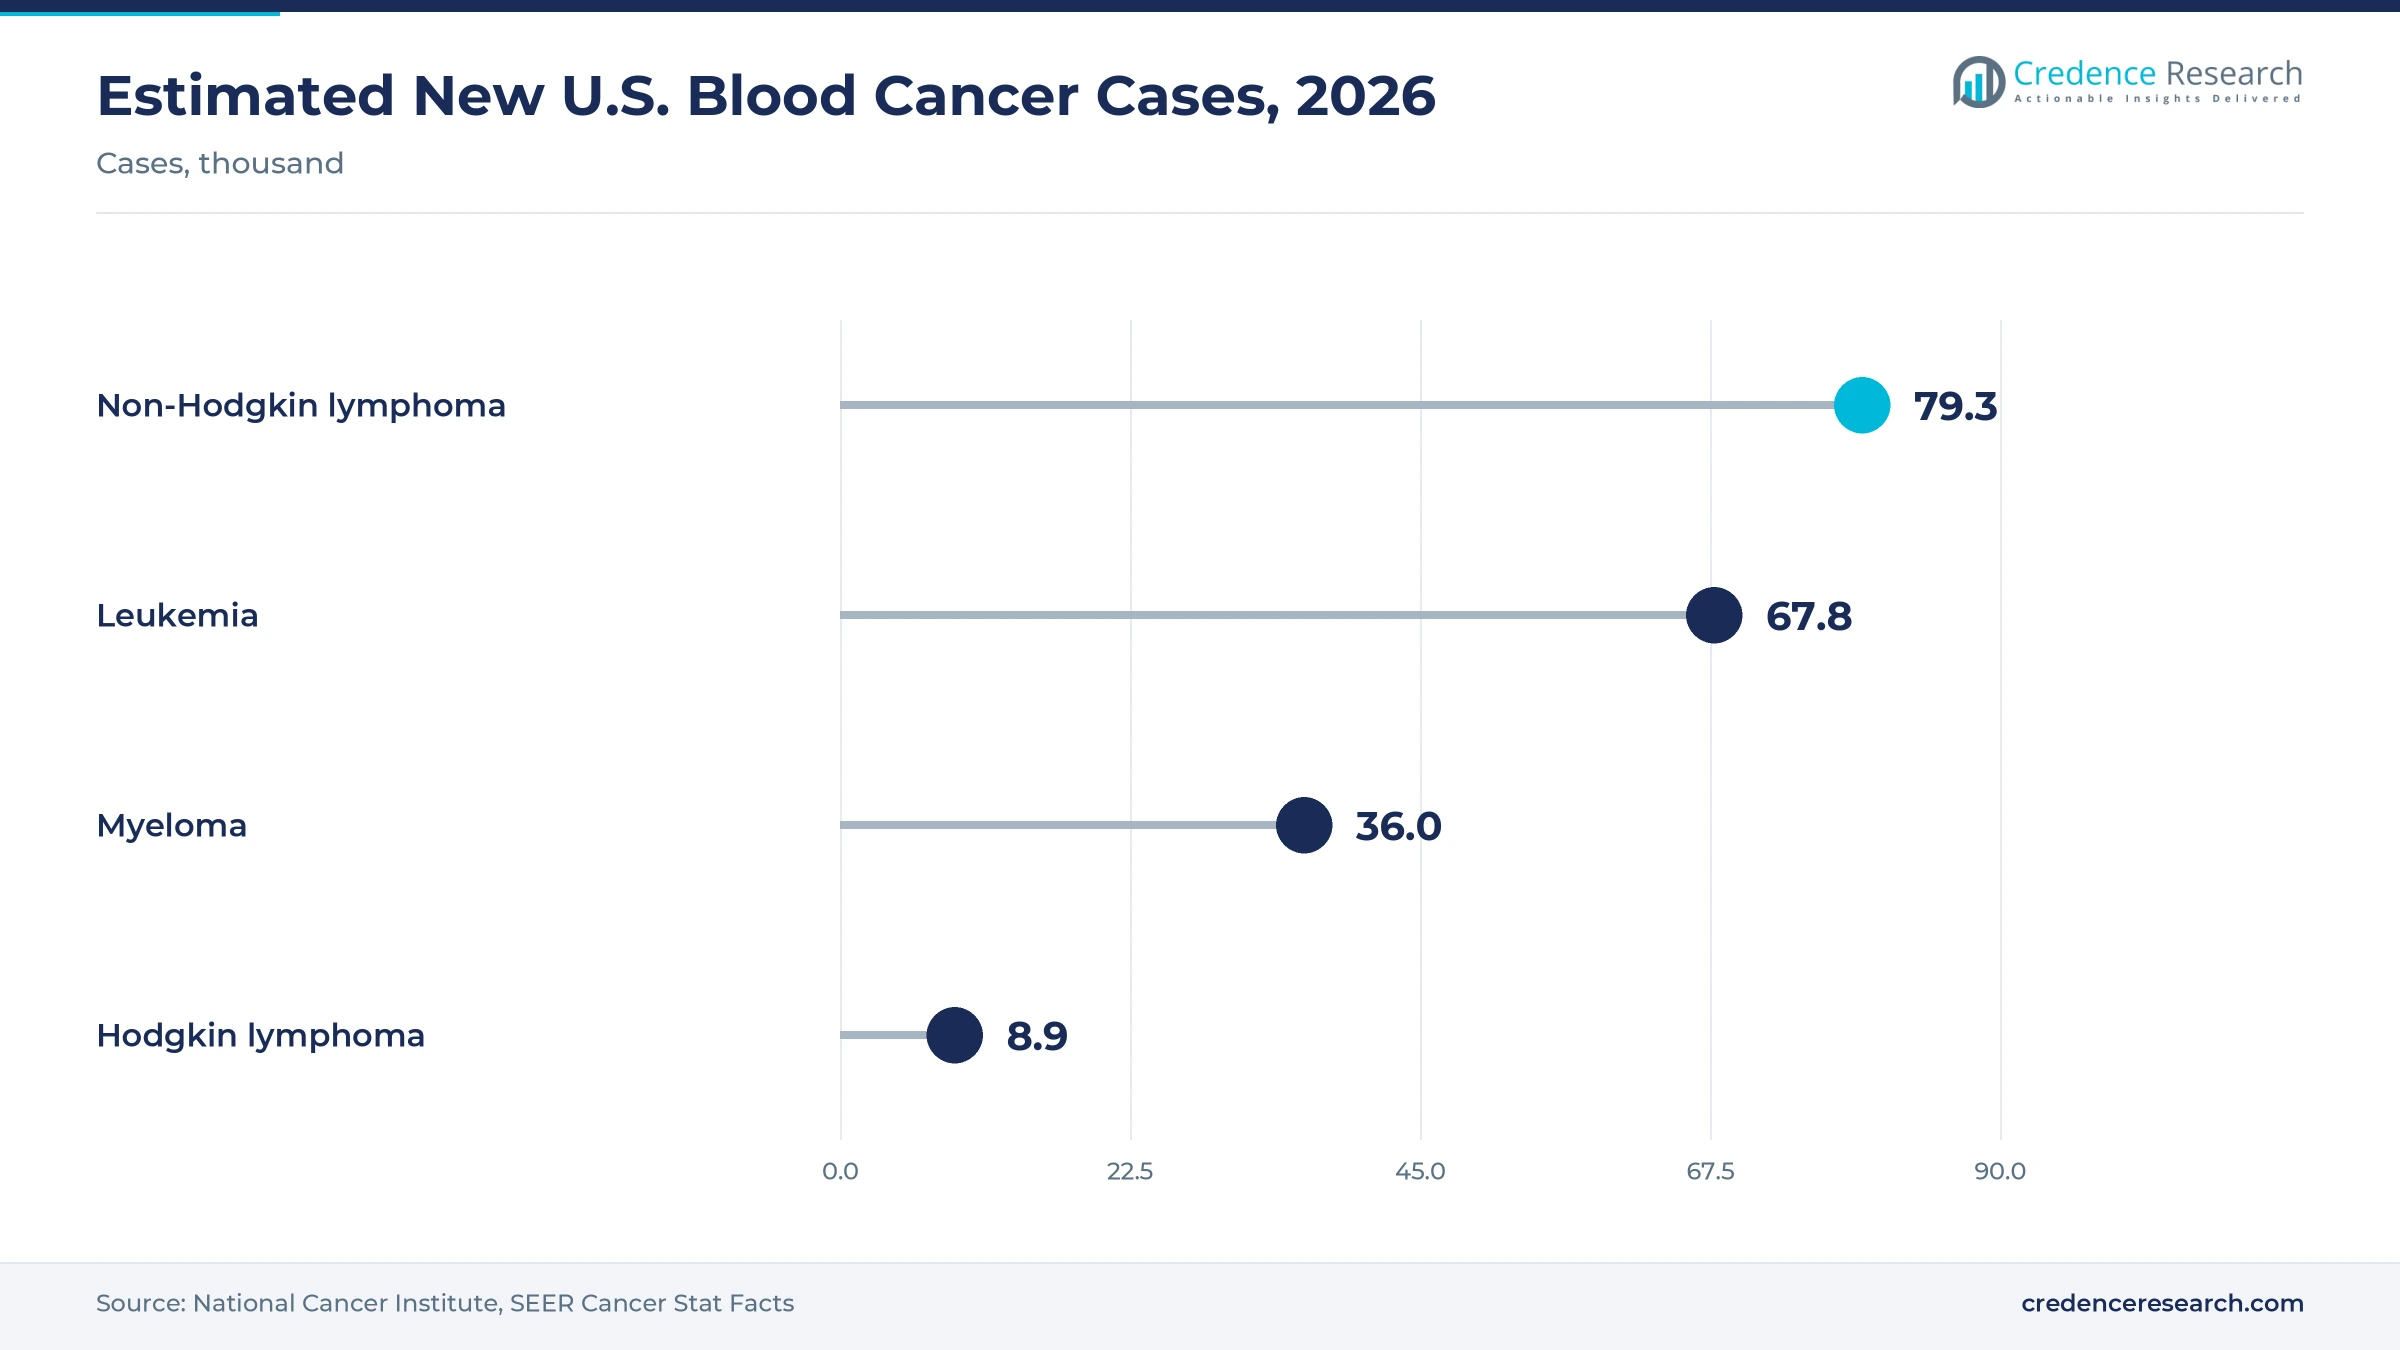
Blood cancers remain the largest source of demand, because CAR-T products are approved for lymphoma, leukemia and myeloma after earlier treatment fails. The National Cancer Institute estimates 79,320 new non-Hodgkin lymphoma cases in the U.S. in 2026, alongside 67,790 leukemia cases and 36,000 cases of multiple myeloma. The same estimates project 19,970 lymphoma deaths, 23,910 leukemia deaths and 10,850 myeloma deaths in 2026. Because many patients relapse, CAR-T moves into earlier lines of care. This shift keeps oncology the largest disease area through 2035, with about 183,000 new U.S. cases across the three groups in 2026.
Why do redosable and topical products open new uses?
Newer gene therapies are designed for repeat use or local delivery, which lowers the barriers linked to one-time infusions. On April 23, 2025, the European Commission granted Krystal Biotech marketing authorization for Vyjuvek to treat wounds in dystrophic epidermolysis bullosa patients from birth. The topical gel uses a modified herpes simplex virus to deliver the COL7A1 gene, and patients can be treated again. In turn, home or clinic dosing becomes possible for some rare skin conditions.
In vivo engineering, redosable vectors and solid tumors
Why is in vivo engineering gaining ground?
Developers are shifting from cells modified in a laboratory toward products that engineer cells inside the patient, which could remove weeks of manufacturing. In August 2025, Kite, a Gilead company, agreed to acquire Interius BioTherapeutics, whose lentiviral platform delivers a CAR gene to T and NK cells through a single infusion. Its lead program for B-cell cancers has entered a phase 1 trial. If such programs succeed, in vivo delivery could take share from ex vivo products after 2030.
How are engineered receptors moving into solid tumors?
Cell therapy is expanding beyond blood cancers into solid tumors, which account for most cancer cases worldwide. In August 2024, the FDA granted accelerated approval to Adaptimmune's Tecelra for adults with advanced synovial sarcoma whose tumors express MAGE-A4. It became the first engineered T cell receptor product approved for a solid tumor. In July 2025, Adaptimmune agreed to sell Tecelra and related programs to U.S. WorldMeds, which shows how smaller developers seek partners to fund launches.
Where is the opening in inherited blood and bleeding disorders?
Inherited blood disorders offer a clear opening, because many patients still rely on lifelong transfusions or factor replacement. Gene-edited stem cell products for sickle cell disease and beta thalassemia, and vector-based treatments for hemophilia, can reduce or end that dependence after one course. In July 2026, the FDA approved Vertex's gene-edited sickle cell treatment for children as young as 2. Large patient groups in Africa, the Middle East and South Asia remain untreated. Companies that lower conditioning risk and cost can reach these markets after 2030.
Can neurological and eye disease become larger segments?
Neurological and eye diseases are emerging as the next growth area, because vectors can now reach the spine, brain and retina directly. Spark Therapeutics built Luxturna, the first directly administered U.S. gene therapy for an inherited retinal disease, while Novartis extended spinal muscular atrophy treatment to older patients through Itvisma. Bayer's AskBio unit develops vector programs for Parkinson's disease and heart failure. As these programs mature, the neurological share of value rises toward 2035.
Safety holds, manufacturing cost and payer models
What do safety holds mean for gene therapy timelines?
Serious adverse events can halt programs and delay approvals, which raises risk for developers and investors. The FDA placed a clinical hold on Rocket Pharmaceuticals' Danon disease gene therapy trial on May 23, 2025, after a patient died. According to a report on the hold being lifted in August 2025, the death followed capillary leak syndrome linked to an acute systemic infection. Such events push sponsors to change immune suppression plans and slow high-dose vector programs, although Rocket later won FDA approval for Kresladi in March 2026.
Why does manufacturing cost limit patient numbers?
Autologous cell products are made one patient at a time, so each dose needs collection, shipping, engineering, testing and release. Manufacturing slots, viral vector supply and skilled staff remain limited, which leads to waiting lists at treatment centers. Production of adeno-associated viral vectors at high doses is also costly. These constraints keep prices high and slow the expansion of treated volumes outside large markets.
How do payers handle one-time treatments?
Many gene therapies carry prices in the millions of dollars because one treatment may replace years of care. Public and private payers struggle to fund large upfront costs, so they negotiate outcomes-based agreements, installment payments and rebates tied to durability. Health technology assessment bodies in Europe often restrict coverage to narrow patient groups. These hurdles delay uptake after approval, especially in countries with fixed health budgets.
Why does access remain narrow outside major centers?
Most advanced therapies need specialized centers with apheresis units, intensive care beds and trained staff for managing side effects. Patients in rural areas and lower-income countries often travel long distances or remain untreated. Even after the June 2025 label changes, centers must still monitor patients closely. In turn, regional gaps in access persist across Latin America, Africa and parts of Asia through the early 2030s.
U.S. centers lead while China scales CAR-T supply
| Region | Value, 2025 (USD billion) | Share, 2025 | CAGR, 2026–2035 |
|---|---|---|---|
| North America | 13.04 | 52.0% | 16.89% |
| Europe | 6.27 | 25.0% | 17.19% |
| Asia Pacific | 4.26 | 17.0% | 20.19% |
| Latin America | 0.88 | 3.5% | 18.69% |
| Middle East & Africa | 0.63 | 2.5% | 18.59% |
North America leads on approvals and centers
North America held a 52.0% share of 2025 value and grows at 16.89% a year through 2035. The U.S. leads spending, because most CAR-T, gene-edited and vector-based products reached U.S. patients first. The removal of the CAR-T risk program in June 2025 lets more community hospitals give these products. However, payer negotiations over multimillion-dollar prices still slow uptake for some one-time treatments.
Europe grows through centralized approvals
Europe held a 25.0% share of 2025 value and grows at 17.19% a year, supported by centralized approvals from the European Commission. Germany, France, Italy, Spain and the U.K. host most treatment centers, and Vyjuvek gained EU authorization in April 2025. However, health technology assessments and national price talks often delay launches by a year or more after approval, which holds back early revenue.
Asia Pacific grows fastest on local programs
Asia Pacific held a 17.0% share of 2025 value and is the fastest-growing region at 20.19% a year. China has a large pipeline of locally developed CAR-T products and growing manufacturing capacity. Japan offers conditional approval paths for regenerative products, and South Korea and Australia run many clinical trials. As local prices are lower, more patients can be treated across the region.
Latin America builds early capacity
Latin America held a 3.5% share of 2025 value and grows at 18.69% a year through 2035. Brazil and Argentina lead regional use, with a small number of academic centers giving CAR-T products. Limited budgets and import logistics slow wider access to these treatments.
Middle East and Africa start from a low base
The Middle East & Africa held a 2.5% share of 2025 value and grows at 18.59% a year. Gulf states such as Saudi Arabia and the United Arab Emirates fund advanced treatment for sickle cell disease and blood cancers. In much of Africa, access remains very limited despite a high sickle cell burden.
Pediatric, rare disease and CAR-T milestones to 2026
| Development | Status and market relevance |
|---|---|
| In April 2025, the European Commission authorized Krystal Biotech's Vyjuvek for dystrophic epidermolysis bullosa wounds from birth. | Approved. Brings a redosable topical gene therapy to Europe. |
| In June 2025, the FDA eliminated the risk program for approved BCMA- and CD19-directed autologous CAR-T products. | In force. Eases center requirements and widens access. |
| In August 2025, Kite agreed to acquire Interius BioTherapeutics and its in vivo CAR-T platform. | Announced. Moves a major CAR-T maker into in vivo engineering. |
| In March 2026, the FDA approved Rocket Pharmaceuticals' Kresladi for leukocyte adhesion deficiency type 1, two years after an earlier rejection. | Approved. Adds a lentiviral treatment for an ultra-rare immune disorder. |
| In July 2026, the FDA approved Vertex's gene-edited sickle cell treatment for children as young as 2. | Approved. Widens the eligible sickle cell population to young children. |
Editing, vectors and engineered receptors drive design
- CRISPR editing such as the approach behind Casgevy switches on fetal hemoglobin in a patient's own stem cells to treat inherited blood disorders.
- CAR-T engineering reprograms T cells to find CD19 or BCMA on cancer cells and drives most current revenue in blood cancers.
- Engineered T cell receptors such as afami-cel recognize proteins inside tumor cells and open a path into solid tumors.
- Viral vectors such as AAV and herpes simplex virus carry working genes into nerve, muscle, eye or skin cells.
- In vivo CAR delivery uses lentiviral or lipid carriers to engineer immune cells inside the body without laboratory processing.
Need a Custom Version of This Report?
Tailor the scope, geography, or segments to your exact requirements.
- Custom geography or segment scope
- Direct access to our analyst team
Pharma majors and focused biotechs compete on platforms
Competition splits between large drugmakers with approved platforms and focused biotech companies with first-in-class programs. Gilead Sciences through Kite, Bristol-Myers Squibb and Novartis AG lead CAR-T supply for lymphoma, leukemia and myeloma, and they compete on manufacturing turnaround, center networks and earlier-line data. Vertex Pharmaceuticals and CRISPR Therapeutics share Casgevy, the first approved CRISPR-edited product. Krystal Biotech, Spark Therapeutics and Rocket Pharmaceuticals focus on vector-based treatments for rare skin, eye and heart conditions, while Bayer AG builds vector programs through its AskBio unit. Adaptimmune brought the first engineered receptor product to a solid tumor before selling it in 2025. Because platforms take years to build, buyers acquire smaller developers to add new delivery methods.
Companies profiled and their roles in this market
| Company | Type | Role in the market |
|---|---|---|
| Spark Therapeutics | Gene therapy | Luxturna gene therapy for inherited retinal disease |
| Vertex Pharmaceuticals Incorporated | Gene editing | Casgevy for sickle cell disease and beta thalassemia |
| Krystal Biotech, Inc. | Gene therapy | Vyjuvek redosable topical gene therapy |
| Rocket Pharmaceuticals | Gene therapy | AAV programs for Danon disease and other rare disorders |
| CRISPR Therapeutics | Gene editing | Casgevy co-developer and editing pipeline |
| Bayer AG | Diversified pharma | AskBio vector programs for neurological and heart disease |
| Novartis AG | Cell and gene therapy | Kymriah and spinal muscular atrophy gene therapy |
| Gilead Sciences, Inc. | Cell therapy | Kite CAR-T products Yescarta and Tecartus |
| Bristol-Myers Squibb Company | Cell therapy | Breyanzi and Abecma CAR-T products |
| Adaptimmune | Cell therapy | Developer of Tecelra, sold to U.S. WorldMeds in 2025 |
Durable responses justify prices but access lags
Credence Research's view is that CAR-T products will keep the largest share of value through 2035, while gene-edited and in vivo products grow faster from a smaller base. The removal of the CAR-T risk program and earlier-line use widen the treated population in blood cancers. Durable responses support high prices, but payer budgets and center capacity limit how fast patients reach treatment. Companies that shorten manufacturing, lower conditioning risk or deliver genes without cell processing are best placed to capture growth in genetic and neurological disease.
Treated patients, launch timing and prices anchor the model
The report uses 2025 as the base year and forecasts market value to 2035, with growth rates stated for 2026–2035. Market values come from the Credence Research market model, which combines treated patient numbers by product and indication, approval timing and average selling prices by region. Splits by therapy type, therapeutic area, delivery method, end user and region are Credence Research estimates. Sources used include FDA and European Commission decisions, National Cancer Institute statistics, and company press releases. No primary interviews or surveys were used to build the estimates in this report.
In vivo delivery and genetic disease lift value by 2035
By 2035, the market reaches USD 127.80 billion, with gene therapy growing faster than cell therapy. Oncology remains the largest disease area as CAR-T products move into earlier lines of lymphoma, leukemia and myeloma care. Genetic disorders gain share as gene-edited treatments for sickle cell disease and beta thalassemia scale up. In vivo delivery takes a larger part of value if programs such as those from Kite and others succeed in trials. Asia Pacific grows fastest as China expands local production, while payers adopt outcomes-based contracts for one-time treatments.
Frequently Asked Questions
How big is the gene and cell therapy market?
Which therapy type leads the market?
Which delivery method grows fastest?
Which region holds the largest share?
What did the FDA change for CAR-T products in 2025?
How many blood cancer cases are expected in the U.S.?
Who are the leading companies?
What are the main challenges?
Table of Content
Chapter 1 Market Segmentation
- 1.1 Segmentation Framework
- 1.1.1 Product and Service Classification
- 1.1.2 Application and End-Use Classification
- 1.1.3 Technology and Solution Classification
- 1.1.4 Customer and Distribution Channel Classification
- 1.1.5 Geographic Segmentation
- 1.1.6 Market Segment Definitions and Boundaries
- 1.2 By Therapy Type
- 1.2.1 Cell Therapy
- 1.2.2 Gene Therapy
- 1.3 By Therapeutic Area
- 1.3.1 Oncology
- 1.3.2 Genetic Disorders
- 1.3.3 Rare Diseases
- 1.3.4 Neurological Disorders
- 1.3.5 Cardiovascular Diseases
- 1.4 By Delivery Method
- 1.4.1 Ex Vivo Delivery
- 1.4.2 In Vivo Delivery
- 1.5 By End User
- 1.5.1 Hospitals
- 1.5.2 Research Institutes
Chapter 2 Introduction
- 2.1 Report Objectives and Scope
- 2.2 Product Definition and Industry Terminology
- 2.3 Market Inclusions and Exclusions
- 2.4 Research Process
- 2.4.1 Primary Research and Expert Interviews
- 2.4.2 Secondary Research and Source Review
- 2.4.3 Top-Down and Bottom-Up Estimation
- 2.4.4 Data Triangulation and Verification
- 2.5 Market Size Measurement Basis
- 2.5.1 2025: USD 25.08 billion → 2035: USD 127.80 billion
- 2.6 Historical and Forecast Reference Periods
- 2.6.1 Historical Period: 2018-2025
- 2.6.2 Base Year: 2025
- 2.6.3 Forecast Period: 2025-2035
- 2.7 Research Assumptions and Limitations
Chapter 3 Executive Summary
- 3.1 Market Snapshot and Key Findings
- 3.2 Base-Year Market Size, 2025
- 3.3 Forecast Market Size, 2035
- 3.4 Revenue and Volume Growth Outlook
- 3.5 Key Demand and Supply Indicators
- 3.6 Leading Market Segments
- 3.7 Fastest-Growing Market Opportunities
- 3.8 Regional Performance Highlights
- 3.9 Technology and Industry Transformation
- 3.10 Competitive Landscape Summary
- 3.11 Analyst View and Strategic Implications
Chapter 4 Global Gene and Cell Therapy Market Trends and Developments
- 4.1 Historical Industry Development, 2018-2025
- 4.2 Recent Market Trends and Developments
- 4.3 Demand and Customer Behavior Trends
- 4.4 Technology and Product Innovation
- 4.5 Artificial Intelligence, Automation and Digitalization
- 4.6 Local Manufacturing and Supply Chain Realignment
- 4.7 Industry Partnerships, Mergers and Acquisitions
- 4.8 Sustainability and Circular Economy Developments
- 4.9 Government and Private Sector Investment Trends
- 4.10 Emerging Business Models and Commercialization
- 4.11 Industry Developments and Announcements
Chapter 5 Global Gene and Cell Therapy Market Production, Supply and Demand Analysis
- 5.1 Demand Trend and Consumption Analysis, 2018-2025
- 5.2 Demand Forecast, 2025-2035
- 5.3 Production and Output Trend, 2018-2025
- 5.4 Production and Output Forecast, 2025-2035
- 5.5 Installed Capacity and Capacity Utilization
- 5.6 Company-Wise Production Plants and Statistics
- 5.6.1 Installed Production Capacity
- 5.6.2 Actual Production
- 5.6.3 Planned Capacity and Expansion Targets
- 5.7 Supply Chain Structure and Procurement Trends
- 5.8 Supply-Demand Gap and Bottlenecks
- 5.9 Import Dependence and Sourcing Structure
- 5.10 Contract Manufacturing and Outsourcing
- 5.11 Regional Supply and Demand Concentration
Chapter 6 Global Gene and Cell Therapy Market Pricing Analysis
- 6.1 Pricing Structure and Measurement
- 6.2 Historical Pricing Trends, 2018-2025
- 6.3 Pricing Outlook, 2025-2035
- 6.4 Average Selling Price and Unit Economics
- 6.5 Pricing by Product and Market Segment
- 6.6 Geographic Pricing Differences
- 6.7 Key Input, Energy, Labor and Logistics Costs
- 6.8 Contract Pricing and Purchasing Models
- 6.9 Pricing Sensitivity and Competitive Positioning
- 6.10 Price, Margin and Profitability Implications
Chapter 7 Global Gene and Cell Therapy Market Dynamics
- 7.1 Market Growth Drivers
- 7.1.1 Demand-Side Drivers
- 7.1.2 Technology and Innovation Drivers
- 7.1.3 Infrastructure and Investment Drivers
- 7.1.4 Regulatory and Policy Drivers
- 7.2 Market Restraints
- 7.2.1 Cost and Affordability Constraints
- 7.2.2 Technology and Adoption Barriers
- 7.2.3 Supply Chain and Operational Constraints
- 7.3 Market Challenges
- 7.3.1 Competitive Pressure and Margin Erosion
- 7.3.2 Skills, Infrastructure and Implementation Gaps
- 7.4 Emerging Market Opportunities
- 7.5 Market Dynamics Impact and Time-Horizon Assessment
Chapter 8 Global Gene and Cell Therapy Value Chain Analysis
- 8.1 Industry Value Chain Overview
- 8.2 Upstream Suppliers and Critical Inputs
- 8.3 Technology and Component Providers
- 8.4 Manufacturing or Service Delivery
- 8.5 Distribution, Channel Partners and Integrators
- 8.6 Downstream Applications and End Users
- 8.7 Value Addition and Profit Pools
- 8.8 Vertical Integration and Outsourcing
- 8.9 Supplier Concentration and Risk
- 8.10 Supply Chain Localization and Resilience
Chapter 9 Global Gene and Cell Therapy Market Regulations and Policies
- 9.1 Relevant Laws, Standards and Compliance Frameworks
- 9.2 Product, Service, Safety and Quality Requirements
- 9.3 Government Policies, Incentives and Subsidies
- 9.4 Imports, Exports and Trade Barriers
- 9.5 Public Procurement and Local Content Requirements
- 9.6 Environmental and Sustainability Compliance
- 9.7 Upcoming Policy Changes and Market Implications
Chapter 10 Global Gene and Cell Therapy Market Hotspots and Opportunities
- 10.1 Market Opportunity Mapping and Growth Hotspots
- 10.2 High-Growth Applications and Customer Groups
- 10.3 Underserved Markets and White-Space Opportunities
- 10.4 Emerging Technology and Product Opportunities
- 10.5 New Capacity and Investment Hotspots
- 10.6 Market Entry and Expansion Opportunities
- 10.7 Distribution and Partnership Opportunities
- 10.8 Near-Term and Long-Term Commercial Potential
- 10.9 Opportunity Attractiveness and Execution Risks
Chapter 11 Global Gene and Cell Therapy Market Outlook, 2025-2035
- 11.1 Market Size and Analysis
- 11.1.1 Revenue (Market Measurement: 2025: USD 25.08 billion → 2035: USD 127.80 billion)
- 11.1.2 Market Volume and Quantity Sold
- 11.1.3 Historical Market Size, 2018-2025
- 11.1.4 Base-Year Market Size, 2025
- 11.2 Market Forecast, 2025-2035
- 11.2.1 Revenue Forecast to 2035
- 11.2.2 Volume Forecast to 2035
- 11.2.3 CAGR and Year-on-Year Growth
- 11.2.4 Incremental Revenue Opportunity
- 11.3 Forecast Assumptions and Scenario Analysis
- 11.3.1 Base-Case Forecast
- 11.3.2 Optimistic and Conservative Scenarios
- 11.3.3 Technology, Pricing and Policy Sensitivities
- 11.4 Market Attractiveness and Growth Outlook
Chapter 12 Global Gene and Cell Therapy Market Segmentation and Outlook
- 12.1 Segmentation Summary and Market Shares, 2025
- 12.2 Largest and Fastest-Growing Segments
- 12.3 By Therapy Type - Market Size and Forecast, 2025-2035
- 12.3.1 Segment Definition and Scope
- 12.3.2 Historical Market Size, 2018-2025
- 12.3.3 Revenue Forecast, 2025-2035
- 12.3.4 Volume Forecast, 2025-2035
- 12.3.5 Base-Year Market Share, 2025
- 12.3.6 Segment CAGR and Growth Drivers
- 12.3.7 Subsegment Market Size and Forecast
- 12.3.7.1 Cell Therapy
- 12.3.7.2 Gene Therapy
- 12.3.8 Subsegment Pricing and Adoption Trends
- 12.3.9 Leading Suppliers and Competition
- 12.3.10 Regional Demand and Opportunities
- 12.4 By Therapeutic Area - Market Size and Forecast, 2025-2035
- 12.4.1 Segment Definition and Scope
- 12.4.2 Historical Market Size, 2018-2025
- 12.4.3 Revenue Forecast, 2025-2035
- 12.4.4 Volume Forecast, 2025-2035
- 12.4.5 Base-Year Market Share, 2025
- 12.4.6 Segment CAGR and Growth Drivers
- 12.4.7 Subsegment Market Size and Forecast
- 12.4.7.1 Oncology
- 12.4.7.2 Genetic Disorders
- 12.4.7.3 Rare Diseases
- 12.4.7.4 Neurological Disorders
- 12.4.7.5 Cardiovascular Diseases
- 12.4.8 Subsegment Pricing and Adoption Trends
- 12.4.9 Leading Suppliers and Competition
- 12.4.10 Regional Demand and Opportunities
- 12.5 By Delivery Method - Market Size and Forecast, 2025-2035
- 12.5.1 Segment Definition and Scope
- 12.5.2 Historical Market Size, 2018-2025
- 12.5.3 Revenue Forecast, 2025-2035
- 12.5.4 Volume Forecast, 2025-2035
- 12.5.5 Base-Year Market Share, 2025
- 12.5.6 Segment CAGR and Growth Drivers
- 12.5.7 Subsegment Market Size and Forecast
- 12.5.7.1 Ex Vivo Delivery
- 12.5.7.2 In Vivo Delivery
- 12.5.8 Subsegment Pricing and Adoption Trends
- 12.5.9 Leading Suppliers and Competition
- 12.5.10 Regional Demand and Opportunities
- 12.6 By End User - Market Size and Forecast, 2025-2035
- 12.6.1 Segment Definition and Scope
- 12.6.2 Historical Market Size, 2018-2025
- 12.6.3 Revenue Forecast, 2025-2035
- 12.6.4 Volume Forecast, 2025-2035
- 12.6.5 Base-Year Market Share, 2025
- 12.6.6 Segment CAGR and Growth Drivers
- 12.6.7 Subsegment Market Size and Forecast
- 12.6.7.1 Hospitals
- 12.6.7.2 Research Institutes
- 12.6.8 Subsegment Pricing and Adoption Trends
- 12.6.9 Leading Suppliers and Competition
- 12.6.10 Regional Demand and Opportunities
- 12.7 Segment Growth Comparison
- 12.8 Segment Attractiveness and Priority Matrix
Chapter 13 Global Gene and Cell Therapy End-Use and Application Market Outlook
- 13.1 End-Use Industry and Customer Demand Structure
- 13.2 Leading Applications and Customer Groups
- 13.3 End-Use Market Size, Share and Forecast
- 13.4 Major End-Use Industry Deep Dives
- 13.4.1 Customer Requirements and Use Cases
- 13.4.2 Demand and Replacement Cycles
- 13.4.3 Technical and Regulatory Considerations
- 13.4.4 Purchasing and Procurement Models
- 13.4.5 Leading Vendors and Distribution Channels
- 13.4.6 Forecast and Commercial Opportunities
- 13.5 Emerging Applications and Cross-Segment Demand
- 13.6 End-Use Industry Investment Priorities
Chapter 14 Global Gene and Cell Therapy Geographic Market Outlook, 2025-2035
- 14.1 Regional Market Size and Share, 2025
- 14.2 Regional Market Forecast, 2025-2035
- 14.3 Regional Pricing, Production and Demand Differences
- 14.4 North America
- 14.4.1 United States
- 14.4.2 Canada
- 14.4.3 Mexico
- 14.5 Europe
- 14.5.1 Germany
- 14.5.2 France
- 14.5.3 Italy
- 14.5.4 United Kingdom
- 14.5.5 Spain
- 14.5.6 Poland
- 14.5.7 Russia
- 14.5.8 Netherlands
- 14.5.9 Belgium
- 14.5.10 Sweden
- 14.5.11 Denmark
- 14.5.12 Norway
- 14.5.13 Rest of Europe
- 14.6 Asia Pacific
- 14.6.1 China
- 14.6.2 India
- 14.6.3 Japan
- 14.6.4 South Korea
- 14.6.5 Thailand
- 14.6.6 Indonesia
- 14.6.7 Vietnam
- 14.6.8 Malaysia
- 14.6.9 Australia
- 14.6.10 Rest of Asia Pacific
- 14.7 Latin America
- 14.7.1 Brazil
- 14.7.2 Argentina
- 14.7.3 Colombia
- 14.7.4 Chile
- 14.7.5 Rest of Latin America
- 14.8 Middle East
- 14.8.1 Saudi Arabia
- 14.8.2 United Arab Emirates
- 14.8.3 Turkey
- 14.8.4 Israel
- 14.8.5 Iran
- 14.8.6 Rest of the Middle East
- 14.9 Africa
- 14.9.1 South Africa
- 14.9.2 Egypt
- 14.9.3 Nigeria
- 14.9.4 Morocco
- 14.9.5 Rest of Africa
- 14.10 Regional Investment, Policy and Supply Chain Differences
- 14.11 Regional Competitive Landscape
- 14.12 Geographic Growth Hotspots
Chapter 15 Global Gene and Cell Therapy Technology, Innovation and Sustainability Outlook
- 15.1 Technology Landscape and Maturity
- 15.2 Product, Process and Service Innovation
- 15.3 AI, Automation and Digital Tools in the Industry
- 15.4 Technology Adoption and Performance Benchmarking
- 15.5 Innovation Pipeline and R&D Investment
- 15.6 Patent and Intellectual Property Trends
- 15.7 Energy Efficiency and Resource Management
- 15.8 Sustainability, Recycling and Circularity
- 15.9 Technology Roadmap, 2025-2035
- 15.10 Risks of Obsolescence and Technology Substitution
Chapter 16 Global Gene and Cell Therapy Market Key Strategic Imperatives
- 16.1 Growth and Market Entry Priorities
- 16.2 High-Return Products and Segments
- 16.3 Pricing, Profitability and Cost Optimization
- 16.4 Technology Investment and Product Differentiation
- 16.5 Supply Chain Localization and Resilience
- 16.6 Distribution and Customer Acquisition
- 16.7 Partnership, Acquisition and Capacity Strategy
- 16.8 Regional Expansion Priorities
- 16.9 Short-, Medium- and Long-Term Actions
Chapter 17 Competition Outlook
- 17.1 Industry Competition Characteristics
- 17.2 Market Structure and Concentration
- 17.3 Market Share and Competitive Positioning, 2025
- 17.4 Company-Wise Revenue and Product Benchmarking
- 17.5 Production and Service Capacity Benchmarking
- 17.6 Technology, Pricing and Differentiation
- 17.7 Regional Footprint and Distribution Strength
- 17.8 Mergers, Acquisitions and Strategic Alliances
- 17.9 New Entrants and Competitive Threats
- 17.10 Porter's Five Forces and Industry Attractiveness
- 17.11 Competitive Outlook, 2025-2035
Chapter 18 Company Profiles
- 18.1 Company Coverage and Selection Criteria
- 18.2 Spark Therapeutics
- 18.2.1 Business Description
- 18.2.2 Company Ownership and Geographic Presence
- 18.2.3 Product and Service Portfolio
- 18.2.4 Manufacturing and Operating Footprint
- 18.2.5 Production Capacity and Expansion Plans
- 18.2.6 Financial Performance and Investment
- 18.2.7 Market Share and Competitive Position
- 18.2.8 Technology and Innovation Capabilities
- 18.2.9 Strategic Alliances or Partnerships
- 18.2.10 Recent Developments
- 18.2.11 Growth Strategy and Outlook
- 18.3 Vertex Pharmaceuticals Incorporated
- 18.4 Krystal Biotech, Inc.
- 18.5 Rocket Pharmaceuticals
- 18.6 CRISPR Therapeutics
- 18.7 Bayer AG
- 18.8 Novartis AG
- 18.9 Gilead Sciences, Inc.
- 18.10 Bristol-Myers Squibb Company
- 18.11 Adaptimmune
- 18.12 Other Relevant Market Participants
Note: Every listed company is profiled on the structure shown under the first company. The company list is preliminary and may change based on research findings, market developments, data availability and client requirements.
Chapter 19 Disclaimer
- 19.1 Research and Forecast Disclaimer
- 19.2 Data Source and Estimation Limitations
Note: The depth of individual sections depends on data availability for this market. Volume, capacity, trade and other unit-based metrics are included where applicable.

