
Distributed Solar Power Generation Market Overview:
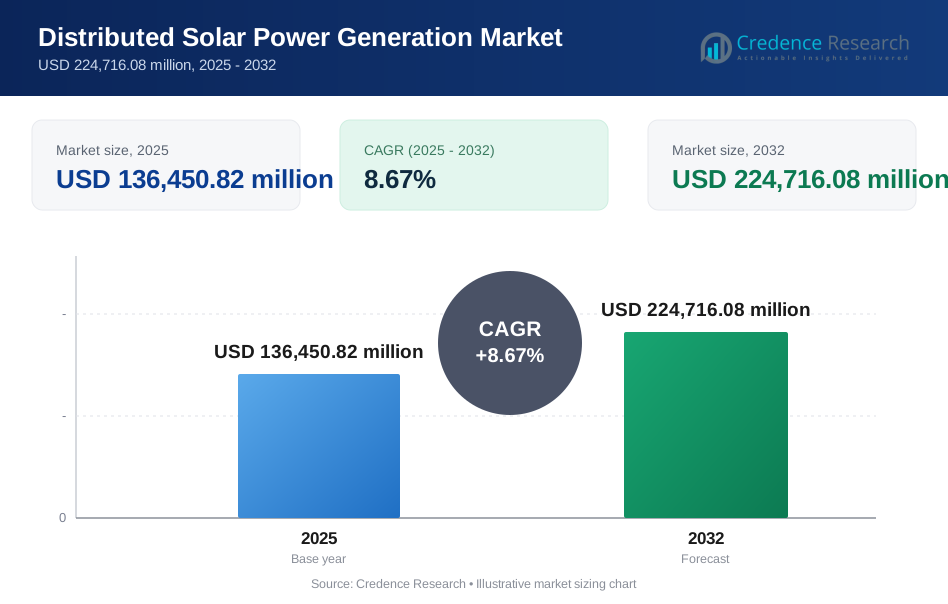
The Distributed Solar Power Generation Market size was estimated at USD 136,450.82 million in 2025 and is expected to reach USD 224,716.08 million by 2032, growing at a CAGR of 8.67% from 2025 to 2032. Growth is primarily supported by accelerating customer economics for onsite generation as retail electricity prices, demand charges, and reliability concerns increase the value of self-consumption across residential and commercial sites. Policy support for distributed generation, faster permitting in select markets, and wider availability of installer financing continue to expand addressable adoption beyond early adopters.
| REPORT ATTRIBUTE | DETAILS |
|---|---|
| Historical Period | 2020-2024 |
| Base Year | 2025 |
| Forecast Period | 2026-2032 |
| Distributed Solar Power Generation Market Size 2025 | USD 136,450.82 million |
| Distributed Solar Power Generation Market, CAGR | 8.67% |
| Distributed Solar Power Generation Market Size 2032 | USD 224,716.08 million |
Key Market Trends & Insights
- The Distributed Solar Power Generation Market is projected to expand at an 8.67% CAGR during 2025–2032.
- Rooftop PV accounted for the largest share of 66.1% in 2025, supported by dense residential and C&I building stock and faster project cycle times.
- On-grid configurations held 70.9% share in 2025 as grid-connected self-consumption remains the dominant deployment model for distributed PV.
- Asia Pacific represented 46.9% share in 2025, driven by scale deployment in large rooftop and small commercial systems.
- The Distributed Solar Power Generation Market is expected to reach USD 224,716.08 million by 2032, reflecting continued capacity additions and higher penetration in C&I use cases.
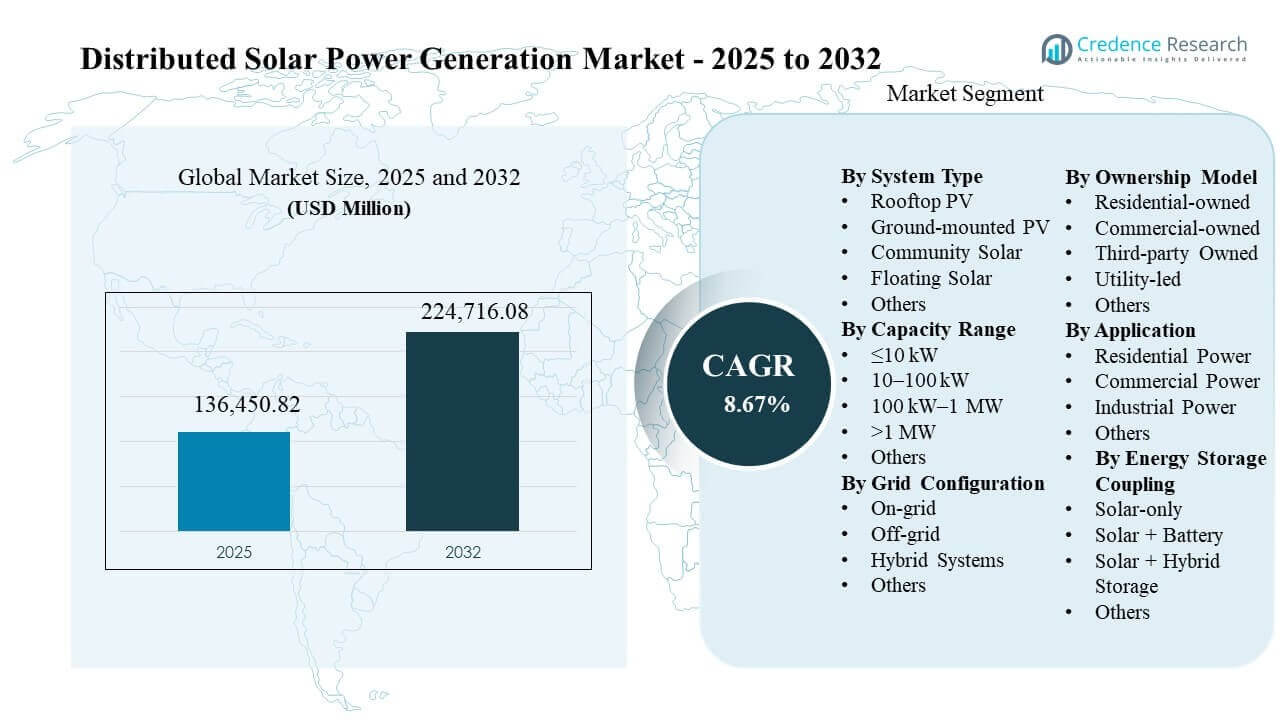
Segment Analysis
The Distributed Solar Power Generation Market is characterized by a high share of rooftop-led deployments, supported by repeatable engineering designs, established installer channels, and customer demand for bill savings. Residential customers typically prioritize payback period, equipment reliability, and simplified approvals, while commercial customers focus on daytime load matching, peak-demand reduction, and ESG reporting benefits. Storage coupling is increasingly evaluated where time-of-use spreads widen and export compensation becomes less favorable, improving the value of self-consumption.
Community and shared solar models continue to expand access for customers without suitable roofs, including renters and multi-tenant buildings. Market participation also reflects a steady shift toward packaged solutions that combine modules, inverters, monitoring, and optional storage, improving performance visibility and reducing perceived complexity. Financing availability and interconnection timelines remain critical decision factors, especially for larger C&I systems that require higher certainty on grid approvals.
By System Type Insights
Rooftop PV accounted for the largest share of 66.1% in 2025. Rooftop PV leads because rooftop PV aligns closely with distributed load centers and enables rapid deployments without requiring land acquisition. Rooftop PV adoption benefits from predictable design templates and strong installer ecosystems that reduce soft costs. Rooftop PV demand is reinforced by self-consumption value, especially in markets with higher retail tariffs or demand charges.
By Capacity Range Insights
The Distributed Solar Power Generation Market sees strong adoption across smaller systems in residential sites and mid-sized systems in commercial facilities, with project sizing driven by roof area, on-site load profiles, and local interconnection limits. Residential systems frequently prioritize compact configurations that maximize yield per available roof space. Commercial and light industrial sites adopt larger systems when daytime loads support high self-consumption and tariff structures reward peak shaving. Capacity segmentation remains sensitive to permitting thresholds, export limits, and the availability of financing for larger projects.
By Grid Configuration Insights
On-grid accounted for the largest share of 70.9% in 2025. On-grid systems lead because on-grid systems reduce electricity bills immediately without requiring full storage sizing for reliability. On-grid deployments scale faster where interconnection processes are standardized and net billing or export compensation frameworks support project economics. On-grid adoption remains the default in grid-accessible markets, with hybrid designs growing where resiliency needs increase.
By Ownership Model Insights
Ownership structures in the Distributed Solar Power Generation Market vary by policy design and financing depth, with customer ownership remaining common where interest rates and incentives support attractive paybacks. Third-party ownership models expand access by reducing upfront costs and simplifying customer decisions through subscription, lease, or PPA structures. Commercial customers often select structures that align with balance-sheet preferences and tax strategy, where applicable. Utility-led and programmatic offerings support adoption for customers lacking roof suitability or seeking simplified participation through aggregated models.
By Application Insights
Residential power applications are driven by bill savings, resilience preferences, and growing consumer familiarity with distributed energy technologies. Commercial power applications benefit from daytime load alignment, site-level sustainability commitments, and the ability to reduce peak demand exposure. Industrial power adoption rises where distributed PV can offset daytime process loads and where power quality and reliability needs justify hybrid configurations. Application growth also depends on interconnection timelines, roof ownership clarity, and the ability to structure financing for multi-site portfolios.
By Energy Storage Coupling Insights
Solar-only installations remain prevalent where export compensation and grid reliability make storage less essential, but solar-plus-storage is increasingly evaluated where tariff spreads reward time shifting. Battery pairing can strengthen self-consumption value and improve customer resilience during outages. Hybrid storage configurations may gain relevance where customers combine batteries with additional flexibility options, including demand response participation and aggregation programs. Storage coupling decisions are heavily influenced by local tariff structures, backup power preferences, and program availability for grid services.
Distributed Solar Power Generation Market Drivers
Rising electricity costs and value of self-consumption
Rising retail electricity rates and demand charges increase the value of onsite generation for homes and commercial facilities. The Distributed Solar Power Generation Market benefits when self-consumption offsets the highest-cost grid purchases. Customers also view distributed PV as a hedge against tariff volatility, improving adoption confidence. Higher load coincidence during daylight hours strengthens economics for many commercial users. Improved system performance monitoring supports ongoing optimization and higher perceived reliability.
Policy support and streamlined interconnection
Supportive net billing, compensation mechanisms, and distributed generation programs remain key enablers of adoption. The Distributed Solar Power Generation Market expands faster where permitting pathways are clearer and interconnection timelines are predictable. Standardized technical requirements reduce project delays and improve installer productivity. Local incentives and building-level decarbonization targets can also amplify demand. Program stability remains important for long-term channel planning and financing.
- For instance, SolarEdge’s Home Hub inverter platform delivers up to 99% weighted efficiency and supports utility-oriented functions such as export limitation and IEEE 1547-aligned smart inverter capabilities, which helps installers align projects more smoothly with standardized interconnection requirements.
Rapid innovation across modules, inverters, and monitoring
Efficiency gains and product integration improve energy yield and reduce installed cost per delivered kilowatt-hour. The Distributed Solar Power Generation Market benefits from higher-output modules that maximize roof-constrained generation. Advanced inverters and digital monitoring enhance uptime, safety, and grid compliance. Better diagnostics reduce operations and maintenance friction for smaller customers. Integrated platforms also improve customer experience through unified apps and performance insights.
Growing resilience and reliability needs
Power quality concerns and outage risks are increasing customer interest in distributed generation. The Distributed Solar Power Generation Market gains traction as customers seek greater control over energy supply at the site level. Solar-plus-storage solutions strengthen backup power capability for critical loads. Commercial customers increasingly consider resilience as part of business continuity planning. Program designs that reward flexibility and peak reduction further improve the value case.
- For instance, Tesla’s Powerwall 2 provides 13.5 kWh of usable storage, 5 kW of continuous power, and up to 7 kW of peak power, giving residential users a defined backup envelope for essential loads during grid outages.
Distributed Solar Power Generation Market Challenges
The Distributed Solar Power Generation Market faces constraints from permitting complexity and interconnection delays in many jurisdictions. Inconsistent technical standards and queue backlogs can extend project timelines, especially for larger commercial systems. Policy uncertainty around export compensation and distributed generation tariffs can reduce customer confidence and delay decision-making. Workforce availability and installer capacity can also limit short-term scaling. Equipment pricing volatility introduces additional uncertainty in project economics.
- For instance, Enphase’s IQ8 Series microinverters are built on a 55 nm ASIC, support PV modules up to 670 W, provide peak output power of 384 VA at 240 Vac, and have logged more than one million cumulative hours of power-on testing with warranties of up to 25 years, showing how suppliers are pushing higher technical performance and compliance even while project approvals and grid connections remain slow.
The Distributed Solar Power Generation Market also encounters adoption barriers from rooftop suitability, split incentives, and customer acquisition costs. Renters and multi-tenant buildings may lack ownership clarity or decision authority for rooftop installations. Financing access varies across customer segments, affecting affordability despite favorable lifetime economics. Grid hosting capacity limitations may restrict exports in constrained feeders. Storage coupling adoption can be limited by higher upfront costs and unclear value stacking options.
Distributed Solar Power Generation Market Trends and Opportunities
The Distributed Solar Power Generation Market is seeing increased demand for integrated solar-plus-storage offerings that bundle hardware, software, and service. Customers prefer simplified procurement and clearer performance accountability, creating opportunities for turnkey packages. Digital monitoring and energy management features are becoming standard expectations, improving performance transparency. Commercial portfolio deployments across retail, logistics, and public-sector sites create multi-site growth opportunities. Aggregation programs can expand monetization pathways for flexible distributed assets.
- For instance, Sunrun reported in June 2025 that it had activated more than 130,000 home batteries with 650 MW of dispatchable peak capacity, and said its storage attachment rate had reached nearly 70% of new solar customers, underscoring how bundled solar-plus-storage systems with centralized aggregation can scale into grid-support resources.
Community solar and shared ownership models represent an opportunity to broaden participation beyond rooftop-eligible customers. The Distributed Solar Power Generation Market can expand through programs that enable subscription-based access for renters and households without suitable roofs. Commercial customers may also adopt community models for sustainability claims when onsite deployment is limited. Utility-led and municipal programs can accelerate adoption through standardized enrollment and streamlined interconnection. Innovation in financing and credit underwriting can widen addressable demand in emerging markets.
Regional Insights
North America
North America accounted for 23.4% share in 2025. The Distributed Solar Power Generation Market in North America is supported by strong residential adoption in select states and expanding commercial multi-site programs. Financing structures and installer ecosystems enable repeatable deployments, while resilience interest supports storage pairing. Interconnection timelines and compensation rules materially influence deployment velocity at the local level. Commercial demand often centers on peak reduction and sustainability commitments.
Europe
Europe accounted for 20.8% share in 2025. The Distributed Solar Power Generation Market in Europe benefits from high retail electricity prices in many markets and accelerating rooftop adoption across residential and small commercial customers. Policy frameworks and permitting reforms in several countries support faster deployment, though fragmentation across national rules remains a constraint. Commercial customers increasingly deploy rooftop PV to stabilize operating costs and support decarbonization targets. Storage interest rises where time-of-use pricing and export limits improve the value of self-consumption.
Asia Pacific
Asia Pacific accounted for 46.9% share in 2025. The Distributed Solar Power Generation Market in Asia Pacific is driven by large-scale rooftop deployment across industrial parks, commercial buildings, and residential communities in major economies. High solar resource availability and strong manufacturing depth support competitive system pricing and broad installer capacity. Policy support and corporate procurement programs also expand C&I adoption. Grid constraints in dense urban areas can increase interest in storage and advanced inverters.
Latin America
Latin America accounted for 5.6% share in 2025. The Distributed Solar Power Generation Market in Latin America is shaped by uneven policy coverage and varying financing availability across countries. Adoption is concentrated in leading markets where distributed generation rules are clearer and customer economics are compelling. Commercial rooftop systems often lead near-term growth due to stronger load matching and clearer decision-making authority. Currency volatility and interest rates can affect affordability and project pacing.
Middle East & Africa
Middle East and Africa accounted for 3.3% share in 2025. The Distributed Solar Power Generation Market in Middle East and Africa remains smaller in revenue terms, with demand concentrated in select countries and customer segments. Commercial and industrial sites adopt distributed solar where reliability needs, diesel displacement, or high electricity costs support the value case. Program structure and grid tariff design influence rooftop penetration. Opportunities strengthen where permitting and interconnection processes become more standardized.
Competitive Landscape
The Distributed Solar Power Generation Market is highly competitive across modules, inverters, and integrated solutions, with differentiation built around efficiency, reliability, channel reach, and software-enabled performance management. Module suppliers compete on scale manufacturing, product performance, and supply assurance, while inverter and platform providers compete on monitoring, safety features, and ecosystem integration. Partnerships with installers, EPCs, and financing providers shape route-to-market strength. Product innovation cadence and regional policy shifts influence pricing and portfolio strategy.
First Solar competes through differentiated thin-film module technology and a strategy centered on performance, manufacturing scale, and supply reliability. First Solar benefits from positioning that supports domestic and diversified supply strategies in key markets. First Solar also strengthens differentiation through technology collaborations that target performance improvements and next-generation module capabilities. First Solar channel strategy is shaped by utility and large-scale demand dynamics, with relevance expanding where distributed commercial projects value bankability and long-term performance.
The industry research and growth report includes detailed analyses of the competitive landscape of the market and information about key companies, including:
- First Solar
- Canadian Solar
- JinkoSolar
- Trina Solar
- LONGi Green Energy
- SunPower
- Enphase Energy
- SolarEdge Technologies
- SMA Solar Technology
- ABB
Qualitative and quantitative analysis of companies has been conducted to help clients understand the wider business environment as well as the strengths and weaknesses of key industry players. Data is qualitatively analyzed to categorize companies as pure play, category-focused, industry-focused, and diversified; it is quantitatively analyzed to categorize companies as dominant, leading, strong, tentative, and weak.
Recent Developments
- In April 2026, Revolve Renewable Power announced definitive agreements for a new portfolio of nine distributed generation solar projects in Mexico with total capacity of 2.4 MW, and the company said the projects are part of its partnership with RER Energy.
- In February 2026, Aspen Power, a distributed energy generation platform, acquired the first two projects in an 18 MWdc solar portfolio, marking another portfolio expansion move in the distributed solar space.
- In January 2026, GameChange Solar launched a new distributed generation division to serve commercial and industrial and community solar markets in the United States, expanding its offering beyond utility-scale applications.
- In November 2025, Dispatch Energy acquired Green Lantern Solar to expand its presence in the distributed generation and community solar sectors across the eastern United States, with the deal expected to extend its footprint to nine states.
- In July 2025, KKR entered a strategic partnership with CleanPeak Energy through a commitment of A$500 million to launch a new distributed energy platform, supporting the growth of distributed solar, battery storage, and microgrid solutions for Australia’s commercial and industrial sector.
Report Scope
| Report Attribute | Details |
| Market size value in 2025 | USD 136,450.82 million |
| Revenue forecast in 2032 | USD 224,716.08 million |
| Growth rate (CAGR) | 8.67% (2025–2032) |
| Base year | 2025 |
| Forecast period | 2026-2032 |
| Quantitative units | USD million |
| Segments covered | By System Type; By Capacity Range; By Grid Configuration; By Ownership Model; By Application; By Energy Storage Coupling |
| Regional scope | North America, Europe, Asia Pacific, Latin America, Middle East & Africa |
| Key companies profiled | First Solar; Canadian Solar; JinkoSolar; Trina Solar; LONGi Green Energy; SunPower; Enphase Energy; SolarEdge Technologies; SMA Solar Technology; ABB |
| No.of Pages | 328 |
Segmentation
By System Type
- Rooftop PV
- Ground-mounted PV
- Community Solar
- Floating Solar
- Others
By Capacity Range
- ≤10 kW
- 10–100 kW
- 100 kW–1 MW
- >1 MW
- Others
By Grid Configuration
- On-grid
- Off-grid
- Hybrid Systems
- Others
By Ownership Model
- Residential-owned
- Commercial-owned
- Third-party Owned
- Utility-led
- Others
By Application
- Residential Power
- Commercial Power
- Industrial Power
- Others
By Energy Storage Coupling
- Solar-only
- Solar + Battery
- Solar + Hybrid Storage
- Others
By Region
- North America
- U.S.
- Canada
- Mexico
- Europe
- Germany
- France
- U.K.
- Italy
- Spain
- Rest of Europe
- Asia Pacific
- China
- Japan
- India
- South Korea
- South-east Asia
- Rest of Asia Pacific
- Latin America
- Brazil
- Argentina
- Rest of Latin America
- Middle East & Africa
- GCC Countries
- South Africa
- Rest of the Middle East and Africa
Request a Free Sample
Fill in your details and we'll send you a free sample report.
- Sample data tables & charts
- Research methodology
Need a Custom Version of This Report?
Tailor the scope, geography, or segments to your exact requirements.
- Custom geography or segment scope
- Direct access to our analyst team
Frequently Asked Questions
What is the market size and forecast for the Distributed Solar Power Generation Market?
What is the CAGR for the Distributed Solar Power Generation Market?
Which segment is the largest in the Distributed Solar Power Generation Market?
What factors are driving growth in the Distributed Solar Power Generation Market?
Who are the leading companies in the Distributed Solar Power Generation Market?
Which region leads the Distributed Solar Power Generation Market?
Table of Content
Chapter 1. Report Introduction
- 1.1 Report Description & Purpose
- 1.1.1 Report Title & Market Definition
- 1.1.2 Unique Selling Propositions (USP) & Key Differentiators
- 1.1.3 Value Proposition for Stakeholders
- 1.2 Research Objectives
- 1.2.1 Market Sizing Objectives (Volume & Revenue)
- 1.2.2 Segmentation Objectives
- 1.2.3 Competitive Intelligence Objectives
- 1.2.4 Forecast & Scenario Objectives
- 1.3 Report Scope
- 1.3.1 Distributed Solar Power Generation Scope – Types & Subtypes Covered
- 1.3.2 Geographic Scope – Regions & Countries Covered
- 1.3.3 Historical Period, Base Year & Forecast Period (2025; forecast to 2032)
- 1.3.4 Inclusions & Exclusions
- 1.4 HS Code & Classification Framework
- 1.5 Currency, Units & Pricing Basis
- 1.6 Target Stakeholders
- 1.7 Limitations & Assumptions
Chapter 2. Executive Summary
- 2.1 Global Distributed Solar Power Generation Market Snapshot
- 2.1.1 Market Size – Historical (2025) & Forecast (2025-2032) (2025: USD 136,450.82 million → 2032: USD 224,716.08 million)
- 2.1.2 Volume & Revenue – Global Totals
- 2.1.3 Key Market Highlights – Top Five Facts
- 2.2 Distributed Solar Power Generation Market Segmentation Snapshot
- 2.2.1 Market Split by Region – 2025 vs. 2032
- 2.3 Competitive Snapshot
- 2.3.1 Top 10 Players by Revenue Share – 2025
- 2.3.2 Top 10 Players by Volume Share – 2025
- 2.3.3 Recent Strategic Developments (18-Month Summary)
- 2.4 Key Investment Highlights & Strategic Conclusions
Chapter 3. Distributed Solar Power Generation Market Dynamics & Industry Analysis
- 3.1 Market Overview & Context
- 3.1.1 Distributed Solar Power Generation Market Position in the Broader Automotive Value Chain
- 3.1.2 OEM vs. Replacement Market Dynamics
- 3.1.3 Market Maturity & Development Stage by Region
- 3.2 Distributed Solar Power Generation Market Drivers
- 3.3 Distributed Solar Power Generation Market Restraints & Challenges
- 3.4 Distributed Solar Power Generation Market Opportunities
- 3.5 Porter's Five Forces Analysis
- 3.5.1 Threat of New Entrants
- 3.5.2 Bargaining Power of Suppliers
- 3.5.3 Bargaining Power of Buyers
- 3.5.4 Threat of Substitutes
- 3.5.5 Competitive Rivalry – Intensity Assessment
- 3.6 Distributed Solar Power Generation Value Chain Analysis
- 3.6.1 Upstream – Raw Material/Input Suppliers
- 3.6.1.1 Raw Material/Input 1
- 3.6.1.2 Raw Material/Input 2
- 3.6.1.3 Raw Material/Input 3
- 3.6.2 Midstream – Production/Manufacturing/Service Delivery
- 3.6.2.1 Production/Process Overview
- 3.6.2.2 Key Facility Locations & Capacity by Manufacturer
- 3.6.3 Downstream – Distribution & End Consumer
- 3.6.3.1 Primary Channel – B2B/OEM
- 3.6.3.2 Secondary Channels – Dealer, Retail, Online, Direct
- 3.6.4 Value Chain Profitability Analysis
- 3.6.1 Upstream – Raw Material/Input Suppliers
- 3.7 PESTEL Analysis
- 3.7.1 Political Factors
- 3.7.2 Economic Factors
- 3.7.3 Social Factors
- 3.7.4 Technological Factors
- 3.7.5 Environmental Factors
- 3.7.6 Legal Factors
- 3.8 Distributed Solar Power Generation Supply Chain Analysis
- 3.8.1 Raw Material/Input Supply Risk Assessment
- 3.8.2 Manufacturing Concentration Risk (Geographic Exposure)
- 3.8.3 Trade Disruption Impact Analysis
- 3.9 Regulatory & Policy Landscape
Note: The regulatory and policy landscape section covers regulations based on their applicability to the market, Distributed Solar Power Generation category, geography, and scope of the study. Only regulatory frameworks with a material impact on operations, compliance, trade, sustainability, or market access are analyzed in detail.
Chapter 4. Key Investment Pockets & Opportunity Analysis
- 4.1 Distributed Solar Power Generation Market Attractiveness Analysis
- 4.1.1 By Region – Investment Attractiveness Matrix (Volume × CAGR)
- 4.2 Absolute Revenue Growth Opportunity
- 4.2.1 By Region – Absolute USD Growth Through 2032
- 4.3 Incremental Volume Opportunity
- 4.3.1 By Region – Incremental Volume Through 2032
- 4.3.2 Segment – Incremental Volume
- 4.4 Emerging Submarket Opportunity Deep Dive (Subject to Applicability)
- 4.5 Emerging Market Opportunity Scorecards
- 4.5.1 United States
- 4.5.2 Europe
- 4.5.3 Asia
- 4.5.4 Middle East & Africa
Note: Emerging Market Opportunity Scorecards will be included based on relevance and strategic importance. Regions listed are indicative and may vary depending on data availability and market dynamics.
Chapter 5. Distributed Solar Power Generation Import-Export Analysis & Trade Flows
- 5.1 Global Trade Overview
- 5.1.1 Global Export Value by Country (2025)
- 5.1.2 Global Export Volume by Country (2025)
- 5.1.3 Global Import Value by Country (2025)
- 5.1.4 Global Import Volume by Country (2025)
- 5.1.5 Net Trade Balance by Country (2025)
- 5.2 Export Analysis – Segment
- 5.2.1 Type 1 (HS Code)
- 5.2.2 Type 2 (HS Code)
- 5.2.3 Type 3 (HS Code)
- 5.2.4 Type 4 (HS Code)
- 5.2.5 Type 5 (HS Code)
- 5.3 Import Analysis – Segment
- 5.3.1 Type 1 (HS Code)
- 5.3.2 Type 2 (HS Code)
- 5.3.3 Type 3 (HS Code)
- 5.3.4 Type 4 (HS Code)
- 5.3.5 Type 5 (HS Code)
- 5.4 Average Unit Trade Prices
- 5.4.1 Average Export Price – Segment & Country
- 5.4.2 Average Import Price – Segment & Source Country
- 5.4.3 Price Trends (2025)
- 5.5 Key Trade Route Analysis
- 5.5.1 Trade Route 1
- 5.5.2 Trade Route 2
- 5.5.3 Trade Route 3
- 5.5.4 Trade Route 4
- 5.5.5 Trade Route 5
- 5.6 Trade Policy Impact Assessment
- 5.6.1 US Anti-Dumping & Section 301 Tariffs
- 5.6.2 EU Customs Union Impact
- 5.6.3 Major Free Trade Agreements
- 5.6.4 USMCA Rules of Origin
Note: Trade policy analysis will be included only where relevant to the Distributed Solar Power Generation market.
Chapter 6. Competitive Landscape & Company Benchmarking
- 6.1 Distributed Solar Power Generation Market Concentration & Structure
- 6.1.1 Herfindahl-Hirschman Index (HHI) – vs. 2025
- 6.1.2 Tier 1, Tier 2 & Tier 3 Market Structure
- 6.1.3 Global, Regional & Local Player Dynamics
- 6.2 Distributed Solar Power Generation Market Share Analysis – 2025
- 6.2.1 Global Revenue Share by Company
- 6.2.2 Global Volume Share by Company
- 6.2.3 Regional Revenue Share
- 6.2.4 Market Share Evolution ( vs. 2025)
- 6.2.5 OEM Segment Share by Company
- 6.2.6 Replacement Segment Share by Company
- 6.3 Production/Delivery Capacity & Facility Analysis
- 6.3.1 Global Installed Capacity
- 6.3.2 Capacity Utilization Rates
- 6.3.3 Production/Output Volume
- 6.3.4 Facility Locations & Capacity Map
- 6.3.5 Planned Capacity Additions
- 6.4 Distributed Solar Power Generation Competitive Benchmarking Matrix
- 6.4.1 Revenue, Volume, CAGR & Profitability Comparison
- 6.4.2 Channel Revenue Mix
- 6.4.3 Geographic Revenue Exposure
- 6.4.4 R&D Intensity
- 6.4.5 Sustainability Maturity
- 6.5 Strategic Developments in Distributed Solar Power Generation (Last 24 Months)
- 6.5.1 Mergers, Acquisitions & Divestments
- 6.5.2 New Distributed Solar Power Generation Launches
- 6.5.3 Facility Expansions
- 6.5.4 Strategic Alliances, Joint Ventures & Partnerships
- 6.5.5 Distribution Expansion & Market Entry
- 6.5.6 Sustainability & ESG Initiatives
- 6.6 Competitive Strategy Mapping
- 6.6.1 Leader, Challenger, Follower & Niche Classification
- 6.6.2 Pricing Strategy Comparison
- 6.6.3 Channel Strategy Matrix
Note: Strategic developments are included based on their materiality and the availability of reliable information.
Chapter 7. Global Distributed Solar Power Generation Market – By Distribution Channel
- 7.1 Segment Overview
- 7.1.1 Volume & Revenue Split by Channel (2025 & 2032)
- 7.1.2 Channel Mix Evolution (2025-2032)
Chapter 8. Regional Market Analysis – Global Overview
- 8.1 Global Regional Overview
- 8.1.1 Regional Volume Share
- 8.1.2 Regional Revenue Share
- 8.1.3 Regional Volume by Region
- 8.1.4 Regional Revenue by Region
- 8.1.5 Regional Forecast Through 2032
- 8.2 Cross-Regional Segment Analysis
- 8.2.1 By Distribution Channel
- 8.2.2 By Brand/Price Tier
Chapter 9. North America Distributed Solar Power Generation Market
- 9.1 United States
- 9.2 Canada
- 9.3 Mexico
Chapter 10. Europe Distributed Solar Power Generation Market
- 10.1 Germany
- 10.2 France
- 10.3 Italy
- 10.4 United Kingdom
- 10.5 Spain
- 10.6 Poland
- 10.7 Russia
- 10.8 Netherlands
- 10.9 Belgium
- 10.10 Sweden
- 10.11 Denmark
- 10.12 Norway
- 10.13 Rest of Europe
Chapter 11. Asia Pacific Distributed Solar Power Generation Market
- 11.1 China
- 11.2 India
- 11.3 Japan
- 11.4 South Korea
- 11.5 Thailand
- 11.6 Indonesia
- 11.7 Vietnam
- 11.8 Malaysia
- 11.9 Australia
- 11.10 Rest of Asia Pacific
Chapter 12. Latin America Distributed Solar Power Generation Market
- 12.1 Brazil
- 12.2 Argentina
- 12.3 Colombia
- 12.4 Chile
- 12.5 Rest of Latin America
Chapter 13. Middle East Distributed Solar Power Generation Market
- 13.1 Saudi Arabia
- 13.2 United Arab Emirates
- 13.3 Turkey
- 13.4 Israel
- 13.5 Iran
- 13.6 Rest of the Middle East
Chapter 14. Africa Distributed Solar Power Generation Market
- 14.1 South Africa
- 14.2 Egypt
- 14.3 Nigeria
- 14.4 Morocco
- 14.5 Rest of Africa
Chapter 15. Distributed Solar Power Generation Company Profiles
- 15.1 [Company 01]
- 15.1.1 Company Overview
- 15.1.2 Key Management Personnel
- 15.1.3 Products & Services Portfolio
- 15.1.4 Financial Performance
- 15.1.5 Key Market Focus & Geographic Presence
- 15.1.6 Recent Developments & Strategic Initiatives
Note: The company profile list is preliminary and may change based on research findings, market developments, data availability, and client requirements.
Chapter 16. Appendices
- Appendix A – List of Abbreviations & Acronyms
- Appendix B – Industry Classification Code Reference – Full Series
- Appendix C – Production & Capacity Data Tables
- Appendix D – End-Use & Demand Base Tables
- Appendix E – Consumption & Replacement Rate Assumptions
- Appendix F – ASP Reference Tables
- Appendix G – Manufacturing & Facility Database
- Appendix H – Import-Export Data Tables
- Appendix I – Regulatory Summary Tables
- Appendix J – Primary Research Participant List (Anonymized)
- Appendix K – Primary Research Questionnaire Framework
- Appendix L – Data Sources & Bibliography
- Appendix M – Market Size Divergence & Source Comparison
Chapter 17. Research Methodology
- 17.1 Research Framework & Philosophy
- 17.2 Secondary Research – Sources, Hierarchy & Data Extraction
- 17.3 Data Modeling – Bottom-Up & Top-Down Market Sizing
- 17.4 Primary Research – Stakeholder Framework, LOI & Sample Sizes
- 17.5 Forecast Methodology – Regression, Scenario & Sensitivity Analysis
- 17.6 Quality Control – Four-Layer Validation Framework
- 17.7 Limitations & Standard Assumptions
- 17.8 Disclaimer
