
Perovskite modules move from pilot lines to paid orders
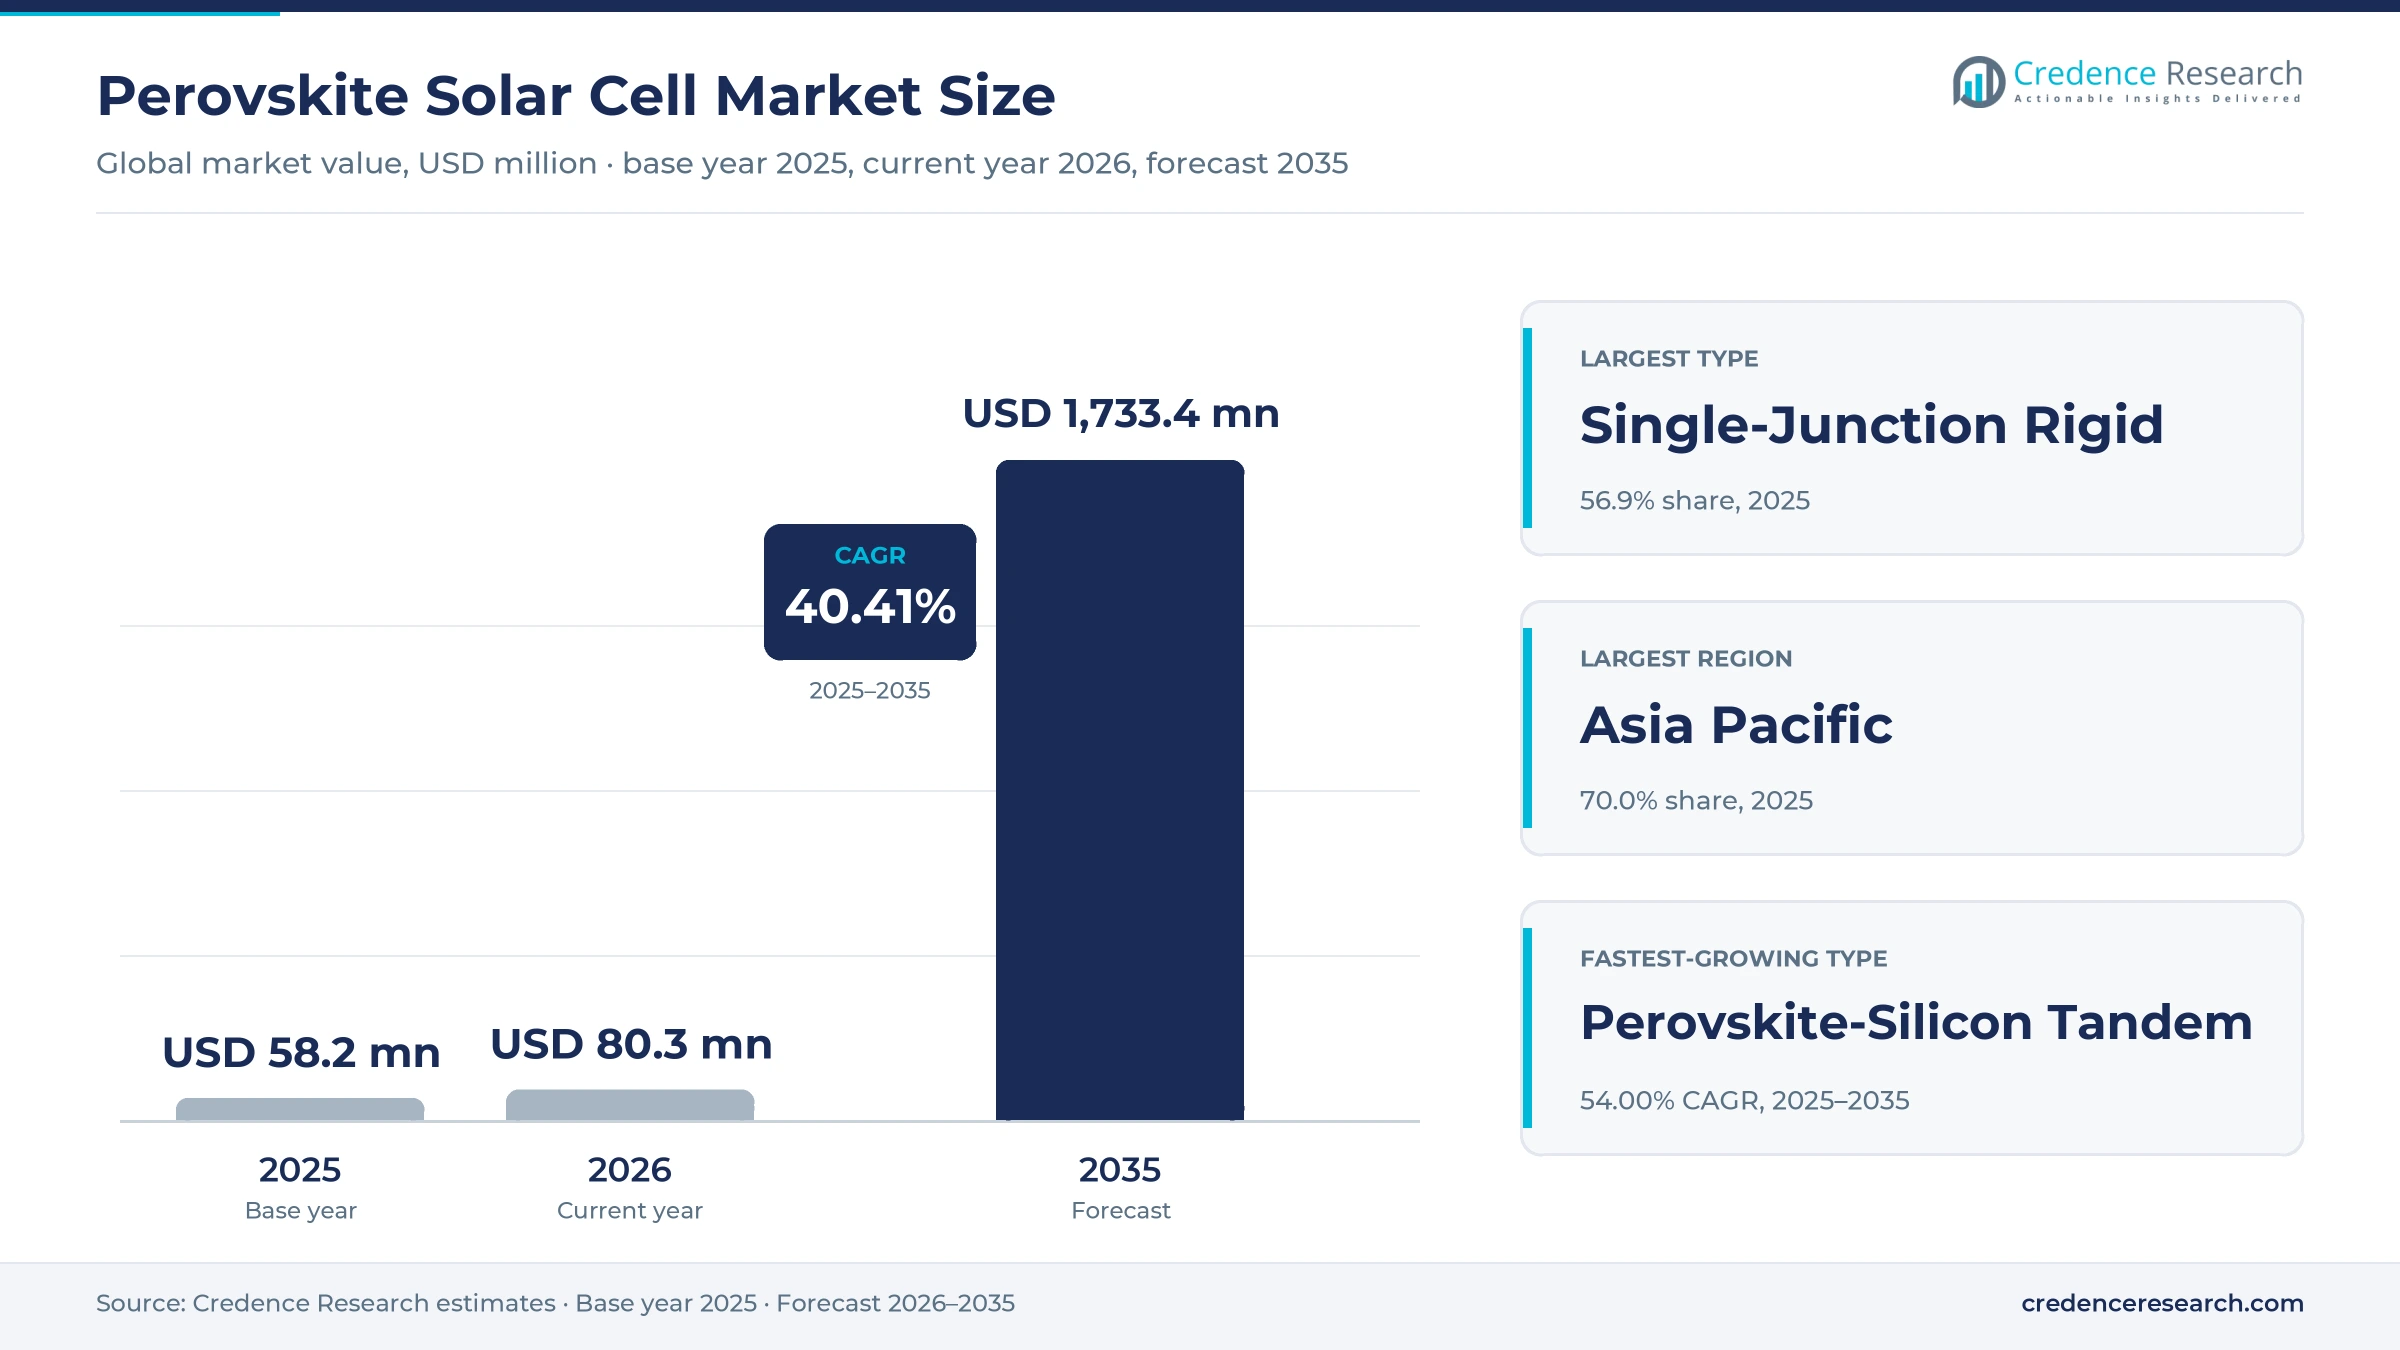
The perovskite solar cell market was valued at USD 58.2 million in 2025 and is projected to increase from USD 80.3 million in 2026 to USD 1.73 billion by 2035, registering a CAGR of 40.41% during 2025–2035. Demand rests on tandem cells that push efficiency beyond the practical limit of silicon, on gigawatt-scale single-junction lines in China, and on lightweight modules for facades, roofs and devices. Asia Pacific held the largest regional share, 70.0% in 2025, because Chinese makers built the first large perovskite lines and Chinese power groups buy for demonstration fields. The main commercial change is certification, as tandem modules passed IEC 61215 stress tests in 2025 and a Chinese utility research institute awarded the first tender requiring certified tandems in March 2026.
What counts as a perovskite product and why sales are still small
The market counts the manufacturer selling value of single-junction perovskite modules, rigid or flexible, and tandem products in which a perovskite top cell sits on silicon, CIGS or another perovskite. It excludes perovskite precursors, transport-layer materials and coating tools, as well as conventional thin-film modules, patent license income and research grants.
Durability, not efficiency, is now the main gate to larger sales. According to the U.S. Department of Energy, small-area perovskite cell efficiency rose from about 3% in 2009 to over 26%, yet the technology is not yet manufactured at scale, and the agency lists four barriers in stability, efficiency at scale, manufacturability and validation and bankability. As a result, most 2025 sales went to demonstration plants, early buyers and building projects at a premium per watt.
Perovskite Solar Cell Market Insights
- The perovskite solar cell market is projected to grow from USD 80.3 million in 2026 to USD 1.73 billion by 2035, a 40.41% CAGR, as certified tandems reach utility tenders.
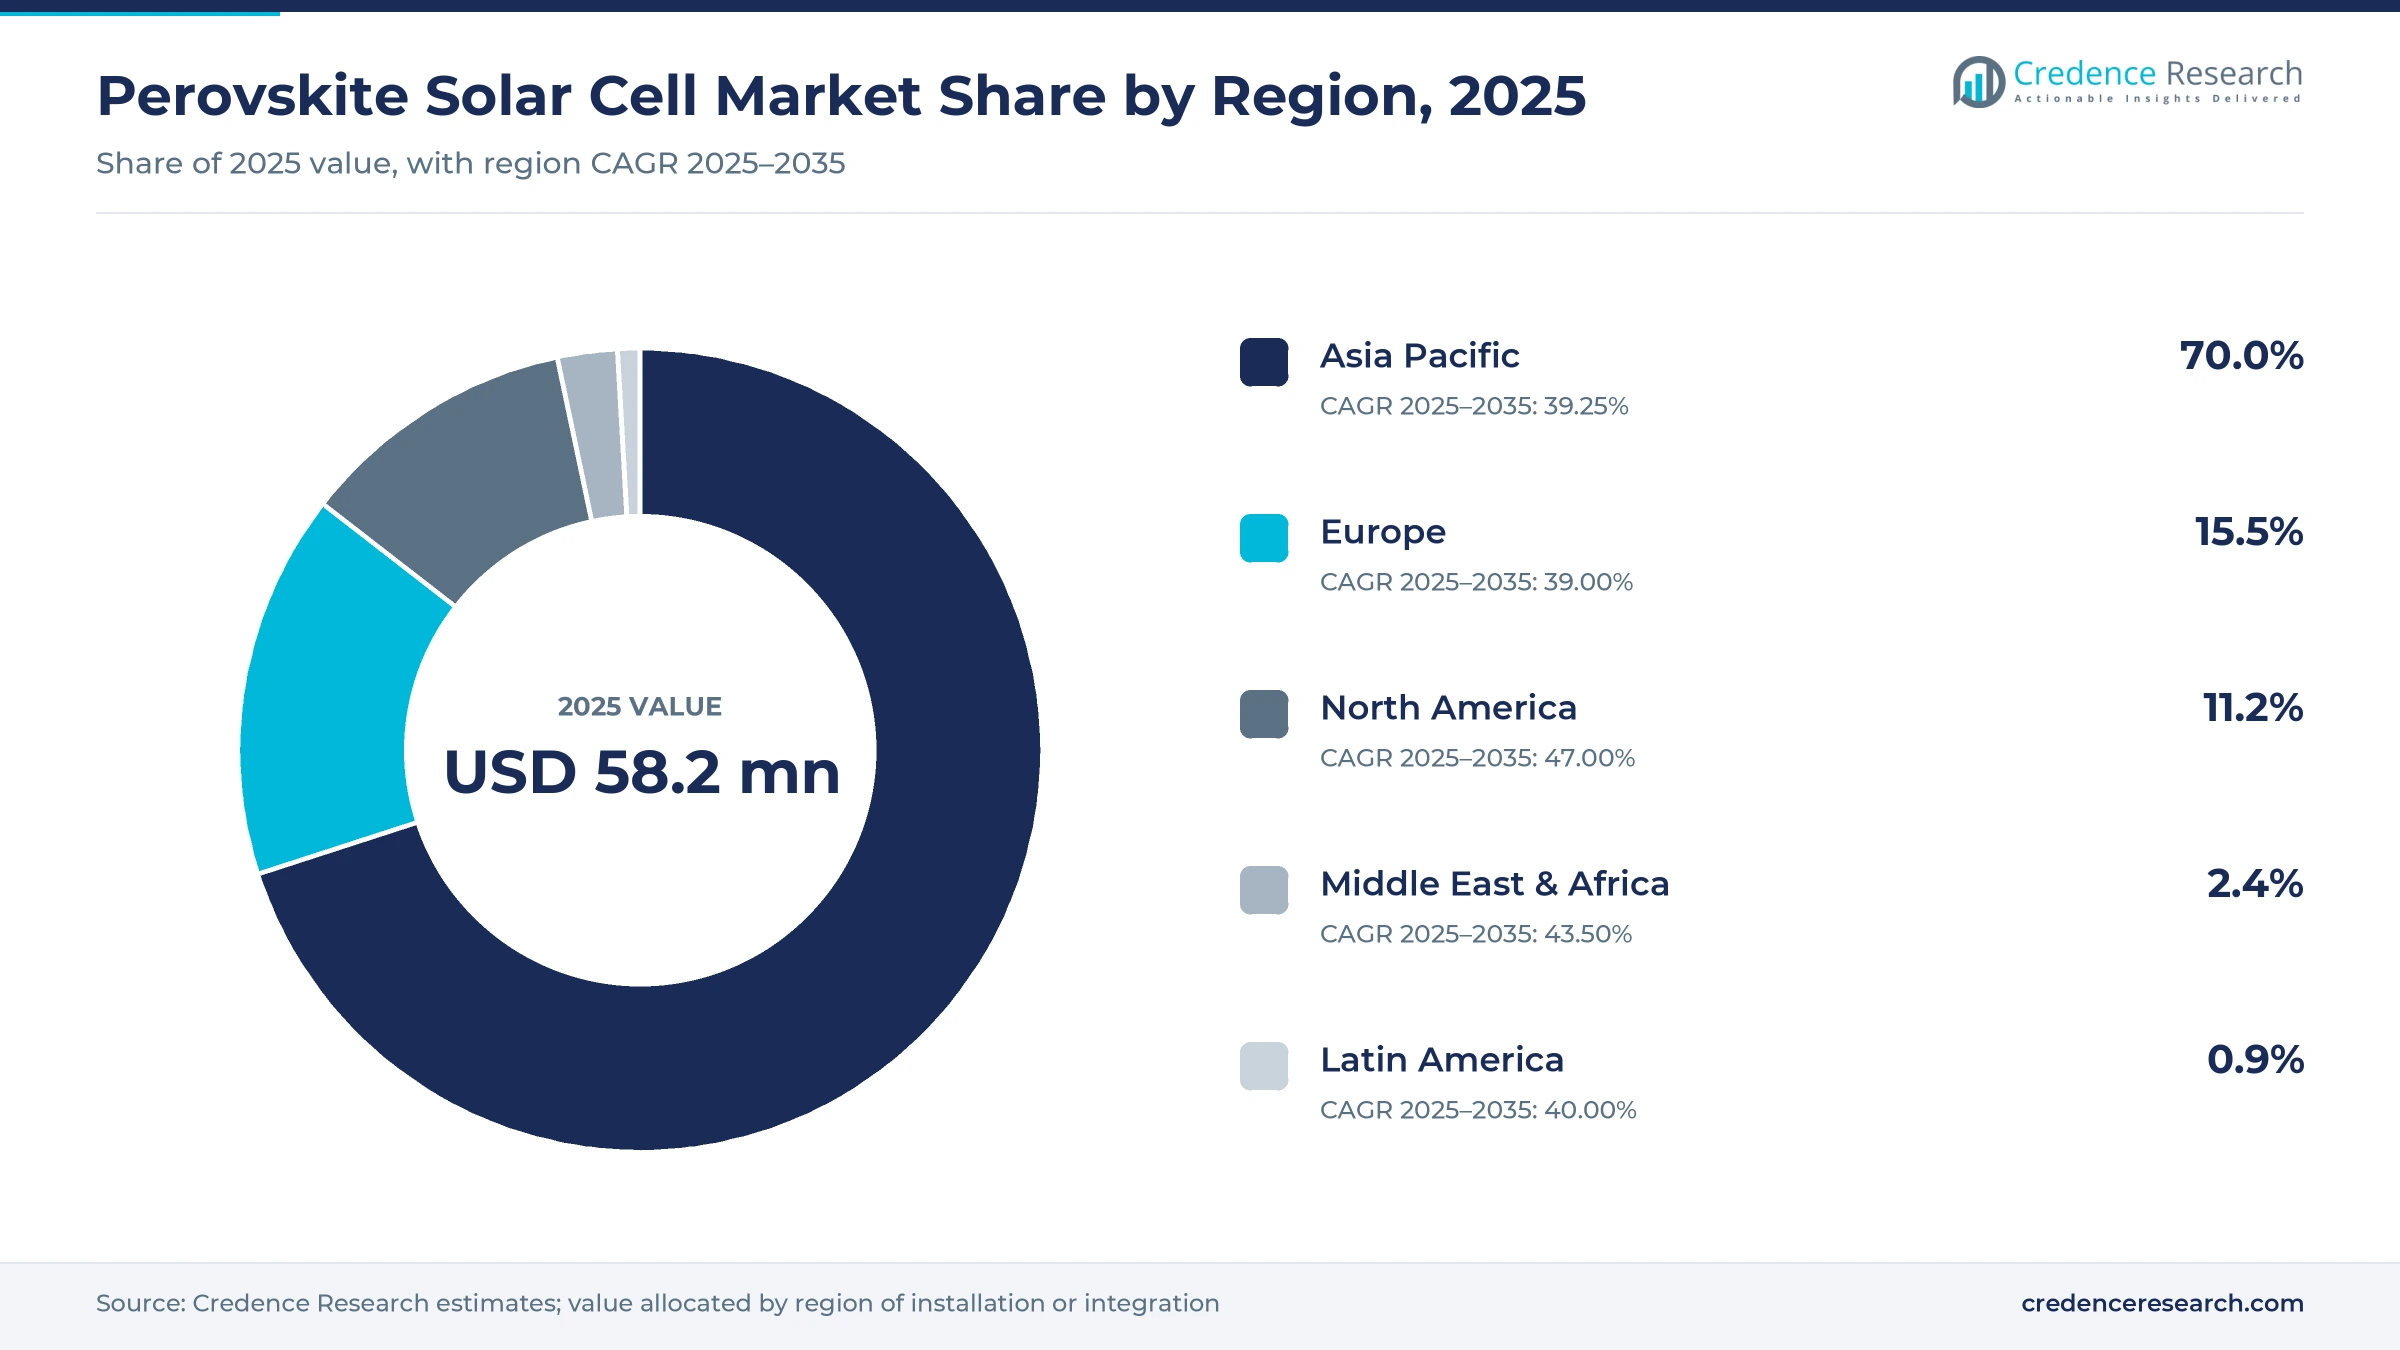
- Asia Pacific held 70.0% of 2025 value, the largest regional share, because Chinese makers run the first gigawatt-scale perovskite lines.
- Single-junction rigid modules accounted for 56.9% of 2025 value, the largest type, because perovskite on glass needs no silicon wafer and scaled first.
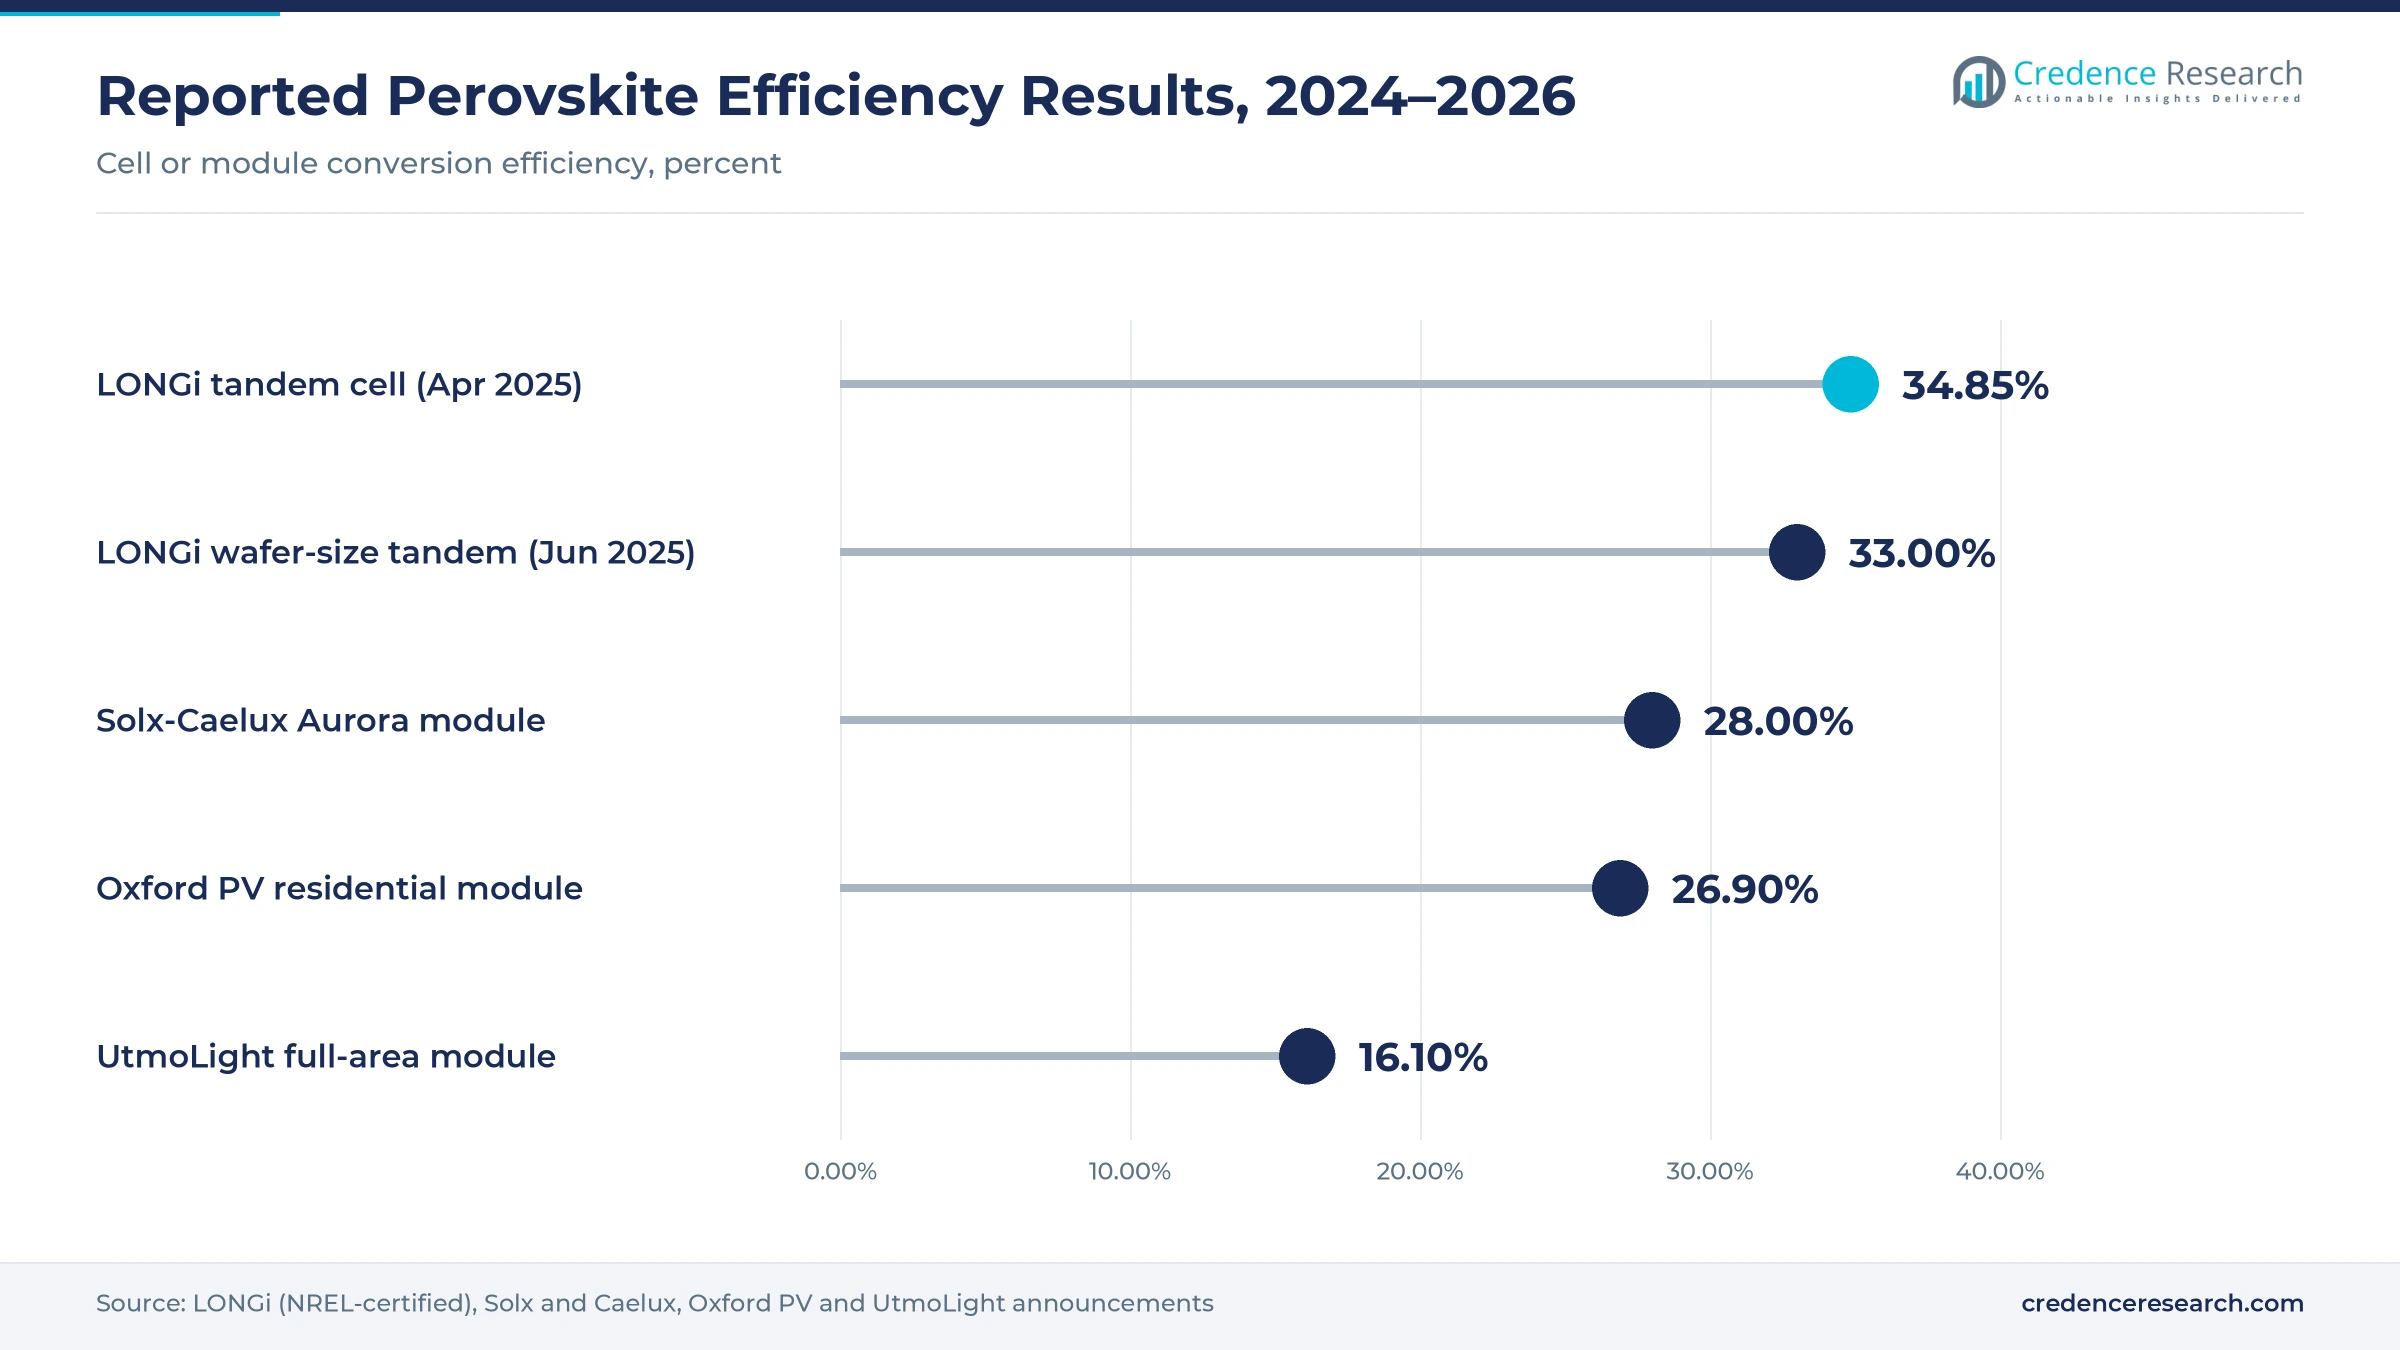
- Silicon majors now treat perovskite as a top-cell upgrade. LONGi reported an NREL-certified 34.85% tandem cell in April 2025, above silicon's practical limit.
- Licensing and partnerships drive investment, from the April 2025 Oxford PV patent license to Trinasolar to the April 2026 Solx and Caelux module partnership.
Rigid single-junction panels lead as tandems grow fastest
Rigid single-junction modules lead by type while perovskite-silicon tandems grow fastest
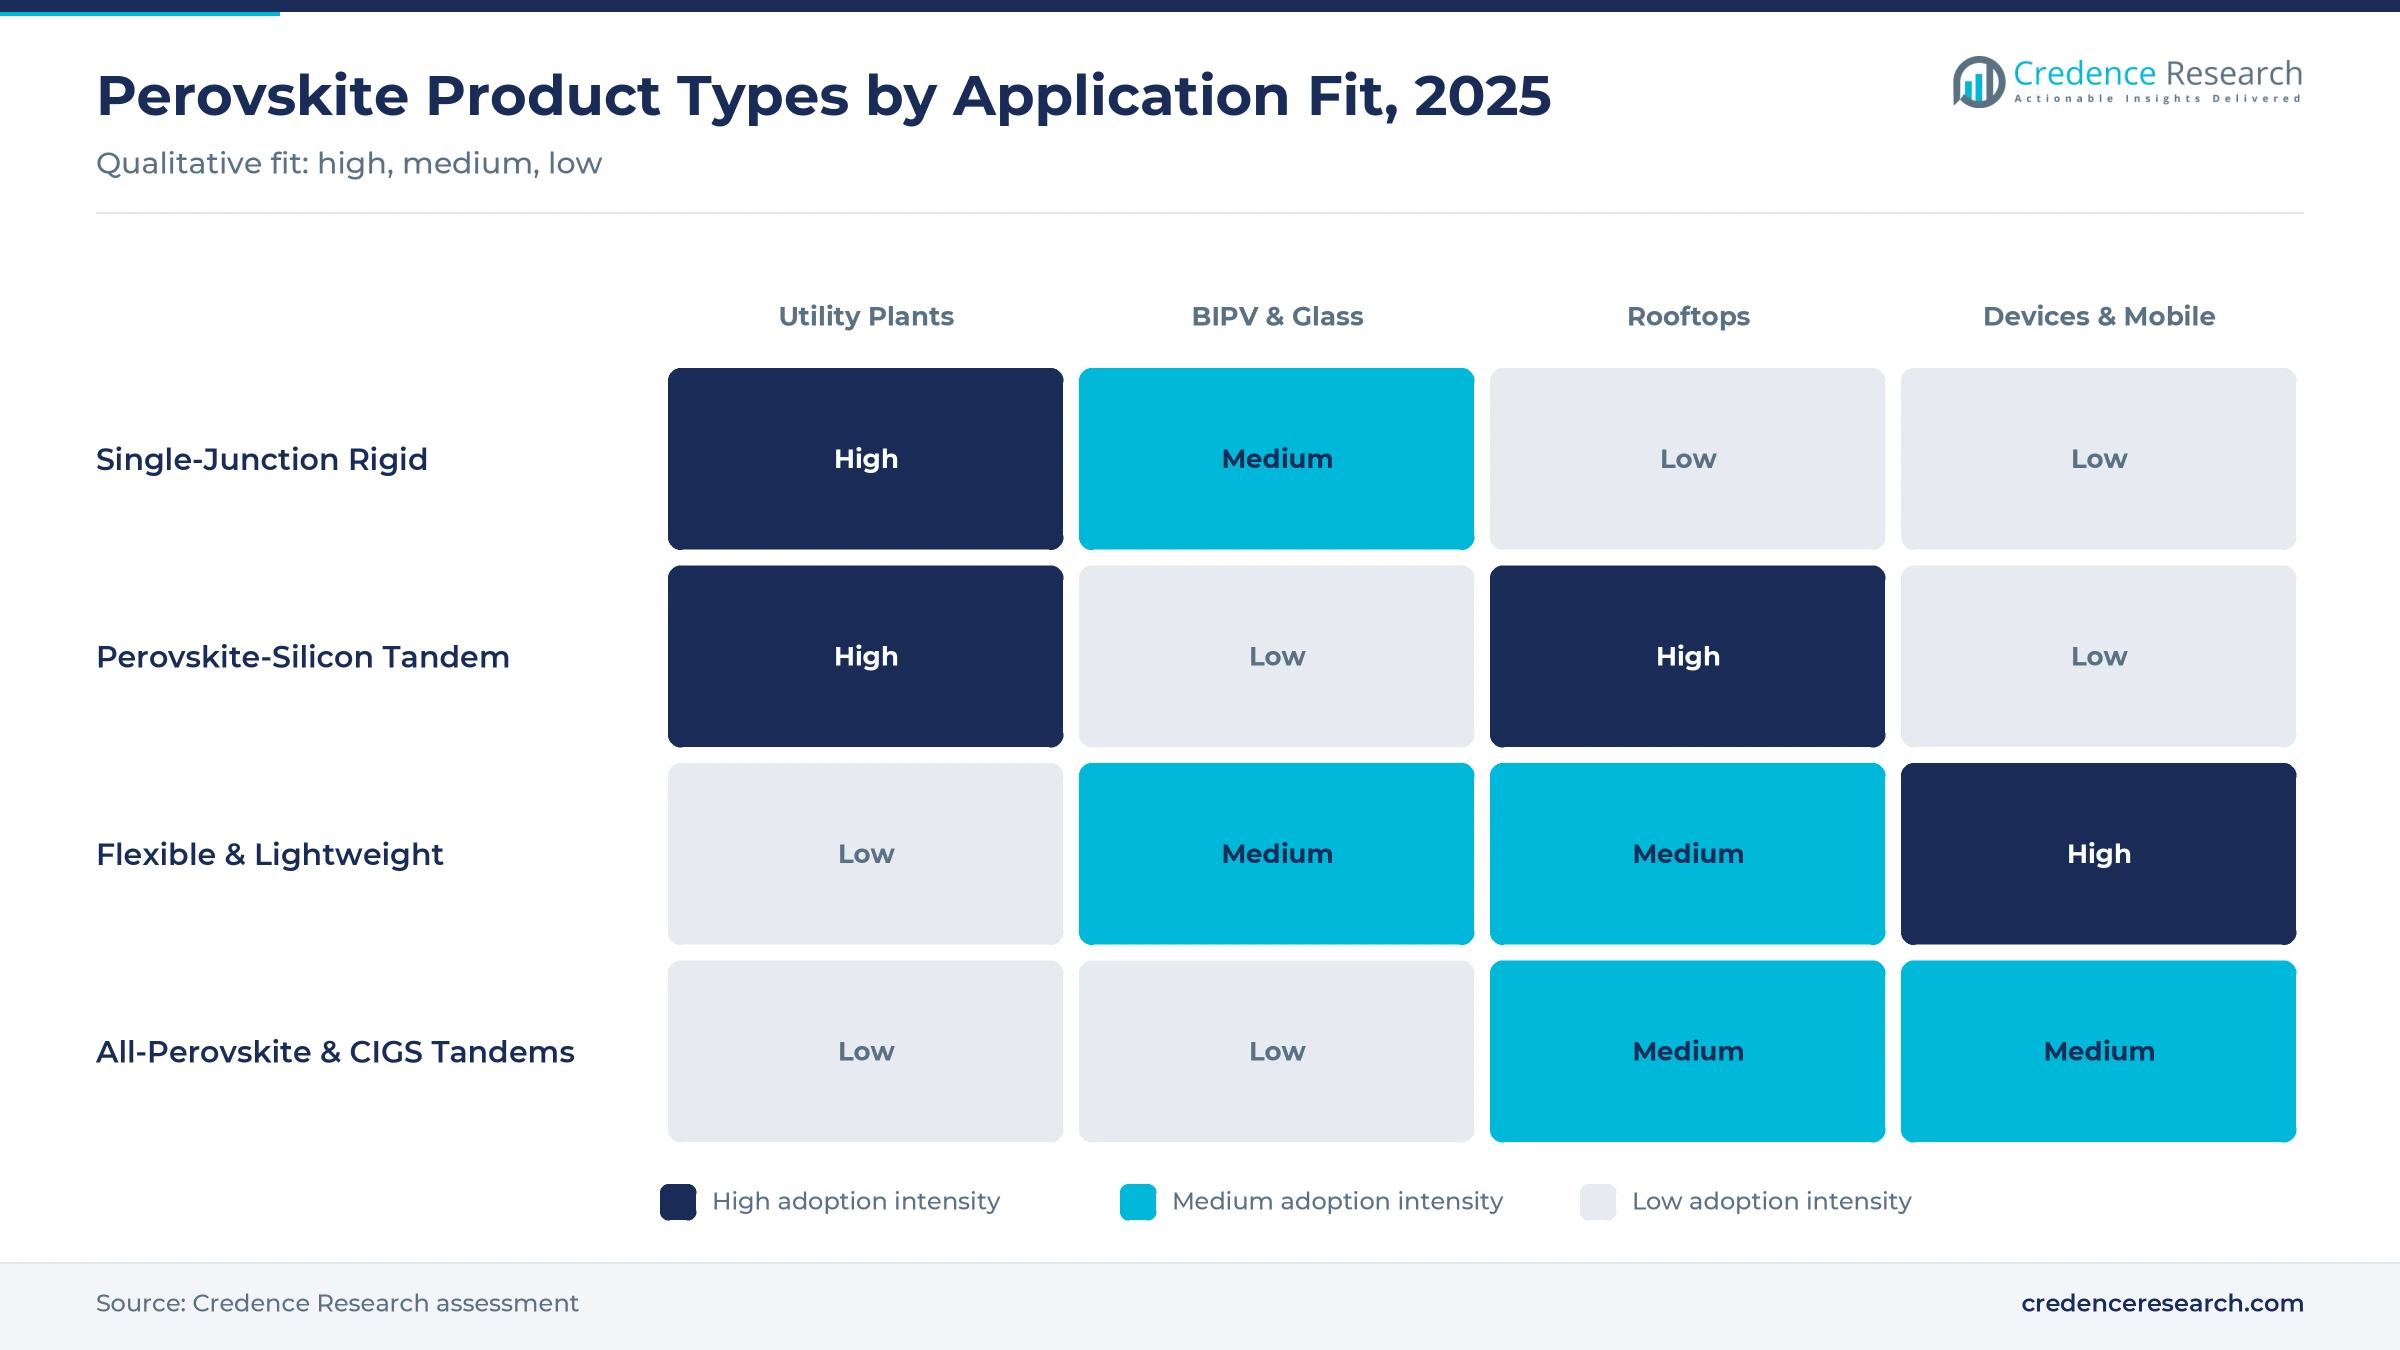
Based on type, the market is categorized into single-junction rigid modules, perovskite-silicon tandems, flexible and lightweight perovskite, and other perovskite tandems such as all-perovskite and perovskite-CIGS stacks. Single-junction rigid modules led with 56.9% of 2025 value, because a perovskite layer on glass needs no silicon wafer and Chinese lines reached commercial output first. Perovskite-silicon tandems grow fastest at 54.00% a year, as certified modules win tenders at the highest value per watt.
Utility plants lead the application mix while commercial and residential rooftops grow fastest
Based on application, the market is categorized into utility-scale solar plants, BIPV and smart glass, commercial and residential rooftops, portable devices and IoT, and vehicles, drones and space. Utility-scale solar plants led with 43.0% of 2025 value, as demonstration fields run by Chinese power groups take most single-junction output. Commercial and residential rooftops grow fastest at 46.50% a year, because roof area is fixed and extra output per square meter matters most there.
| Segment Group | Leading Sub-segment | Share, 2025 | Fastest-growing Sub-segment | CAGR, 2025–2035 |
|---|---|---|---|---|
| By Type | Single-Junction Rigid Modules | 56.9% | Perovskite-Silicon Tandem | 54.00% |
| By Application | Utility-Scale Solar Plants | 43.0% | Commercial & Residential Rooftops | 46.50% |
Request a Free Sample
Fill in your details and we'll send you a free sample report.
- Sample data tables & charts
- Research methodology
Tandem efficiency, Chinese lines and tenders drive orders
Tandem cells push efficiency beyond the practical limit of silicon
Silicon cells in mass production already run close to their practical limit, with a theoretical single-junction ceiling near 29.4%. A perovskite top cell absorbs blue light and passes red light to the silicon below, so the pair can beat that ceiling. LONGi reported an NREL-certified 34.85% tandem cell in April 2025 and a 33% result on a 260.9 cm² wafer-size cell in June 2025. Each extra point cuts land, glass and cabling per watt, which supports fast tandem growth.
Chinese gigawatt-scale lines put single-junction modules into commercial supply
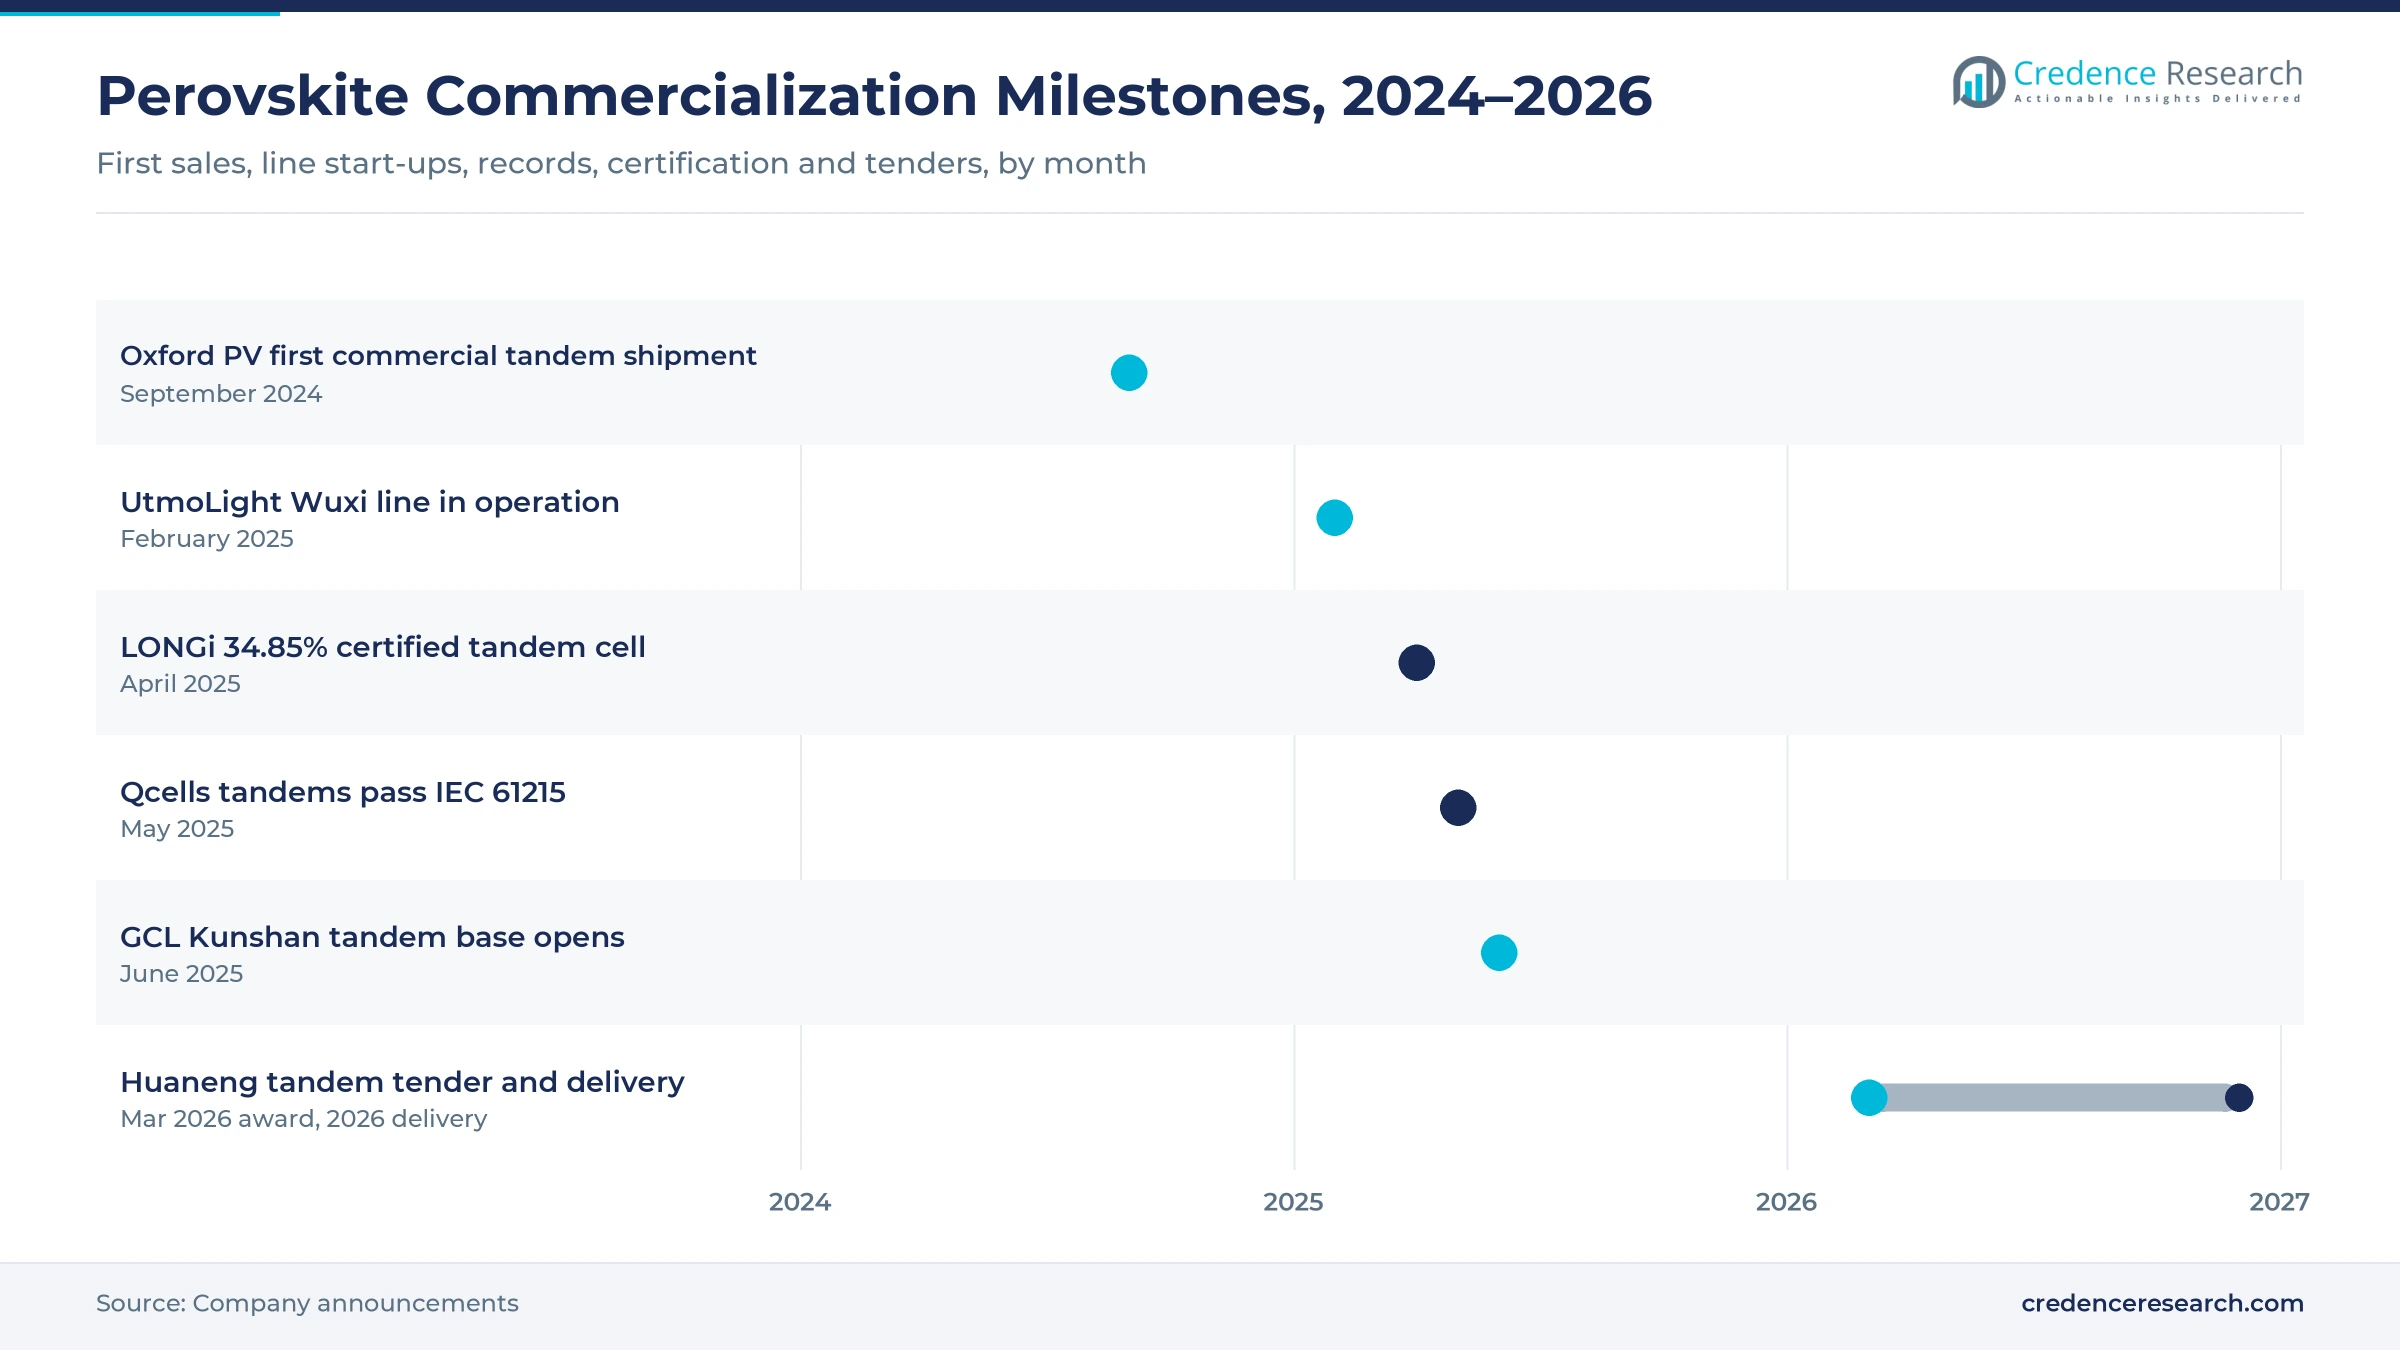
Single-junction perovskite modules can be coated at low temperature onto large glass sheets, and Chinese makers built the first gigawatt-scale lines on that basis. UtmoLight began commercial operation of its line in Wuxi in February 2025, making modules of about 2.8 m² with 16.1% full-area efficiency and a 20% mass-production target. GCL Perovskite opened a gigawatt-scale tandem base in Kunshan in June 2025, which keeps Asia Pacific the largest supply region.
Third-party certification lets utilities write tandems into tenders
In May 2025, Qcells said its full-area M10 tandem modules passed the IEC 61215-2:2021 and UL 61215-2:2021 stress sequence, including 1,000 hours of damp heat and 200 thermal cycles, confirmed by TÜV Rheinland. In March 2026, Huaneng Clean Energy Research Institute named GCL Optoelectronics sole winner of a tender for tandem modules with IEC 61215 and IEC 61730 certification and a 25-year warranty. Other state-owned buyers can now follow that template in their own tenders, so certification turns tandem modules from test-field products into items that utilities can order.
Lightweight and semi-transparent modules reach facades, roofs and devices
Perovskite layers can be coated onto film and colored or semi-transparent glass, which suits facades, skylights, carports and roofs that cannot carry heavy glass panels. In those uses, building owners pay for appearance as well as output. Flexible film also powers sensors, shelf labels and wearables indoors, where perovskites convert artificial light well. Demand from these niches builds over 5 to 10 years as building codes and device makers qualify the products.
Silicon makers add perovskite top cells as licensing spreads
Silicon majors shift to treating perovskite as an upgrade, not a rival
LONGi, Trina Solar, JinkoSolar and Qcells all run tandem programs on standard M10 or larger wafers, so tandems become an upgrade path for existing cell plants. Makers now publish results at commercial sizes, from LONGi's 260.9 cm² cell to Qcells' full-area M10 modules. Credence Research expects the tandem share of value to pass the single-junction share before 2030, which shifts revenue toward groups with established silicon capacity and bankable balance sheets over the next five years.
Patent licensing increasingly replaces building every factory
Oxford PV and Trinasolar signed an exclusive perovskite patent license for China in April 2025, with a right for Trinasolar to sublicense. Patent holders gain reach into the largest PV supply base, and large module makers gain freedom to operate. Because the patent estate around perovskite compositions and interfaces is dense, more deals of this kind are likely through 2030, letting smaller European and U.S. innovators earn returns without funding gigawatt-scale plants of their own.
Four-terminal glass and domestic supply open an opportunity with U.S. buyers
In April 2026, Solx and Caelux announced a 5-year partnership to make Aurora modules with Caelux Active Glass in Aguadilla, Puerto Rico, at 28% module efficiency, aiming for commercial volumes in 2027. Tandem PV announced plans for a commercial-scale U.S. plant in March 2025, and Swift Solar is developing tandems for U.S. production. Domestic-content rules help make North America the fastest-growing region, favoring suppliers that can integrate into existing lines.
Space-limited rooftops and high-value mobile uses offer an opportunity
Rooftops offer the clearest near-term opening for premium modules, and Oxford PV launched a residential tandem module in 2024 and set a 26.9% residential module record in June 2024. Light, flexible cells with high power per kilogram also suit drones, vehicle roofs and small satellites, where high prices per watt let small volumes carry meaningful value.
Field life, lead content and cheap silicon slow adoption
No product yet has 25 years of field data
Passing IEC 61215 shows a module survives a fixed set of stress tests, not that it will hold output for decades. Perovskites react to moisture, heat and ultraviolet light, and some degrade in ways that standard silicon tests were not written to catch. Lenders therefore price perovskite projects with extra risk, which keeps most early volume in demonstration plants. Makers mitigate the gap with outdoor test fields, shared test methods and warranties backed by large groups or insurers.
Lead content limits consumer uses and raises recycling questions
Most high-efficiency perovskites contain a small amount of lead, and that matters under EU product rules. The EU RoHS Directive caps lead at 0.1% by weight in each homogeneous material but excludes photovoltaic panels installed by professionals for permanent use at a defined location. Cells built into consumer devices get no such exemption, which limits lead-based perovskites in that niche. Building owners and public buyers also ask about end-of-life recycling, so makers with take-back routes and leakage tests win facade work first.
Cheap silicon modules squeeze the perovskite price premium
Silicon module prices fell hard through 2024 and 2025, so a tandem panel must earn its premium through extra output per square meter. On cheap, flat sites with low land costs that case is weak, while on rooftops and land-constrained markets it is strong. Single-junction rigid modules face the hardest pressure because they compete head-on with low-cost crystalline silicon solar PV products. Suppliers respond by targeting high-value surfaces and pairing perovskite with silicon rather than replacing it.
Start-up warranties lack the balance sheets lenders expect
Start-ups selling 25-year warranties have short balance-sheet histories, and insurers and independent engineers want warranty backing from a large group or an insurer. That favors tandem programs inside large silicon makers and partnerships such as Solx with Caelux. The risk delays project finance for smaller suppliers and pushes them toward licensing, joint ventures or supply deals with established module brands that can carry 25-year obligations on their own books for decades.
China-led Asia Pacific leads as North America grows fastest
| Region | Share, 2025 | CAGR, 2025–2035 |
|---|---|---|
| Asia Pacific | 70.0% | 39.25% |
| Europe | 15.5% | 39.00% |
| North America | 11.2% | 47.00% |
| Middle East & Africa | 2.4% | 43.50% |
| Latin America | 0.9% | 40.00% |
Asia Pacific relies on Chinese lines and utility test fields to anchor supply
Asia Pacific held 70.0% of 2025 value and grows at 39.25% a year. China hosts the UtmoLight, Microquanta, GCL and Renshine lines and the tandem programs of LONGi, Trina Solar and JinkoSolar. Microquanta modules powered an agrivoltaic plant in Songyang, Zhejiang, connected in December 2024. Japan adds flexible perovskite film for buildings, and South Korea adds Qcells research capacity. Chinese state-owned power groups remain the largest early buyers through their demonstration fields.
Europe builds on tandem factories in Germany and facade projects
Europe held 15.5% of 2025 value and grows at 39.00% a year. Oxford PV makes tandem modules in Brandenburg an der Havel, Germany and Qcells runs its tandem pilot line in Bitterfeld-Wolfen. Facade and BIPV projects add demand in Germany, Poland and the Netherlands, where building owners value colored and semi-transparent glass. The EU exemption for professionally installed panels keeps lead rules from blocking power uses, though recycling expectations are higher than elsewhere.
North America grows fastest on domestic-content policy
North America held 11.2% of 2025 value and is the fastest-growing region at 47.00% a year. Oxford PV shipped its first commercial tandem modules to a U.S. utility-scale customer in September 2024. Caelux, Swift Solar and Tandem PV are building domestic supply, and the Solx partnership in Puerto Rico targets commercial volumes in 2027. U.S. buyers that favor domestic content can pair these products with cells made at home, which supports premium pricing.
Middle East & Africa uses Gulf test fields to probe heat tolerance
The Middle East & Africa held 2.4% of 2025 value and grows at 43.50% a year. Hot, sunny Gulf sites test perovskite heat tolerance, and Gulf utilities run outdoor test fields for new module types.
Latin America runs pilot projects in Brazil, Chile and Mexico
Latin America held 0.9% of 2025 value and grows at 40.00% a year. Demand comes from pilot projects in Brazil, Chile and Mexico and should rise as tandem modules reach the price lists of large silicon suppliers.
Tenders, IEC passes and patent licensing mark 2025–2026
| Development | Status and market relevance |
|---|---|
| In April 2026, Solx and Caelux announced a five-year partnership to make Aurora tandem modules with Caelux Active Glass in Aguadilla, Puerto Rico. | Announced. Creates a domestic U.S. route for four-terminal tandems, with volumes targeted for 2027. |
| In March 2026, Huaneng Clean Energy Research Institute named GCL Optoelectronics sole winner of a tender for IEC 61215 and IEC 61730 certified tandem modules. | Awarded. First commercial tandem order from a Chinese utility group, for delivery in 2026. |
| In June 2025, GCL Perovskite opened its gigawatt-scale tandem module base in Kunshan. | Operating. Brings tandem production to industrial scale in China. |
| In May 2025, Qcells announced that its M10 tandem modules passed IEC 61215-2:2021 and UL 61215-2:2021 stress tests. | Certified. Gives buyers third-party durability evidence for tandems. |
| In April 2025, Oxford PV and Trinasolar signed an exclusive perovskite patent license for China. | Signed. Opens the largest PV supply base to licensed tandem production. |
Tandems, stability tests and coated glass shape the roadmap
- Wafer-size tandems show record efficiency at commercial sizes, with two-terminal tandems on M10 and larger wafers such as LONGi's 33% result on 260.9 cm².
- Stability testing under IEC 61215 and IEC 61730 sequences, plus outdoor fields, builds the durability record that lenders and insurers require.
- Four-terminal glass with perovskite coated on module top glass, as in Caelux Active Glass, trades some efficiency for easy integration into existing silicon lines.
- Flexible film carrying perovskite serves roofs that cannot carry glass, indoor sensors and power-per-kilogram uses such as drones and satellites.
- Encapsulation and recycling work together, as barrier layers hold lead in place and take-back routes address end-of-life questions from building and public buyers.
Need a Custom Version of This Report?
Tailor the scope, geography, or segments to your exact requirements.
- Custom geography or segment scope
- Direct access to our analyst team
Specialists, silicon majors and start-ups chase bankability
Supply of perovskite modules sits with three distinct groups of firms. Chinese perovskite specialists, including UtmoLight, Microquanta, GCL Perovskite and Renshine, run the first large lines for single-junction modules and sell to demonstration plants. Large silicon makers, including LONGi, Qcells, Trina Solar and JinkoSolar, develop tandems on their own wafers as an upgrade path for existing cell plants. Smaller firms in Europe and the U.S., such as Oxford PV, Caelux, Swift Solar and Tandem PV, hold patents and build focused tandem or perovskite-glass lines. Credence Research estimates that the 5 largest suppliers hold more than half of 2025 value, because few firms sell at commercial volume. Concentration should fall as silicon majors launch tandems after 2027, but patent control and certification history will keep early leaders ahead.
Perovskite module makers and their roles
| Company | Type | Role in the market |
|---|---|---|
| UtmoLight | Perovskite specialist | Gigawatt-scale single-junction line in Wuxi, commercial since February 2025 |
| Microquanta | Perovskite specialist | Rigid modules; supplied the Songyang agrivoltaic plant |
| GCL Perovskite | Perovskite specialist | Kunshan tandem base opened June 2025; group unit won the Huaneng tender |
| Renshine | Perovskite specialist | Perovskite production line in China; product scope not confirmed |
| Oxford PV | Tandem specialist | Tandem modules made in Germany; patent license to Trinasolar for China |
| LONGi | Silicon major | NREL-certified 34.85% tandem cell and 33% wafer-size result |
| Qcells | Silicon major | IEC 61215-tested M10 tandem modules; pilot line in Bitterfeld-Wolfen |
| Trina Solar | Silicon major | Tandem program; Oxford PV licensee in China |
| JinkoSolar | Silicon major | Tandem development program |
| Caelux | U.S. start-up | Active Glass for four-terminal tandems; Solx partnership |
| Swift Solar | U.S. start-up | Perovskite tandems for U.S. production |
| Tandem PV | U.S. start-up | Plans for a commercial-scale U.S. plant |
Perovskites win as a silicon upgrade before they win alone
Credence Research's view is that perovskites will earn most of their revenue as a top-cell upgrade to silicon before single-junction products win large markets on their own. The decisive factor is bankability, which rests on certification, warranties backed by large balance sheets and outdoor data. The largest new revenue lies in certified tandems for utility tenders and space-limited rooftops. The main risk is degradation in the field that standard tests miss. Investors should watch Chinese tender rules, tandem launches by silicon majors and U.S. domestic production.
Shipments, watt prices and line capacity behind the estimate
The report uses 2025 as the base year and forecasts to 2035, with CAGR calculated over 2025–2035. Market values come from Credence Research's market model, built from estimated shipments of each product type and a selling price per watt, and checked against what known makers could have sold from their lines, while segment and regional splits are Credence Research estimates. Supporting evidence comes from company announcements, certification results, U.S. Department of Energy program information and EU legislation.
Certified tandems move from test fields to tenders by 2035
Through 2035, perovskite solar cell revenue will shift from single-junction demonstration modules toward certified perovskite-silicon tandems sold by large module brands. Asia Pacific will remain the largest region, while North America grows fastest on domestic supply. Rooftops, facades and mobile uses will pay the highest prices per watt. Investment will flow to wafer-size tandem lines, encapsulation and outdoor testing. The pace will depend on field durability, silicon prices and how quickly more utilities write certified tandems into tender rules and lenders accept the risk.
Frequently Asked Questions
What was the size of the perovskite solar cell market in 2025?
What is the forecast value and CAGR of the perovskite solar cell market?
Why is the perovskite solar cell market still small?
Which type of perovskite product holds the largest share?
Which region leads the perovskite solar cell market?
What is the record efficiency for a perovskite-silicon tandem cell?
Who are the major companies in the perovskite solar cell market?
What challenges could slow the perovskite solar cell market?
Table of Content
Chapter 1 Market Segmentation
- 1.1 Segmentation Framework
- 1.1.1 Product and Service Classification
- 1.1.2 Application and End-Use Classification
- 1.1.3 Technology and Solution Classification
- 1.1.4 Customer and Distribution Channel Classification
- 1.1.5 Geographic Segmentation
- 1.1.6 Market Segment Definitions and Boundaries
- 1.2 By Type
- 1.2.1 Single-Junction Rigid Modules
- 1.2.2 Perovskite-Silicon Tandem
- 1.2.3 Flexible & Lightweight Perovskite
- 1.2.4 Other Perovskite Tandems
- 1.3 By Application
- 1.3.1 Utility-Scale Solar Plants
- 1.3.2 BIPV & Smart Glass
- 1.3.3 Commercial & Residential Rooftops
- 1.3.4 Portable Devices & IoT
- 1.3.5 Vehicles, Drones & Space
Chapter 2 Introduction
- 2.1 Report Objectives and Scope
- 2.2 Product Definition and Industry Terminology
- 2.3 Market Inclusions and Exclusions
- 2.4 Research Process
- 2.4.1 Primary Research and Expert Interviews
- 2.4.2 Secondary Research and Source Review
- 2.4.3 Top-Down and Bottom-Up Estimation
- 2.4.4 Data Triangulation and Verification
- 2.5 Market Size Measurement Basis
- 2.5.1 2025: USD 58.2 million → 2035: USD 1.73 billion
- 2.6 Historical and Forecast Reference Periods
- 2.6.1 Historical Period: 2018-2025
- 2.6.2 Base Year: 2025
- 2.6.3 Forecast Period: 2025-2035
- 2.7 Research Assumptions and Limitations
Chapter 3 Executive Summary
- 3.1 Market Snapshot and Key Findings
- 3.2 Base-Year Market Size, 2025
- 3.3 Forecast Market Size, 2035
- 3.4 Revenue and Volume Growth Outlook
- 3.5 Key Demand and Supply Indicators
- 3.6 Leading Market Segments
- 3.7 Fastest-Growing Market Opportunities
- 3.8 Regional Performance Highlights
- 3.9 Technology and Industry Transformation
- 3.10 Competitive Landscape Summary
- 3.11 Analyst View and Strategic Implications
Chapter 4 Global Perovskite Solar Cell Market Trends and Developments
- 4.1 Historical Industry Development, 2018-2025
- 4.2 Recent Market Trends and Developments
- 4.3 Demand and Customer Behavior Trends
- 4.4 Technology and Product Innovation
- 4.5 Artificial Intelligence, Automation and Digitalization
- 4.6 Local Manufacturing and Supply Chain Realignment
- 4.7 Industry Partnerships, Mergers and Acquisitions
- 4.8 Sustainability and Circular Economy Developments
- 4.9 Government and Private Sector Investment Trends
- 4.10 Emerging Business Models and Commercialization
- 4.11 Industry Developments and Announcements
Chapter 5 Global Perovskite Solar Cell Market Production, Supply and Demand Analysis
- 5.1 Demand Trend and Consumption Analysis, 2018-2025
- 5.2 Demand Forecast, 2025-2035
- 5.3 Production and Output Trend, 2018-2025
- 5.4 Production and Output Forecast, 2025-2035
- 5.5 Installed Capacity and Capacity Utilization
- 5.6 Company-Wise Production Plants and Statistics
- 5.6.1 Installed Production Capacity
- 5.6.2 Actual Production
- 5.6.3 Planned Capacity and Expansion Targets
- 5.7 Supply Chain Structure and Procurement Trends
- 5.8 Supply-Demand Gap and Bottlenecks
- 5.9 Import Dependence and Sourcing Structure
- 5.10 Contract Manufacturing and Outsourcing
- 5.11 Regional Supply and Demand Concentration
Chapter 6 Global Perovskite Solar Cell Market Pricing Analysis
- 6.1 Pricing Structure and Measurement
- 6.2 Historical Pricing Trends, 2018-2025
- 6.3 Pricing Outlook, 2025-2035
- 6.4 Average Selling Price and Unit Economics
- 6.5 Pricing by Product and Market Segment
- 6.6 Geographic Pricing Differences
- 6.7 Key Input, Energy, Labor and Logistics Costs
- 6.8 Contract Pricing and Purchasing Models
- 6.9 Pricing Sensitivity and Competitive Positioning
- 6.10 Price, Margin and Profitability Implications
Chapter 7 Global Perovskite Solar Cell Market Dynamics
- 7.1 Market Growth Drivers
- 7.1.1 Demand-Side Drivers
- 7.1.2 Technology and Innovation Drivers
- 7.1.3 Infrastructure and Investment Drivers
- 7.1.4 Regulatory and Policy Drivers
- 7.2 Market Restraints
- 7.2.1 Cost and Affordability Constraints
- 7.2.2 Technology and Adoption Barriers
- 7.2.3 Supply Chain and Operational Constraints
- 7.3 Market Challenges
- 7.3.1 Competitive Pressure and Margin Erosion
- 7.3.2 Skills, Infrastructure and Implementation Gaps
- 7.4 Emerging Market Opportunities
- 7.5 Market Dynamics Impact and Time-Horizon Assessment
Chapter 8 Global Perovskite Solar Cell Value Chain Analysis
- 8.1 Industry Value Chain Overview
- 8.2 Upstream Suppliers and Critical Inputs
- 8.3 Technology and Component Providers
- 8.4 Manufacturing or Service Delivery
- 8.5 Distribution, Channel Partners and Integrators
- 8.6 Downstream Applications and End Users
- 8.7 Value Addition and Profit Pools
- 8.8 Vertical Integration and Outsourcing
- 8.9 Supplier Concentration and Risk
- 8.10 Supply Chain Localization and Resilience
Chapter 9 Global Perovskite Solar Cell Market Regulations and Policies
- 9.1 Relevant Laws, Standards and Compliance Frameworks
- 9.2 Product, Service, Safety and Quality Requirements
- 9.3 Government Policies, Incentives and Subsidies
- 9.4 Imports, Exports and Trade Barriers
- 9.5 Public Procurement and Local Content Requirements
- 9.6 Environmental and Sustainability Compliance
- 9.7 Upcoming Policy Changes and Market Implications
Chapter 10 Global Perovskite Solar Cell Market Hotspots and Opportunities
- 10.1 Market Opportunity Mapping and Growth Hotspots
- 10.2 High-Growth Applications and Customer Groups
- 10.3 Underserved Markets and White-Space Opportunities
- 10.4 Emerging Technology and Product Opportunities
- 10.5 New Capacity and Investment Hotspots
- 10.6 Market Entry and Expansion Opportunities
- 10.7 Distribution and Partnership Opportunities
- 10.8 Near-Term and Long-Term Commercial Potential
- 10.9 Opportunity Attractiveness and Execution Risks
Chapter 11 Global Perovskite Solar Cell Market Outlook, 2025-2035
- 11.1 Market Size and Analysis
- 11.1.1 Revenue (Market Measurement: 2025: USD 58.2 million → 2035: USD 1.73 billion)
- 11.1.2 Market Volume and Quantity Sold
- 11.1.3 Historical Market Size, 2018-2025
- 11.1.4 Base-Year Market Size, 2025
- 11.2 Market Forecast, 2025-2035
- 11.2.1 Revenue Forecast to 2035
- 11.2.2 Volume Forecast to 2035
- 11.2.3 CAGR and Year-on-Year Growth
- 11.2.4 Incremental Revenue Opportunity
- 11.3 Forecast Assumptions and Scenario Analysis
- 11.3.1 Base-Case Forecast
- 11.3.2 Optimistic and Conservative Scenarios
- 11.3.3 Technology, Pricing and Policy Sensitivities
- 11.4 Market Attractiveness and Growth Outlook
Chapter 12 Global Perovskite Solar Cell Market Segmentation and Outlook
- 12.1 Segmentation Summary and Market Shares, 2025
- 12.2 Largest and Fastest-Growing Segments
- 12.3 By Type - Market Size and Forecast, 2025-2035
- 12.3.1 Segment Definition and Scope
- 12.3.2 Historical Market Size, 2018-2025
- 12.3.3 Revenue Forecast, 2025-2035
- 12.3.4 Volume Forecast, 2025-2035
- 12.3.5 Base-Year Market Share, 2025
- 12.3.6 Segment CAGR and Growth Drivers
- 12.3.7 Subsegment Market Size and Forecast
- 12.3.7.1 Single-Junction Rigid Modules
- 12.3.7.2 Perovskite-Silicon Tandem
- 12.3.7.3 Flexible & Lightweight Perovskite
- 12.3.7.4 Other Perovskite Tandems
- 12.3.8 Subsegment Pricing and Adoption Trends
- 12.3.9 Leading Suppliers and Competition
- 12.3.10 Regional Demand and Opportunities
- 12.4 By Application - Market Size and Forecast, 2025-2035
- 12.4.1 Segment Definition and Scope
- 12.4.2 Historical Market Size, 2018-2025
- 12.4.3 Revenue Forecast, 2025-2035
- 12.4.4 Volume Forecast, 2025-2035
- 12.4.5 Base-Year Market Share, 2025
- 12.4.6 Segment CAGR and Growth Drivers
- 12.4.7 Subsegment Market Size and Forecast
- 12.4.7.1 Utility-Scale Solar Plants
- 12.4.7.2 BIPV & Smart Glass
- 12.4.7.3 Commercial & Residential Rooftops
- 12.4.7.4 Portable Devices & IoT
- 12.4.7.5 Vehicles, Drones & Space
- 12.4.8 Subsegment Pricing and Adoption Trends
- 12.4.9 Leading Suppliers and Competition
- 12.4.10 Regional Demand and Opportunities
- 12.5 Segment Growth Comparison
- 12.6 Segment Attractiveness and Priority Matrix
Chapter 13 Global Perovskite Solar Cell End-Use and Application Market Outlook
- 13.1 End-Use Industry and Customer Demand Structure
- 13.2 Leading Applications and Customer Groups
- 13.3 End-Use Market Size, Share and Forecast
- 13.4 Major End-Use Industry Deep Dives
- 13.4.1 Customer Requirements and Use Cases
- 13.4.2 Demand and Replacement Cycles
- 13.4.3 Technical and Regulatory Considerations
- 13.4.4 Purchasing and Procurement Models
- 13.4.5 Leading Vendors and Distribution Channels
- 13.4.6 Forecast and Commercial Opportunities
- 13.5 Emerging Applications and Cross-Segment Demand
- 13.6 End-Use Industry Investment Priorities
Chapter 14 Global Perovskite Solar Cell Geographic Market Outlook, 2025-2035
- 14.1 Regional Market Size and Share, 2025
- 14.2 Regional Market Forecast, 2025-2035
- 14.3 Regional Pricing, Production and Demand Differences
- 14.4 North America
- 14.4.1 United States
- 14.4.2 Canada
- 14.4.3 Mexico
- 14.5 Europe
- 14.5.1 Germany
- 14.5.2 France
- 14.5.3 Italy
- 14.5.4 United Kingdom
- 14.5.5 Spain
- 14.5.6 Poland
- 14.5.7 Russia
- 14.5.8 Netherlands
- 14.5.9 Belgium
- 14.5.10 Sweden
- 14.5.11 Denmark
- 14.5.12 Norway
- 14.5.13 Rest of Europe
- 14.6 Asia Pacific
- 14.6.1 China
- 14.6.2 India
- 14.6.3 Japan
- 14.6.4 South Korea
- 14.6.5 Thailand
- 14.6.6 Indonesia
- 14.6.7 Vietnam
- 14.6.8 Malaysia
- 14.6.9 Australia
- 14.6.10 Rest of Asia Pacific
- 14.7 Latin America
- 14.7.1 Brazil
- 14.7.2 Argentina
- 14.7.3 Colombia
- 14.7.4 Chile
- 14.7.5 Rest of Latin America
- 14.8 Middle East
- 14.8.1 Saudi Arabia
- 14.8.2 United Arab Emirates
- 14.8.3 Turkey
- 14.8.4 Israel
- 14.8.5 Iran
- 14.8.6 Rest of the Middle East
- 14.9 Africa
- 14.9.1 South Africa
- 14.9.2 Egypt
- 14.9.3 Nigeria
- 14.9.4 Morocco
- 14.9.5 Rest of Africa
- 14.10 Regional Investment, Policy and Supply Chain Differences
- 14.11 Regional Competitive Landscape
- 14.12 Geographic Growth Hotspots
Chapter 15 Global Perovskite Solar Cell Technology, Innovation and Sustainability Outlook
- 15.1 Technology Landscape and Maturity
- 15.2 Product, Process and Service Innovation
- 15.3 AI, Automation and Digital Tools in the Industry
- 15.4 Technology Adoption and Performance Benchmarking
- 15.5 Innovation Pipeline and R&D Investment
- 15.6 Patent and Intellectual Property Trends
- 15.7 Energy Efficiency and Resource Management
- 15.8 Sustainability, Recycling and Circularity
- 15.9 Technology Roadmap, 2025-2035
- 15.10 Risks of Obsolescence and Technology Substitution
Chapter 16 Global Perovskite Solar Cell Market Key Strategic Imperatives
- 16.1 Growth and Market Entry Priorities
- 16.2 High-Return Products and Segments
- 16.3 Pricing, Profitability and Cost Optimization
- 16.4 Technology Investment and Product Differentiation
- 16.5 Supply Chain Localization and Resilience
- 16.6 Distribution and Customer Acquisition
- 16.7 Partnership, Acquisition and Capacity Strategy
- 16.8 Regional Expansion Priorities
- 16.9 Short-, Medium- and Long-Term Actions
Chapter 17 Competition Outlook
- 17.1 Industry Competition Characteristics
- 17.2 Market Structure and Concentration
- 17.3 Market Share and Competitive Positioning, 2025
- 17.4 Company-Wise Revenue and Product Benchmarking
- 17.5 Production and Service Capacity Benchmarking
- 17.6 Technology, Pricing and Differentiation
- 17.7 Regional Footprint and Distribution Strength
- 17.8 Mergers, Acquisitions and Strategic Alliances
- 17.9 New Entrants and Competitive Threats
- 17.10 Porter's Five Forces and Industry Attractiveness
- 17.11 Competitive Outlook, 2025-2035
Chapter 18 Company Profiles
- 18.1 Company Coverage and Selection Criteria
- 18.2 UtmoLight
- 18.2.1 Business Description
- 18.2.2 Company Ownership and Geographic Presence
- 18.2.3 Product and Service Portfolio
- 18.2.4 Manufacturing and Operating Footprint
- 18.2.5 Production Capacity and Expansion Plans
- 18.2.6 Financial Performance and Investment
- 18.2.7 Market Share and Competitive Position
- 18.2.8 Technology and Innovation Capabilities
- 18.2.9 Strategic Alliances or Partnerships
- 18.2.10 Recent Developments
- 18.2.11 Growth Strategy and Outlook
- 18.3 Microquanta
- 18.4 GCL Perovskite
- 18.5 Oxford PV
- 18.6 LONGi
- 18.7 Qcells
- 18.8 Trina Solar
- 18.9 JinkoSolar
- 18.10 Caelux
- 18.11 Swift Solar
- 18.12 Tandem PV
- 18.13 Renshine
- 18.14 Other Relevant Market Participants
Note: Every listed company is profiled on the structure shown under the first company. The company list is preliminary and may change based on research findings, market developments, data availability and client requirements.
Chapter 19 Disclaimer
- 19.1 Research and Forecast Disclaimer
- 19.2 Data Source and Estimation Limitations
Note: The depth of individual sections depends on data availability for this market. Volume, capacity, trade and other unit-based metrics are included where applicable.

