| REPORT ATTRIBUTE |
DETAILS |
| Historical Period |
2020-2023 |
| Base Year |
2024 |
| Forecast Period |
2025-2032 |
| Blockchain in Oil and Gas Market Size 2023 |
USD 560.29 million |
| Blockchain in Oil and Gas Market, CAGR |
57.48% |
| Blockchain in Oil and Gas Market Size 2032 |
USD 33384.99 million |
Market Overview:
The Blockchain in Oil and Gas Market is projected to grow from USD 560.29 million in 2023 to an estimated USD 33384.99 million by 2032, with a compound annual growth rate (CAGR) of 57.48% from 2023 to 2032.
Key drivers accelerating the growth of the Blockchain in Oil and Gas Market include the rising demand for real-time data sharing and the reduction of operational risks associated with manual documentation and data reconciliation. Oil and gas companies are increasingly integrating blockchain with IoT, cloud computing, and AI to gain better control over asset tracking, maintenance, and logistics. Smart contracts are also transforming procurement, trading, and revenue-sharing processes by automating approvals and reducing the need for intermediaries. Cybersecurity concerns in the energy sector are further pushing the adoption of blockchain for securing critical infrastructure and maintaining operational resilience. In addition, blockchain technology plays a crucial role in emission tracking and compliance reporting, aligning with the industry’s decarbonization and ESG goals.
Regionally, North America dominates the Blockchain in Oil and Gas Market, holding the largest market share due to early adoption of blockchain technologies by major oil corporations and favorable investments in digital infrastructure. The United States, in particular, has seen multiple pilot projects and commercial deployments across exploration, logistics, and refining segments, with key players such as ExxonMobil, Chevron, and ConocoPhillips leading blockchain innovation efforts. Europe follows closely, supported by strong regulatory initiatives focusing on sustainability and digital transformation in the energy sector. Countries like the UK, Norway, and the Netherlands are witnessing collaborative blockchain initiatives aimed at enhancing cross-border energy trade and emissions management. Meanwhile, the Asia Pacific region is expected to witness the fastest growth during the forecast period, driven by rapid digitization in oil-dependent economies like China, India, and Southeast Asian nations. Government-led blockchain pilot programs and the rise of national oil companies exploring blockchain’s potential are contributing to its expanding presence in the region.
Access crucial information at unmatched prices!
Request your sample report today & start making informed decisions powered by Credence Research Inc.!
Download Sample
Market Insights:
- The market is projected to surge from USD 560.29 million in 2023 to USD 33,384.99 million by 2032, growing at a CAGR of 57.48%, driven by increasing digitalization and operational demands.
- Blockchain adoption is accelerating due to the oil and gas industry’s need for real-time data sharing, improved transparency, and risk reduction across complex supply chains.
- Smart contracts are transforming operations, automating procurement, trade settlements, and revenue distribution while eliminating intermediaries and reducing disputes.
- Cybersecurity challenges are prompting blockchain deployment, with the technology offering decentralized data protection and enhanced infrastructure resilience against tampering and breaches.
- Environmental and regulatory pressures are boosting blockchain use for emissions tracking and ESG compliance, enabling accurate, tamper-proof records for audits and reporting.
- High implementation costs and lack of standardization hinder adoption, with many companies facing challenges integrating blockchain with legacy systems and achieving cross-platform interoperability.
- North America leads the market with 42% share, while Asia Pacific is the fastest-growing region due to rising digital initiatives, national oil company investments, and regional pilot programs.\
Market Drivers:
Growing Need for Operational Efficiency and Transparent Data Management
The oil and gas industry involves complex workflows, multiple stakeholders, and significant data exchange across upstream, midstream, and downstream operations. Manual processes and siloed data often create inefficiencies, delays, and higher operational costs. Blockchain technology addresses these challenges by enabling decentralized, real-time data sharing across the value chain. It ensures data immutability, enhances traceability, and simplifies audit trails, leading to streamlined processes and faster decision-making. The Blockchain in Oil and Gas Market benefits from the industry’s growing preference for systems that reduce redundancy and improve accuracy. Companies adopting blockchain are improving transparency across joint ventures, land rights management, and pipeline monitoring systems.
- For example, BHP Billiton and Petroteq have reported enhanced operational efficiency through blockchain, allowing optimal resource tracking and control.
Increasing Demand for Smart Contracts and Automated Transaction Processes
Smart contracts are reshaping transaction protocols in the oil and gas sector by enabling self-executing agreements with predefined terms. These contracts reduce dependence on intermediaries, minimize administrative overhead, and accelerate approvals. Blockchain platforms using smart contracts automate trade settlements, revenue distribution, and vendor payments, ensuring compliance with contractual terms. It eliminates disputes by maintaining a single version of the truth accessible to all parties. The Blockchain in Oil and Gas Market is experiencing growth as firms adopt smart contract capabilities to enhance trading efficiency and reduce contract fraud. This automation supports agile business operations and fosters trust among partners.
Rising Concerns Over Cybersecurity and Infrastructure Integrity
Digital threats targeting energy infrastructure are increasing in frequency and sophistication, posing risks to critical operational systems. Traditional cybersecurity solutions often fail to provide the end-to-end protection required in highly distributed industrial environments. Blockchain adds a new layer of security by decentralizing data storage and encrypting transactional records. It mitigates single points of failure and strengthens resilience against tampering and unauthorized access. The Blockchain in Oil and Gas Market is expanding as organizations seek robust security frameworks to safeguard operational technology and sensitive data. Companies view blockchain as a vital component of their broader cybersecurity and risk mitigation strategies.
Regulatory Pressure and Environmental, Social, and Governance (ESG) Compliance
Governments and regulators are placing increasing emphasis on emissions tracking, sustainable sourcing, and transparent reporting. Blockchain enables accurate monitoring of carbon output, equipment maintenance, and waste management records across the supply chain. It helps firms meet stringent compliance standards by providing verifiable, timestamped data entries that support audits and certification. The Blockchain in Oil and Gas Market gains momentum from industry efforts to align with ESG goals and demonstrate accountability to investors and regulators. It provides tools for integrating sustainability metrics into core business systems and enhances reporting credibility. Blockchain adoption is becoming instrumental in fulfilling regulatory expectations and stakeholder commitments.
- Shell’s Avelia platform, for instance, delivered over 18 million gallons of Sustainable Aviation Fuel in 2024, reducing more than 165,000 tons of CO₂ emissions, with blockchain providing verifiable tracking for decarbonization efforts.
Market Trends:
Integration of Blockchain with Emerging Digital Technologies
Companies are increasingly integrating blockchain with advanced technologies such as the Internet of Things (IoT), artificial intelligence (AI), and cloud computing to create unified digital ecosystems. IoT devices capture real-time data from drilling sites, pipelines, and refineries, which blockchain platforms record securely and immutably. AI algorithms then analyze this data to optimize production and maintenance schedules. Cloud-based blockchain solutions offer scalability and ease of deployment across geographically dispersed assets. The Blockchain in Oil and Gas Market is witnessing growth through this convergence of technologies, improving data accuracy, operational agility, and decision-making speed. These integrations help companies adapt to dynamic market conditions and technological advancements.
- For example, Shell has partnered with Microsoft Azure to deploy cloud platforms that aggregate and analyze data from IoT sensors across global operations, enabling real-time monitoring and rapid response to operational challenges.
Collaborative Blockchain Platforms Across Supply Chains
Oil and gas companies are participating in consortium-based blockchain initiatives to standardize and share data across industry participants. These collaborative platforms streamline joint venture accounting, logistics coordination, and inventory management. By ensuring all stakeholders access the same verified records, blockchain minimizes disputes and improves trust across the value chain. Shared ledgers simplify performance tracking, regulatory reporting, and transaction validation between suppliers, operators, and regulators. The Blockchain in Oil and Gas Market benefits from the increasing use of multi-party platforms that enhance operational visibility and cost efficiency. This trend reflects a shift toward cooperative digital infrastructure over isolated systems.
Blockchain for Emissions Tracking and Environmental Reporting
Sustainability has become a strategic priority for oil and gas firms facing pressure from regulators and investors to reduce their carbon footprint. Blockchain enables accurate, verifiable tracking of greenhouse gas emissions across exploration, transportation, and refining operations. It supports transparent documentation of carbon credits, energy usage, and waste management efforts. Smart contracts automate emissions reporting and facilitate compliance with environmental standards. The Blockchain in Oil and Gas Market is evolving as companies use it to demonstrate ESG performance and secure stakeholder trust. This trend is reinforcing blockchain’s role as a tool for accountability in corporate sustainability initiatives.
- Williams, for instance, has partnered with Context Labs to implement a blockchain solution for sustainable and accountable natural gas production, ensuring transparent documentation of carbon credits and emissions data.
Use of Blockchain to Facilitate Crude Oil Trading and Settlement
Blockchain platforms are modernizing crude oil trading by enabling digital transaction records, instant verification, and automated settlements. Traditional trading processes often involve paperwork, multiple intermediaries, and time-consuming reconciliations. Blockchain reduces these delays by ensuring all parties have synchronized access to trading data and terms. Smart contracts execute trades when specific conditions are met, reducing counterparty risk and improving transaction speed. The Blockchain in Oil and Gas Market gains traction from the adoption of blockchain in commodity trading desks, particularly in high-volume hubs like Houston, Singapore, and Rotterdam. This trend supports greater liquidity, reduced fraud, and improved efficiency in global energy markets.
Market Challenges Analysis:
Lack of Standardization and Interoperability Across Platforms
The absence of universal standards poses a major barrier to widespread blockchain adoption in the oil and gas sector. Different organizations deploy proprietary blockchain systems that often lack compatibility, making integration across the value chain difficult. This fragmentation hinders seamless data exchange between suppliers, operators, and regulators, reducing the overall efficiency of blockchain solutions. Without clear governance frameworks and standardized protocols, it becomes difficult to scale pilot projects into enterprise-wide applications. The Blockchain in Oil and Gas Market faces delays in implementation due to interoperability concerns and inconsistent regulatory acceptance. It requires coordinated industry efforts to establish common platforms and data exchange models.
- For instance, when Shell and BP participated in the early development of the Vakt blockchain platform for post-trade processing, they encountered significant challenges integrating their existing systems with those of other consortium members due to the lack of standardized data formats and protocols.
High Implementation Costs and Resistance to Organizational Change
Deploying blockchain across complex oil and gas infrastructures demands significant investment in hardware, software, and employee training. Many companies hesitate to overhaul legacy systems or commit resources to emerging technologies with uncertain ROI. Change management also presents a challenge, with employees and management often resistant to disrupting familiar processes. The Blockchain in Oil and Gas Market experiences slow adoption when decision-makers struggle to justify costs against long-term efficiency gains. It requires strong executive leadership and cross-functional collaboration to align blockchain initiatives with strategic goals. Organizations must also address skill gaps to build internal capabilities for sustainable deployment.
Market Opportunities:
The oil and gas industry can unlock significant value by expanding blockchain use beyond trading and documentation. In upstream operations, blockchain improves asset lifecycle tracking, contractor management, and geological data verification. Downstream, it enhances product traceability, refines quality control, and simplifies logistics management. The Blockchain in Oil and Gas Market can capitalize on these applications to optimize workflows, reduce operational risk, and support regulatory compliance. It helps streamline processes where real-time verification and multi-party coordination are essential. Broader adoption across operational layers creates opportunities for digital transformation and performance improvement.
Companies pursuing decarbonization goals can use blockchain to build transparent, tamper-proof emissions records and carbon credit systems. Automated data logging ensures accurate reporting and supports participation in voluntary and compliance-based carbon markets. It strengthens ESG reporting frameworks by offering auditable proof of environmental claims. The Blockchain in Oil and Gas Market stands to benefit from rising investor pressure for traceable sustainability data. It supports accountability and opens new avenues for green financing and international cooperation. Demand for digital tools aligned with ESG metrics is creating a favorable environment for blockchain-based solutions.
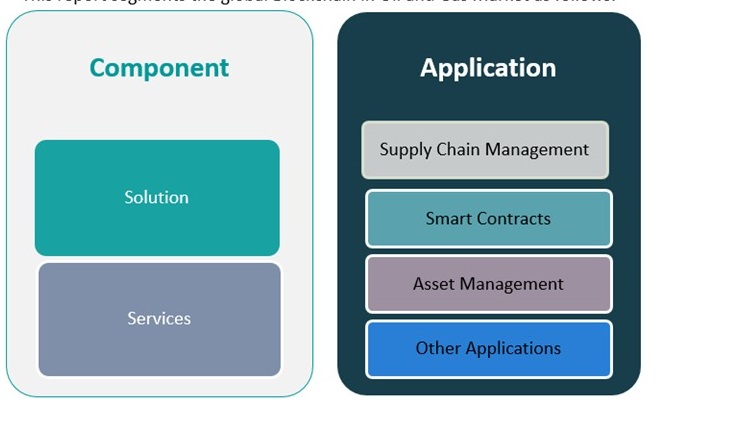
Market Segmentation Analysis:
By component, the Blockchain in Oil and Gas Market is segmented into Solution and Services. The solution segment holds the larger share due to growing adoption of blockchain platforms for supply chain visibility, smart contract execution, and operational transparency. Companies prefer tailored blockchain software that integrates with their existing systems and improves data traceability. The services segment is growing steadily, driven by demand for consulting, deployment, and maintenance support, especially during pilot testing and scale-up phases.
By application, the market is divided into Supply Chain Management, Smart Contracts, Asset Management, and Other Applications. Supply chain management dominates the application landscape as oil and gas firms prioritize transparency, inventory control, and logistics optimization. Smart contracts are gaining momentum for automating agreements and transactions, reducing delays and third-party dependencies. Asset management uses blockchain to monitor equipment lifecycle, usage patterns, and maintenance history. Other applications include emissions reporting, royalty management, and land record validation, all contributing to enhanced compliance and operational efficiency. The market benefits from diversified use cases across upstream, midstream, and downstream segments.
Segmentation:
By Component Segment:
By Application Segment:
- Supply Chain Management
- Smart Contracts
- Asset Management
- Other Applications
Regional Analysis:
North America leads the Blockchain in Oil and Gas Market, accounting for 42% of the global market share in 2024. The region benefits from early adoption of digital technologies, strong investment in innovation, and the presence of major oil and gas players such as ExxonMobil, Chevron, and ConocoPhillips. Companies in the United States and Canada are piloting and deploying blockchain platforms for contract management, supply chain visibility, and emissions tracking. Regulatory support for digital transformation and a mature IT infrastructure create favorable conditions for market growth. It supports a growing number of industry consortia focused on blockchain integration, promoting collaboration among key stakeholders. The region continues to set benchmarks in blockchain adoption across exploration, production, and trading.
Europe holds 29% of the market share, driven by stringent environmental regulations, energy security priorities, and digitalization initiatives in countries such as the UK, Norway, Germany, and the Netherlands. Regional oil companies and service providers are leveraging blockchain to improve data transparency, enhance ESG reporting, and strengthen cross-border energy trade. Projects like VAKT and OilX demonstrate Europe’s commitment to decentralized energy platforms that streamline data exchange and trading processes. The Blockchain in Oil and Gas Market in Europe gains momentum from partnerships between energy firms, technology providers, and regulatory bodies. It aligns closely with sustainability goals and the broader digital agenda under EU frameworks. Blockchain is emerging as a core enabler of innovation in the region’s energy transition strategy.
Asia Pacific captures 18% of the global market share and is projected to register the fastest growth rate through 2032. Rapid industrialization, increasing energy demand, and digital transformation in economies such as China, India, and Indonesia drive blockchain adoption. National oil companies and regional governments are investing in pilot programs that focus on secure data management and operational efficiency. The Blockchain in Oil and Gas Market in Asia Pacific is expanding through initiatives targeting supply chain optimization, emissions control, and contract automation. It supports policy-driven innovation aimed at enhancing transparency and resilience in energy infrastructure. The region presents untapped potential for scalable blockchain applications in both traditional and renewable energy sectors.
Shape Your Report to Specific Countries or Regions & Enjoy 30% Off!
Key Player Analysis:
- Hindustan Petroleum
- ConsenSys
- Infosys Limited
- VAKT Global
- VeChain
Competitive Analysis:
The Blockchain in Oil and Gas Market features a competitive landscape marked by strategic partnerships, consortium-led initiatives, and technological innovation. Key players such as IBM Corporation, Microsoft Corporation, Accenture, SAP SE, and Infosys are actively collaborating with oil majors to deliver customized blockchain solutions. Companies like VAKT, Data Gumbo, and GuildOne focus on specialized platforms for energy trading, contract automation, and supply chain transparency. It sees continuous investment in research and development to improve scalability, interoperability, and real-time analytics capabilities. Service providers compete by offering industry-specific applications that integrate with legacy infrastructure and enhance ROI. Market participants are strengthening their positions through pilot projects, joint ventures, and cross-industry alliances. The competitive environment reflects a shift toward modular, cloud-based solutions that support seamless deployment across upstream, midstream, and downstream operations.
Recent Developments:
- In October 2024, Blockchain for Energy (B4E), a technology consortium driving innovation in the energy sector, announced the successful launch of its newly enhanced B4E Logistics platform. This product, now live in production with a leading independent exploration and production company, marks a significant advancement in supply chain optimization for the oil and gas industry. Formerly known as B4E Commodity Transport, the rebranded and upgraded B4E Logistics solution introduces expanded functionality, offering greater transparency, security, and operational efficiency in logistics, procurement, and real-time tracking within the energy supply chain.
- In February 2025, Accenture introduced a new advanced blockchain solution tailored for oil and gas companies. This solution integrates artificial intelligence (AI) and Internet of Things (IoT) technologies to further enhance operational efficiency, security, and transparency across oil and gas operations. By combining blockchain with AI and IoT, Accenture aims to help industry players automate processes, improve data integrity, and streamline complex workflows, addressing the sector’s growing need for digital transformation and robust cybersecurity.
- In January 2025, Hindustan Petroleum Corporation Limited (HPCL) announced a strategic partnership with TrucksUp, a leading full truck load (FTL) aggregator platform, to launch Smart Fuel Cards for India’s logistics sector. This initiative introduces a seamless, cashless fuel management system, empowering truck owners and fleet operators to optimize operations and reduce costs. The Smart Fuel Cards facilitate secure transactions at HPCL outlets nationwide and offer perks like cashback and instant card management through the TrucksUp digital platform, aiming to drive growth, sustainability, and efficiency in India’s logistics ecosystem.
Market Concentration & Characteristics:
The Blockchain in Oil and Gas Market exhibits moderate concentration, with a mix of established technology firms and niche solution providers driving innovation. It features a blend of global IT leaders and energy-focused startups that cater to specific operational needs such as asset tracking, smart contracts, and emissions monitoring. The market is characterized by early-stage adoption, pilot deployments, and strong demand for scalable, interoperable platforms. Companies prioritize partnerships and consortia to standardize use cases and accelerate implementation across the supply chain. It reflects a demand-driven environment where value creation hinges on integration with existing systems and the ability to enhance transparency, security, and cost-efficiency.
Report Coverage:
The research report offers an in-depth analysis based on component and application. It details leading market players, providing an overview of their business, product offerings, investments, revenue streams, and key applications. Additionally, the report includes insights into the competitive environment, SWOT analysis, current market trends, as well as the primary drivers and constraints. Furthermore, it discusses various factors that have driven market expansion in recent years. The report also explores market dynamics, regulatory scenarios, and technological advancements that are shaping the industry. It assesses the impact of external factors and global economic changes on market growth. Lastly, it provides strategic recommendations for new entrants and established companies to navigate the complexities of the market.
Future Outlook:
- Market adoption will accelerate as blockchain moves from pilot projects to full-scale deployment across upstream and downstream operations.
- Integration with IoT, AI, and edge computing will enhance real-time monitoring and data-driven decision-making.
- Smart contract usage will expand to automate more complex trade, procurement, and compliance workflows.
- Cybersecurity concerns will continue to drive investment in blockchain for secure data sharing and infrastructure protection.
- ESG reporting and carbon credit tracking will see increased reliance on blockchain for verifiable transparency.
- Consortium-based models will grow, promoting interoperability and standardization across oil and gas networks.
- Asia Pacific will emerge as a high-growth region due to energy demand and government-led digitalization efforts.
- Legacy system compatibility and cost optimization will remain key factors shaping vendor competitiveness.
- Cloud-based blockchain platforms will gain traction for their scalability and deployment flexibility.
- Innovation will focus on reducing latency, enhancing privacy, and aligning blockchain use with regulatory frameworks.


