
Market Overview:
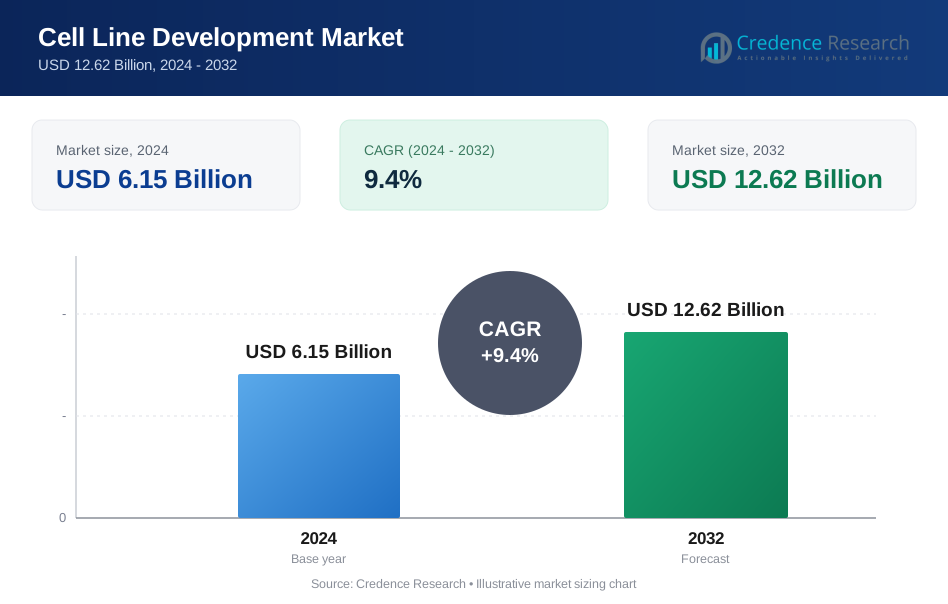
Cell Line Development Market size was valued at USD 6.15 Billion in 2024 and is anticipated to reach USD 12.62 Billion by 2032, at a CAGR of 9.4% during the forecast period.
| REPORT ATTRIBUTE | DETAILS |
|---|---|
| Historical Period | 2020-2023 |
| Base Year | 2024 |
| Forecast Period | 2025-2032 |
| Cell Line Development Market Size 2024 | USD 6.15 Billion |
| Cell Line Development Market, CAGR | 9.4% |
| Cell Line Development Market Size 2032 | USD 12.62 Billion |
The Cell Line Development Market is shaped by leading players such as Corning Inc., Advanced Instruments, Lonza, Berkeley Lights, Thermo Fisher Scientific Inc., Sartorius AG, Creative BioLabs, Danaher, and Merck KGaA. These companies drive innovation through advanced engineering platforms, high-performance culture media, and automated screening technologies that improve cell stability and productivity. North America led the market in 2024 with about 41% share due to strong biopharmaceutical manufacturing, high R&D investment, and widespread adoption of engineered cell systems. Europe followed with nearly 30% share, while Asia Pacific emerged as the fastest-growing region with about 22% share supported by expanding biologics and biosimilar production.

Market Insights
- The Cell Line Development Market reached USD 6.15 Billion in 2024 and is projected to hit USD 12.62 Billion by 2032, growing at a CAGR of 9.4%.
- Demand grows as biologics, biosimilars, and gene therapies expand, with recombinant cell lines holding about 52% share due to strong productivity and stability.
- Trends include rising adoption of AI-enabled screening, single-use systems, and automation, which improve speed, efficiency, and consistency in cell selection and optimization.
- Competition strengthens as global companies invest in high-throughput tools, digital platforms, and expanded CDMO partnerships to meet stricter quality and scalability needs.
- North America led the market with around 41% share in 2024, followed by Europe at about 30% and Asia Pacific at nearly 22%, while mammalian sources held roughly 74% share across applications.
Market Segmentation Analysis:
By Product & Services
Reagents and media held the dominant position in 2024 with about 38% share due to their essential role in supporting stable cell growth, viability, and productivity across biopharmaceutical workflows. Rising demand for high-performance culture media, serum-free formulations, and supplements strengthened this category. Broader use of advanced reagents in monoclonal antibody production, vaccine manufacturing, and gene therapy research also pushed adoption. Equipment such as bioreactors and incubators grew at a steady pace as companies expanded upstream processing capacity, while services gained traction as firms outsourced complex cell line engineering tasks.
- For instance, FUJIFILM Irvine Scientific can supply single batches of liquid cell culture media up to 10,000 litres and powder media up to 7,000 kilograms, which the company notes is equivalent to preparing as much as 280,000 litres of culture media for large‐scale bioprocessing.
By Source
Mammalian sources led the segment in 2024 with nearly 74% share because they closely replicate human cellular functions, enabling reliable protein expression and therapeutic development. CHO and HEK cell lines remained the preferred options for monoclonal antibodies, recombinant proteins, and viral vector production. Strong regulatory acceptance and high scalability supported adoption across biopharma companies. Non-mammalian systems, including insect and amphibian cells, saw rising use in vaccine development and specialty protein synthesis, but their market presence remained smaller due to limited expression compatibility for several biologics.
- For instance, AGC Biologics reports that its mammalian cell line development platform can reach antibody expression levels of up to 4.5 grams per litre, with a typical timeline of about twelve weeks from transfection to clone selection, highlighting the performance advantages of CHO-based systems.
By Cell Line
Recombinant cell lines dominated the segment in 2024 with around 52% share driven by their ability to deliver high-yield, consistent, and scalable protein production. Strong demand for monoclonal antibodies, fusion proteins, and gene-modified therapies increased reliance on engineered lines. Hybridomas continued to support antibody discovery, while continuous cell lines gained traction in virology, toxicity testing, and biosimilar development. Primary cell lines offered high biological relevance but remained less used due to limited lifespan and variability, keeping recombinant platforms as the preferred choice for commercial biologics manufacturing.
Key Growth Drivers
Rising Demand for Biologics and Biosimilars
Growing adoption of monoclonal antibodies, vaccines, and recombinant proteins continues to fuel the Cell Line Development Market. Biopharma companies rely on high-yield and stable cell lines to support large-scale biologics manufacturing. Expanding pipelines in oncology, autoimmune disorders, and rare diseases increase the need for optimized expression systems. Strong global investment in biosimilars further strengthens growth as manufacturers seek cost-effective and regulatory-compliant cell platforms.
- For instance, As of late 2025, Sandoz has a portfolio of 13 marketed biosimilar medicines and an industry-leading pipeline that comprises 27 biosimilar candidates at various stages of development globally.
Advancements in Cell Engineering Technologies
Progress in CRISPR gene editing, high-throughput screening, and automation enhances the speed and precision of cell line creation. These technologies reduce development timelines and improve cell stability and productivity. Companies use engineered cell lines to boost protein yield, enhance expression quality, and reduce batch variability. Integration of digital tools and AI-driven optimization supports faster design cycles, making engineered platforms a major growth accelerator.
- For instance, Berkeley Lights’ Opto CLD 2.0 workflow on the Beacon platform is described as screening and selecting antibody-producing clones that show around 1.5 to 3 times higher titers than clones chosen by conventional methods, using automated, image-based analysis at single-cell resolution.
Expansion of Gene Therapy and Viral Vector Production
Rising approvals of gene and cell therapies drive heavy demand for specialized cell lines used for viral vector manufacturing. HEK293 and other mammalian lines support efficient vector production for AAV, lentivirus, and adenovirus platforms. Growing investment in regenerative medicine and personalized therapies increases reliance on scalable, safe, and high-quality cell lines. The need for controlled expression systems strengthens the focus on advanced development technologies.
Key Trends & Opportunities
Growth of Single-Use and Modular Bioprocessing Systems
Biopharmaceutical companies are shifting toward single-use bioreactors and modular upstream systems to increase flexibility and reduce contamination risks. This trend benefits cell line development, as firms require optimized cell systems compatible with modern bioprocess setups. Faster batch changeovers and lower capital requirements encourage broader adoption among mid-size biotech firms. Integration with automated monitoring tools also creates new opportunities for continuous improvement.
- For instance, Sartorius’ Ambr 250 Modular system incorporates between 2 and 8 fully integrated single-use mini bioreactors, each with a working volume of 100 to 250 millilitres, allowing many parallel single-use upstream runs for rapid process and cell line optimization.
Adoption of AI-Driven Predictive Analytics in Cell Optimization
AI and machine learning tools are transforming how companies design, screen, and select high-performance cell lines. Predictive models help identify ideal gene edits, optimize culture conditions, and forecast productivity outcomes. This approach reduces trial-and-error processes and supports cost-efficient development. Growing digitalization across biologics manufacturing creates new opportunities for intelligent cell system optimization.
- For instance, Culture Biosciences offers cloud-connected bioreactor studies using both 250 millilitre and 5 litre systems, demonstrating high consistency and the ability to maintain cell culture performance across scales.
Rising Outsourcing to Specialized CDMOs
Many biopharma companies now outsource cell line development to contract development and manufacturing organizations due to their expertise and capacity. CDMOs offer advanced engineering platforms, regulatory compliance, and faster timelines. This trend boosts collaboration opportunities and increases demand for specialized services. Smaller biotech firms benefit from lower setup costs and access to cutting-edge technologies.
Key Challenges
High Development Costs and Long Timelines
ell line development requires extensive screening, gene editing, stability testing, and regulatory validation, leading to high costs and prolonged timelines. Smaller companies struggle with the capital burden associated with advanced equipment and skilled workforce needs. Achieving regulatory-grade consistency adds further complexity. These financial and time pressures limit access for emerging players and slow expansion across smaller biotech segments.
Regulatory Stringency and Quality Compliance
Strict global guidelines governing biologics manufacturing demand high consistency, traceability, and safety from developed cell lines. Meeting these requirements requires rigorous documentation, validated processes, and continuous quality checks. Any deviation can delay approvals or require redevelopment, adding operational risk. Companies must maintain compliance across evolving regulatory frameworks, creating significant challenges for both established and emerging biopharmaceutical developers.
Regional Analysis
North America
North America held the largest share of about 41% in 2024 due to strong biopharmaceutical activity, extensive R&D spending, and mature regulatory pathways that support advanced cell line engineering. The region benefits from major biotechnology hubs, well-established CDMOs, and rapid adoption of gene editing and high-throughput screening platforms. Growing investments in biologics, gene therapy, and biosimilars continue to expand demand for reliable expression systems. A strong presence of leading research institutes and supportive funding frameworks further strengthens the region’s leadership in the Cell Line Development Market.
Europe
Europe accounted for nearly 30% market share in 2024, supported by robust biologics manufacturing, strong academic–industry collaboration, and expanding investments in recombinant protein and vaccine development. The region’s regulatory environment encourages high-quality production standards, pushing companies to adopt advanced cell engineering tools. Rising focus on biosimilars, coupled with growing partnerships between biopharma firms and CDMOs, drives adoption across major countries including Germany, the U.K., and France. Increased funding for gene therapy and personalized medicine continues to influence market growth across Europe.
Asia Pacific
Asia Pacific captured around 22% share in 2024 and remained the fastest-growing region due to expanding biomanufacturing capacity and rising demand for affordable biologics. Countries such as China, India, South Korea, and Japan invest heavily in biopharmaceutical infrastructure, research talent, and technology transfer programs. Government incentives and lower operational costs attract global companies to establish manufacturing and development centers. Rapid growth in biosimilars, vaccines, and gene therapy research strengthens the need for advanced cell line platforms across the region.
Latin America
Latin America held about 4% market share in 2024, driven by gradual expansion of biologics production and increasing focus on local pharmaceutical capabilities. Brazil, Mexico, and Argentina lead adoption as governments invest in healthcare modernization and local manufacturing. The region experiences rising interest in biosimilars and vaccine development, encouraging adoption of engineered cell lines. However, limited R&D infrastructure and higher dependence on imported equipment slow wider expansion, though partnerships with global firms continue to create new opportunities.
Middle East & Africa
Middle East & Africa accounted for nearly 3% share in 2024, supported by emerging biotech clusters and ongoing investments in healthcare and research infrastructure. Countries such as Saudi Arabia, the UAE, and South Africa are gradually adopting modern bioprocessing and biologics development technologies. Growing interest in local vaccine production and rising collaborations with global research organizations help strengthen market presence. Despite slower growth due to limited technical capacity, strategic government initiatives continue to drive steady adoption of cell line development solutions.
Market Segmentations:
By Product & Services
- Reagents and media
- Equipment
- Incubators
- Centrifuge
- Bioreactors
- Storage equipment
- Microscopes
- Electroporators
- Fluorescence-activated cell sorting (FACS)
- Other equipment
- Accessories and consumables
- Services
By Source
- Mammalian
- Non-mammalian
- Insects
- Amphibians
By Cell Line
- Recombinant
- Hybridomas
- Continuous cell lines
- Primary cell lines
By Application
- Bioproduction
- Drug discovery
- Toxicity testing
- Tissue engineering
- Research
By Geography
- North America
- U.S.
- Canada
- Mexico
- Europe
- Germany
- France
- U.K.
- Italy
- Spain
- Rest of Europe
- Asia Pacific
- China
- Japan
- India
- South Korea
- South-east Asia
- Rest of Asia Pacific
- Latin America
- Brazil
- Argentina
- Rest of Latin America
- Middle East & Africa
- GCC Countries
- South Africa
- Rest of the Middle East and Africa
Competitive Landscape
The Cell Line Development Market features key players such as Corning Inc., Advanced Instruments, Lonza, Berkeley Lights, Thermo Fisher Scientific Inc., Sartorius AG, Creative BioLabs, Danaher, and Merck KGaA. The competitive environment is shaped by strong investment in advanced engineering tools, high-throughput screening systems, and automation platforms that improve speed and reliability in cell line creation. Companies focus on strengthening product portfolios through innovation in culture media, bioprocess equipment, and digital optimization technologies. Strategic partnerships with biopharma manufacturers, research institutes, and CDMOs help expand global reach and accelerate development timelines. Growing demand for biologics, biosimilars, and gene therapies continues to intensify competition as firms enhance production capabilities and regulatory compliance. Market participants also invest in integrated solutions that support scalability and reproducibility, which remain critical for successful commercialization of therapeutic products.
Key Player Analysis
- Corning Inc.
- Advanced Instruments
- Lonza
- Berkeley Lights
- Thermo Fisher Scientific Inc.
- Sartorius AG
- Creative BioLabs
- Danaher
- Merck KGaA
- Creative BioLabs
Recent Developments
- In 2025, Thermo Fisher Scientific Inc. launched an enhanced platform technology featuring a new CHO K-1 cell line, reducing timelines to Investigational New Drug filing from 13 to nine months.
- In 2024, Danaher introduced the Cydem VT Automated Cell Culture System, designed to simplify and accelerate cell line development by reducing manual steps by 90%.
- In 2024, Sartorius AG completed a customized CHO cell line development project from DNA synthesis to Research Cell Bank in 28 weeks.
Report Coverage
The research report offers an in-depth analysis based on Product & Services, Source, Cell Line, Application and Geography. It details leading market players, providing an overview of their business, product offerings, investments, revenue streams, and key applications. Additionally, the report includes insights into the competitive environment, SWOT analysis, current market trends, as well as the primary drivers and constraints. Furthermore, it discusses various factors that have driven market expansion in recent years. The report also explores market dynamics, regulatory scenarios, and technological advancements that are shaping the industry. It assesses the impact of external factors and global economic changes on market growth. Lastly, it provides strategic recommendations for new entrants and established companies to navigate the complexities of the market.
Future Outlook
- Demand for high-yield cell lines will rise as biologics and biosimilars expand.
- Gene therapy and viral vector production will strengthen the need for engineered cell platforms.
- Automated and AI-driven tools will speed up selection and screening processes.
- Single-use and modular bioprocess systems will gain broader adoption in development labs.
- Outsourcing to CDMOs will increase as companies seek faster and cost-efficient workflows.
- Regulatory guidance will push firms toward higher-quality and traceable cell line systems.
- Advanced gene-editing methods will enable more precise and stable expression lines.
- Demand for mammalian-based systems will stay strong due to regulatory and therapeutic needs.
- Investments in personalized medicine will drive the creation of specialized cell models.
- Emerging markets will expand capacity, boosting global competition in development services.
Request a Free Sample
Fill in your details and we'll send you a free sample report.
- Sample data tables & charts
- Research methodology
Need a Custom Version of This Report?
Tailor the scope, geography, or segments to your exact requirements.
- Custom geography or segment scope
- Direct access to our analyst team
Frequently Asked Questions
What is the current market size for Cell Line Development Market, and what is its projected size in 2?
At what Compound Annual Growth Rate is the Cell Line Development Market projected to grow between 2025 and 2032?
Which is the greatest region of the market for cell line development?
What are the major drivers for the growth of the cell line development market?
Which is the major category in the cell line development market by the source?
Which is the major category in the cell line development market by application?
Who are the leading companies in the Cell Line Development Market?
Table of Content
Chapter 1. Report Introduction
- 1.1 Report Description & Purpose
- 1.1.1 Report Title & Market Definition
- 1.1.2 Unique Selling Propositions (USP) & Key Differentiators
- 1.1.3 Value Proposition for Stakeholders
- 1.2 Research Objectives
- 1.2.1 Market Sizing Objectives (Volume & Revenue)
- 1.2.2 Segmentation Objectives
- 1.2.3 Competitive Intelligence Objectives
- 1.2.4 Forecast & Scenario Objectives
- 1.3 Report Scope
- 1.3.1 Cell Line Development Scope – Types & Subtypes Covered
- 1.3.2 Geographic Scope – Regions & Countries Covered
- 1.3.3 Historical Period, Base Year & Forecast Period (2024; forecast to 2032)
- 1.3.4 Inclusions & Exclusions
- 1.4 HS Code & Classification Framework
- 1.5 Currency, Units & Pricing Basis
- 1.6 Target Stakeholders
- 1.7 Limitations & Assumptions
Chapter 2. Executive Summary
- 2.1 Global Cell Line Development Market Snapshot
- 2.1.1 Market Size – Historical (2024) & Forecast (2024-2032) (2024: USD 6.15 Billion → 2032: USD 12.62 Billion)
- 2.1.2 Volume & Revenue – Global Totals
- 2.1.3 Key Market Highlights – Top Five Facts
- 2.2 Cell Line Development Market Segmentation Snapshot
- 2.2.1 Market Split by Region – 2024 vs. 2032
- 2.3 Competitive Snapshot
- 2.3.1 Top 10 Players by Revenue Share – 2024
- 2.3.2 Top 10 Players by Volume Share – 2024
- 2.3.3 Recent Strategic Developments (18-Month Summary)
- 2.4 Key Investment Highlights & Strategic Conclusions
Chapter 3. Cell Line Development Market Dynamics & Industry Analysis
- 3.1 Market Overview & Context
- 3.1.1 Cell Line Development Market Position in the Broader Automotive Value Chain
- 3.1.2 OEM vs. Replacement Market Dynamics
- 3.1.3 Market Maturity & Development Stage by Region
- 3.2 Cell Line Development Market Drivers
- 3.3 Cell Line Development Market Restraints & Challenges
- 3.4 Cell Line Development Market Opportunities
- 3.5 Porter's Five Forces Analysis
- 3.5.1 Threat of New Entrants
- 3.5.2 Bargaining Power of Suppliers
- 3.5.3 Bargaining Power of Buyers
- 3.5.4 Threat of Substitutes
- 3.5.5 Competitive Rivalry – Intensity Assessment
- 3.6 Cell Line Development Value Chain Analysis
- 3.6.1 Upstream – Raw Material/Input Suppliers
- 3.6.1.1 Raw Material/Input 1
- 3.6.1.2 Raw Material/Input 2
- 3.6.1.3 Raw Material/Input 3
- 3.6.2 Midstream – Production/Manufacturing/Service Delivery
- 3.6.2.1 Production/Process Overview
- 3.6.2.2 Key Facility Locations & Capacity by Manufacturer
- 3.6.3 Downstream – Distribution & End Consumer
- 3.6.3.1 Primary Channel – B2B/OEM
- 3.6.3.2 Secondary Channels – Dealer, Retail, Online, Direct
- 3.6.4 Value Chain Profitability Analysis
- 3.6.1 Upstream – Raw Material/Input Suppliers
- 3.7 PESTEL Analysis
- 3.7.1 Political Factors
- 3.7.2 Economic Factors
- 3.7.3 Social Factors
- 3.7.4 Technological Factors
- 3.7.5 Environmental Factors
- 3.7.6 Legal Factors
- 3.8 Cell Line Development Supply Chain Analysis
- 3.8.1 Raw Material/Input Supply Risk Assessment
- 3.8.2 Manufacturing Concentration Risk (Geographic Exposure)
- 3.8.3 Trade Disruption Impact Analysis
- 3.9 Regulatory & Policy Landscape
Note: The regulatory and policy landscape section covers regulations based on their applicability to the market, Cell Line Development category, geography, and scope of the study. Only regulatory frameworks with a material impact on operations, compliance, trade, sustainability, or market access are analyzed in detail.
Chapter 4. Key Investment Pockets & Opportunity Analysis
- 4.1 Cell Line Development Market Attractiveness Analysis
- 4.1.1 By Region – Investment Attractiveness Matrix (Volume × CAGR)
- 4.2 Absolute Revenue Growth Opportunity
- 4.2.1 By Region – Absolute USD Growth Through 2032
- 4.3 Incremental Volume Opportunity
- 4.3.1 By Region – Incremental Volume Through 2032
- 4.3.2 Segment – Incremental Volume
- 4.4 Emerging Submarket Opportunity Deep Dive (Subject to Applicability)
- 4.5 Emerging Market Opportunity Scorecards
- 4.5.1 United States
- 4.5.2 Europe
- 4.5.3 Asia
- 4.5.4 Middle East & Africa
Note: Emerging Market Opportunity Scorecards will be included based on relevance and strategic importance. Regions listed are indicative and may vary depending on data availability and market dynamics.
Chapter 5. Cell Line Development Import-Export Analysis & Trade Flows
- 5.1 Global Trade Overview
- 5.1.1 Global Export Value by Country (2024)
- 5.1.2 Global Export Volume by Country (2024)
- 5.1.3 Global Import Value by Country (2024)
- 5.1.4 Global Import Volume by Country (2024)
- 5.1.5 Net Trade Balance by Country (2024)
- 5.2 Export Analysis – Segment
- 5.2.1 Type 1 (HS Code)
- 5.2.2 Type 2 (HS Code)
- 5.2.3 Type 3 (HS Code)
- 5.2.4 Type 4 (HS Code)
- 5.2.5 Type 5 (HS Code)
- 5.3 Import Analysis – Segment
- 5.3.1 Type 1 (HS Code)
- 5.3.2 Type 2 (HS Code)
- 5.3.3 Type 3 (HS Code)
- 5.3.4 Type 4 (HS Code)
- 5.3.5 Type 5 (HS Code)
- 5.4 Average Unit Trade Prices
- 5.4.1 Average Export Price – Segment & Country
- 5.4.2 Average Import Price – Segment & Source Country
- 5.4.3 Price Trends (2024)
- 5.5 Key Trade Route Analysis
- 5.5.1 Trade Route 1
- 5.5.2 Trade Route 2
- 5.5.3 Trade Route 3
- 5.5.4 Trade Route 4
- 5.5.5 Trade Route 5
- 5.6 Trade Policy Impact Assessment
- 5.6.1 US Anti-Dumping & Section 301 Tariffs
- 5.6.2 EU Customs Union Impact
- 5.6.3 Major Free Trade Agreements
- 5.6.4 USMCA Rules of Origin
Note: Trade policy analysis will be included only where relevant to the Cell Line Development market.
Chapter 6. Competitive Landscape & Company Benchmarking
- 6.1 Cell Line Development Market Concentration & Structure
- 6.1.1 Herfindahl-Hirschman Index (HHI) – vs. 2024
- 6.1.2 Tier 1, Tier 2 & Tier 3 Market Structure
- 6.1.3 Global, Regional & Local Player Dynamics
- 6.2 Cell Line Development Market Share Analysis – 2024
- 6.2.1 Global Revenue Share by Company
- 6.2.2 Global Volume Share by Company
- 6.2.3 Regional Revenue Share
- 6.2.4 Market Share Evolution ( vs. 2024)
- 6.2.5 OEM Segment Share by Company
- 6.2.6 Replacement Segment Share by Company
- 6.3 Production/Delivery Capacity & Facility Analysis
- 6.3.1 Global Installed Capacity
- 6.3.2 Capacity Utilization Rates
- 6.3.3 Production/Output Volume
- 6.3.4 Facility Locations & Capacity Map
- 6.3.5 Planned Capacity Additions
- 6.4 Cell Line Development Competitive Benchmarking Matrix
- 6.4.1 Revenue, Volume, CAGR & Profitability Comparison
- 6.4.2 Channel Revenue Mix
- 6.4.3 Geographic Revenue Exposure
- 6.4.4 R&D Intensity
- 6.4.5 Sustainability Maturity
- 6.5 Strategic Developments in Cell Line Development (Last 24 Months)
- 6.5.1 Mergers, Acquisitions & Divestments
- 6.5.2 New Cell Line Development Launches
- 6.5.3 Facility Expansions
- 6.5.4 Strategic Alliances, Joint Ventures & Partnerships
- 6.5.5 Distribution Expansion & Market Entry
- 6.5.6 Sustainability & ESG Initiatives
- 6.6 Competitive Strategy Mapping
- 6.6.1 Leader, Challenger, Follower & Niche Classification
- 6.6.2 Pricing Strategy Comparison
- 6.6.3 Channel Strategy Matrix
Note: Strategic developments are included based on their materiality and the availability of reliable information.
Chapter 7. Global Cell Line Development Market – By Distribution Channel
- 7.1 Segment Overview
- 7.1.1 Volume & Revenue Split by Channel (2024 & 2032)
- 7.1.2 Channel Mix Evolution (2024-2032)
Chapter 8. Regional Market Analysis – Global Overview
- 8.1 Global Regional Overview
- 8.1.1 Regional Volume Share
- 8.1.2 Regional Revenue Share
- 8.1.3 Regional Volume by Region
- 8.1.4 Regional Revenue by Region
- 8.1.5 Regional Forecast Through 2032
- 8.2 Cross-Regional Segment Analysis
- 8.2.1 By Distribution Channel
- 8.2.2 By Brand/Price Tier
Chapter 9. North America Cell Line Development Market
- 9.1 United States
- 9.2 Canada
- 9.3 Mexico
Chapter 10. Europe Cell Line Development Market
- 10.1 Germany
- 10.2 France
- 10.3 Italy
- 10.4 United Kingdom
- 10.5 Spain
- 10.6 Poland
- 10.7 Russia
- 10.8 Netherlands
- 10.9 Belgium
- 10.10 Sweden
- 10.11 Denmark
- 10.12 Norway
- 10.13 Rest of Europe
Chapter 11. Asia Pacific Cell Line Development Market
- 11.1 China
- 11.2 India
- 11.3 Japan
- 11.4 South Korea
- 11.5 Thailand
- 11.6 Indonesia
- 11.7 Vietnam
- 11.8 Malaysia
- 11.9 Australia
- 11.10 Rest of Asia Pacific
Chapter 12. Latin America Cell Line Development Market
- 12.1 Brazil
- 12.2 Argentina
- 12.3 Colombia
- 12.4 Chile
- 12.5 Rest of Latin America
Chapter 13. Middle East Cell Line Development Market
- 13.1 Saudi Arabia
- 13.2 United Arab Emirates
- 13.3 Turkey
- 13.4 Israel
- 13.5 Iran
- 13.6 Rest of the Middle East
Chapter 14. Africa Cell Line Development Market
- 14.1 South Africa
- 14.2 Egypt
- 14.3 Nigeria
- 14.4 Morocco
- 14.5 Rest of Africa
Chapter 15. Cell Line Development Company Profiles
- 15.1 [Company 01]
- 15.1.1 Company Overview
- 15.1.2 Key Management Personnel
- 15.1.3 Products & Services Portfolio
- 15.1.4 Financial Performance
- 15.1.5 Key Market Focus & Geographic Presence
- 15.1.6 Recent Developments & Strategic Initiatives
Note: The company profile list is preliminary and may change based on research findings, market developments, data availability, and client requirements.
Chapter 16. Appendices
- Appendix A – List of Abbreviations & Acronyms
- Appendix B – Industry Classification Code Reference – Full Series
- Appendix C – Production & Capacity Data Tables
- Appendix D – End-Use & Demand Base Tables
- Appendix E – Consumption & Replacement Rate Assumptions
- Appendix F – ASP Reference Tables
- Appendix G – Manufacturing & Facility Database
- Appendix H – Import-Export Data Tables
- Appendix I – Regulatory Summary Tables
- Appendix J – Primary Research Participant List (Anonymized)
- Appendix K – Primary Research Questionnaire Framework
- Appendix L – Data Sources & Bibliography
- Appendix M – Market Size Divergence & Source Comparison
Chapter 17. Research Methodology
- 17.1 Research Framework & Philosophy
- 17.2 Secondary Research – Sources, Hierarchy & Data Extraction
- 17.3 Data Modeling – Bottom-Up & Top-Down Market Sizing
- 17.4 Primary Research – Stakeholder Framework, LOI & Sample Sizes
- 17.5 Forecast Methodology – Regression, Scenario & Sensitivity Analysis
- 17.6 Quality Control – Four-Layer Validation Framework
- 17.7 Limitations & Standard Assumptions
- 17.8 Disclaimer
