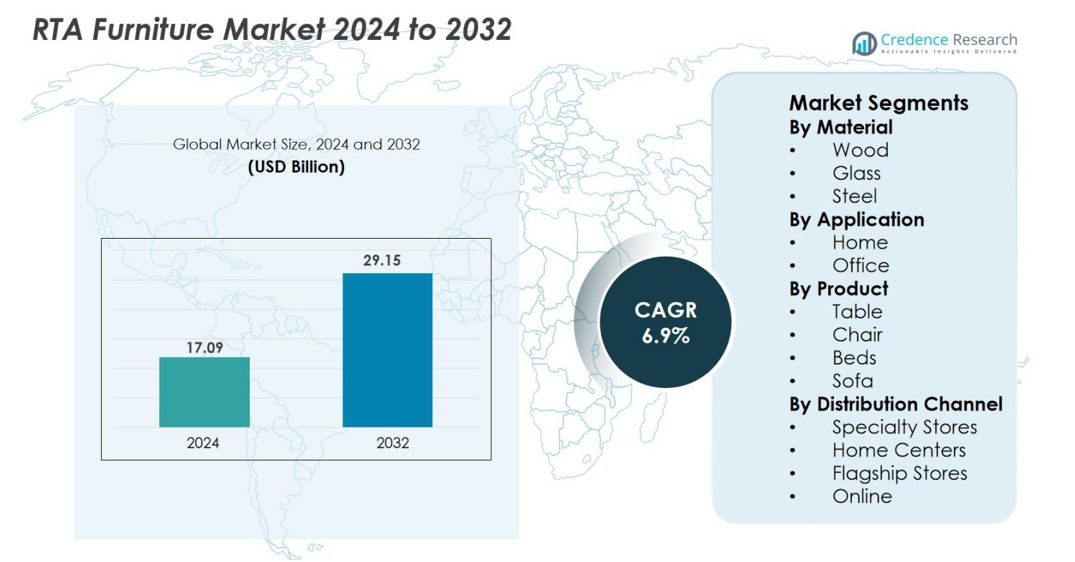
Home » Consumer Goods » RTA Furniture Market

Global RTA Furniture Market By Product (Tables, Chairs and Sofas, Storage, Beds, Others)By Material,(Wood ,Glass, Steel, Others) Growth, Future Prospects & Competitive Analysis, 2016 – 2030

Price: $4999

Published: | Report ID: 17063 | Report Format : PDF

About this report

The global RTA furniture market report explores the analysis of the global RTA furniture industry using major parameters. The report consists of the investment strategies, the need for investments in the RTA furniture industry, and the multiple benefits for investors. This report sets out significant changes in the global technical regulations for the RTA furniture industry and how the economic and non-economic barriers are helping the RTA furniture market growth. Moreover, the report analyses the regional, global, and country-level historic and forecasted market size. The report provides a comprehensive analysis of key investment propositions, supply and demand gap, STAR analysis, competitors positioning, SRC analysis, and Tornado analysis. Major technological developments and other analyses include value chain analysis, porter’s five forces analysis, PESTEL analysis, etc.

Key Highlights of the report

How are the major segments performing in the RTA furniture market?

  • In 2021, the chairs and sofas segment accounted for the highest share of the global market because chairs and sofas are used in living rooms. Chairs and sofas come in various styles, shapes and sizes, so there are many options to choose from regardless of the décor of your home.
  • In 2021, the wood segment held the largest share of the global market due to its long durability, stronger reliability, and great appearance.
  • In 2021, the home centers segment was anticipated to hold the largest global market share due to a growing consumer preference for customization features.
  • In 2021, the residential segment held the largest share of the global market. In order to improve the beauty of their homes, residents of residential complexes are increasingly focused on purchasing cutting-edge and stylish furniture.

What is the market size of RTA furniture regarding value?

The global RTA furniture market is anticipated to grow at a significant CAGR of 5.50% in the upcoming years. The global RTA furniture industry was estimated to be worth USD 13.8 billion in 2021 and was expected to worth USD 19.0 billion by 2028.

Design Element 2

Access crucial information at unmatched prices!

Request your free sample report today & start making informed decisions powered by Credence Research!

Download Free Sample
CTA Design Element 3

Which region dominated the RTA furniture market?

In 2021, the Europe region was anticipated for the highest revenue share in the target market. The increased importance of portable and flexible furniture in France, the U.K., and Germany drive the RTA furniture market in Europe. The furniture sector catering to the kitchen segments proves a lucrative growth in the market for the European region for new materials, surfaces, and devices launched. In addition, the shifting preference of consumers towards corner kitchens, which helps in utilizing space more efficiently, acts as a major factor driving the market in the region.

How is Germany Market Performing in the RTA furniture market?

In 2021, Europe was anticipated to have the largest revenue share in the global RTA furniture market. Germany is a leading country boosting Europe’s market growth because of the increasing importance of space-saving furniture. In addition, the growing importance of portable and flexible furniture and the adoption of advanced materials, devices and surfaces.

What is the competitive environment of the RTA furniture market?

The key players included in the market are IKEA Systems B.V., Ashley Home Stores, Ltd., Home Reserve, Steinhoff International, Bush Industries, Inc., Tvilum A/S, Dorel Industries Inc, IKEA Systems B.V and Simplicity Sofas. Manufacturers are concentrating on product development to fulfill the consumer’s demand.

For instance: In 2019, Ashley Home Stores, Ltd. expanded its RTA segment to attract small space dwellers. The company introduced over 500 goods that can be shipped and assembled to an individual’s home. Additionally, the company focuses on producing chairs, dining tables, and home entertainment.

Executive Summary

How does RTA furniture used in the residential?

RTA furniture is expected to register significant growth in the residential due to luxurious designs, and high production costs have increased the scope for low-cost furniture in the RTA furniture market.

Which are the key investments by the RTA furniture market players?

Through process optimization and the use of recycling techniques, large corporations are attempting to eliminate or reduce waste output. Additionally, making RTA furniture with sustainable methods reduces the amount of wood waste and trim and minimizes greenhouse gas emissions by lowering freight. For instance, in the installation instructions for each product, Bush Industries provides the necessary information on the recycling content. When furniture breaks, customers may learn how to recycle unwanted materials like wood, metal, glass, etc. The corporation has decreased its usage of solid lumber and mostly employs products that are ecologically friendly. As a result, the ready-to-assemble (RTA) furniture industry in the United States will probably be supported in the future due to suppliers’ increased emphasis on environmentally friendly practices and products.

Some major players in the RTA furniture market are Ashley HomeStore, Homestar Corporation, Inter IKEA Systems B.V., Bush Furniture, Flexsteel Industries Inc., Prepac Manufacturing Ltd, Sauder Woodworking Co., Simplicity Sofas, Tvilum A/S, Walker Edison Furniture Company LLC, South Shore Furniture, and Whalen Furniture (Li & Fung Limited).

What are the major driving factors for the RTA furniture market?

The shift towards space-saving furniture is the key factor to drives the growth of the global RTA furniture market. In addition, increasing trends to shift the new places for job and business purposes, especially by the young population, is expected to fuel the market. The demand for RTA furniture, including bookshelves and cabinets, is increasing owing to the rising preference for customized products per the available space. Another advantage of RTA furniture is its low cost compared to conventional furniture. These products have a low production cost due to simple producing parts that enable the elimination of assembling costs. Moreover, easy shipment, as well as transportation, has driven the scope for the online channel. For example, online retailer Tylko features stylish shelves for sideboards, TV stands, bookcases, and shoe racks.

What are the major risks for the RTA furniture market?

The RTA furniture market is experiencing certain growth restraints due to the supply chain and logistics’ complexity, extended replacement cycles, unpredictability of raw material pricing, and accessibility of counterfeit goods.

Which is the key material in the RTA furniture market?

The wood segment led the RTA furniture market and accounted for a maximum share over the forecast period. This is due to its extended longevity, increased dependability, and excellent beauty, which elevate it to a crucial category in home furnishings. To provide the items a pleasing look, RTA wooden fixtures are made from a variety of wood kinds, including solid wood, engineered wood, and Sheesham wood. For instance, the business Decor Furniture and Mattress Showplace manufactures many RTA furniture styles in the unfinished furniture market and provides various goods for the bedroom, living room, kitchen, and dining area.

How is the RTA furniture market performing in regions?

Europe’s RTA furniture market is accounted to dominate the global market due to the increased importance of portable and flexible furniture in countries in the region. In addition, the growing importance of portable and flexible furniture and the adoption of advanced materials, devices and surfaces.

Asia Pacific market is expected to have the fastest CAGR in the global market. Due to reduced usage and a smaller living area, the rising trend of two-person families in Asian nations like Japan, China, and Indonesia has encouraged customers to invest in such furniture. The expanding real estate market in emerging nations like China and India also drives up consumer demand for renovation projects that improve the visual appeal of their living spaces. Furthermore, a growing proportion of millennials in the furniture sector will undoubtedly purchase items because of personalization and space-saving features.

What is the regulatory landscape for the RTA furniture market?

The RTA furniture market presents a comprehensive analysis of the revenue produced by the major segments across various geographies for the years 2022 to 2028. Knowing which severe government laws, rules, and initiatives are fueling the expansion of the RTA furniture industry gives company owners an idea of what to expect in the next years.

Shape Your Report to Specific Countries or Regions & Enjoy 30% Off!

What are the major players planning for the future of the RTA furniture market?

Vendors leverage traditional and social media platforms for advertising. Many companies can create campaigns and exhibition shows to promote brands and products, reaching out to the target audience through TV commercials and social media platforms. For instance, IKEA uses different pages for different countries on Facebook to cater to the customers’ varying requirements. They make catalogs available digitally for mobile users and desktops. Similarly, Ashley Furniture HomeStore partnered with the iCrossing, to get in touch with customers through social media. Besides Facebook, the company has a strong presence on  Twitter, YouTube, and Flickr.

REPORT ATTRIBUTE DETAILS
RTA Furniture Market By Volume Yes
RTA Furniture Market By Value Yes
RTA Furniture Market, Tornado Analysis Yes
RTA Furniture Market, STAR Analysis Yes
RTA Furniture Market, SRC Analysis Yes
RTA Furniture Market Segment Analysis By Product (Tables, Chairs and Sofas, Storage, Beds, and Others

By Material (Wood, Glass, Steel, and Others)

By Distribution Channel (Specialty Stores,  , gship Stores, Home Centers, Online Stores, and Others)

By End User (Residential, and Commercial)

RTA Furniture Market, Regional Analysis North America (the US and Canada)

Europe (Germany, UK, France, Italy, Spain, and the Rest of Europe)

Asia Pacific (China, India, Japan, South Korea, Southeast Asia, and the Rest of Asia Pacific)

Latin America (Brazil, Mexico, and the Rest of Latin America)

The Middle East and Africa (GCC Countries, South Africa, and the Rest of the Middle East and Africa)

RTA Furniture Marketkey Companies Ashley HomeStore, Bush Furniture, Flexsteel Industries Inc., Homestar Corporation, Inter IKEA Systems B.V., Prepac Manufacturing Ltd, Sauder Woodworking Co., Simplicity Sofas, South Shore Furniture, Tvilum A/S, Walker Edison Furniture Company LLC and Whalen Furniture (Li & Fung Limited).
RTA Furniture Market Competitive Landscape Market Share Analysis

Competitive Benchmarking

Key Players Market Positioning

Geographical Presence Analysis

Major Strategies Adopted

Segmentation of the Global RTA furniture Market-

Global RTA furniture Market – By Product

  • Tables
  • Chairs and Sofas
  • Storage
  • Beds
  • Others

Global RTA furniture Market – By Material

  • Wood
  • Glass
  • Steel
  • Others

Global RTA furniture Market – By Distribution Channel

  • Specialty Stores
  • Flagship Stores
  • Home Centers
  • Online Stores
  • Others

Global RTA furniture Market – By End User

  • Residential
  • Commercial

Global RTA furniture Market – By Region

  • North America
    • US
    • Canada
  • Europe
    • Germany
    • France
    • The U.K.
    • Italy
    • Spain
    • Rest of Europe
  • Asia Pacific
    • China
    • Japan
    • India
    • South Korea
    • South-east Asia
    • Rest of Asia Pacific
  • Latin America
    • Brazil
    • Mexico
    • Rest of Latin America
  • Middle East & Africa
    • GCC Countries
    • South Africa
    • Rest of the Middle East and Africa

1. Preface
1.1. Report Description
1.1.1. Purpose of the Report
1.1.2. Target Audience
1.1.3. USP and Key Offerings
1.2. Research Scope
1.3. Research Methodology
1.3.1. Phase I – Secondary Research
1.3.2. Phase II – Primary Research
1.3.3. Phase III – Expert Panel Review
1.3.4. Approach Adopted
1.3.4.1. Top-Down Approach
1.3.4.2. Bottom-Up Approach
1.3.5. Assumptions
1.4. Market Segmentation

2. Executive Summary
2.1. Market Snapshot: Global RTA Furniture Market
2.2. Global RTA Furniture Market, By Product
2.3. Global RTA Furniture Market, By Material
2.4. Global RTA Furniture Market, By Distribution Channel
2.5. Global RTA Furniture Market, By End User

3. Market Dynamics & Factors Analysis
3.1. Introduction
3.1.1. Global RTA Furniture Market Value, 2016-2028, (US$ Bn)
3.2. Market Dynamics
3.2.1. Key Growth Trends
3.2.2. Market Drivers
3.2.3. Market Restraints
3.2.4. Market Opportunities
3.2.5. Major Industry Challenges
3.3. Attractive Investment Proposition,2021
3.3.1. Product
3.3.2. Material
3.3.3. Distribution Channel
3.3.4. End User
3.3.5. Geography

4. Premium Insights
4.1. STAR (Situation, Task, Action, Results) Analysis
4.2. Porter’s Five Forces Analysis
4.2.1. Threat of New Entrants
4.2.2. Bargaining Power of Buyers/Consumers
4.2.3. Bargaining Power of Suppliers
4.2.4. Threat of Substitute Types
4.2.5. Intensity of Competitive Rivalry
4.3. Value Chain Analysis
4.4. Technology Analysis
4.5. Marketing Strategy Analysis
4.5.1. Direct Marketing
4.5.2. Indirect Marketing
4.5.3. Marketing Channel Development Trend

5. Market Positioning of Key Players, 2021
5.1. Company market share of key players, 2021
5.2. Competitive Benchmarking
5.3. Market Positioning of Key Vendors
5.4. Geographical Presence Analysis
5.5. Major Strategies Adopted by Key Players
5.5.1. Key Strategies Analysis
5.5.2. Mergers and Acquisitions
5.5.3. Partnerships
5.5.4. Product Launch
5.5.5. Geographical Expansion
5.5.6. Others
6. COVID 19 Impact Analysis
6.1. Global RTA Furniture Market Pre Vs Post COVID 19, 2019 – 2028
6.2. Impact on Import & Export
6.3. Impact on Demand & Supply

7. Global Internet of Things Market
7.1. Global RTA Furniture Market, by Product, 2016-2028(US$ Bn)
7.1.1. Overview
7.1.2. Global RTA Furniture Market, By Product, 2021 vs 2028 (in%)
7.1.3. Global RTA Furniture Market, By Tables, 2016-2028 (US$ Bn)
7.1.4. Global RTA Furniture Market, By Chairs and Sofas, 2016-2028 (US$ Bn)
7.1.5. Global RTA Furniture Market, By Storage, 2016-2028 (US$ Bn)
7.1.6. Global RTA Furniture Market, By Beds, 2016-2028 (US$ Bn)
7.1.7. Global RTA Furniture Market, By Others, 2016-2028 (US$ Bn)
7.2. Global RTA Furniture Market, by Material, 2016-2028(US$ Bn)
7.2.1. Overview
7.2.2. Global RTA Furniture Market, By Wood, 2021 vs 2028 (in%)
7.2.3. Global RTA Furniture Market, By Glass, 2016-2028 (US$ Bn)
7.2.4. Global RTA Furniture Market, By Steel, 2016-2028 (US$ Bn)
7.2.5. Global RTA Furniture Market, By Others, 2016-2028 (US$ Bn)
7.2.6.
7.3. Global RTA Furniture Market, by Distribution Channel, 2016-2028(US$ Bn)
7.3.1. Overview
7.3.2. Global RTA Furniture Market, By Distribution Channel, 2021 vs 2028 (in%)
7.3.3. Global RTA Furniture Market, By Specialty Stores, 2016-2028 (US$ Bn)
7.3.4. Global RTA Furniture Market, By Flagship Stores, 2016-2028 (US$ Bn)
7.3.5. Global RTA Furniture Market, By Home Centres, 2016-2028 (US$ Bn)
7.3.6. Global RTA Furniture Market, By Online Stores, 2016-2028 (US$ Bn)
7.3.7. Global RTA Furniture Market, By Others, 2016-2028 (US$ Bn)
7.4. Global RTA Furniture Market, by End User, 2016-2028(US$ Bn)
7.4.1. Overview
7.4.2. Global RTA Furniture Market, By End User, 2021 vs 2028 (in%)
7.4.3. Global RTA Furniture Market, By Residential, 2016-2028 (US$ Bn)
7.4.4. Global RTA Furniture Market, By Commercial, 2016-2028 (US$ Bn)

8. North America RTA Furniture Market Analysis
8.1. North America RTA Furniture Market, by Product, 2016-2028(US$ Bn)
8.1.1. Overview
8.1.2. SRC Analysis
8.2. North America RTA Furniture Market, by Material, 2016-2028(US$ Bn)
8.2.1. Overview
8.2.2. SRC Analysis
8.3. North America RTA Furniture Market, by Distribution Channel, 2016-2028(US$ Bn)
8.3.1. Overview
8.3.2. SRC Analysis
8.4. North America RTA Furniture Market, by End User, 2016-2028(US$ Bn)
8.4.1. Overview
8.4.2. SRC Analysis
8.5. North America RTA Furniture Market, by Country, 2016-2028 (US$ Bn)
8.5.1. U.S.
8.5.1.1. U.S. RTA Furniture Market Estimates and Forecast, 2016-2028 (US$ Bn)
8.5.1.2. U.S. RTA Furniture, By Product, 2016-2028 (US$ Bn)
8.5.1.3. U.S. RTA Furniture, By Material, 2016-2028 (US$ Bn)
8.5.1.4. U.S. RTA Furniture, By Distribution Channel, 2016-2028 (US$ Bn)
8.5.1.5. U.S. RTA Furniture, By End User, 2016-2028 (US$ Bn)
8.5.2. Canada
8.5.2.1. Canada RTA Furniture Market Estimates and Forecast, 2016-2028 (US$ Bn)
8.5.2.2. Canada RTA Furniture, By Product, 2016-2028 (US$ Bn)
8.5.2.3. Canada RTA Furniture, By Material, 2016-2028 (US$ Bn)
8.5.2.4. Canada RTA Furniture, By Distribution Channel, 2016-2028 (US$ Bn)
8.5.2.5. Canada RTA Furniture, By End User, 2016-2028 (US$ Bn)

9. Europe RTA Furniture Market Analysis
9.1. Europe RTA Furniture Market, by Product, 2016-2028(US$ Bn)
9.1.1. Overview
9.1.2. SRC Analysis
9.2. Europe RTA Furniture Market, by Material, 2016-2028(US$ Bn)
9.2.1. Overview
9.2.2. SRC Analysis
9.3. Europe RTA Furniture Market, by Distribution Channel, 2016-2028(US$ Bn)
9.3.1. Overview
9.3.2. SRC Analysis
9.4. Europe RTA Furniture Market, by End User, 2016-2028(US$ Bn)
9.4.1. Overview
9.4.2. SRC Analysis
9.5. Europe RTA Furniture Market, by Country, 2016-2028 (US$ Bn)
9.5.1. Germany
9.5.1.1. Germany RTA Furniture Market Estimates and Forecast, 2016-2028 (US$ Bn)
9.5.1.2. Germany RTA Furniture, By Product, 2016-2028 (US$ Bn)
9.5.1.3. Germany RTA Furniture, By Material, 2016-2028 (US$ Bn)
9.5.1.4. Germany RTA Furniture, By Distribution Channel, 2016-2028 (US$ Bn)
9.5.1.5. Germany RTA Furniture, By End User, 2016-2028 (US$ Bn)
9.5.2. France
9.5.2.1. France RTA Furniture Market Estimates and Forecast, 2016-2028 (US$ Bn)
9.5.2.2. France RTA Furniture, By Product, 2016-2028 (US$ Bn)
9.5.2.3. France RTA Furniture, By Material, 2016-2028 (US$ Bn)
9.5.2.4. France RTA Furniture, By Distribution Channel, 2016-2028 (US$ Bn)
9.5.2.5. France RTA Furniture, By End User, 2016-2028 (US$ Bn)
9.5.3. UK
9.5.3.1. UK RTA Furniture Market Estimates and Forecast, 2016-2028 (US$ Bn)
9.5.3.2. UK RTA Furniture, By Product, 2016-2028 (US$ Bn)
9.5.3.3. UK RTA Furniture, By Material, 2016-2028 (US$ Bn)
9.5.3.4. UK RTA Furniture, By Distribution Channel, 2016-2028 (US$ Bn)
9.5.3.5. UK RTA Furniture, By End User, 2016-2028 (US$ Bn)
9.5.4. Italy
9.5.4.1. Italy RTA Furniture Market Estimates and Forecast, 2016-2028 (US$ Bn)
9.5.4.2. Italy RTA Furniture, By Product, 2016-2028 (US$ Bn)
9.5.4.3. Italy RTA Furniture, By Material, 2016-2028 (US$ Bn)
9.5.4.4. Italy RTA Furniture, By Distribution Channel, 2016-2028 (US$ Bn)
9.5.4.5. Italy RTA Furniture, By End User, 2016-2028 (US$ Bn)
9.5.5. Spain
9.5.5.1. Spain RTA Furniture Market Estimates and Forecast, 2016-2028 (US$ Bn)
9.5.5.2. Spain RTA Furniture, By Product, 2016-2028 (US$ Bn)
9.5.5.3. Spain RTA Furniture, By Material, 2016-2028 (US$ Bn)
9.5.5.4.
9.5.5.5. Spain RTA Furniture, By End User, 2016-2028 (US$ Bn)
9.5.6. Rest of Europe
9.5.6.1. Rest of Europe RTA Furniture Market Estimates and Forecast, 2016-2028 (US$ Bn)
9.5.6.2. Rest of Europe RTA Furniture, By Product, 2016-2028 (US$ Bn)
9.5.6.3. Rest of Europe RTA Furniture, By Material, 2016-2028 (US$ Bn)
9.5.6.4. Rest of Europe RTA Furniture, By Distribution Channel, 2016-2028 (US$ Bn)
9.5.6.5. Rest of Europe RTA Furniture, By End User, 2016-2028 (US$ Bn)

10. Asia Pacific RTA Furniture Market Analysis
10.1. Asia Pacific RTA Furniture Market, by Product, 2016-2028(US$ Bn)
10.1.1. Overview
10.1.2. SRC Analysis
10.2. Asia Pacific RTA Furniture Market, by Material, 2016-2028(US$ Bn)
10.2.1. Overview
10.2.2. SRC Analysis
10.3. Asia Pacific RTA Furniture Market, by Distribution Channel, 2016-2028(US$ Bn)
10.3.1. Overview
10.3.2. SRC Analysis
10.4. Asia Pacific RTA Furniture Market, by End User, 2016-2028(US$ Bn)
10.4.1. Overview
10.4.2. SRC Analysis
10.5. Asia Pacific RTA Furniture Market, by Country, 2016-2028 (US$ Bn)
10.5.1. China
10.5.1.1. China RTA Furniture Market Estimates and Forecast, 2016-2028 (US$ Bn)
10.5.1.2. China RTA Furniture, By Product, 2016-2028 (US$ Bn)
10.5.1.3. China RTA Furniture, By Material, 2016-2028 (US$ Bn)
10.5.1.4. China RTA Furniture, By Distribution Channel, 2016-2028 (US$ Bn)
10.5.1.5. China RTA Furniture, By End User, 2016-2028 (US$ Bn)
10.5.2. Japan
10.5.2.1. Japan RTA Furniture Market Estimates and Forecast, 2016-2028 (US$ Bn)
10.5.2.2. Japan RTA Furniture, By Product, 2016-2028 (US$ Bn)
10.5.2.3. Japan RTA Furniture, By Material, 2016-2028 (US$ Bn)
10.5.2.4. Japan RTA Furniture, By Distribution Channel, 2016-2028 (US$ Bn)
10.5.2.5. Japan RTA Furniture, By End User, 2016-2028 (US$ Bn)
10.5.3. India
10.5.3.1. India RTA Furniture Market Estimates and Forecast, 2016-2028 (US$ Bn)
10.5.3.2. India RTA Furniture, By Product, 2016-2028 (US$ Bn)
10.5.3.3. India RTA Furniture, By Material, 2016-2028 (US$ Bn)
10.5.3.4. India RTA Furniture, By Distribution Channel, 2016-2028 (US$ Bn)
10.5.3.5. India RTA Furniture, By End User, 2016-2028 (US$ Bn)
10.5.4. South Korea
10.5.4.1. South Korea RTA Furniture Market Estimates and Forecast, 2016-2028 (US$ Bn)
10.5.4.2. South Korea RTA Furniture, By Product, 2016-2028 (US$ Bn)
10.5.4.3. South Korea RTA Furniture, By Material, 2016-2028 (US$ Bn)
10.5.4.4. South Korea RTA Furniture, By Distribution Channel, 2016-2028 (US$ Bn)
10.5.4.5. South Korea RTA Furniture, By End User, 2016-2028 (US$ Bn)
10.5.5. South-East Asia
10.5.5.1. South-East Asia RTA Furniture Market Estimates and Forecast, 2016-2028 (US$ Bn)
10.5.5.2. South-East Asia RTA Furniture, By Product, 2016-2028 (US$ Bn)
10.5.5.3. South-East Asia RTA Furniture, By Material, 2016-2028 (US$ Bn)
10.5.5.4. South-East Asia RTA Furniture, By Distribution Channel, 2016-2028 (US$ Bn)
10.5.5.5. South-East Asia RTA Furniture, By End User, 2016-2028 (US$ Bn)
10.5.6. Rest of Asia Pacific
10.5.6.1. Rest of Asia Pacific RTA Furniture Market Estimates and Forecast, 2016-2028 (US$ Bn)
10.5.6.2. Rest of Asia Pacific RTA Furniture, By Product, 2016-2028 (US$ Bn)
10.5.6.3. Rest of Asia Pacific RTA Furniture, By Material, 2016-2028 (US$ Bn)
10.5.6.4. Rest of Asia Pacific RTA Furniture, By Distribution Channel, 2016-2028 (US$ Bn)
10.5.6.5. Rest of Asia Pacific RTA Furniture, By End User, 2016-2028 (US$ Bn)

11. Latin America RTA Furniture Market Analysis
11.1. Latin America RTA Furniture Market, by Product, 2016-2028(US$ Bn)
11.1.1. Overview
11.1.2. SRC Analysis
11.2. Latin America RTA Furniture Market, by Material, 2016-2028(US$ Bn)
11.2.1. Overview
11.2.2. SRC Analysis
11.3. Latin America RTA Furniture Market, by Distribution Channel, 2016-2028(US$ Bn)
11.3.1. Overview
11.3.2. SRC Analysis
11.4. Latin America RTA Furniture Market, by End User, 2016-2028(US$ Bn)
11.4.1. Overview
11.4.2. SRC Analysis
11.5. Latin America RTA Furniture Market, by Country, 2016-2028 (US$ Bn)
11.5.1. Brazil
11.5.1.1. Brazil RTA Furniture Market Estimates and Forecast, 2016-2028 (US$ Bn)
11.5.1.2. Brazil RTA Furniture, By Product, 2016-2028 (US$ Bn)
11.5.1.3. Brazil RTA Furniture, By Material, 2016-2028 (US$ Bn)
11.5.1.4. Brazil RTA Furniture, By Distribution Channel, 2016-2028 (US$ Bn)
11.5.1.5. Brazil RTA Furniture, By End User, 2016-2028 (US$ Bn)
11.5.2. Mexico
11.5.2.1. Mexico RTA Furniture Market Estimates and Forecast, 2016-2028 (US$ Bn)
11.5.2.2. Mexico RTA Furniture, By Product, 2016-2028 (US$ Bn)
11.5.2.3. Mexico RTA Furniture, By Material, 2016-2028 (US$ Bn)
11.5.2.4. Mexico RTA Furniture, By Distribution Channel, 2016-2028 (US$ Bn)
11.5.2.5. Mexico RTA Furniture, By End User, 2016-2028 (US$ Bn)
11.5.3. Rest of Latin America
11.5.3.1. Rest of Latin America RTA Furniture Market Estimates and Forecast, 2016-2028 (US$ Bn)
11.5.3.2. Rest of Latin America RTA Furniture, By Product, 2016-2028 (US$ Bn)
11.5.3.3. Rest of Latin America RTA Furniture, By Material, 2016-2028 (US$ Bn)
11.5.3.4. Rest of Latin America RTA Furniture, By Distribution Channel, 2016-2028 (US$ Bn)
11.5.3.5. Rest of Latin America RTA Furniture, By End User, 2016-2028 (US$ Bn)

12. Middle East and Africa RTA Furniture Market Analysis
12.1. Middle East and Africa RTA Furniture Market, by Product, 2016-2028(US$ Bn)
12.1.1. Overview
12.1.2. SRC Analysis
12.2. Middle East and Africa RTA Furniture Market, by Material, 2016-2028(US$ Bn)
12.2.1. Overview
12.2.2. SRC Analysis
12.3. Middle East and Africa RTA Furniture Market, by Distribution Channel, 2016-2028(US$ Bn)
12.3.1. Overview
12.3.2. SRC Analysis
12.4. Middle East and Africa RTA Furniture Market, by End User, 2016-2028(US$ Bn)
12.4.1. Overview
12.4.2. SRC Analysis
12.5. Middle East and Africa RTA Furniture Market, by Country, 2016-2028 (US$ Bn)
12.5.1. GCC Countries
12.5.1.1. GCC Countries il RTA Furniture Market Estimates and Forecast, 2016-2028 (US$ Bn)
12.5.1.2. GCC Countries RTA Furniture, By Product, 2016-2028 (US$ Bn)
12.5.1.3. GCC Countries RTA Furniture, By Material, 2016-2028 (US$ Bn)
12.5.1.4. GCC Countries RTA Furniture, By Distribution Channel, 2016-2028 (US$ Bn)
12.5.1.5. GCC Countries RTA Furniture, By End User, 2016-2028 (US$ Bn)
12.5.2. South Africa
12.5.2.1. South Africa RTA Furniture Market Estimates and Forecast, 2016-2028 (US$ Bn)
12.5.2.2. South Africa RTA Furniture, By Product, 2016-2028 (US$ Bn)
12.5.2.3. South Africa RTA Furniture, By Material, 2016-2028 (US$ Bn)
12.5.2.4. South Africa RTA Furniture, By Distribution Channel, 2016-2028 (US$ Bn)
12.5.2.5. South Africa RTA Furniture, By End User, 2016-2028 (US$ Bn)
12.5.3. Rest of Middle East and Africa
12.5.3.1. Rest of Middle East and Africa RTA Furniture Market Estimates and Forecast, 2016-2028 (US$ Bn)
12.5.3.2. Rest of Middle East and Africa RTA Furniture, By Product, 2016-2028 (US$ Bn)
12.5.3.3. Rest of Middle East and Africa RTA Furniture, By Material, 2016-2028 (US$ Bn)
12.5.3.4. Rest of Middle East and Africa RTA Furniture, By Distribution Channel, 2016-2028 (US$ Bn)
12.5.3.5. Rest of Middle East and Africa RTA Furniture, By End User, 2016-2028 (US$ Bn)

13. Company Profiles
13.1. Ashley HomeStore
13.1.1. Company Overview
13.1.2. Products/Services Portfolio
13.1.3. Geographical Presence
13.1.4. Financial Summary
13.1.4.1. Market Revenue and Net Profit (2019-2021)
13.1.4.2. Business Segment Revenue Analysis
13.1.4.3. Geographical Revenue Analysis
13.2. Bush Furniture
13.3. Flexsteel Industries Inc.
13.4. Homestar Corporation
13.5. Inter IKEA Systems B.V.
13.6. Prepac Manufacturing Ltd
13.7. Sauder Woodworking Co.
13.8. Simplicity Sofas
13.9. South Shore Furniture
13.10. Tvilum A/S
13.11. Walker Edison Furniture Company LLC
13.12. Whalen Furniture (Li & Fung Limited)
13.13. Others

List of Figures
FIG. 1 Global RTA Furniture Market: Research Methodology
FIG. 2 Market Size Estimation – Top Down & Bottom up Approach
FIG. 3 Global RTA Furniture Market Segmentation
FIG. 4 Global RTA Furniture Market, by Product, 2021 (US$ Bn)
FIG. 5 Global RTA Furniture Market, by Material, 2021 (US$ Bn)
FIG. 6 Global RTA Furniture Market, by Distribution Channel Type, 2021 (US$ Bn)
FIG. 7 Global RTA Furniture Market, by End User, 2021 (US$ Bn)
FIG. 8 Global RTA Furniture Market, by Geography, 2021 (US$ Bn)
FIG. 9 Attractive Investment Proposition, by Product, 2021
FIG. 10 Attractive Investment Proposition, by Material, 2021
FIG. 11 Attractive Investment Proposition, by Distribution Channel Type, 2021
FIG. 12 Attractive Investment Proposition, by End User, 2021
FIG. 13 Attractive Investment Proposition, by Geography, 2021
FIG. 14 Global Market Share Analysis of Key RTA Furniture Market Manufacturers, 2021
FIG. 15 Global Market Positioning of Key RTA Furniture Market Manufacturers, 2021
FIG. 16 Global RTA Furniture Market Value Contribution, By Product, 2021 & 2028 (Value %)
FIG. 17 Global RTA Furniture Market, by Tables, Value, 2016-2028 (US$ Bn)
FIG. 18 Global RTA Furniture Market, by Chairs and Sofas, Value, 2016-2028 (US$ Bn)
FIG. 19 Global RTA Furniture Market, by Storage, Value, 2016-2028 (US$ Bn)
FIG. 20 Global RTA Furniture Market, by Beds, Value, 2016-2028 (US$ Bn)
FIG. 21 Global RTA Furniture Market, by Others, Value, 2016-2028 (US$ Bn)
FIG. 22 Global RTA Furniture Market Value Contribution, By Material, 2021 & 2028 (Value %)
FIG. 23 Global RTA Furniture Market, by Wood, Value, 2016-2028 (US$ Bn)
FIG. 24 Global RTA Furniture Market, by Glass, Value, 2016-2028 (US$ Bn)
FIG. 25 Global RTA Furniture Market, by Steel, Value, 2016-2028 (US$ Bn)
FIG. 26 Global RTA Furniture Market, by Others, Value, 2016-2028 (US$ Bn)

FIG. 27 Global RTA Furniture Market Value Contribution, By Distribution Channel, 2021 & 2028 (Value %)
FIG. 28 Global RTA Furniture Market, by Specialty Stores, Value, 2016-2028 (US$ Bn)
FIG. 29 Global RTA Furniture Market, by Flagship Stores, Value, 2016-2028 (US$ Bn)
FIG. 30 Global RTA Furniture Market, by Home Centers, Value, 2016-2028 (US$ Bn)
FIG. 31 Global RTA Furniture Market, by Online Stores, Value, 2016-2028 (US$ Bn)
FIG. 32 Global RTA Furniture Market, by Others, Value, 2016-2028 (US$ Bn)
FIG. 33 Global RTA Furniture Market Value Contribution, By End User, 2021 & 2028 (Value %)
FIG. 34 Global RTA Furniture Market, by Residential, Value, 2016-2028 (US$ Bn)
FIG. 35 Global RTA Furniture Market, by Commercial, Value, 2016-2028 (US$ Bn)
FIG. 36 Global RTA Furniture Market Value Contribution, By End User, 2021 & 2028 (Value %)
FIG. 37 Global RTA Furniture Market, by Residential, Value, 2016-2028 (US$ Bn)
FIG. 38 Global RTA Furniture Market, by Commercial, Value, 2016-2028 (US$ Bn)
FIG. 39 U.S. RTA Furniture Market, 2016-2028 (US$ Bn)
FIG. 40 Canada RTA Furniture Market, 2016-2028 (US$ Bn)
FIG. 41 Germany RTA Furniture Market, 2016-2028 (US$ Bn)
FIG. 42 France RTA Furniture Market, 2016-2028 (US$ Bn)
FIG. 43 U.K. RTA Furniture Market, 2016-2028 (US$ Bn)
FIG. 44 Italy RTA Furniture Market, 2016-2028 (US$ Bn)
FIG. 45 Spain RTA Furniture Market, 2016-2028 (US$ Bn)
FIG. 46 Rest of Europe RTA Furniture Market, 2016-2028 (US$ Bn)
FIG. 47 China RTA Furniture Market, 2016-2028 (US$ Bn)
FIG. 48 Japan RTA Furniture Market, 2016-2028 (US$ Bn)
FIG. 49 India RTA Furniture Market, 2016-2028 (US$ Bn)
FIG. 50 South Korea RTA Furniture Market, 2016-2028 (US$ Bn)
FIG. 51 Southeast Asia RTA Furniture Market, 2016-2028 (US$ Bn)
FIG. 52 Rest of Asia Pacific RTA Furniture Market, 2016-2028 (US$ Bn)
FIG. 53 Latin America RTA Furniture Market, 2016-2028 (US$ Bn)
FIG. 54 Brazil RTA Furniture Market, 2016-2028 (US$ Bn)
FIG. 55 Mexico RTA Furniture Market, 2016-2028 (US$ Bn)
FIG. 56 Rest of Latin America RTA Furniture Market, 2016-2028 (US$ Bn)
FIG. 57 Middle East & Africa RTA Furniture Market, 2016-2028 (US$ Bn)
FIG. 58 GCC Countries RTA Furniture Market, 2016-2028 (US$ Bn)
FIG. 59 South Africa RTA Furniture Market, 2016-2028 (US$ Bn)
FIG. 60 Rest of Middle East and Africa RTA Furniture Market, 2016-2028 (US$ Bn)

List of Tables
TABLE 1 Market Snapshot: Global RTA Furniture Market
TABLE 2 Global RTA Furniture Market, by Competitive Benchmarking, 2021
TABLE 3 Global RTA Furniture Market, by Geographical Presence Analysis, 2021
TABLE 4 Global RTA Furniture Market, by Key Strategies Analysis, 2021
TABLE 5 Global RTA Furniture Market, by Product, 2016-2028 (US$ Bn)
TABLE 6 Global RTA Furniture Market, by Material, 2016-2028 (US$ Bn)
TABLE 7 Global RTA Furniture Market, by Distribution Channel, 2016-2028 (US$ Bn)
TABLE 8 Global RTA Furniture Market, by End User, 2016-2028 (US$ Bn)
TABLE 9 Global RTA Furniture Market, by Geography, 2016-2028 (US$ Bn)
TABLE 10 North America RTA Furniture Market, by Product, 2016-2028 (US$ Bn)
TABLE 11 North America RTA Furniture Market, by Material, 2016-2028 (US$ Bn)
TABLE 12 North America RTA Furniture Market, by Distribution Channel, 2016-2028 (US$ Bn)
TABLE 13 North America RTA Furniture Market, by End User, 2016-2028 (US$ Bn)
TABLE 14 North America RTA Furniture Market, by Country, 2016-2028 (US$ Bn)
TABLE 15 US RTA Furniture Market, by Product, 2016-2028 (US$ Bn)
TABLE 16 US RTA Furniture Market, by Material, 2016-2028 (US$ Bn)
TABLE 17 US RTA Furniture Market, by Distribution Channel, 2016-2028 (US$ Bn)
TABLE 18 US RTA Furniture Market, by End User, 2016-2028 (US$ Bn)
TABLE 19 Canada RTA Furniture Market, by Product, 2016-2028 (US$ Bn)
TABLE 20 Canada RTA Furniture Market, by Material, 2016-2028 (US$ Bn)
TABLE 21 Canada RTA Furniture Market, by Distribution Channel, 2016-2028 (US$ Bn)
TABLE 22 Canada RTA Furniture Market, by End User, 2016-2028 (US$ Bn)
TABLE 23 Europe RTA Furniture Market, by Product, 2016-2028 (US$ Bn)
TABLE 24 Europe RTA Furniture Market, by Material, 2016-2028 (US$ Bn)
TABLE 25 Europe RTA Furniture Market, by Distribution Channel, 2016-2028 (US$ Bn)
TABLE 26 Europe RTA Furniture Market, by End User, 2016-2028 (US$ Bn)
TABLE 27 Europe RTA Furniture Market, by Country, 2016-2028 (US$ Bn)
TABLE 28 Germany RTA Furniture Market, by Product, 2016-2028 (US$ Bn)
TABLE 29 Germany RTA Furniture Market, by Material, 2016-2028 (US$ Bn)
TABLE 30 Germany RTA Furniture Market, by Distribution Channel, 2016-2028 (US$ Bn)
TABLE 31 Germany RTA Furniture Market, by End User, 2016-2028 (US$ Bn)
TABLE 32 France RTA Furniture Market, by Product, 2016-2028 (US$ Bn)
TABLE 33 France RTA Furniture Market, by Material, 2016-2028 (US$ Bn)
TABLE 34 France RTA Furniture Market, by Distribution Channel, 2016-2028 (US$ Bn)
TABLE 35 France RTA Furniture Market, by End User, 2016-2028 (US$ Bn)
TABLE 36 UK RTA Furniture Market, by Product, 2016-2028 (US$ Bn)
TABLE 37 UK RTA Furniture Market, by Material, 2016-2028 (US$ Bn)
TABLE 38 UK RTA Furniture Market, by Distribution Channel, 2016-2028 (US$ Bn)
TABLE 39 UK RTA Furniture Market, by End User, 2016-2028 (US$ Bn)
TABLE 40 Italy RTA Furniture Market, by Product, 2016-2028 (US$ Bn)
TABLE 41 Italy RTA Furniture Market, by Material, 2016-2028 (US$ Bn)
TABLE 42 Italy RTA Furniture Market, by Distribution Channel, 2016-2028 (US$ Bn)
TABLE 43 Italy RTA Furniture Market, by End User, 2016-2028 (US$ Bn)
TABLE 44 Spain RTA Furniture Market, by Product, 2016-2028 (US$ Bn)
TABLE 45 Spain RTA Furniture Market, by Material, 2016-2028 (US$ Bn)
TABLE 46 Spain RTA Furniture Market, by Distribution Channel, 2016-2028 (US$ Bn)
TABLE 47 Spain RTA Furniture Market, by End User, 2016-2028 (US$ Bn)
TABLE 48 Rest of Europe RTA Furniture Market, by Product, 2016-2028 (US$ Bn)
TABLE 49 Rest of Europe RTA Furniture Market, by Material, 2016-2028 (US$ Bn)
TABLE 50 Rest of Europe RTA Furniture Market, by Distribution Channel, 2016-2028 (US$ Bn)
TABLE 51 Rest of Europe RTA Furniture Market, by End User, 2016-2028 (US$ Bn)
TABLE 52 Asia Pacific RTA Furniture Market, by Product, 2016-2028 (US$ Bn)
TABLE 53 Asia Pacific RTA Furniture Market, by Material, 2016-2028 (US$ Bn)
TABLE 54 Asia Pacific RTA Furniture Market, by Distribution Channel, 2016-2028 (US$ Bn)
TABLE 55 Asia Pacific RTA Furniture Market, by End User, 2016-2028 (US$ Bn)
TABLE 56 Asia Pacific RTA Furniture Market, by Country, 2016-2028 (US$ Bn)
TABLE 57 China RTA Furniture Market, by Product, 2016-2028 (US$ Bn)
TABLE 58 China RTA Furniture Market, by Material, 2016-2028 (US$ Bn)
TABLE 59 China RTA Furniture Market, by Distribution Channel, 2016-2028 (US$ Bn)
TABLE 60 China RTA Furniture Market, by End User, 2016-2028 (US$ Bn)
TABLE 61 Japan RTA Furniture Market, by Product, 2016-2028 (US$ Bn)
TABLE 62 Japan RTA Furniture Market, by Material, 2016-2028 (US$ Bn)
TABLE 63 Japan RTA Furniture Market, by Distribution Channel, 2016-2028 (US$ Bn)
TABLE 64 Japan RTA Furniture Market, by End User, 2016-2028 (US$ Bn)
TABLE 65 India RTA Furniture Market, by Product, 2016-2028 (US$ Bn)
TABLE 66 India RTA Furniture Market, by Material, 2016-2028 (US$ Bn)
TABLE 67 India RTA Furniture Market, by Distribution Channel, 2016-2028 (US$ Bn)
TABLE 68 India RTA Furniture Market, by End User, 2016-2028 (US$ Bn)
TABLE 69 South Korea RTA Furniture Market, by Product, 2016-2028 (US$ Bn)
TABLE 70 South Korea RTA Furniture Market, by Material, 2016-2028 (US$ Bn)
TABLE 71 South Korea RTA Furniture Market, by Distribution Channel, 2016-2028 (US$ Bn)
TABLE 72 South Korea RTA Furniture Market, by End User, 2016-2028 (US$ Bn)
TABLE 73 South East Asia RTA Furniture Market, by Product, 2016-2028 (US$ Bn)
TABLE 74 South East Asia RTA Furniture Market, by Material, 2016-2028 (US$ Bn)
TABLE 75 South East Asia RTA Furniture Market, by Distribution Channel, 2016-2028 (US$ Bn)
TABLE 76 South East Asia RTA Furniture Market, by End User, 2016-2028 (US$ Bn)
TABLE 77 Rest of Asia Pacific RTA Furniture Market, by Product, 2016-2028 (US$ Bn)
TABLE 78 Rest of Asia Pacific RTA Furniture Market, by Material, 2016-2028 (US$ Bn)
TABLE 79 Rest of Asia Pacific RTA Furniture Market, by Distribution Channel, 2016-2028 (US$ Bn)
TABLE 80 Rest of Asia Pacific RTA Furniture Market, by End User, 2016-2028 (US$ Bn)
TABLE 81 Latin America RTA Furniture Market, by Product, 2016-2028 (US$ Bn)
TABLE 82 Latin America RTA Furniture Market, by Material, 2016-2028 (US$ Bn)
TABLE 83 Latin America RTA Furniture Market, by Distribution Channel, 2016-2028 (US$ Bn)
TABLE 84 Latin America RTA Furniture Market, by End User, 2016-2028 (US$ Bn)
TABLE 85 Latin America RTA Furniture Market, by Country, 2016-2028 (US$ Bn)
TABLE 86 Brazil RTA Furniture Market, by Product, 2016-2028 (US$ Bn)
TABLE 87 Brazil RTA Furniture Market, by Material, 2016-2028 (US$ Bn)
TABLE 88 Brazil RTA Furniture Market, by Distribution Channel, 2016-2028 (US$ Bn)
TABLE 89 Brazil RTA Furniture Market, by End User, 2016-2028 (US$ Bn)
TABLE 90 Mexico RTA Furniture Market, by Product, 2016-2028 (US$ Bn)
TABLE 91 Mexico RTA Furniture Market, by Material, 2016-2028 (US$ Bn)
TABLE 92 Mexico RTA Furniture Market, by Distribution Channel, 2016-2028 (US$ Bn)
TABLE 93 Mexico RTA Furniture Market, by End User, 2016-2028 (US$ Bn)
TABLE 94 Rest of Latin America RTA Furniture Market, by Product, 2016-2028 (US$ Bn)
TABLE 95 Rest of Latin America RTA Furniture Market, by Material, 2016-2028 (US$ Bn)
TABLE 96 Rest of Latin America RTA Furniture Market, by Distribution Channel, 2016-2028 (US$ Bn)
TABLE 97 Rest of Latin America RTA Furniture Market, by End User, 2016-2028 (US$ Bn)
TABLE 98 Middle East and Africa RTA Furniture Market, by Product, 2016-2028 (US$ Bn)
TABLE 99 Middle East and Africa RTA Furniture Market, by Material, 2016-2028 (US$ Bn)
TABLE 100 Middle East and Africa RTA Furniture Market, by Distribution Channel, 2016-2028 (US$ Bn)
TABLE 101 Middle East and Africa RTA Furniture Market, by End User, 2016-2028 (US$ Bn)
TABLE 102 Middle East and Africa RTA Furniture Market, by Country, 2016-2028 (US$ Bn)
TABLE 103 GCC Countries RTA Furniture Market, by Product, 2016-2028 (US$ Bn)
TABLE 104 GCC Countries RTA Furniture Market, by Material, 2016-2028 (US$ Bn)
TABLE 105 GCC Countries RTA Furniture Market, by Distribution Channel, 2016-2028 (US$ Bn)
TABLE 106 GCC Countries RTA Furniture Market, by End User, 2016-2028 (US$ Bn)
TABLE 107 South Africa RTA Furniture Market, by Product, 2016-2028 (US$ Bn)
TABLE 108 South Africa RTA Furniture Market, by Material, 2016-2028 (US$ Bn)
TABLE 109 South Africa RTA Furniture Market, by Distribution Channel, 2016-2028 (US$ Bn)
TABLE 110 South Africa RTA Furniture Market, by End User, 2016-2028 (US$ Bn)
TABLE 111 Rest of Middle East and Africa RTA Furniture Market, by Product, 2016-2028 (US$ Bn)
TABLE 112 Rest of Middle East and Africa RTA Furniture Market, by Material, 2016-2028 (US$ Bn)
TABLE 113 Rest of Middle East and Africa RTA Furniture Market, by Distribution Channel, 2016-2028 (US$ Bn)
TABLE 114 Rest of Middle East and Africa RTA Furniture Market, by End User, 2016-2028 (US$ Bn)

Frequently asked questions

How does COVID-19 impact the global RTA furniture market?

The COVID-19 epidemic, which struck the world in the first few months of 2020, significantly altered the furniture industry’s landscape. Countries with a significant reliance on imports for their furniture needs were particularly affected by the temporary international trade restriction and supply chain disruptions

Which is the leading region of the market for RTA furniture?

Europe’s RTA furniture market is expected for the highest revenue share of the global market.

What are the drivers for the growth of the RTA furniture market?

The increasing popularity of customized features in furnishing encourages manufacturers to develop these products.

Which is the major segment in the RTA furniture market by product?

The chairs and sofas segment had a major global market share in 2021.

Which is the major segment in the RTA furniture market by material?

The wood segment had a major share of the global market.

Massage Chair Market

Published:
Report ID: 36375

Foot Care Products Market

Published:
Report ID: 5605

Hair Styling Tools Market

Published:
Report ID: 36362

Electric Kettle Market

Published:
Report ID: 36332

Baby High Chair Market

Published:
Report ID: 36303

Water Cooler Market

Published:
Report ID: 36292

Dishwasher Market

Published:
Report ID: 36268

Vacuum Cleaner Market

Published:
Report ID: 36253

Lipstick Market

Published:
Report ID: 36247

Coconut Oil Market

Published:
Report ID: 36156

Train Seat Market

Published:
Report ID: 11562

Hair Removal Wax Market

Published:
Report ID: 35837

Purchase Options

$2999
Delivery Format: Excel.
$4999
Designed for the individual purchaser.
$6999
Users located at a single corporate site or regional office.
$7999
Allowed for unlimited sharing globally within one company.
Smallform of Sample request

Have a question?

User Profile

Don’t settle for less – trust Mitul to help you find the best solution.

Report delivery within 24 to 48 hours

– Other Info –

What people say?-

User Review

I am very impressed with the information in this report. The author clearly did their research when they came up with this product and it has already given me a lot of ideas.

Jana Schmidt
CEDAR CX Technologies

– Connect with us –

Phone

+91 6232 49 3207


support

24/7 Research Support


sales@credenceresearch.com

– Research Methodology –

Going beyond the basics: advanced techniques in research methodology

– Trusted By –

Pepshi, LG, Nestle
Motorola, Honeywell, Johnson and johnson
LG Chem, SIEMENS, Pfizer
Unilever, Samsonite, QIAGEN