
Market Overview
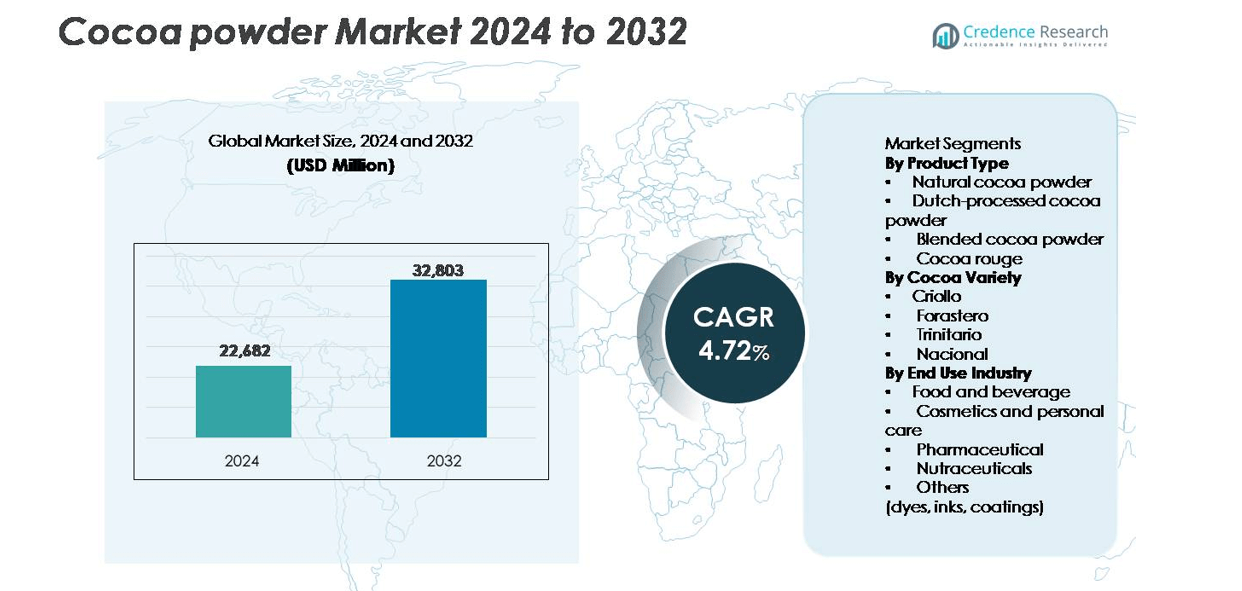
The Cocoa Powder Market size was valued at USD 22,682 million in 2024 and is expected to reach USD 32,803 million by 2032, reflecting a 4.72% CAGR during the forecast period.
| REPORT ATTRIBUTE | DETAILS |
|---|---|
| Historical Period | 2020-2023 |
| Base Year | 2024 |
| Forecast Period | 2025-2032 |
| Cocoa Powder Market Size 2024 | USD 22,682 million |
| Cocoa Powder Market, CAGR | 4.72% |
| Cocoa Powder Market Size 2032 | USD 32,803 million |
Major players in the cocoa powder market include Cargill, Barry Callebaut, Olam International, Hershey, and Nestlé, each competing through large grinding capacity, diversified cocoa portfolios, and sustainable sourcing programs. These companies supply cocoa powder to global bakery, chocolate, beverage, and nutraceutical brands, while investing in certified and traceable cocoa to meet clean-label demand. Europe remains the leading region with 33% market share, supported by a strong chocolate manufacturing base and premium confectionery demand. North America follows with 27%, driven by bakery and dairy products, while Asia-Pacific accounts for 26% as chocolate snacks and café beverages expand across emerging markets.
Market Insights
- The Cocoa Powder Market was valued at USD 22,682 million in 2024 and is projected to reach USD 32,803 million by 2032, at a 4.72% CAGR.
- Growing demand from bakery, confectionery, and beverage industries drives consumption as brands use cocoa powder for flavor, color, and clean-label product claims.
- Trends such as organic cocoa, sugar-free blends, Dutch-processed variants, and premium dark chocolate strengthen market opportunities, while specialty cafés and artisanal bakeries expand usage.
- Key players compete through sustainable sourcing, grinding capacity expansion, and certified product portfolios, while price volatility linked to crop yield and climate remains a major restraint.
- Europe leads with 33% share, followed by North America at 27% and Asia-Pacific at 26%, while natural cocoa powder dominates by product type due to wide food and beverage usage.
Market Segmentation Analysis:
By Product Type
Natural cocoa powder holds the dominant share, driven by its wide use in bakery, confectionery, and beverages. Food manufacturers prefer natural cocoa powder due to its strong flavor profile and clean-label appeal. Dutch-processed cocoa powder also grows steadily, supported by its mild taste and smooth color, which suits premium chocolates and ice-cream. Blended cocoa powder gains adoption among industrial bakeries due to consistent flavor and cost advantages, while cocoa rouge remains a specialty ingredient for gourmet formulations. The shift toward natural ingredients and rising consumer preference for authentic cocoa taste continues to support segment leadership for natural cocoa powder.
- For instance, Barry Callebaut’s extra-dark alkalized cocoa powder delivers a pH of 7.6 and moisture below 5 grams per 100 grams to achieve smoother solubility in cold beverages.
By Cocoa Variety
Forastero remains the leading segment, contributing the highest market share due to large-scale global cultivation and reliable supply. Its strong yield, disease resistance, and lower cost make Forastero the preferred variety for commercial chocolate and beverage production. Criollo attracts premium brands for fine-flavor chocolates but holds a smaller share because of limited availability and higher pricing. Trinitario offers a balance of flavor and productivity, gaining interest in artisanal and specialty cocoa products. Nacional remains a niche variety used in high-end chocolate applications. The need for stable raw material supply and price stability drives Forastero’s demand.
- For instance, Barry Callebaut sources Forastero beans which have an average dried bean weight typically ranging from 0.8 to 1.4 grams and undergo fermentation cycles of generally 5 to 7 days (depending on origin and method) to maintain consistent flavor for industrial chocolate.
By End Use Industry
Food and beverage dominates the market with the largest share, supported by strong demand for chocolates, instant cocoa drinks, baked goods, and flavored dairy products. Major brands add cocoa powder in cookies, cakes, milkshakes, and cereals to enhance taste and color. Cosmetics and personal care also rise as cocoa acts as a natural antioxidant in lotions and face masks. Pharmaceutical and nutraceutical manufacturers use cocoa powder in supplements and functional foods due to flavanols linked to heart health. Additional demand comes from dyes, inks, and coatings. Growth in confectionery and ready-to-eat products keeps food and beverage ahead.
Key Growth Drivers
Rising Demand from Bakery, Confectionery, and Beverage Industries
The expanding bakery, confectionery, and beverage sectors remain primary drivers for cocoa powder consumption. Global chocolate consumption continues to rise, supported by new product launches in cakes, cookies, milk chocolates, flavored dairy, and instant cocoa drinks. Food manufacturers widely prefer cocoa powder due to its ability to improve taste, aroma, texture, and color without synthetic additives. Growth in ready-to-eat snacks, premium chocolates, and flavored bakery items increases demand from commercial bakeries and food processors. International manufacturers also expand into emerging markets in Asia, Africa, and South America, where rising disposable income drives chocolate and dessert consumption. The shift toward flavor-rich and premium snack offerings strengthens the long-term use of cocoa powder across multiple food categories.
- For instance, Mondelez employs alkalized cocoa powders with a pH level of 7.5 in Oreo biscuits to achieve a darker color and smoother taste profile.
Shift Toward Natural, Clean-Label, and Organic Ingredients
Clean-label and ingredient transparency have transformed purchasing behavior, encouraging food brands to replace artificial flavors with natural cocoa ingredients. Consumers prefer minimally processed ingredients free from additives, preservatives, and synthetic colorants, which boosts demand for natural cocoa powder. Organic food launches in confectionery, beverages, and ready-to-eat snacks continue to expand, creating strong opportunities for cocoa suppliers offering certified and sustainably sourced products. Ethical chocolate production, traceable supply chains, and “fair-trade” certifications also influence buying decisions, particularly in developed markets. As sustainability and transparency gain importance, chocolate and dairy manufacturers choose natural cocoa powder to strengthen brand reputation and meet labeling regulations.
Expansion of Functional and Nutraceutical Applications
Cocoa powder contains antioxidants, polyphenols, and flavanols linked to cardiovascular and cognitive health, which increases interest in functional foods and nutraceutical products. Supplement companies use cocoa in protein shakes, energy bars, and vitamin-enriched beverages to improve taste and deliver health benefits. The growing sports nutrition and weight-management sectors drive new cocoa-based protein mixes and meal-replacement formulations. As consumers seek healthier indulgence and low-sugar alternatives, brands develop sugar-free and alkalized cocoa powders for diabetic and fitness-focused buyers. Pharmaceutical applications also rise where cocoa is used in tablets, syrups, and chewables to improve flavor. This shift toward health-centric product innovation improves long-term market penetration.
Key Trends & Opportunities
Premiumization and Growth of Specialty Cocoa Products
Premium cocoa powders, including Dutch-processed, organic, Criollo-based, and cocoa rouge varieties, are gaining traction as consumers seek richer flavor and gourmet quality. Artisanal chocolate makers, luxury dessert brands, and specialty bakeries increasingly adopt high-grade cocoa with enhanced flavor precision, smooth texture, and darker color. The rise of café culture and premium confectionery chains also boosts demand for specialty hot chocolates and dark chocolate desserts. Innovations such as alkalized cocoa for enhanced solubility or reduced bitterness create strong opportunities for manufacturers to target premium markets. As consumers associate dark cocoa with health and luxury, brands leverage high-cocoa and fine-flavor products to maximize margins and brand loyalty.
- For instance, Valrhona produces premium, Dutch-processed cocoa powders with a fat content of 21-22% (or 21-22 grams per 100 grams). This high fat content, combined with a very finely ground texture (typically with an average particle size of 10 to 20 microns), creates a smoother mouthfeel and intense flavor in pastry applications.
Growth of Sustainable and Fair-Trade Cocoa Sourcing
Sustainability has become a major trend shaping cocoa powder production and marketing strategies. Large chocolate manufacturers adopt fair-trade, Rainforest Alliance, and UTZ-certified cocoa to ensure ethical sourcing, farmer welfare, and reduced environmental impact. Buyers increasingly evaluate carbon footprint, deforestation risk, and traceability before choosing suppliers. Companies invest in farmer training, blockchain-based supply tracking, and zero-deforestation commitments to strengthen their responsible sourcing narrative. Premium consumers favor brands promoting sustainable cocoa usage in chocolates, beverages, and skincare. These commitments open new opportunities for suppliers that provide certified, transparent, and ethically sourced cocoa powder with added brand value.
- · For instance, Lindt & Sprüngli supports farmer training programs covering over 118,000 cocoa farmers (as of 2024) and supplies high-yielding and disease-resistant cocoa seedlings to improve plantation sustainability.
Key Challenges
Volatile Cocoa Bean Prices and Supply Instability
Cocoa production depends heavily on climatic conditions, crop diseases, and political stability in major producing regions such as Côte d'Ivoire and Ghana. Unpredictable rainfall, drought, soil degradation, and aging plantations directly affect bean yield and supply consistency. These fluctuations lead to rapid price volatility, impacting profit margins for chocolate producers, bakeries, and beverage companies. Rising labor costs, logistics disruptions, and fluctuating currency inflation further intensify supply-chain pressure. Companies hedge risk through long-term contracts and diversified sourcing, but small manufacturers face strong pricing challenges that limit competitiveness and innovation efforts.
Regulatory Requirements and Quality Certifications
Cocoa powder used in food, pharmaceuticals, and cosmetics must adhere to strict quality and safety standards, creating cost and compliance challenges. Regulations cover pesticide residue, microbial safety, heavy metals, allergen labeling, and permissible flavor additives. Companies must invest in testing, quality audits, and certification systems such as organic or fair-trade compliance. Differences in regulations across Europe, North America, and Asia increase complexity for exporters. Smaller suppliers face high certification and processing costs, making market entry difficult. Compliance remains essential for brand credibility, but ongoing regulatory tightening continues to challenge operational efficiency and pricing stability.
Regional Analysis
North America
North America holds a strong share of the cocoa powder market, contributing around 27% of global revenue. The region benefits from high chocolate consumption, expanding bakery chains, and steady demand for flavored dairy, cereals, and confectionery snacks. U.S. manufacturers launch sugar-free and organic cocoa products to match clean-label preferences, while café chains increase purchases of specialty cocoa for beverages and desserts. Growing demand for functional foods also supports nutraceutical applications. Strong retail presence, premium chocolate brands, and investments in ethical sourcing keep North America a key revenue-generating region with consistent long-term demand.
Europe
Europe leads the global market with nearly 33% share, supported by its well-established chocolate manufacturing base and presence of premium confectionery brands. Countries such as Germany, Belgium, Switzerland, and the U.K. drive large production volumes for bakery, cakes, biscuits, and ready-to-drink cocoa beverages. Consumers show strong interest in organic, fair-trade, and sustainably sourced cocoa ingredients, encouraging suppliers to maintain certified and traceable supply chains. Demand for artisanal chocolate, gourmet bakery products, and dark cocoa beverages strengthens growth. Europe’s advanced processing technology and long-standing chocolate culture keep the region at the forefront of cocoa powder consumption.
Asia-Pacific
Asia-Pacific is one of the fastest-growing regions, holding about 26% market share with strong expansion in China, India, Japan, and Southeast Asia. Rising disposable income and shifting tastes increase demand for chocolates, instant cocoa drinks, baked goods, and flavored dairy products. International manufacturers expand local production and introduce cocoa-based snacks tailored to regional preferences. Growing café culture and rapid growth of industrial bakeries fuel commercial usage, while specialty dark chocolate gains popularity among young consumers. Urbanization, retail expansion, and increased adoption of premium bakery and confectionery products position Asia-Pacific as a key future growth destination.
Latin America
Latin America accounts for close to 9% of market share, supported by strong cocoa cultivation and chocolate processing activities in Brazil, Mexico, and Ecuador. Local manufacturers produce cocoa powder for confectionery, beverages, and bakery segments, while exports supply global chocolate brands. Premium and organic cocoa varieties gain attention due to high-quality regional bean production. Rising café chains, flavored sweet beverages, and chocolate-based snacks boost domestic demand. However, price volatility and supply fluctuations remain challenges. Despite this, increasing investment in value-added cocoa processing supports long-term growth across regional markets.
Middle East & Africa
The Middle East & Africa generate around 5% share, but the region remains a strategic raw material hub, especially in West Africa, which supplies most of the world’s cocoa beans. Processing capacity is gradually expanding as governments encourage local cocoa grinding and manufacturing. Rising chocolate consumption in Gulf countries, growing bakery demand, and premium import brands support market growth. Product launches in flavored dairy beverages and desserts also increase cocoa use. While infrastructure limitations and price fluctuations affect production costs, increased investment in domestic chocolate manufacturing strengthens regional market potential.Top of Form
Market Segmentations:
By Product Type
- Natural cocoa powder
- Dutch-processed cocoa powder
- Blended cocoa powder
- Cocoa rouge
By Cocoa Variety
- Criollo
- Forastero
- Trinitario
- Nacional
By End Use Industry
- Food and beverage
- Cosmetics and personal care
- Pharmaceutical
- Nutraceuticals
- Others (dyes, inks, coatings)
By Geography
- North America
- U.S.
- Canada
- Mexico
- Europe
- Germany
- France
- U.K.
- Italy
- Spain
- Rest of Europe
- Asia Pacific
- China
- Japan
- India
- South Korea
- South-east Asia
- Rest of Asia Pacific
- Latin America
- Brazil
- Argentina
- Rest of Latin America
- Middle East & Africa
- GCC Countries
- South Africa
- Rest of the Middle East and Africa
Competitive Landscape
The Cocoa Powder Market is characterized by strong competition among multinational chocolate manufacturers, ingredient suppliers, and regional cocoa processors. Established players focus on product quality, sustainable sourcing, and advanced processing technologies to secure long-term supply agreements with confectionery and bakery companies. Leading cocoa processors expand grinding capacity and invest in flavor refinement, alkalization, and low-fat cocoa formulations to meet diverse food and beverage requirements. Companies also strengthen ethical sourcing programs through fair-trade certifications, farmer training initiatives, and traceable supply chains to attract premium buyers. Strategic activities include capacity expansions in Asia and Africa, partnerships with chocolate brands, and new product launches featuring organic or specialty cocoa variants. Regional suppliers compete on pricing and customized blends, offering consistent flavor profiles for industrial bakeries, beverages, and confectionery applications. Continuous innovation, sustainability commitments, and global distribution networks remain key factors shaping competitive positioning in the cocoa powder industry.
Key Player Analysis
- JB Foods
- Cargill
- Cocoacraft
- Plot Enterprise
- Olam Cocoa
- Belcolade
- Cocoa Processing Company
- Blommer
- Newtown Foods USA
- Indcresa
- Barry Callebaut
Recent Developments
- In October 2024, Cargill launched new cocoa production line in Indonesia to meet growing Asian consumers’ demand for indulgent foods. Cargill’s cocoa processing plant in Gresik, the new line brings innovation capabilities and competitiveness to customers in the bakery, ice cream and chocolate confectionery categories, as well as for the café-style beverages in foodservice.
- In November 2022, Barry Callebaut announced the groundbreaking of its third manufacturing facility in India. The new chocolate and compound factory will be in the Ghiloth industrial area, in the city of Neemrana, about 120 km southwest of Delhi.
Report Coverage
The research report offers an in-depth analysis based on Product type, Cocoa variety, End-Use industry and Geography. It details leading market players, providing an overview of their business, product offerings, investments, revenue streams, and key applications. Additionally, the report includes insights into the competitive environment, SWOT analysis, current market trends, as well as the primary drivers and constraints. Furthermore, it discusses various factors that have driven market expansion in recent years. The report also explores market dynamics, regulatory scenarios, and technological advancements that are shaping the industry. It assesses the impact of external factors and global economic changes on market growth. Lastly, it provides strategic recommendations for new entrants and established companies to navigate the complexities of the market.
Future Outlook
- Makers will expand clean-label cocoa powders for health-focused snacks and drinks.
- Brands will launch sugar-free and vegan cocoa products for fitness buyers.
- Food service chains will use premium cocoa powders in bakery and desserts.
- Ready-to-drink cocoa beverages will gain space in retail and vending.
- Producers will adopt sustainable farming and traceable sourcing programs.
- Equipment upgrades will improve flavor, color, and aroma consistency.
- Cocoa powders with higher protein and fiber will support sports nutrition.
- Premium dark cocoa powders will grow in cafes, hotels, and ice-cream shops.
- E-commerce platforms will boost direct sales to small bakeries and home chefs.
- Brands will invest in recyclable packs and lower-energy processing lines.

Request a Free Sample
Fill in your details and we'll send you a free sample report.
- Sample data tables & charts
- Research methodology
Need a Custom Version of This Report?
Tailor the scope, geography, or segments to your exact requirements.
- Custom geography or segment scope
- Direct access to our analyst team
Frequently Asked Questions
What is the current market size for the Cocoa Powder Market, and what is its projected size in 2032?
At what Compound Annual Growth Rate is the Cocoa Powder Market projected to grow between 2025 and 2032?
Which Cocoa Powder Market segment held the largest share in 2024?
What are the primary factors fueling the growth of the Cocoa Powder Market?
Who are the leading companies in the Cocoa Powder Market?
Which region commanded the largest share of the Cocoa Powder Market in 2024?
Table of Content
Chapter 1. Report Introduction
- 1.1 Report Description & Purpose
- 1.1.1 Report Title & Market Definition
- 1.1.2 Unique Selling Propositions (USP) & Key Differentiators
- 1.1.3 Value Proposition for Stakeholders
- 1.2 Research Objectives
- 1.2.1 Market Sizing Objectives (Volume & Revenue) (Volume Where Applicable)
- 1.2.2 Segmentation Objectives
- 1.2.3 Competitive Intelligence Objectives
- 1.2.4 Forecast & Scenario Objectives
- 1.3 Report Scope
- 1.3.1 Cocoa Powder Scope – Segments & Subsegments Covered
- 1.3.2 Geographic Scope – Regions & Countries Covered
- 1.3.3 Historical Period, Base Year & Forecast Period (2024; forecast to 2032)
- 1.3.4 Inclusions & Exclusions
- 1.4 Industry Classification & Applicable Codes
- 1.5 Currency, Measurement Units & Valuation Basis
- 1.6 Target Stakeholders
- 1.7 Limitations & Assumptions
Chapter 2. Executive Summary
- 2.1 Global Cocoa Powder Market Snapshot
- 2.1.1 Market Size – Historical (2024) & Forecast (2024-2032) (2024: USD 22,682 million → 2032: USD 32,803 million)
- 2.1.2 Volume & Revenue – Global Totals (Volume Where Applicable)
- 2.1.3 Key Market Highlights – Top Five Facts
- 2.2 Cocoa Powder Market Segmentation Snapshot
- 2.2.1 Market Split by Region – 2024 vs. 2032
- 2.3 Competitive Snapshot
- 2.3.1 Top 10 Players by Revenue Share – 2024
- 2.3.2 Top 10 Players by Volume Share – 2024 (Volume Where Applicable)
- 2.3.3 Recent Strategic Developments (18-Month Summary)
- 2.4 Key Investment Highlights & Strategic Conclusions
Chapter 3. Cocoa Powder Market Dynamics & Industry Analysis
- 3.1 Market Overview & Context
- 3.1.1 Cocoa Powder Market Position in the Broader Industry Value Chain
- 3.1.2 Demand Structure & Purchasing Dynamics
- 3.1.3 Market Maturity & Development Stage by Region
- 3.2 Cocoa Powder Market Drivers
- 3.3 Cocoa Powder Market Restraints & Challenges
- 3.4 Cocoa Powder Market Opportunities
- 3.5 Porter's Five Forces Analysis
- 3.5.1 Threat of New Entrants
- 3.5.2 Bargaining Power of Suppliers
- 3.5.3 Bargaining Power of Buyers
- 3.5.4 Threat of Substitutes
- 3.5.5 Competitive Rivalry – Intensity Assessment
- 3.6 Cocoa Powder Value Chain Analysis
- 3.6.1 Upstream – Key Inputs, Resources & Suppliers
- 3.6.1.1 Key Input/Resource 1
- 3.6.1.2 Key Input/Resource 2
- 3.6.1.3 Key Input/Resource 3
- 3.6.2 Midstream – Core Operations & Value Creation
- 3.6.2.1 Operating Model & Process Overview
- 3.6.2.2 Key Operating Locations & Capabilities by Company
- 3.6.3 Downstream – Market Channels & End Users
- 3.6.3.1 Direct Sales & Customer Engagement Channels
- 3.6.3.2 Indirect Sales, Intermediaries & Partner Channels
- 3.6.4 Value Chain Profitability Analysis
- 3.6.1 Upstream – Key Inputs, Resources & Suppliers
- 3.7 PESTEL Analysis
- 3.7.1 Political Factors
- 3.7.2 Economic Factors
- 3.7.3 Social Factors
- 3.7.4 Technological Factors
- 3.7.5 Environmental Factors
- 3.7.6 Legal Factors
- 3.8 Cocoa Powder Supply Chain Analysis
- 3.8.1 Critical Input & Resource Availability Risk Assessment
- 3.8.2 Supplier & Operational Concentration Risk (Geographic Exposure)
- 3.8.3 Supply & Service Disruption Impact Analysis
- 3.9 Regulatory & Policy Landscape
Note: The regulatory and policy landscape section covers regulations based on their applicability to the market, Cocoa Powder category, geography, and scope of the study. Only regulatory frameworks with a material impact on operations, compliance, trade, sustainability, or market access are analyzed in detail.
Chapter 4. Key Investment Pockets & Opportunity Analysis
- 4.1 Cocoa Powder Market Attractiveness Analysis
- 4.1.1 By Region – Investment Attractiveness Matrix (Market Size × CAGR)
- 4.2 Absolute Revenue Growth Opportunity
- 4.2.1 By Region – Absolute Revenue Growth Through 2032
- 4.3 Incremental Demand Opportunity
- 4.3.1 By Region – Incremental Demand Through 2032
- 4.3.2 Segment – Incremental Demand
- 4.4 Emerging Submarket Opportunity Deep Dive (Subject to Applicability)
- 4.5 Priority Market Opportunity Scorecards
- 4.5.1 United States
- 4.5.2 Europe
- 4.5.3 Asia
- 4.5.4 Middle East & Africa
Note: Priority market opportunity scorecards reflect the geographic scope and strategic relevance of the study. Listed markets are indicative and may be adapted to the industry.
Chapter 5. Cocoa Powder Cross-Border Trade & Market Access Analysis
- 5.1 International Trade & Cross-Border Activity Overview
- 5.1.1 Global Export Value by Country (2024)
- 5.1.2 Global Export Volume by Country (2024) (Volume Where Applicable)
- 5.1.3 Global Import Value by Country (2024)
- 5.1.4 Global Import Volume by Country (2024) (Volume Where Applicable)
- 5.1.5 Net Trade Balance by Country (2024)
- 5.2 Export Analysis – Segment
- 5.2.1 Category 1 (Applicable Classification Code)
- 5.2.2 Category 2 (Applicable Classification Code)
- 5.2.3 Category 3 (Applicable Classification Code)
- 5.2.4 Category 4 (Applicable Classification Code)
- 5.2.5 Category 5 (Applicable Classification Code)
- 5.3 Import Analysis – Segment
- 5.3.1 Category 1 (Applicable Classification Code)
- 5.3.2 Category 2 (Applicable Classification Code)
- 5.3.3 Category 3 (Applicable Classification Code)
- 5.3.4 Category 4 (Applicable Classification Code)
- 5.3.5 Category 5 (Applicable Classification Code)
- 5.4 Cross-Border Pricing & Transaction Benchmarks
- 5.4.1 Export Pricing – Segment & Country
- 5.4.2 Import Pricing – Segment & Source Country
- 5.4.3 Price Trends (2024)
- 5.5 Key Cross-Border Trade & Delivery Routes
- 5.5.1 Cross-Border Trade/Delivery Route 1
- 5.5.2 Cross-Border Trade/Delivery Route 2
- 5.5.3 Cross-Border Trade/Delivery Route 3
- 5.5.4 Cross-Border Trade/Delivery Route 4
- 5.5.5 Cross-Border Trade/Delivery Route 5
- 5.6 Trade Policy & Market Access Impact Assessment
- 5.6.1 Tariff & Non-Tariff Barriers
- 5.6.2 Regional Trade & Economic Integration Frameworks
- 5.6.3 Bilateral & Multilateral Trade Agreements
- 5.6.4 Cross-Border Operating, Licensing & Localization Requirements
Note: This chapter applies where cross-border trade or delivery is relevant to Cocoa Powder. Goods, services, and digital offerings are assessed using applicable classifications and transaction measures. Import-export volumes, trade balances, and route analyses are included only where meaningful to the market.
Chapter 6. Competitive Landscape & Company Benchmarking
- 6.1 Cocoa Powder Market Concentration & Structure
- 6.1.1 Herfindahl-Hirschman Index (HHI) – vs. 2024
- 6.1.2 Leading, Mid-Sized & Emerging Player Structure
- 6.1.3 Global, Regional & Local Player Dynamics
- 6.2 Cocoa Powder Market Share Analysis – 2024
- 6.2.1 Global Revenue Share by Company
- 6.2.2 Global Volume Share by Company (Volume Where Applicable)
- 6.2.3 Regional Revenue Share
- 6.2.4 Market Share Evolution ( vs. 2024)
- 6.2.5 Company Market Share by Key Segment
- 6.2.6 Company Market Share by Customer Group
- 6.3 Operating Scale, Capacity & Infrastructure Analysis
- 6.3.1 Global Operating Scale & Supply Capacity
- 6.3.2 Resource Utilization & Operating Efficiency
- 6.3.3 Output, Service Delivery & Activity Metrics
- 6.3.4 Operating Footprint & Infrastructure Map
- 6.3.5 Planned Operational & Capacity Expansion
- 6.4 Cocoa Powder Competitive Benchmarking Matrix
- 6.4.1 Revenue, Growth, Profitability & Operating Metric Comparison
- 6.4.2 Channel Revenue Mix
- 6.4.3 Geographic Revenue Exposure
- 6.4.4 R&D Intensity
- 6.4.5 Sustainability Maturity
- 6.5 Strategic Developments in Cocoa Powder (Last 24 Months)
- 6.5.1 Mergers, Acquisitions & Divestments
- 6.5.2 New Products, Services & Solutions in Cocoa Powder
- 6.5.3 Operational & Infrastructure Expansions
- 6.5.4 Strategic Alliances, Joint Ventures & Partnerships
- 6.5.5 Distribution Expansion & Market Entry
- 6.5.6 Sustainability & ESG Initiatives
- 6.6 Competitive Strategy Mapping
- 6.6.1 Leader, Challenger, Follower & Niche Classification
- 6.6.2 Pricing Strategy Comparison
- 6.6.3 Channel Strategy Matrix
Note: Strategic developments are included based on their materiality and the availability of reliable information.
Chapter 7. Global Cocoa Powder Market – By Sales & Delivery Channel
- 7.1 Segment Overview
- 7.1.1 Volume & Revenue Split by Channel (2024 & 2032) (Volume Where Applicable)
- 7.1.2 Channel Mix Evolution (2024-2032)
Chapter 8. Regional Market Analysis – Global Overview
- 8.1 Global Regional Overview
- 8.1.1 Regional Volume Share (Volume Where Applicable)
- 8.1.2 Regional Revenue Share
- 8.1.3 Regional Volume by Region (Volume Where Applicable)
- 8.1.4 Regional Revenue by Region
- 8.1.5 Regional Forecast Through 2032
- 8.2 Cross-Regional Segment Analysis
- 8.2.1 By Sales & Delivery Channel
- 8.2.2 By Competitive Positioning & Price Tier
Chapter 9. North America Cocoa Powder Market
- 9.1 United States
- 9.2 Canada
- 9.3 Mexico
Chapter 10. Europe Cocoa Powder Market
- 10.1 Germany
- 10.2 France
- 10.3 Italy
- 10.4 United Kingdom
- 10.5 Spain
- 10.6 Poland
- 10.7 Russia
- 10.8 Netherlands
- 10.9 Belgium
- 10.10 Sweden
- 10.11 Denmark
- 10.12 Norway
- 10.13 Rest of Europe
Chapter 11. Asia Pacific Cocoa Powder Market
- 11.1 China
- 11.2 India
- 11.3 Japan
- 11.4 South Korea
- 11.5 Thailand
- 11.6 Indonesia
- 11.7 Vietnam
- 11.8 Malaysia
- 11.9 Australia
- 11.10 Rest of Asia Pacific
Chapter 12. Latin America Cocoa Powder Market
- 12.1 Brazil
- 12.2 Argentina
- 12.3 Colombia
- 12.4 Chile
- 12.5 Rest of Latin America
Chapter 13. Middle East Cocoa Powder Market
- 13.1 Saudi Arabia
- 13.2 United Arab Emirates
- 13.3 Turkey
- 13.4 Israel
- 13.5 Iran
- 13.6 Rest of the Middle East
Chapter 14. Africa Cocoa Powder Market
- 14.1 South Africa
- 14.2 Egypt
- 14.3 Nigeria
- 14.4 Morocco
- 14.5 Rest of Africa
Chapter 15. Cocoa Powder Company Profiles
- 15.1 [Company 01]
- 15.1.1 Company Overview
- 15.1.2 Key Management Personnel
- 15.1.3 Products & Services Portfolio
- 15.1.4 Financial Performance
- 15.1.5 Key Market Focus & Geographic Presence
- 15.1.6 Recent Developments & Strategic Initiatives
Note: The company profile list is preliminary and may change based on research findings, market developments, data availability, and client requirements.
Chapter 16. Appendices
- Appendix A – List of Abbreviations & Acronyms
- Appendix B – Industry Classification Code Reference – Full Series
- Appendix C – Supply, Output & Operating Capacity Data Tables
- Appendix D – End-Use & Demand Base Tables
- Appendix E – Demand, Adoption & Usage Assumptions
- Appendix F – Pricing & Revenue Metric Reference Tables
- Appendix G – Company Operations & Infrastructure Database
- Appendix H – Cross-Border Trade & Activity Data Tables (Where Applicable)
- Appendix I – Regulatory Summary Tables
- Appendix J – Primary Research Participant List (Anonymized)
- Appendix K – Primary Research Questionnaire Framework
- Appendix L – Data Sources & Bibliography
- Appendix M – Market Size Divergence & Source Comparison
Chapter 17. Research Methodology
- 17.1 Research Framework & Philosophy
- 17.2 Secondary Research – Sources, Hierarchy & Data Extraction
- 17.3 Data Modeling – Bottom-Up & Top-Down Market Sizing
- 17.4 Primary Research – Stakeholder Framework, LOI & Sample Sizes
- 17.5 Forecast Methodology – Regression, Scenario & Sensitivity Analysis
- 17.6 Quality Control – Four-Layer Validation Framework
- 17.7 Limitations & Standard Assumptions
- 17.8 Disclaimer
