
| REPORT ATTRIBUTE | DETAILS |
|---|---|
| Historical Period | 2020-2023 |
| Base Year | 2024 |
| Forecast Period | 2025-2032 |
| Collateralized Debt Obligation Market Size 2024 | USD 513.39 Million |
| Collateralized Debt Obligation Market, CAGR | 6.28% |
| Collateralized Debt Obligation Market Size 2032 | USD 865.20 Million |
Market Overview
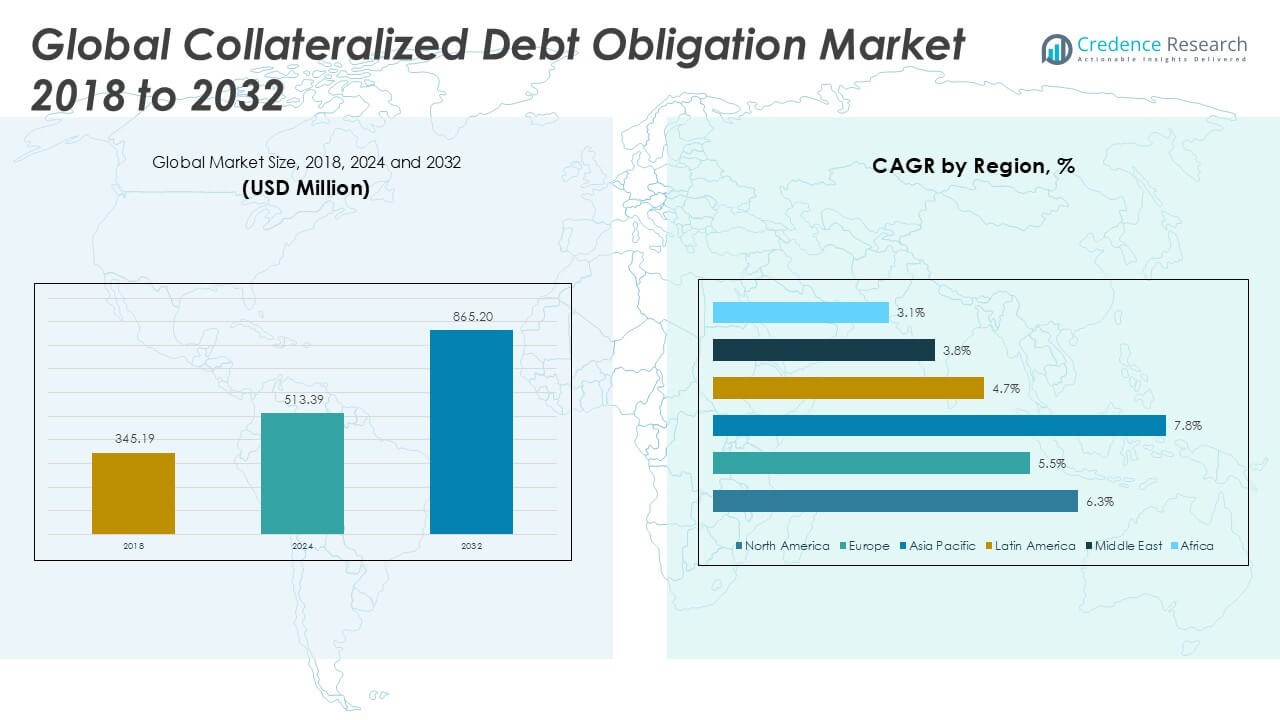
The Collateralized Debt Obligation market size was valued at USD 345.19 million in 2018, increased to USD 513.39 million in 2024, and is anticipated to reach USD 865.20 million by 2032, at a CAGR of 6.28% during the forecast period.
The Collateralized Debt Obligation (CDO) market is led by major financial institutions such as J.P. Morgan, Citigroup, Bank of America, Goldman Sachs, and Morgan Stanley, which possess deep expertise in structured finance and global distribution networks. European players including Barclays, Deutsche Bank, and Credit Suisse contribute significantly, particularly in cross-border structuring and investment banking services. Asset management giants like BlackRock and Carlyle Group play a critical role in managing CLO portfolios tailored for institutional investors. North America stands out as the dominant region, holding a 41.3% market share in 2024, driven by a mature financial ecosystem and high investor appetite for structured credit products. The region’s leadership is further supported by favorable regulatory conditions and innovation in credit structuring.
Market Insights
- The Collateralized Debt Obligation (CDO) market was valued at USD 513.39 million in 2024 and is projected to reach USD 865.20 million by 2032, growing at a CAGR of 6.28% during the forecast period.
- Rising demand for high-yield investment products and the expanding role of asset managers and private equity firms are driving market growth, with CLOs holding the largest type-based market share.
- ESG-compliant structured finance products and increased securitization in emerging markets are shaping key market trends, attracting a broader investor base.
- The market is highly competitive, led by firms such as J.P. Morgan, Citigroup, Bank of America, and BlackRock, which focus on innovation, global structuring, and tailored investment strategies.
- North America leads the regional landscape with a 41.3% market share in 2024, followed by Europe (27.7%) and Asia Pacific (22.2%), while Latin America, the Middle East, and Africa collectively contribute a smaller portion.
Market Segmentation Analysis:
By Type:
The Collateralized Loan Obligations (CLOs) segment dominates the Collateralized Debt Obligation (CDO) market by type, accounting for the largest revenue share in 2024. CLOs remain the preferred instrument due to their strong credit performance, diversified loan pools, and attractive yields, especially during periods of economic expansion. Institutional investors favor CLOs for their risk-adjusted returns and structured protections against defaults. Collateralized Bond Obligations (CBOs) hold a notable share in the market, primarily driven by increased demand for structured bond products that offer credit diversification and tailored risk profiles. Collateralized Synthetic Obligations (CSOs) and Structured Finance CDOs (SFCDOs) occupy niche segments, with limited uptake due to their complex nature and sensitivity to credit default swaps and derivative structures. Investor caution and tighter regulations on synthetic products continue to restrain broader market penetration for these sub-types.
- For instance, in 2023, Blackstone Credit priced $1.16 billion worth of CLOs through its Blackstone US CLO Issuer platform, marking one of the year’s largest transactions in the U.S. CLO market.
By Application
Asset Management Companies represent the leading application segment in the global CDO market, holding the highest revenue share in 2024. Their dominance stems from their expansive investment portfolios and growing interest in high-yield, structured debt products to optimize returns. These firms leverage advanced risk modeling and analytics to efficiently manage and monitor complex CDO investments. Fund Companies also contribute significantly, particularly those targeting income-oriented strategies. The “Others” segment includes banks and insurance firms, which use CDOs for portfolio diversification and yield enhancement, though regulatory constraints have limited their expansion relative to asset managers.
- For instance, PGIM Fixed Income, the asset management arm of Prudential Financial, managed over $98 billion in CLO assets globally as of 2023, using AI-enhanced models to monitor over 1,000 leveraged loans daily for credit stress testing.
Key Growth Drivers
Rising Demand for High-Yield Investment Products
The growing appetite among institutional investors for high-yield, structured fixed-income products is a major driver of the Collateralized Debt Obligation (CDO) market. Investors, including pension funds, hedge funds, and insurance firms, are increasingly allocating capital to CDOs to diversify portfolios and enhance returns in a low-interest-rate environment. CLOs, in particular, offer attractive yields with managed risk exposure, making them an appealing choice. This demand continues to rise as traditional bond markets underperform, encouraging fund managers to explore structured finance instruments like CDOs.
- For instance, Carlyle Group’s Global Credit platform issued 24 CLOs globally in 2023, totaling over $12.5 billion in new issuance, reflecting investor demand for leveraged loan exposure.
Technological Advancements in Risk Assessment and Analytics
Innovations in financial modeling, data analytics, and AI-driven risk assessment tools have significantly boosted the credibility and adoption of CDOs. These technologies enable issuers and investors to better evaluate underlying asset pools, monitor credit risk, and model complex cash flows more accurately. Enhanced transparency and precision in structuring these instruments have increased investor confidence, especially in complex products like synthetic obligations. Improved analytics also support compliance with evolving regulatory standards, further accelerating the use of CDOs in professional investment portfolios.
- For instance, Moody’s Analytics CLO Navigator platform processed over 10 million loan-level scenarios monthly in 2023, helping institutional clients perform real-time stress testing and scenario analysis.
Expanding Role of Asset Management and Private Equity Firms
The expanding footprint of asset management and private equity firms has significantly contributed to the growth of the CDO market. These institutions actively deploy structured finance instruments like CLOs and CBOs to manage leveraged buyouts and generate stable income streams. As private capital inflows increase globally, these firms are leveraging their financial engineering capabilities to create bespoke CDO structures tailored to specific investor risk-return preferences. Their growing participation not only boosts transaction volumes but also fosters innovation in structuring and managing CDO portfolios.
Key Trends & Opportunities
Shift Toward ESG-Compliant Structured Products
A notable trend in the CDO market is the emergence of ESG-compliant structures, especially within CLO portfolios. Investors are increasingly seeking alignment with environmental, social, and governance (ESG) principles without compromising returns. Issuers are responding by embedding ESG filters in the underlying loan selection process and providing transparency through sustainability reporting. This trend creates new market opportunities by attracting a broader class of socially responsible investors and helping institutions meet ESG mandates while participating in structured finance markets.
- For instance, Apollo Global Management launched its first ESG CLO in Europe in 2023, integrating over 400 ESG scoring indicators to screen loan eligibility within its $1.2 billion portfolio.
Increased Securitization in Emerging Markets
Emerging economies are witnessing growing adoption of securitized products, including CDOs, driven by evolving financial markets and regulatory frameworks. As banks in these regions look to free up capital and manage credit risk, securitization through CDOs becomes a viable strategy. This creates opportunities for global investors to tap into high-growth markets through diversified asset pools. With improving infrastructure and legal systems, countries in Asia-Pacific and Latin America present untapped potential for future CDO issuance and investment.
- For instance, in 2023, ICICI Bank and Standard Chartered co-arranged India’s first domestic CLO backed by mid-market SME loans, totaling ₹7.8 billion and rated by CRISIL and ICRA.
Key Challenges
Regulatory Scrutiny and Compliance Burden
The CDO market continues to face stringent regulatory oversight, especially following the 2008 financial crisis. Compliance with Basel III, Dodd-Frank, and other global financial regulations demands greater transparency, detailed disclosures, and risk retention by issuers. These requirements increase operational complexity and costs, potentially discouraging new entrants and limiting product innovation. The burden of regulatory compliance remains a key challenge for market participants aiming to scale their CDO offerings while maintaining investor confidence.
Perception of Complexity and Risk Among Investors
Despite structural improvements, CDOs-particularly synthetic and structured finance types-retain a perception of being overly complex and risky. Many investors remain cautious due to their association with past financial market failures. Limited understanding of tranche structures, credit enhancements, and cash flow waterfalls hinders broader adoption. This perception challenge restricts market growth to mainly sophisticated institutions, reducing retail participation and slowing expansion into new investor segments.
Market Volatility and Credit Cycle Sensitivity
CDOs are highly sensitive to macroeconomic conditions and the broader credit cycle. During periods of economic downturn or market volatility, default rates among underlying assets can rise, impacting the performance of CDO tranches. This volatility affects investor sentiment and often results in reduced issuance or demand for new deals. Fluctuating interest rates, geopolitical tensions, and financial instability in key economies continue to pose challenges to the market’s sustained growth trajectory.
Regional Analysis
North America
North America holds the largest share in the global Collateralized Debt Obligation market, accounting for approximately 41.3% of the total revenue in 2024, with a market size of USD 211.99 million, up from USD 144.10 million in 2018. The region is projected to reach USD 358.29 million by 2032, growing at a CAGR of 6.3%. The dominance of North America is driven by a mature financial infrastructure, strong presence of institutional investors, and robust demand for Collateralized Loan Obligations (CLOs). The United States remains the primary contributor, supported by favorable regulatory frameworks and a dynamic private credit market.
Europe
Europe ranks as the second-largest regional market, holding a 27.7% share in 2024 with a valuation of USD 142.27 million, compared to USD 99.19 million in 2018. The region is anticipated to grow at a CAGR of 5.5%, reaching USD 225.92 million by 2032. European growth is supported by increasing interest in structured finance products and ongoing development of secondary CDO markets. Regulatory alignment across the EU and expansion of ESG-focused CLOs have further encouraged institutional investments. Countries like the UK, Germany, and France are key contributors due to their advanced financial ecosystems and strong demand for high-yield instruments.
Asia Pacific
Asia Pacific demonstrates the highest growth potential in the global Collateralized Debt Obligation market, recording a CAGR of 7.8%. Its market size rose from USD 71.23 million in 2018 to USD 114.22 million in 2024 and is projected to reach USD 216.40 million by 2032. Holding a 22.2% market share in 2024, the region’s expansion is fueled by evolving financial markets in China, India, and Southeast Asia. Rising capital inflows, expanding asset management activities, and increasing securitization efforts are driving demand for CDOs. Regulatory modernization and digital financial infrastructure further support market penetration in emerging economies.
Latin America
Latin America captures a modest but growing share of 4.7% in the global CDO market, with a market size increasing from USD 16.61 million in 2018 to USD 24.40 million in 2024. It is expected to reach USD 36.49 million by 2032, growing at a CAGR of 4.7%. Brazil and Mexico lead regional activity, driven by increased interest in structured finance and efforts to attract global investment. The region’s growth remains tempered by economic volatility and regulatory limitations, though initiatives to deepen local capital markets and improve financial literacy among institutional investors are expected to improve long-term prospects.
Middle East
The Middle East held a 2.4% market share in 2024, with its CDO market valued at USD 12.23 million, up from USD 9.06 million in 2018. The market is forecasted to reach USD 17.16 million by 2032, growing at a CAGR of 3.8%. Growth in the region is primarily concentrated in financial hubs such as the UAE and Saudi Arabia, where reforms and economic diversification efforts are fostering structured investment instruments. While the region’s adoption remains limited compared to global leaders, ongoing investment in financial services and regulatory modernization is expected to gradually boost CDO issuance and uptake.
Africa
Africa represents the smallest regional segment, accounting for a 1.6% share of the global CDO market in 2024. The market expanded from USD 5.01 million in 2018 to USD 8.28 million in 2024 and is projected to reach USD 10.94 million by 2032, reflecting a CAGR of 3.1%. South Africa leads the region, supported by its relatively developed financial sector. However, limited awareness, underdeveloped capital markets, and regulatory hurdles constrain broader market growth. Nonetheless, gradual financial inclusion, digital banking expansion, and international collaboration could foster greater adoption of structured debt instruments in the long term.
Market Segmentations:
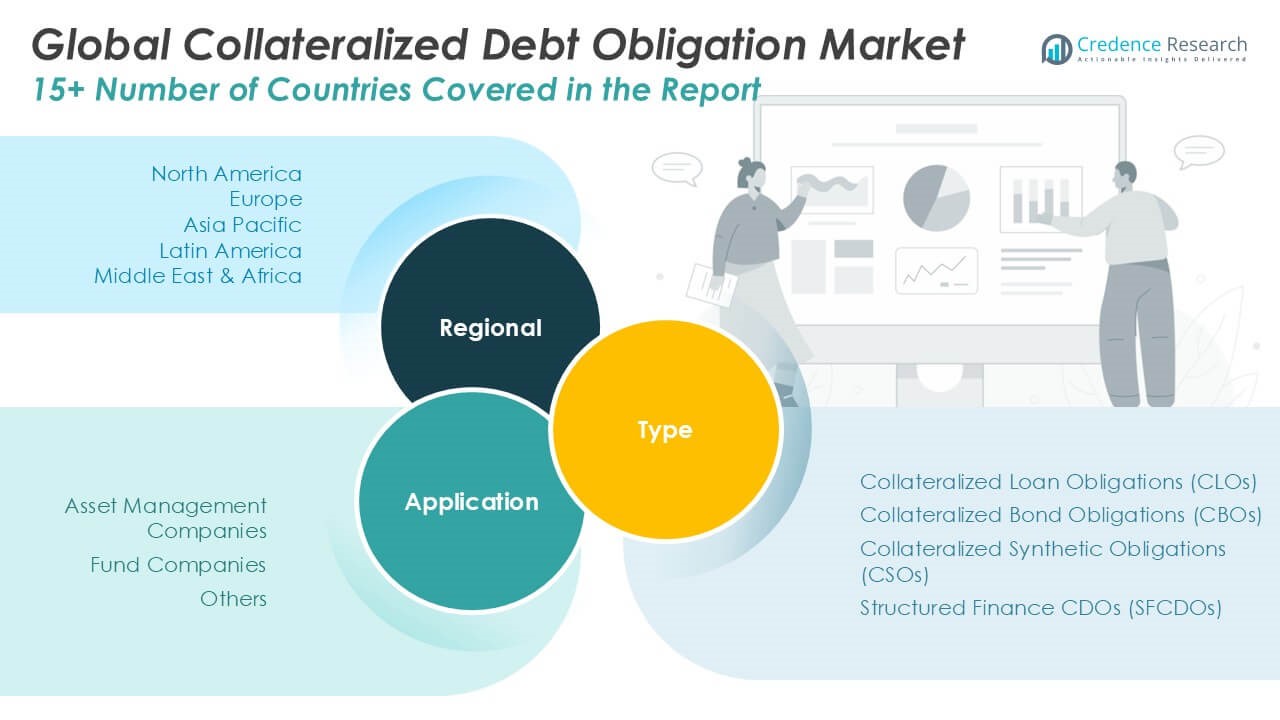
By Type:
- Collateralized Loan Obligations (CLOs)
- Collateralized Bond Obligations (CBOs)
- Collateralized Synthetic Obligations (CSOs)
- Structured Finance CDOs (SFCDOs)
By Application:
- Asset Management Companies
- Fund Companies
- Others
By Geography:
- North America
- Europe
- Asia Pacific
- Latin America
- Middle East
- Africa
Competitive Landscape
The competitive landscape of the Collateralized Debt Obligation (CDO) market is dominated by a select group of global financial institutions and asset management firms with robust structured finance capabilities. Leading players such as J.P. Morgan, Citigroup, Bank of America, Goldman Sachs, and Morgan Stanley leverage their extensive underwriting experience, diversified investment portfolios, and advanced analytics to maintain a strong market presence. European firms like Barclays, Deutsche Bank, and Credit Suisse also play a significant role, particularly in cross-border issuance and bespoke CDO structuring. Asset managers including BlackRock and Carlyle Group are increasingly influential, offering tailored CLO strategies to meet institutional investor demand for high-yield fixed-income products. These players compete based on product innovation, risk-adjusted returns, transparency, and regulatory compliance. Strategic partnerships, mergers, and acquisitions are commonly employed to expand market share and geographic reach. The landscape remains dynamic, with growing focus on ESG integration and digital risk assessment tools shaping future competition.
Key Player Analysis
- J.P. Morgan
- Citigroup
- Bank of America
- Goldman Sachs
- Morgan Stanley
- Barclays
- Deutsche Bank
- Wells Fargo
- Credit Suisse
- BlackRock
- Carlyle Group
Recent Developments
- In July 2025, J.P. Morgan completed the largest private credit CLO (PCLO) of the year, a $1.25 billion deal for HELND. This move exemplifies the bank’s strategy to securitize illiquid assets into tradable instruments, targeting institutional investors with investment-grade tranches and capitalizing on regulatory shifts and market dislocations.
- In February 2024, Goldman Sachs has been actively backstopping the riskiest (equity) slices of new CLOs. By temporarily holding onto these high-risk tranches, Goldman Sachs aims to win more CLO arrangement mandates and gain market share as the CLO business rebounds. This strategy involves underwriting the equity portions, which offer higher returns but are last to be repaid and can be challenging to sell.
- In February 2024, Morgan Stanley, like Goldman Sachs, is increasingly willing to underwrite and temporarily hold the equity tranches of new CLOs to secure more deals. This approach is part of a broader push to dominate the CLO structuring and arranging space as market activity intensifies.
Market Concentration & Characteristics
The Collateralized Debt Obligation Market exhibits a high level of market concentration, with a few major global financial institutions and asset management firms controlling a significant portion of issuance and investment activity. It is characterized by complex financial engineering, structured risk allocation, and a preference for customized solutions tailored to institutional investors. The market favors players with advanced analytics, regulatory expertise, and global distribution capabilities. J.P. Morgan, Citigroup, Bank of America, Goldman Sachs, and BlackRock dominate through their strong underwriting, portfolio management, and investor outreach functions. It relies heavily on investor confidence, robust credit modeling, and transparency across asset tranches. Product innovation, especially in ESG-compliant and synthetic structures, plays a growing role in shaping its direction. The demand is primarily driven by institutional clients seeking diversified, high-yield instruments within managed risk frameworks. Regional differences influence structure types and compliance standards, but North America continues to account for the largest share due to its financial maturity and regulatory clarity.
Report Coverage
The research report offers an in-depth analysis based on Type, Application and Geography. It details leading market players, providing an overview of their business, product offerings, investments, revenue streams, and key applications. Additionally, the report includes insights into the competitive environment, SWOT analysis, current market trends, as well as the primary drivers and constraints. Furthermore, it discusses various factors that have driven market expansion in recent years. The report also explores market dynamics, regulatory scenarios, and technological advancements that are shaping the industry. It assesses the impact of external factors and global economic changes on market growth. Lastly, it provides strategic recommendations for new entrants and established companies to navigate the complexities of the market.
Future Outlook
- The Collateralized Debt Obligation market is expected to witness steady growth driven by rising institutional demand for structured fixed-income products.
- Collateralized Loan Obligations will continue to dominate the product segment due to their strong performance and risk-adjusted return profile.
- Adoption of ESG-integrated CDO structures will increase as investors prioritize sustainable and responsible investing strategies.
- Advancements in data analytics and AI tools will enhance risk modeling and improve investor confidence in complex debt instruments.
- Asset management and private equity firms will expand their role in CDO issuance and portfolio management.
- Regulatory developments will influence market dynamics, with a focus on transparency, compliance, and investor protection.
- Emerging markets will provide new opportunities for growth as financial systems modernize and securitization gains traction.
- Market competition will intensify with increased product innovation and strategic partnerships among key players.
- Investor education and improved financial literacy will support broader acceptance of structured finance products.
- Economic cycles and credit market conditions will continue to impact CDO issuance volumes and investor sentiment.

Request a Free Sample
Fill in your details and we'll send you a free sample report.
- Sample data tables & charts
- Research methodology
Market Dynamics
Institutional Appetite for High-Yield Structured Products
Institutional investors such as pension funds, insurance companies, and hedge funds are increasingly allocating capital to CDOs, particularly CLOs, to diversify portfolios and enhance returns in a low-interest-rate environment. This demand is driven by the attractive risk-adjusted yields and structured protections these instruments offer.
Technological Advancements in Risk Analytics
The adoption of advanced data analytics, AI-driven risk assessment, and real-time credit modeling tools has improved transparency and risk management in CDO structuring. These innovations boost investor confidence and facilitate compliance with evolving regulatory standards, supporting broader market adoption.
Expansion of Asset Management and Private Equity Participation
Asset management and private equity firms are playing a larger role in CDO issuance and portfolio management, leveraging their expertise to create bespoke structures tailored to investor needs. Their growing involvement increases transaction volumes and fosters product innovation.
Emergence of ESG-Compliant CDO Structures
The integration of environmental, social, and governance (ESG) criteria into CDO portfolios is attracting a new class of socially responsible investors. Issuers are embedding ESG filters and transparency measures, expanding the investor base and aligning with global sustainability trends.
Securitization Growth in Emerging Markets
Financial market modernization and regulatory reforms in emerging economies are driving increased adoption of securitized products, including CDOs. This creates new opportunities for global investors to access diversified asset pools in high-growth regions, further expanding the market.
Need a Custom Version of This Report?
Tailor the scope, geography, or segments to your exact requirements.
- Custom geography or segment scope
- Direct access to our analyst team
Frequently Asked Questions
What is the current size of the Collateralized Debt Obligation Market?
What factors are driving the growth of the Collateralized Debt Obligation Market?
What are the key segments within the Collateralized Debt Obligation Market?
What are some challenges faced by the Collateralized Debt Obligation Market?
Who are the major players in the Collateralized Debt Obligation Market?
Table of Content
Chapter 1 Market Segmentation
- 1.1 Segmentation Framework
- 1.1.1 Product and Service Classification
- 1.1.2 Application and End-Use Classification
- 1.1.3 Technology and Solution Classification
- 1.1.4 Customer and Distribution Channel Classification
- 1.1.5 Geographic Segmentation
- 1.1.6 Market Segment Definitions and Boundaries
- 1.2 By Type
- 1.2.1 Collateralized Loan Obligations (CLOs)
- 1.2.2 Collateralized Bond Obligations (CBOs)
- 1.2.3 Collateralized Synthetic Obligations (CSOs)
- 1.2.4 Structured Finance CDOs (SFCDOs)
- 1.3 By Application
- 1.3.1 Asset Management Companies
- 1.3.2 Fund Companies
- 1.3.3 Others
Chapter 2 Introduction
- 2.1 Report Objectives and Scope
- 2.2 Product Definition and Industry Terminology
- 2.3 Market Inclusions and Exclusions
- 2.4 Research Process
- 2.4.1 Primary Research and Expert Interviews
- 2.4.2 Secondary Research and Source Review
- 2.4.3 Top-Down and Bottom-Up Estimation
- 2.4.4 Data Triangulation and Verification
- 2.5 Market Size Measurement Basis
- 2.5.1 2024: USD 513.39 million → 2032: USD 865.20 million
- 2.6 Historical and Forecast Reference Periods
- 2.6.1 Base Year: 2024
- 2.6.2 Forecast Period: 2024-2032
- 2.7 Research Assumptions and Limitations
Chapter 3 Executive Summary
- 3.1 Market Snapshot and Key Findings
- 3.2 Base-Year Market Size, 2024
- 3.3 Forecast Market Size, 2032
- 3.4 Revenue and Volume Growth Outlook
- 3.5 Key Demand and Supply Indicators
- 3.6 Leading Market Segments
- 3.7 Fastest-Growing Market Opportunities
- 3.8 Regional Performance Highlights
- 3.9 Technology and Industry Transformation
- 3.10 Competitive Landscape Summary
- 3.11 Analyst View and Strategic Implications
Chapter 4 Global Collateralized Debt Obligation Market Trends and Developments
- 4.1 Historical Industry Development
- 4.2 Recent Market Trends and Developments
- 4.3 Demand and Customer Behavior Trends
- 4.4 Technology and Product Innovation
- 4.5 Artificial Intelligence, Automation and Digitalization
- 4.6 Local Manufacturing and Supply Chain Realignment
- 4.7 Industry Partnerships, Mergers and Acquisitions
- 4.8 Sustainability and Circular Economy Developments
- 4.9 Government and Private Sector Investment Trends
- 4.10 Emerging Business Models and Commercialization
- 4.11 Industry Developments and Announcements
Chapter 5 Global Collateralized Debt Obligation Market Supply and Demand Analysis
- 5.1 Demand Trend and Consumption Analysis
- 5.2 Demand Forecast, 2024-2032
- 5.3 Supply Chain Structure and Procurement Trends
- 5.4 Supply-Demand Gap and Bottlenecks
- 5.5 Import Dependence and Sourcing Structure
- 5.6 Regional Supply and Demand Concentration
Chapter 6 Global Collateralized Debt Obligation Market Pricing Analysis
- 6.1 Pricing Structure and Measurement
- 6.2 Historical Pricing Trends
- 6.3 Pricing Outlook, 2024-2032
- 6.4 Pricing by Product and Market Segment
- 6.5 Geographic Pricing Differences
- 6.6 Key Input, Energy, Labor and Logistics Costs
- 6.7 Contract Pricing and Purchasing Models
- 6.8 Pricing Sensitivity and Competitive Positioning
- 6.9 Price, Margin and Profitability Implications
Chapter 7 Global Collateralized Debt Obligation Market Dynamics
- 7.1 Market Growth Drivers
- 7.1.1 Demand-Side Drivers
- 7.1.2 Technology and Innovation Drivers
- 7.1.3 Infrastructure and Investment Drivers
- 7.1.4 Regulatory and Policy Drivers
- 7.2 Market Restraints
- 7.2.1 Cost and Affordability Constraints
- 7.2.2 Technology and Adoption Barriers
- 7.2.3 Supply Chain and Operational Constraints
- 7.3 Market Challenges
- 7.3.1 Competitive Pressure and Margin Erosion
- 7.3.2 Skills, Infrastructure and Implementation Gaps
- 7.4 Emerging Market Opportunities
- 7.5 Market Dynamics Impact and Time-Horizon Assessment
Chapter 8 Global Collateralized Debt Obligation Value Chain Analysis
- 8.1 Industry Value Chain Overview
- 8.2 Upstream Suppliers and Critical Inputs
- 8.3 Technology and Component Providers
- 8.4 Manufacturing or Service Delivery
- 8.5 Distribution, Channel Partners and Integrators
- 8.6 Downstream Applications and End Users
- 8.7 Value Addition and Profit Pools
- 8.8 Vertical Integration and Outsourcing
- 8.9 Supplier Concentration and Risk
- 8.10 Supply Chain Localization and Resilience
Chapter 9 Global Collateralized Debt Obligation Market Regulations and Policies
- 9.1 Relevant Laws, Standards and Compliance Frameworks
- 9.2 Product, Service, Safety and Quality Requirements
- 9.3 Government Policies, Incentives and Subsidies
- 9.4 Imports, Exports and Trade Barriers
- 9.5 Public Procurement and Local Content Requirements
- 9.6 Data Protection, AI and Cybersecurity Compliance
- 9.7 Upcoming Policy Changes and Market Implications
Chapter 10 Global Collateralized Debt Obligation Market Hotspots and Opportunities
- 10.1 Market Opportunity Mapping and Growth Hotspots
- 10.2 High-Growth Applications and Customer Groups
- 10.3 Underserved Markets and White-Space Opportunities
- 10.4 Emerging Technology and Product Opportunities
- 10.5 New Capacity and Investment Hotspots
- 10.6 Market Entry and Expansion Opportunities
- 10.7 Distribution and Partnership Opportunities
- 10.8 Near-Term and Long-Term Commercial Potential
- 10.9 Opportunity Attractiveness and Execution Risks
Chapter 11 Global Collateralized Debt Obligation Market Outlook, 2024-2032
- 11.1 Market Size and Analysis
- 11.1.1 Revenue (Market Measurement: 2024: USD 513.39 million → 2032: USD 865.20 million)
- 11.1.2 Historical Market Size
- 11.1.3 Base-Year Market Size, 2024
- 11.2 Market Forecast, 2024-2032
- 11.2.1 Revenue Forecast to 2032
- 11.2.2 CAGR and Year-on-Year Growth
- 11.2.3 Incremental Revenue Opportunity
- 11.3 Forecast Assumptions and Scenario Analysis
- 11.3.1 Base-Case Forecast
- 11.3.2 Optimistic and Conservative Scenarios
- 11.3.3 Technology, Pricing and Policy Sensitivities
- 11.4 Market Attractiveness and Growth Outlook
Chapter 12 Global Collateralized Debt Obligation Market Segmentation and Outlook
- 12.1 Segmentation Summary and Market Shares, 2024
- 12.2 Largest and Fastest-Growing Segments
- 12.3 By Type - Market Size and Forecast, 2024-2032
- 12.3.1 Segment Definition and Scope
- 12.3.2 Historical Market Size
- 12.3.3 Revenue Forecast, 2024-2032
- 12.3.4 Base-Year Market Share, 2024
- 12.3.5 Segment CAGR and Growth Drivers
- 12.3.6 Subsegment Market Size and Forecast
- 12.3.6.1 Collateralized Loan Obligations (CLOs)
- 12.3.6.2 Collateralized Bond Obligations (CBOs)
- 12.3.6.3 Collateralized Synthetic Obligations (CSOs)
- 12.3.6.4 Structured Finance CDOs (SFCDOs)
- 12.3.7 Subsegment Pricing and Adoption Trends
- 12.3.8 Leading Suppliers and Competition
- 12.3.9 Regional Demand and Opportunities
- 12.4 By Application - Market Size and Forecast, 2024-2032
- 12.4.1 Segment Definition and Scope
- 12.4.2 Historical Market Size
- 12.4.3 Revenue Forecast, 2024-2032
- 12.4.4 Base-Year Market Share, 2024
- 12.4.5 Segment CAGR and Growth Drivers
- 12.4.6 Subsegment Market Size and Forecast
- 12.4.6.1 Asset Management Companies
- 12.4.6.2 Fund Companies
- 12.4.6.3 Others
- 12.4.7 Subsegment Pricing and Adoption Trends
- 12.4.8 Leading Suppliers and Competition
- 12.4.9 Regional Demand and Opportunities
- 12.5 Segment Growth Comparison
- 12.6 Segment Attractiveness and Priority Matrix
Chapter 13 Global Collateralized Debt Obligation End-Use and Application Market Outlook
- 13.1 End-Use Industry and Customer Demand Structure
- 13.2 Leading Applications and Customer Groups
- 13.3 End-Use Market Size, Share and Forecast
- 13.4 Major End-Use Industry Deep Dives
- 13.4.1 Customer Requirements and Use Cases
- 13.4.2 Demand and Replacement Cycles
- 13.4.3 Technical and Regulatory Considerations
- 13.4.4 Purchasing and Procurement Models
- 13.4.5 Leading Vendors and Distribution Channels
- 13.4.6 Forecast and Commercial Opportunities
- 13.5 Emerging Applications and Cross-Segment Demand
- 13.6 End-Use Industry Investment Priorities
Chapter 14 Global Collateralized Debt Obligation Geographic Market Outlook, 2024-2032
- 14.1 Regional Market Size and Share, 2024
- 14.2 Regional Market Forecast, 2024-2032
- 14.3 Regional Pricing, Production and Demand Differences
- 14.4 North America
- 14.4.1 United States
- 14.4.2 Canada
- 14.4.3 Mexico
- 14.5 Europe
- 14.5.1 Germany
- 14.5.2 France
- 14.5.3 Italy
- 14.5.4 United Kingdom
- 14.5.5 Spain
- 14.5.6 Poland
- 14.5.7 Russia
- 14.5.8 Netherlands
- 14.5.9 Belgium
- 14.5.10 Sweden
- 14.5.11 Denmark
- 14.5.12 Norway
- 14.5.13 Rest of Europe
- 14.6 Asia Pacific
- 14.6.1 China
- 14.6.2 India
- 14.6.3 Japan
- 14.6.4 South Korea
- 14.6.5 Thailand
- 14.6.6 Indonesia
- 14.6.7 Vietnam
- 14.6.8 Malaysia
- 14.6.9 Australia
- 14.6.10 Rest of Asia Pacific
- 14.7 Latin America
- 14.7.1 Brazil
- 14.7.2 Argentina
- 14.7.3 Colombia
- 14.7.4 Chile
- 14.7.5 Rest of Latin America
- 14.8 Middle East
- 14.8.1 Saudi Arabia
- 14.8.2 United Arab Emirates
- 14.8.3 Turkey
- 14.8.4 Israel
- 14.8.5 Iran
- 14.8.6 Rest of the Middle East
- 14.9 Africa
- 14.9.1 South Africa
- 14.9.2 Egypt
- 14.9.3 Nigeria
- 14.9.4 Morocco
- 14.9.5 Rest of Africa
- 14.10 Regional Investment, Policy and Supply Chain Differences
- 14.11 Regional Competitive Landscape
- 14.12 Geographic Growth Hotspots
Chapter 15 Global Collateralized Debt Obligation Technology, Innovation and Sustainability Outlook
- 15.1 Technology Landscape and Maturity
- 15.2 Product, Process and Service Innovation
- 15.3 AI, Automation and Digital Tools in the Industry
- 15.4 Technology Adoption and Performance Benchmarking
- 15.5 Innovation Pipeline and R&D Investment
- 15.6 Energy Efficiency and Resource Management
- 15.7 Sustainability, Recycling and Circularity
- 15.8 Technology Roadmap, 2024-2032
- 15.9 Risks of Obsolescence and Technology Substitution
Chapter 16 Global Collateralized Debt Obligation Market Key Strategic Imperatives
- 16.1 Growth and Market Entry Priorities
- 16.2 High-Return Products and Segments
- 16.3 Pricing, Profitability and Cost Optimization
- 16.4 Technology Investment and Product Differentiation
- 16.5 Supply Chain Localization and Resilience
- 16.6 Distribution and Customer Acquisition
- 16.7 Partnership, Acquisition and Capacity Strategy
- 16.8 Regional Expansion Priorities
- 16.9 Short-, Medium- and Long-Term Actions
Chapter 17 Competition Outlook
- 17.1 Industry Competition Characteristics
- 17.2 Market Structure and Concentration
- 17.3 Market Share and Competitive Positioning, 2024
- 17.4 Company-Wise Revenue and Product Benchmarking
- 17.5 Production and Service Capacity Benchmarking
- 17.6 Technology, Pricing and Differentiation
- 17.7 Regional Footprint and Distribution Strength
- 17.8 Mergers, Acquisitions and Strategic Alliances
- 17.9 New Entrants and Competitive Threats
- 17.10 Porter's Five Forces and Industry Attractiveness
- 17.11 Competitive Outlook, 2024-2032
Chapter 18 Company Profiles
- 18.1 Company Coverage and Selection Criteria
- 18.2 J.P. Morgan
- 18.2.1 Business Description
- 18.2.2 Company Ownership and Geographic Presence
- 18.2.3 Product and Service Portfolio
- 18.2.4 Manufacturing and Operating Footprint
- 18.2.5 Financial Performance and Investment
- 18.2.6 Market Share and Competitive Position
- 18.2.7 Technology and Innovation Capabilities
- 18.2.8 Strategic Alliances or Partnerships
- 18.2.9 Recent Developments
- 18.2.10 Growth Strategy and Outlook
- 18.3 Citigroup
- 18.4 Bank of America
- 18.5 Goldman Sachs
- 18.6 Morgan Stanley
- 18.7 Barclays
- 18.8 Deutsche Bank
- 18.9 Credit Suisse
- 18.10 BlackRock
- 18.11 Carlyle Group
- 18.12 Other Relevant Market Participants
Note: Every listed company is profiled on the structure shown under the first company. The company list is preliminary and may change based on research findings, market developments, data availability and client requirements.
Chapter 19 Disclaimer
- 19.1 Research and Forecast Disclaimer
- 19.2 Data Source and Estimation Limitations
Note: The depth of individual sections depends on data availability for this market. Volume, capacity, trade and other unit-based metrics are included where applicable.

