
Market Overview
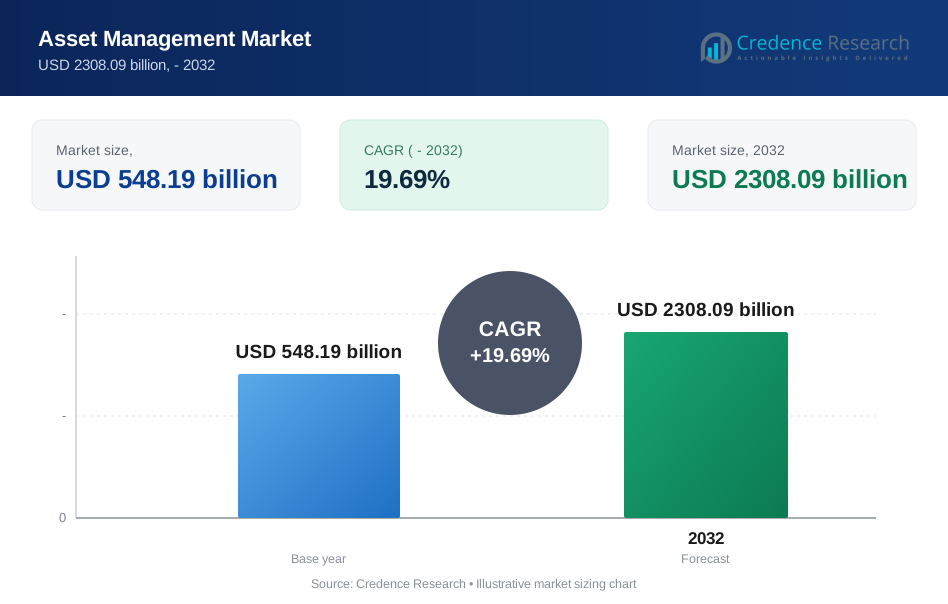
Global Asset Management Market size was valued USD 548.19 billion in 2024 and is anticipated to reach USD 2308.09 billion by 2032, at a CAGR of 19.69% during the forecast period.
| REPORT ATTRIBUTE | DETAILS |
|---|---|
| Historical Period | 2020-2023 |
| Base Year | 2024 |
| Forecast Period | 2025-2032 |
| Asset Management Market Size 2024 | USD 548.19 Billion |
| Asset Management Market, CAGR | 19.69% |
| Asset Management Market Size 2032 | USD 2308.09 Billion |
The Global Asset Management Market is shaped by major multinational firms such as Hitachi, Rockwell Automation, Zebra Technologies, IBM, Honeywell, Oracle, WSP Global, Siemens, Adobe, and Brookfield Asset Management. These companies drive innovation by embedding artificial intelligence, cloud platforms, Internet of Things, and predictive analytics into their asset management offerings, enabling clients to monitor assets in real time, improve uptime, and reduce operational costs. Their global scale and deep technical expertise support wide deployment across industries including manufacturing, infrastructure, utilities, and transportation. The market is regionally led by North America, which holds approximately 33.04% of the total market share, reflecting the region’s strong technological adoption, mature financial infrastructure, and presence of leading IT firms.
Market Insights
- The Global Asset Management Market was valued at USD 548.19 billion in 2024 and is expected to reach USD 2308.09 billion by 2032, growing at a CAGR of 19.69%, supported by rising digital transformation and increasing demand for automated asset lifecycle solutions.
- Growing adoption of AI, IoT, cloud platforms, and predictive analytics acts as a major driver, helping organizations improve uptime, reduce operational costs, and strengthen real-time asset visibility.
- Ongoing trends such as smart asset monitoring, digital twins, and sustainability-focused asset strategies are reshaping industry investments and accelerating modernization across sectors.
- Competitive activity remains strong as leading players innovate and expand globally, while challenges arise from high implementation costs, integration complexities, and cybersecurity risks.
- Regionally, North America leads with 33.04% market share, while the software segment holds a dominant position due to rising use of advanced digital asset management systems across manufacturing, utilities, and infrastructure.
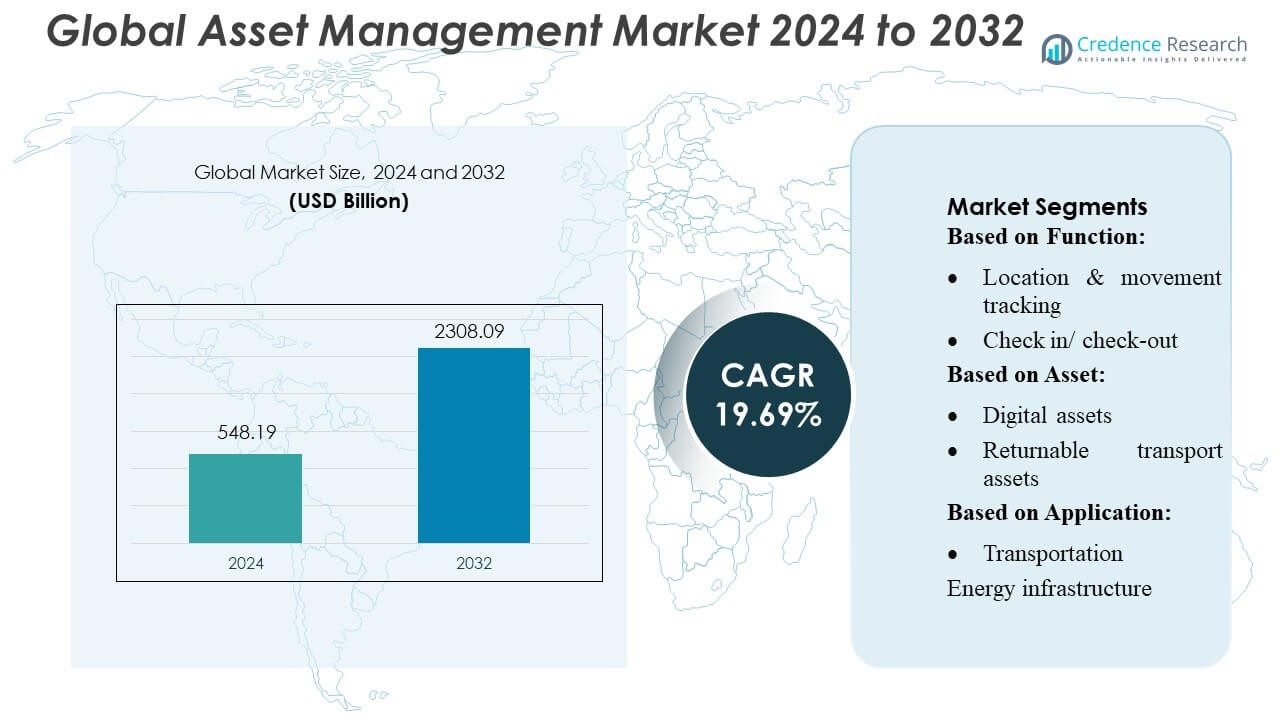
Market Segmentation Analysis:
By Function:
Location & movement tracking leads the global asset management market, holding the largest share as companies rely on real-time visibility to reduce asset loss and improve operational efficiency. Its dominance is driven by wider use of sensors, RFID, and IoT platforms that help track assets across facilities and supply chains. Check-in/check-out and repair & maintenance solutions show steady growth, but they remain smaller as organizations prioritize continuous monitoring over periodic asset-related activities.
- For instance, Rockwell Automation’s FactoryTalk Analytics GuardianAI consumes electrical signal data from PowerFlex 755 and 6000T variable frequency drives to detect early signs of wear-this approach avoids installing new sensors while supporting continuous condition-based monitoring.
By Asset Type:
Returnable transport assets represent the dominant asset category, accounting for the highest market share because industries such as logistics, retail, and manufacturing depend heavily on reusable pallets, crates, and containers. The need to reduce asset misplacement, improve cycle times, and cut operational costs drives strong adoption. Digital assets and in-transit assets continue to expand, but returnable transport assets maintain leadership due to their large volumes and frequent operational movement.
- For instance, Zebra Technologies’ RFID-based RTI tracking system uses UHF readers and overhead antennas to track tagged containers at checkpoints, enabling real-time location updates and delivering a reported 54% reduction in transportation misloads for a major online retailer.
By Application:
The transportation segment holds the largest share in the global asset management market, supported by the extensive use of fleets, containers, and mobile equipment that require constant tracking and maintenance. Its dominance is driven by growing demand for route optimization, theft prevention, and reduced downtime. Infrastructure, energy, water, and critical infrastructure segments are growing steadily, but transportation remains the top contributor due to its high asset intensity and strong digital adoption.
Key Growth Drivers
- Rising Adoption of Digital and Automated Investment Platforms
The rapid integration of AI, machine learning, and robotic process automation is accelerating the efficiency and scalability of asset management operations. Firms increasingly rely on automated advisory tools, algorithmic portfolio rebalancing, and predictive analytics to enhance investment outcomes. Digital onboarding and automated compliance reduce operational costs while improving client experience. This technological shift expands access to investment products for a broader audience, enabling firms to serve mass-affluent and retail segments effectively. As a result, digital transformation remains a central catalyst for market expansion.
- For instance, IBM’s Digital Asset Haven, built with Dfns, supports transaction lifecycle management across more than 40 public and private blockchains, while using multi-party authorization and hardware-based key management via IBM Crypto Express 8S on IBM Z and LinuxONE.
- Growth in High-Net-Worth Individuals and Institutional Investments
The expanding global population of high-net-worth individuals (HNWIs) and rising institutional participation continue to strengthen demand for structured asset management services. Pension funds, sovereign wealth funds, and insurance companies actively allocate larger portfolios toward diversified assets such as private equity, real estate, and alternative investments. This increasing complexity of financial portfolios drives the need for professional advisory expertise. Additionally, wealth creation in emerging economies is generating new revenue streams for global firms. These factors collectively support strong long-term growth momentum across the asset management sector.
- For instance, Oracle has built a digital twin environment that detects anomalies in connected industrial assets in 0.2 seconds using physics-based simulation and real-time streaming data.
- Expansion of Sustainable and ESG-Focused Investment Strategies
Environmental, social, and governance (ESG) investing has become a mainstream growth driver as investors prioritize long-term value preservation and responsible capital allocation. Asset managers integrate ESG scoring, climate-risk modeling, and ethical screening into portfolio strategies to meet regulatory expectations and client preferences. Demand for sustainable funds is expanding across institutional, retail, and sovereign investor groups. Enhanced transparency requirements and global sustainability frameworks further accelerate product development in green bonds, low-carbon funds, and impact-oriented portfolios. This structural preference for ESG-aligned assets continues to reshape market offerings.
Key Trends & Opportunities
1. Rising Adoption of Alternative Investments
Demand for alternative assets-such as private equity, hedge funds, infrastructure, and real estate-continues to grow as investors seek stable returns amid market volatility. Asset managers are expanding alternative product lines supported by advanced data analytics, risk-modeling tools, and performance benchmarking platforms. This trend unlocks new fee-based revenue opportunities, particularly from institutional clients. With long-duration assets offering inflation-hedging benefits and diversification advantages, alternatives remain a critical strategic focus for global firms aiming to differentiate portfolios and enhance long-term value generation.
- For instance, WSP and Microsoft partnered on a multiyear digital transformation initiative, co-developing AI-powered solutions where WSP contributes its engineering data (spanning 73,000 employees across 50+ countries) to build predictive infrastructure models.
2. Growth of Multi-Asset and Thematic Investment Strategies
Investors increasingly prefer multi-asset strategies that combine equities, fixed income, commodities, and alternatives for better risk-adjusted returns. Thematic investments-covering areas such as artificial intelligence, renewable energy, cybersecurity, and healthcare innovation-are gaining traction as clients seek targeted exposure to high-growth sectors. Asset managers capitalize on this trend by developing specialized funds supported by sophisticated research frameworks and data visualization tools. The flexibility and relevance of thematic and multi-asset offerings create strong opportunities for product innovation and competitive positioning in both retail and institutional segments.
- For instance, MindSphere IoT platform, Siemens connects 30 million automation systems, over 75 million smart meters, and more than 1 million connected devices, enabling real-time analytics for multi-asset infrastructure investments.
3. Expanding Opportunities in Emerging Markets
Emerging economies across Asia-Pacific, Latin America, the Middle East, and Africa present significant growth potential driven by increasing disposable incomes, expanding capital markets, and supportive regulatory reforms. Asset managers are introducing tailored investment products that target local equities, sovereign bonds, and infrastructure assets. Digital investment platforms further accelerate retail participation in these regions. As governments promote financial inclusion and investor education, global firms gain opportunities to strengthen geographic diversification and capture high-growth client segments, making emerging markets a vital frontier for future expansion.
Key Challenges
1. Increasing Regulatory Complexity Across Global Markets
Asset managers face rising compliance burdens due to evolving regulatory frameworks related to transparency, cybersecurity, data privacy, and ESG disclosures. Frequent changes in reporting standards across regions increase operational costs and require significant investment in risk-management systems. Firms must strengthen governance structures and continuously upgrade compliance technology to avoid penalties and maintain investor trust. Navigating these multilayered requirements remains a persistent challenge, particularly for global organizations managing cross-border portfolios under diverse regulatory regimes.
2. Fee Pressure and Intensifying Industry Competition
The proliferation of low-cost passive investment products and digital advisory platforms is driving downward pressure on management fees. Investors increasingly demand high performance at lower costs, forcing traditional asset managers to optimize operations and justify active management strategies. Competition from fintechs, global giants, and emerging low-fee providers further compresses margins. To remain competitive, firms must innovate through personalized solutions, technology integration, and value-added services. Sustaining profitability in this cost-sensitive environment remains one of the industry’s most significant hurdles.
Regional Analysis
North America
North America leads the Global Asset Management Market with around 33% market share. The region benefits from strong financial institutions, high adoption of digital platforms, and a mature investor base. The U.S. drives most of the demand due to large mutual funds, pension funds, and growing use of AI and analytics for portfolio and asset monitoring. The presence of major global asset managers and advanced regulatory frameworks further strengthen market growth. Increased interest in passive investing, ETF expansion, and sustainable investment strategies also contributes to North America’s dominant position.
Europe
Europe holds the second-largest position in the Global Asset Management Market, with an estimated 30% market share. The region’s growth is supported by strong regulatory systems, rising demand for ESG investment products, and increasing adoption of digital tools for asset tracking and risk management. Key markets such as the UK, Germany, France, and Switzerland host several major asset managers. Europe benefits from mature capital markets, expanding pension assets, and growing interest in sustainable and responsible investing. Enhanced investor protection rules and transparent financial practices also support steady market expansion across the region.
Asia Pacific
Asia Pacific accounts for approximately 27% market share, making it one of the fastest-growing regions in the Global Asset Management Market. Growth is driven by rising household wealth, expanding middle-class populations, and rapid digital transformation across countries such as China, India, Japan, and South Korea. Investments in pension funds, mutual funds, and infrastructure-focused portfolios continue to increase. Asset managers in the region actively adopt cloud platforms and AI tools to improve efficiency and client service. Regulatory improvements and growing financial awareness further boost market adoption across both institutional and retail segments.
Latin America
Latin America represents about 6% market share in the Global Asset Management Market. The region’s growth is supported by reforms in pension systems, rising financial inclusion, and improved stability in key markets like Brazil, Mexico, and Chile. Asset managers are increasingly focusing on digital platforms to enhance transparency and attract younger investors. Growing interest in diversified funds and increasing foreign investment also support market expansion. Although the market is smaller compared to other regions, steady economic development and government efforts to strengthen financial regulations offer positive growth potential.
Middle East & Africa
The Middle East & Africa region holds close to 4% market share. Growth is driven by rising sovereign wealth fund activities, infrastructure investments, and expanding wealth management demand in countries such as the UAE, Saudi Arabia, and South Africa. Digital transformation in financial services and increasing adoption of cloud-based asset management platforms support market development. The region is also witnessing growing interest in Sharia-compliant investment products and sustainable investment strategies. While the market remains comparatively smaller, strong government initiatives and financial sector modernization continue to create new opportunities.
Market Segmentations:
By Function:
- Location & movement tracking
- Check in/ check-out
By Asset:
- Digital assets
- Returnable transport assets
By Application:
- Transportation
- Energy infrastructure
By Geography
- North America
- U.S.
- Canada
- Mexico
- Europe
- Germany
- France
- U.K.
- Italy
- Spain
- Rest of Europe
- Asia Pacific
- China
- Japan
- India
- South Korea
- South-east Asia
- Rest of Asia Pacific
- Latin America
- Brazil
- Argentina
- Rest of Latin America
- Middle East & Africa
- GCC Countries
- South Africa
- Rest of the Middle East and Africa
Competitive Landscape
The competitive landscape of the Global Asset Management Market features leading players such as Hitachi, Ltd., Rockwell Automation, Inc., Zebra Technologies Corp., IBM Corp., Honeywell International Inc., Oracle Corp., WSP Global Inc., Siemens AG, Adobe Systems Inc., and Brookfield Asset Management Inc. The Global Asset Management Market is defined by rapid technological advancement, strong digital transformation initiatives, and increasing demand for predictive and automated asset solutions. Companies in this space focus on integrating AI, machine learning, IoT, and cloud-based platforms to enhance real-time monitoring, improve asset reliability, and reduce operational downtime. Competition intensifies as firms invest heavily in product innovation, industry-specific software, and advanced analytics to strengthen customer value. Strategic partnerships, mergers, and acquisitions further shape the market, enabling players to expand global reach and diversify solution portfolios. As industries prioritize efficiency, sustainability, and lifecycle optimization, providers continue to differentiate through smart asset management tools, scalable architectures, and comprehensive service offerings.
Key Player Analysis
- Hitachi, Ltd.
- Rockwell Automation, Inc.
- Zebra Technologies Corp.
- IBM Corp.
- Honeywell International Inc.
- Oracle Corp.
- WSP Global Inc.
- Siemens AG
- Adobe Systems Inc.
- Brookfield Asset Management Inc.
Recent Developments
- In April 2025, Backbase unveiled an AI-powered banking platform that unifies customer service and digital sales, using an intelligence fabric to automate operations and accelerate revenue generation.
- In April 2024, Rockwell Automation demonstrated its collaboration with Ericsson by showcasing Plex Asset Performance Management (APM) at the Hannover Messe 2024 trade fair. The demonstration highlighted how Ericsson's industrial private 5G connectivity enables Plex APM for real-time decision-making, particularly with autonomous mobile robots (AMRs).
- In March 2024, Adobe Inc. launched a new set of suites aimed at the enterprise sector, enabling brands to achieve individualized personalization on a large scale by leveraging generative AI and instantaneous insights.
- In February 2024, Vi Business, the enterprise arm of Vodafone Idea, launched IoT Smart Central, an integrated asset management platform designed to enhance the management and connectivity of Internet of Things (IoT) devices for enterprises. This new platform aims to provide businesses with a comprehensive solution for monitoring and controlling their IoT assets in real-time.
Report Coverage
The research report offers an in-depth analysis based on Function, Asset, Application and Geography. It details leading market players, providing an overview of their business, product offerings, investments, revenue streams, and key applications. Additionally, the report includes insights into the competitive environment, SWOT analysis, current market trends, as well as the primary drivers and constraints. Furthermore, it discusses various factors that have driven market expansion in recent years. The report also explores market dynamics, regulatory scenarios, and technological advancements that are shaping the industry. It assesses the impact of external factors and global economic changes on market growth. Lastly, it provides strategic recommendations for new entrants and established companies to navigate the complexities of the market.
Future Outlook
- The market will adopt more AI-driven tools to improve predictive maintenance and asset performance.
- Cloud-based asset management platforms will expand as organizations seek scalable digital solutions.
- IoT integration will increase, enabling real-time asset tracking and faster decision-making.
- Demand for sustainability-focused asset strategies will rise across industries.
- Companies will invest more in automation to reduce downtime and enhance operational efficiency.
- Cybersecurity capabilities will strengthen as digital asset ecosystems grow.
- Asset managers will increasingly use advanced analytics to optimize lifecycle costs.
- Mobile-based asset management applications will gain wider adoption for remote operations.
- Regulatory compliance solutions will become more important in highly governed sectors.
- Partnerships and acquisitions will accelerate as firms expand portfolios and global presence.
Request a Free Sample
Fill in your details and we'll send you a free sample report.
- Sample data tables & charts
- Research methodology
Need a Custom Version of This Report?
Tailor the scope, geography, or segments to your exact requirements.
- Custom geography or segment scope
- Direct access to our analyst team
Frequently Asked Questions
What is the current market size for the Global Asset Management Market, and what is its projected size in 2032?
At what Compound Annual Growth Rate is the Global Asset Management Market projected to grow between 2025 and 2032?
Which Global Asset Management Market segment held the largest share in 2024?
What are the primary factors fueling the growth of the Global Asset Management Market?
Who are the leading companies in the Global Asset Management Market?
Which region commanded the largest share of the Global Asset Management Market in 2024?
Table of Content
Chapter 1. Report Introduction
- 1.1 Report Description & Purpose
- 1.1.1 Report Title & Market Definition
- 1.1.2 Unique Selling Propositions (USP) & Key Differentiators
- 1.1.3 Value Proposition for Stakeholders
- 1.2 Research Objectives
- 1.2.1 Market Sizing Objectives (Volume & Revenue) (Volume Where Applicable)
- 1.2.2 Segmentation Objectives
- 1.2.3 Competitive Intelligence Objectives
- 1.2.4 Forecast & Scenario Objectives
- 1.3 Report Scope
- 1.3.1 Asset Management Scope – Segments & Subsegments Covered
- 1.3.2 Geographic Scope – Regions & Countries Covered
- 1.3.3 Historical Period, Base Year & Forecast Period (the historical period; forecast to 2032)
- 1.3.4 Inclusions & Exclusions
- 1.4 Industry Classification & Applicable Codes
- 1.5 Currency, Measurement Units & Valuation Basis
- 1.6 Target Stakeholders
- 1.7 Limitations & Assumptions
Chapter 2. Executive Summary
- 2.1 Global Asset Management Market Snapshot
- 2.1.1 Market Size – Historical (the historical period) & Forecast (2032) (base year: USD 548.19 billion → 2032: USD 2308.09 billion)
- 2.1.2 Volume & Revenue – Global Totals (Volume Where Applicable)
- 2.1.3 Key Market Highlights – Top Five Facts
- 2.2 Asset Management Market Segmentation Snapshot
- 2.2.1 Market Split by Region – vs. 2032
- 2.3 Competitive Snapshot
- 2.3.1 Top 10 Players by Revenue Share –
- 2.3.2 Top 10 Players by Volume Share – (Volume Where Applicable)
- 2.3.3 Recent Strategic Developments (18-Month Summary)
- 2.4 Key Investment Highlights & Strategic Conclusions
Chapter 3. Asset Management Market Dynamics & Industry Analysis
- 3.1 Market Overview & Context
- 3.1.1 Asset Management Market Position in the Broader Industry Value Chain
- 3.1.2 Demand Structure & Purchasing Dynamics
- 3.1.3 Market Maturity & Development Stage by Region
- 3.2 Asset Management Market Drivers
- 3.3 Asset Management Market Restraints & Challenges
- 3.4 Asset Management Market Opportunities
- 3.5 Porter's Five Forces Analysis
- 3.5.1 Threat of New Entrants
- 3.5.2 Bargaining Power of Suppliers
- 3.5.3 Bargaining Power of Buyers
- 3.5.4 Threat of Substitutes
- 3.5.5 Competitive Rivalry – Intensity Assessment
- 3.6 Asset Management Value Chain Analysis
- 3.6.1 Upstream – Key Inputs, Resources & Suppliers
- 3.6.1.1 Key Input/Resource 1
- 3.6.1.2 Key Input/Resource 2
- 3.6.1.3 Key Input/Resource 3
- 3.6.2 Midstream – Core Operations & Value Creation
- 3.6.2.1 Operating Model & Process Overview
- 3.6.2.2 Key Operating Locations & Capabilities by Company
- 3.6.3 Downstream – Market Channels & End Users
- 3.6.3.1 Direct Sales & Customer Engagement Channels
- 3.6.3.2 Indirect Sales, Intermediaries & Partner Channels
- 3.6.4 Value Chain Profitability Analysis
- 3.6.1 Upstream – Key Inputs, Resources & Suppliers
- 3.7 PESTEL Analysis
- 3.7.1 Political Factors
- 3.7.2 Economic Factors
- 3.7.3 Social Factors
- 3.7.4 Technological Factors
- 3.7.5 Environmental Factors
- 3.7.6 Legal Factors
- 3.8 Asset Management Supply Chain Analysis
- 3.8.1 Critical Input & Resource Availability Risk Assessment
- 3.8.2 Supplier & Operational Concentration Risk (Geographic Exposure)
- 3.8.3 Supply & Service Disruption Impact Analysis
- 3.9 Regulatory & Policy Landscape
Note: The regulatory and policy landscape section covers regulations based on their applicability to the market, Asset Management category, geography, and scope of the study. Only regulatory frameworks with a material impact on operations, compliance, trade, sustainability, or market access are analyzed in detail.
Chapter 4. Key Investment Pockets & Opportunity Analysis
- 4.1 Asset Management Market Attractiveness Analysis
- 4.1.1 By Region – Investment Attractiveness Matrix (Market Size × CAGR)
- 4.2 Absolute Revenue Growth Opportunity
- 4.2.1 By Region – Absolute Revenue Growth Through 2032
- 4.3 Incremental Demand Opportunity
- 4.3.1 By Region – Incremental Demand Through 2032
- 4.3.2 Segment – Incremental Demand
- 4.4 Emerging Submarket Opportunity Deep Dive (Subject to Applicability)
- 4.5 Priority Market Opportunity Scorecards
- 4.5.1 United States
- 4.5.2 Europe
- 4.5.3 Asia
- 4.5.4 Middle East & Africa
Note: Priority market opportunity scorecards reflect the geographic scope and strategic relevance of the study. Listed markets are indicative and may be adapted to the industry.
Chapter 5. Asset Management Cross-Border Trade & Market Access Analysis
- 5.1 International Trade & Cross-Border Activity Overview
- 5.1.1 Global Export Value by Country (the historical period)
- 5.1.2 Global Export Volume by Country (the historical period) (Volume Where Applicable)
- 5.1.3 Global Import Value by Country (the historical period)
- 5.1.4 Global Import Volume by Country (the historical period) (Volume Where Applicable)
- 5.1.5 Net Trade Balance by Country (the historical period)
- 5.2 Export Analysis – Segment
- 5.2.1 Category 1 (Applicable Classification Code)
- 5.2.2 Category 2 (Applicable Classification Code)
- 5.2.3 Category 3 (Applicable Classification Code)
- 5.2.4 Category 4 (Applicable Classification Code)
- 5.2.5 Category 5 (Applicable Classification Code)
- 5.3 Import Analysis – Segment
- 5.3.1 Category 1 (Applicable Classification Code)
- 5.3.2 Category 2 (Applicable Classification Code)
- 5.3.3 Category 3 (Applicable Classification Code)
- 5.3.4 Category 4 (Applicable Classification Code)
- 5.3.5 Category 5 (Applicable Classification Code)
- 5.4 Cross-Border Pricing & Transaction Benchmarks
- 5.4.1 Export Pricing – Segment & Country
- 5.4.2 Import Pricing – Segment & Source Country
- 5.4.3 Price Trends (the historical period)
- 5.5 Key Cross-Border Trade & Delivery Routes
- 5.5.1 Cross-Border Trade/Delivery Route 1
- 5.5.2 Cross-Border Trade/Delivery Route 2
- 5.5.3 Cross-Border Trade/Delivery Route 3
- 5.5.4 Cross-Border Trade/Delivery Route 4
- 5.5.5 Cross-Border Trade/Delivery Route 5
- 5.6 Trade Policy & Market Access Impact Assessment
- 5.6.1 Tariff & Non-Tariff Barriers
- 5.6.2 Regional Trade & Economic Integration Frameworks
- 5.6.3 Bilateral & Multilateral Trade Agreements
- 5.6.4 Cross-Border Operating, Licensing & Localization Requirements
Note: This chapter applies where cross-border trade or delivery is relevant to Asset Management. Goods, services, and digital offerings are assessed using applicable classifications and transaction measures. Import-export volumes, trade balances, and route analyses are included only where meaningful to the market.
Chapter 6. Competitive Landscape & Company Benchmarking
- 6.1 Asset Management Market Concentration & Structure
- 6.1.1 Herfindahl-Hirschman Index (HHI) – vs.
- 6.1.2 Leading, Mid-Sized & Emerging Player Structure
- 6.1.3 Global, Regional & Local Player Dynamics
- 6.2 Asset Management Market Share Analysis –
- 6.2.1 Global Revenue Share by Company
- 6.2.2 Global Volume Share by Company (Volume Where Applicable)
- 6.2.3 Regional Revenue Share
- 6.2.4 Market Share Evolution ( vs. )
- 6.2.5 Company Market Share by Key Segment
- 6.2.6 Company Market Share by Customer Group
- 6.3 Operating Scale, Capacity & Infrastructure Analysis
- 6.3.1 Global Operating Scale & Supply Capacity
- 6.3.2 Resource Utilization & Operating Efficiency
- 6.3.3 Output, Service Delivery & Activity Metrics
- 6.3.4 Operating Footprint & Infrastructure Map
- 6.3.5 Planned Operational & Capacity Expansion
- 6.4 Asset Management Competitive Benchmarking Matrix
- 6.4.1 Revenue, Growth, Profitability & Operating Metric Comparison
- 6.4.2 Channel Revenue Mix
- 6.4.3 Geographic Revenue Exposure
- 6.4.4 R&D Intensity
- 6.4.5 Sustainability Maturity
- 6.5 Strategic Developments in Asset Management (Last 24 Months)
- 6.5.1 Mergers, Acquisitions & Divestments
- 6.5.2 New Products, Services & Solutions in Asset Management
- 6.5.3 Operational & Infrastructure Expansions
- 6.5.4 Strategic Alliances, Joint Ventures & Partnerships
- 6.5.5 Distribution Expansion & Market Entry
- 6.5.6 Sustainability & ESG Initiatives
- 6.6 Competitive Strategy Mapping
- 6.6.1 Leader, Challenger, Follower & Niche Classification
- 6.6.2 Pricing Strategy Comparison
- 6.6.3 Channel Strategy Matrix
Note: Strategic developments are included based on their materiality and the availability of reliable information.
Chapter 7. Global Asset Management Market – By Sales & Delivery Channel
- 7.1 Segment Overview
- 7.1.1 Volume & Revenue Split by Channel ( & 2032) (Volume Where Applicable)
- 7.1.2 Channel Mix Evolution (2032)
Chapter 8. Regional Market Analysis – Global Overview
- 8.1 Global Regional Overview
- 8.1.1 Regional Volume Share (Volume Where Applicable)
- 8.1.2 Regional Revenue Share
- 8.1.3 Regional Volume by Region (Volume Where Applicable)
- 8.1.4 Regional Revenue by Region
- 8.1.5 Regional Forecast Through 2032
- 8.2 Cross-Regional Segment Analysis
- 8.2.1 By Sales & Delivery Channel
- 8.2.2 By Competitive Positioning & Price Tier
Chapter 9. North America Asset Management Market
- 9.1 United States
- 9.2 Canada
- 9.3 Mexico
Chapter 10. Europe Asset Management Market
- 10.1 Germany
- 10.2 France
- 10.3 Italy
- 10.4 United Kingdom
- 10.5 Spain
- 10.6 Poland
- 10.7 Russia
- 10.8 Netherlands
- 10.9 Belgium
- 10.10 Sweden
- 10.11 Denmark
- 10.12 Norway
- 10.13 Rest of Europe
Chapter 11. Asia Pacific Asset Management Market
- 11.1 China
- 11.2 India
- 11.3 Japan
- 11.4 South Korea
- 11.5 Thailand
- 11.6 Indonesia
- 11.7 Vietnam
- 11.8 Malaysia
- 11.9 Australia
- 11.10 Rest of Asia Pacific
Chapter 12. Latin America Asset Management Market
- 12.1 Brazil
- 12.2 Argentina
- 12.3 Colombia
- 12.4 Chile
- 12.5 Rest of Latin America
Chapter 13. Middle East Asset Management Market
- 13.1 Saudi Arabia
- 13.2 United Arab Emirates
- 13.3 Turkey
- 13.4 Israel
- 13.5 Iran
- 13.6 Rest of the Middle East
Chapter 14. Africa Asset Management Market
- 14.1 South Africa
- 14.2 Egypt
- 14.3 Nigeria
- 14.4 Morocco
- 14.5 Rest of Africa
Chapter 15. Asset Management Company Profiles
- 15.1 [Company 01]
- 15.1.1 Company Overview
- 15.1.2 Key Management Personnel
- 15.1.3 Products & Services Portfolio
- 15.1.4 Financial Performance
- 15.1.5 Key Market Focus & Geographic Presence
- 15.1.6 Recent Developments & Strategic Initiatives
Note: The company profile list is preliminary and may change based on research findings, market developments, data availability, and client requirements.
Chapter 16. Appendices
- Appendix A – List of Abbreviations & Acronyms
- Appendix B – Industry Classification Code Reference – Full Series
- Appendix C – Supply, Output & Operating Capacity Data Tables
- Appendix D – End-Use & Demand Base Tables
- Appendix E – Demand, Adoption & Usage Assumptions
- Appendix F – Pricing & Revenue Metric Reference Tables
- Appendix G – Company Operations & Infrastructure Database
- Appendix H – Cross-Border Trade & Activity Data Tables (Where Applicable)
- Appendix I – Regulatory Summary Tables
- Appendix J – Primary Research Participant List (Anonymized)
- Appendix K – Primary Research Questionnaire Framework
- Appendix L – Data Sources & Bibliography
- Appendix M – Market Size Divergence & Source Comparison
Chapter 17. Research Methodology
- 17.1 Research Framework & Philosophy
- 17.2 Secondary Research – Sources, Hierarchy & Data Extraction
- 17.3 Data Modeling – Bottom-Up & Top-Down Market Sizing
- 17.4 Primary Research – Stakeholder Framework, LOI & Sample Sizes
- 17.5 Forecast Methodology – Regression, Scenario & Sensitivity Analysis
- 17.6 Quality Control – Four-Layer Validation Framework
- 17.7 Limitations & Standard Assumptions
- 17.8 Disclaimer
