
Market Overview
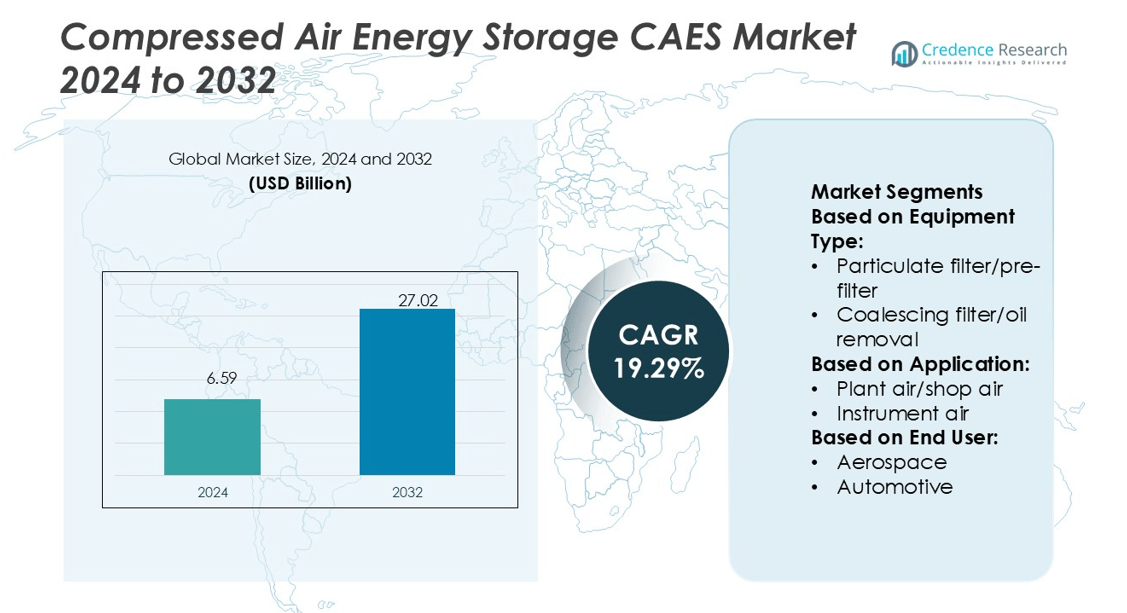
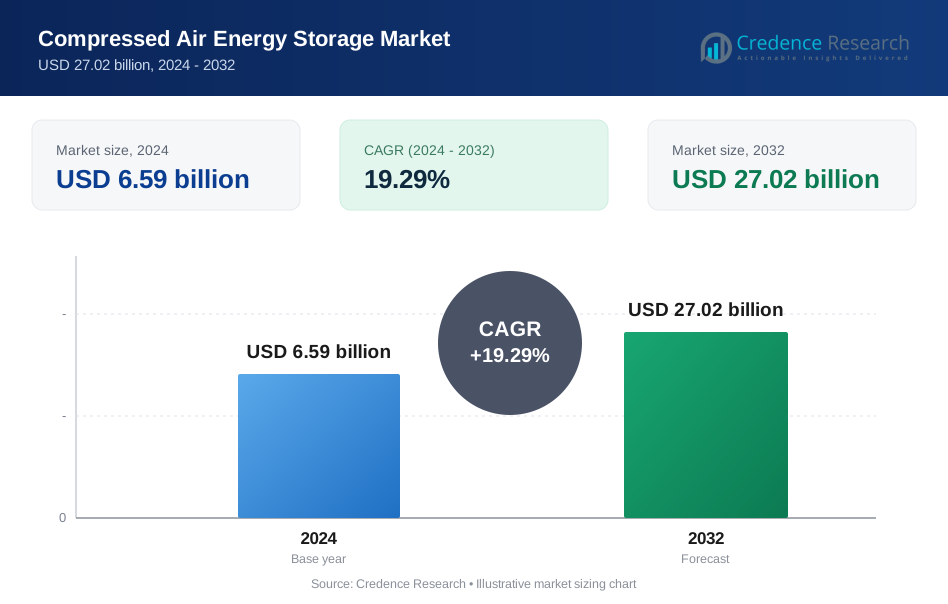
Compressed Air Energy Storage CAES Market size was valued USD 6.59 billion in 2024 and is anticipated to reach USD 27.02 billion by 2032, at a CAGR of 19.29% during the forecast period.
| REPORT ATTRIBUTE | DETAILS |
|---|---|
| Historical Period | 2020-2023 |
| Base Year | 2024 |
| Forecast Period | 2025-2032 |
| Compressed Air Energy Storage (CAES) Market Size 2024 | USD 6.59 billion |
| Compressed Air Energy Storage (CAES) Market, CAGR | 19.29% |
| Compressed Air Energy Storage (CAES) Market Size 2032 | USD 27.02 billion |
The Compressed Air Energy Storage (CAES) market features prominent players such as Hydrostor, Energy Dome, Corre Energy, Cheesecake Energy, APEX CAES, AUGWIND Energy, ALACAES, Green-Y Energy, Pacific Gas and Electric Company, and Sherwood Power. These companies focus on expanding large-scale and modular storage systems to enhance renewable integration and grid reliability. Hydrostor leads in advanced adiabatic CAES projects, while Energy Dome pioneers CO₂-based storage solutions with higher round-trip efficiency. Corre Energy and Cheesecake Energy emphasize flexible, decentralized energy systems for industrial and community applications. North America dominates the global CAES market with a 37% share, supported by significant renewable energy projects, strong government incentives, and ongoing infrastructure investments aimed at achieving long-duration energy storage and carbon neutrality goals.
Market Insights
- The Compressed Air Energy Storage (CAES) market was valued at USD 6.59 billion in 2024 and is projected to reach USD 27.02 billion by 2032, growing at a CAGR of 19.29%.
- Rising renewable energy integration and increasing need for grid stability drive the adoption of CAES systems across industrial and utility sectors.
- Technological advancements in adiabatic and CO₂-based CAES designs enhance storage efficiency and support large-scale renewable deployment globally.
- North America dominates the market with a 37% share, followed by Europe at 29%, supported by policy incentives and infrastructure modernization.
- Leading players such as Hydrostor, Energy Dome, and Corre Energy strengthen market competition through strategic partnerships and pilot projects, while high installation costs and geological limitations remain key restraints in expanding large-scale CAES adoption.
Market Segmentation Analysis:
By Equipment Type
The filters segment dominates the Compressed Air Energy Storage (CAES) market with a market share of 42%. Within filters, the coalescing filter/oil removal type holds the leading position due to its efficiency in removing oil aerosols down to 0.01 microns. These filters are essential for maintaining turbine and compressor reliability by preventing oil contamination. For instance, Parker Hannifin’s OIL-X coalescing filters achieve ISO 8573-1 Class 1 oil removal performance, ensuring high air purity. The growing adoption of advanced filtration systems enhances operational efficiency and extends equipment lifespan in CAES facilities.
- For instance, Parker Hannifin's OIL-X coalescing filters include different grades with specific performance characteristics tested under ISO 12500-1. The high-efficiency Grade AA filters deliver a downstream oil carryover of 0.01 mg/m³ when tested with a 10 mg/m³ upstream oil aerosol challenge.
By Application
Plant air/shop air applications account for the largest share of 46% in the CAES market. This dominance is driven by the need for clean and dry air in mechanical operations, pneumatic tools, and compressor systems. CAES facilities depend heavily on controlled plant air systems to maintain stable energy conversion processes. For instance, Atlas Copco’s GA series compressors integrate variable speed drive and energy recovery systems, reducing power consumption by up to 50%. The demand for energy-efficient compressed air solutions across industrial operations sustains the strong growth of this application segment.
- For instance, Hydrostor’s Goderich A-CAES facility in Ontario, Canada, operates with a discharge capacity of 1.75 MW, a charge rate of 2.2 MW, and energy storage capability exceeding 10 MWh.
By End User
The automotive industry represents the dominant end-user segment, holding a 33% market share in the CAES market. Automakers increasingly rely on compressed air for paint application, assembly automation, and tire inflation systems. The shift toward energy-efficient and sustainable manufacturing practices fuels adoption. For instance, BMW Group’s Leipzig plant employs high-efficiency compressed air networks with Siemens energy monitoring, reducing leakage losses by 15%. The industry’s push toward carbon-neutral production and precision automation continues to drive CAES technology integration across global automotive facilities.
Key Growth Drivers
Rising Demand for Grid Stability and Renewable Integration
The increasing penetration of renewable energy sources drives the adoption of CAES systems for grid stability. These systems balance power supply by storing excess wind and solar energy for later use. For instance, Siemens Energy’s 100 MW CAES project in Germany provides grid support with round-trip efficiency of 70%. Governments promote large-scale energy storage to address intermittency in renewables. The flexibility and scalability of CAES systems make them vital for achieving stable, low-carbon power networks worldwide.
- For instance, Cheesecake Energy’s eTanker system-a modular hybrid of thermal and compressed air storage-uses repurposed off-the-shelf hardware and has a design life of up to 25 years while avoiding rare or toxic materials.
Advancements in High-Efficiency Compression and Expansion Technologies
Technological progress in turbomachinery and thermal management boosts CAES performance and energy efficiency. Modern systems feature advanced compressors and expanders capable of high pressure ratios and lower energy losses. For instance, Hitachi Energy’s high-speed isothermal compressors enhance energy density and reduce operational costs by up to 12%. Innovations in heat recovery further minimize waste and improve overall efficiency. Such developments make CAES a cost-effective and sustainable alternative to conventional peaking power plants.
- For instance, Pacific Gas & Electric (PG&E) initiated plans and received funding for a 300 MW / 10-hour CAES demonstration in California around 2011, the project appears to be stalled or canceled.
Government Incentives and Investment in Energy Infrastructure
National policies promoting clean energy transition accelerate CAES adoption across major economies. Incentive programs and infrastructure funding support large-scale energy storage deployment. For example, the U.S. Department of Energy allocated over USD 400 million in 2024 for long-duration energy storage demonstrations, including CAES facilities. Similar initiatives in Europe and China encourage partnerships between utilities and technology providers. These supportive measures enhance investor confidence and expedite the commercialization of advanced CAES technologies.
Key Trends & Opportunities
Emergence of Adiabatic and Isothermal CAES Systems
Next-generation adiabatic and isothermal systems are emerging as efficient alternatives to conventional diabatic CAES. These systems store and reuse heat generated during compression, improving energy efficiency to above 70%. Companies like Hydrostor and RWE are developing commercial-scale adiabatic CAES projects using advanced thermal energy storage materials. The shift toward these systems aligns with carbon-neutral targets and offers significant cost savings over time. The growing focus on sustainable energy storage creates strong opportunities for technology developers.
- For instance, Energy Dome’s CO₂-based “carbon battery” demonstrator in Sardinia operates at 2.5 MW / 4 MWh capacity and claims a 75% round-trip efficiency, by storing heat in a thermal reservoir and re-injecting it into cold gas before expansion.
Integration with Hydrogen and Hybrid Energy Storage Systems
The integration of CAES with hydrogen and battery technologies is gaining momentum. Hybrid systems combine the long-duration capacity of CAES with the rapid response of batteries and hydrogen fuel cells. For instance, Mitsubishi Power’s hybrid storage projects couple CAES with green hydrogen electrolysis for multi-day energy supply. This synergy improves grid flexibility, enhances energy security, and supports decarbonization goals. As hybrid infrastructure expands, CAES technologies will play a crucial role in multi-energy storage ecosystems.
- For instance, Corre Energy’s Green Hydrogen Hub Denmark (GHH DK1) plans a fully integrated system with 320 MW CAES capacity, 350 MW electrolyzer capacity, and 200 GWh hydrogen storage alongside underground CAES.
Key Challenges
High Capital Investment and Infrastructure Complexity
CAES projects require substantial upfront investment for underground storage caverns, compressors, and turbines. The site selection process adds complexity, as only certain geological formations like salt caverns are suitable. For example, large-scale CAES installations can exceed USD 1,000 per kW in capital costs. Such financial barriers limit small-scale deployments and deter new market entrants. Overcoming these challenges demands policy support, modular designs, and improved cost-sharing frameworks among utilities and technology developers.
Thermal Management and Efficiency Limitations
Maintaining consistent temperature control during compression and expansion remains a major technical challenge. Inefficient thermal storage reduces overall round-trip efficiency and increases energy loss. Traditional diabatic systems waste heat, lowering efficiency to 40–50%. For instance, some early CAES plants required supplemental natural gas heating to maintain output levels. Advances in adiabatic designs and heat recovery systems are addressing these limitations, but large-scale implementation still faces engineering and cost hurdles that slow market growth.
Regional Analysis
North America
North America holds the largest share of the Compressed Air Energy Storage (CAES) market at 37%. The region benefits from a well-developed renewable energy infrastructure and strong government incentives for grid stability. The U.S. leads investments in large-scale CAES projects for wind and solar integration. For instance, Hydrostor’s 500 MW Willow Rock project in California enhances long-duration storage capabilities. The growing demand for cleaner backup systems in data centers and industrial facilities further supports market growth, while strategic initiatives by the U.S. Department of Energy promote innovation and commercialization of advanced CAES technologies.
Europe
Europe accounts for 29% of the CAES market, driven by the EU’s energy transition goals and carbon neutrality targets. Germany and the U.K. lead regional adoption with projects focused on balancing intermittent renewable generation. For instance, RWE’s ADELE project in Saxony-Anhalt uses adiabatic compression for thermal efficiency. The European Commission’s energy storage directives and Horizon Europe funding strengthen technology development. Increasing offshore wind integration in the North Sea, along with initiatives for cross-border energy balancing, enhances CAES demand across the region, establishing Europe as a major hub for advanced storage innovation.
Asia Pacific
Asia Pacific represents 23% of the CAES market, led by China, Japan, and South Korea. Rapid renewable expansion and industrial power demand are fueling CAES adoption. For instance, China’s Institute of Engineering Thermophysics operates a 100 MW/400 MWh CAES plant in Jiangsu, the world’s largest non-salt cavern facility. Government policies promoting grid modernization and energy resilience further accelerate deployment. Japan’s focus on hydrogen integration and South Korea’s technology innovation in hybrid storage systems enhance regional competitiveness. Growing urbanization and increased reliance on sustainable energy sources continue to drive Asia Pacific’s market growth momentum.
Latin America
Latin America captures 4% of the CAES market, with Brazil, Chile, and Mexico emerging as early adopters. Increasing renewable penetration-especially in wind and solar-drives the need for efficient grid balancing technologies. For instance, Brazil’s energy research company EPE is evaluating compressed air storage for hybrid renewable microgrids in the Northeast region. Supportive regulatory frameworks and partnerships with European technology firms foster adoption. Although deployment remains at an early stage, the region’s abundant renewable resources and growing investment in grid storage solutions are expected to expand CAES adoption across Latin America.
Middle East & Africa (MEA)
The Middle East & Africa region holds a 7% share of the CAES market, supported by growing renewable initiatives and grid reliability needs. Countries like Saudi Arabia and the UAE are investing in pilot projects to stabilize fluctuating solar power output. For instance, the King Abdullah City for Atomic and Renewable Energy (K.A.CARE) has explored CAES integration with desert-based solar plants. South Africa is also assessing CAES as part of its Integrated Resource Plan for energy diversification. With rising renewable capacity and infrastructure modernization, MEA presents long-term potential for scalable CAES deployment.
Market Segmentations:
By Equipment Type:
- Particulate filter/pre-filter
- Coalescing filter/oil removal
By Application:
- Plant air/shop air
- Instrument air
By End User:
- Aerospace
- Automotive
By Geography
- North America
- U.S.
- Canada
- Europe
- Germany
- France
- U.K.
- Italy
- Spain
- Rest of Europe
- Asia Pacific
- China
- Japan
- India
- South Korea
- South-east Asia
- Rest of Asia Pacific
- Latin America
- Brazil
- Mexico
- Rest of Latin America
- Middle East & Africa
- GCC Countries
- South Africa
- Rest of the Middle East and Africa
Competitive Landscape
The competitive landscape of the Compressed Air Energy Storage (CAES) market includes key players such as Green-Y Energy, Sherwood Power, Hydrostor, Cheesecake Energy, Pacific Gas and Electric Company, Energy Dome, Corre Energy, APEX CAES, AUGWIND Energy, and ALACAES. The competitive landscape of the Compressed Air Energy Storage (CAES) market is defined by rapid technological innovation and strategic collaboration. Companies are investing heavily in large-scale storage systems that support renewable energy integration, grid stability, and carbon neutrality goals. The market is witnessing a shift toward advanced adiabatic and isothermal designs, which enhance efficiency and reduce energy losses. Several players are forming partnerships with utilities and governments to deploy pilot and commercial-scale projects, particularly in regions emphasizing clean energy transition. Competitive advantage increasingly depends on optimizing cost per kilowatt-hour, extending storage duration, and integrating digital monitoring systems for real-time performance analysis. As nations expand renewable energy capacity, CAES providers continue to compete through innovation, scalability, and operational reliability, solidifying the technology’s role in the long-term energy storage ecosystem.
Key Player Analysis
- Green-Y Energy
- Sherwood Power
- Hydrostor
- Cheesecake Energy
- Pacific Gas and Electric Company
- Energy Dome
- Corre Energy
- APEX CAES
- AUGWIND Energy
- ALACAES
Recent Developments
- In January 2025, The U.S. DOE issued a conditional loan guarantee to Hydrostor Willow Rock Energy Storage Center, marking the largest federal commitment to compressed air energy storage market deployment.
- In August 2024, Gardner Denver launched the PureAir T/TVS 90-355 kW Series, highlighting its advancements in compressor technology. Designed with innovative software and expertise in oil-free compression, the series sets new standards in performance.
- In June 2024, ELGi Equipments introduced its latest compressed air products at INTEC 2024 in India. Highlights included the EG SP “Super Premium” Range, EG PM (Permanent Magnet) Range, TS15LD Direct Drive Piston Compressor, EN11-7.5VFD Encapsulated Screw Air Compressor, and AB Series 22 kW Oil-Free Screw Air Compressor. These products enhance flexibility, productivity, and durability for various industries.
- In January 2023, Ingersoll Rand Inc., acquired SPX FLOW's Air Treatment business through an all-cash transaction valued at around addition of SPX FLOW's Air Treatment business brings in a synergistic product portfolio featuring energy-efficient compressed filters, air dryers, and other consumables, complementing Ingersoll Rand's core compressor product offering with a high attachment rate
Report Coverage
The research report offers an in-depth analysis based on Equipment Type, Application, End-User and Geography. It details leading market players, providing an overview of their business, product offerings, investments, revenue streams, and key applications. Additionally, the report includes insights into the competitive environment, SWOT analysis, current market trends, as well as the primary drivers and constraints. Furthermore, it discusses various factors that have driven market expansion in recent years. The report also explores market dynamics, regulatory scenarios, and technological advancements that are shaping the industry. It assesses the impact of external factors and global economic changes on market growth. Lastly, it provides strategic recommendations for new entrants and established companies to navigate the complexities of the market.
Future Outlook
- The CAES market will expand with growing renewable energy integration and grid stability needs.
- Advanced adiabatic and isothermal storage technologies will improve efficiency and reduce energy losses.
- Governments will increase funding for long-duration energy storage pilot projects and commercialization.
- Hybrid systems combining CAES with battery and hydrogen storage will gain strong adoption.
- Industrial and utility-scale users will drive demand for reliable, emission-free power backup solutions.
- Digital monitoring and predictive maintenance systems will enhance operational reliability and performance.
- Declining equipment and maintenance costs will make CAES more economically competitive.
- Strategic partnerships between technology developers and power utilities will accelerate deployment.
- Regions with high renewable potential, such as Asia Pacific and Europe, will lead market growth.
- Innovation in modular and underground CAES designs will enable flexible applications across industries.
Request a Free Sample
Fill in your details and we'll send you a free sample report.
- Sample data tables & charts
- Research methodology
Need a Custom Version of This Report?
Tailor the scope, geography, or segments to your exact requirements.
- Custom geography or segment scope
- Direct access to our analyst team
Frequently Asked Questions
What is the current market size for the Compressed Air Energy Storage (CAES) Market, and what is its projected size in 2032?
At what Compound Annual Growth Rate is the Compressed Air Energy Storage (CAES) Market projected to grow between 2025 and 2032?
Which Compressed Air Energy Storage (CAES) Market segment held the largest share in 2024?
What are the primary factors fueling the growth of the Compressed Air Energy Storage (CAES) Market?
Who are the leading companies in the Compressed Air Energy Storage (CAES) Market?
Table of Content
Chapter 1. Report Introduction
- 1.1 Report Description & Purpose
- 1.1.1 Report Title & Market Definition
- 1.1.2 Unique Selling Propositions (USP) & Key Differentiators
- 1.1.3 Value Proposition for Stakeholders
- 1.2 Research Objectives
- 1.2.1 Market Sizing Objectives (Volume & Revenue) (Volume Where Applicable)
- 1.2.2 Segmentation Objectives
- 1.2.3 Competitive Intelligence Objectives
- 1.2.4 Forecast & Scenario Objectives
- 1.3 Report Scope
- 1.3.1 Compressed Air Energy Storage Scope – Segments & Subsegments Covered
- 1.3.2 Geographic Scope – Regions & Countries Covered
- 1.3.3 Historical Period, Base Year & Forecast Period (2024; forecast to 2032)
- 1.3.4 Inclusions & Exclusions
- 1.4 Industry Classification & Applicable Codes
- 1.5 Currency, Measurement Units & Valuation Basis
- 1.6 Target Stakeholders
- 1.7 Limitations & Assumptions
Chapter 2. Executive Summary
- 2.1 Global Compressed Air Energy Storage Market Snapshot
- 2.1.1 Market Size – Historical (2024) & Forecast (2024-2032) (2024: USD 6.59 billion → 2032: USD 27.02 billion)
- 2.1.2 Volume & Revenue – Global Totals (Volume Where Applicable)
- 2.1.3 Key Market Highlights – Top Five Facts
- 2.2 Compressed Air Energy Storage Market Segmentation Snapshot
- 2.2.1 Market Split by Region – 2024 vs. 2032
- 2.3 Competitive Snapshot
- 2.3.1 Top 10 Players by Revenue Share – 2024
- 2.3.2 Top 10 Players by Volume Share – 2024 (Volume Where Applicable)
- 2.3.3 Recent Strategic Developments (18-Month Summary)
- 2.4 Key Investment Highlights & Strategic Conclusions
Chapter 3. Compressed Air Energy Storage Market Dynamics & Industry Analysis
- 3.1 Market Overview & Context
- 3.1.1 Compressed Air Energy Storage Market Position in the Broader Industry Value Chain
- 3.1.2 Demand Structure & Purchasing Dynamics
- 3.1.3 Market Maturity & Development Stage by Region
- 3.2 Compressed Air Energy Storage Market Drivers
- 3.3 Compressed Air Energy Storage Market Restraints & Challenges
- 3.4 Compressed Air Energy Storage Market Opportunities
- 3.5 Porter's Five Forces Analysis
- 3.5.1 Threat of New Entrants
- 3.5.2 Bargaining Power of Suppliers
- 3.5.3 Bargaining Power of Buyers
- 3.5.4 Threat of Substitutes
- 3.5.5 Competitive Rivalry – Intensity Assessment
- 3.6 Compressed Air Energy Storage Value Chain Analysis
- 3.6.1 Upstream – Key Inputs, Resources & Suppliers
- 3.6.1.1 Key Input/Resource 1
- 3.6.1.2 Key Input/Resource 2
- 3.6.1.3 Key Input/Resource 3
- 3.6.2 Midstream – Core Operations & Value Creation
- 3.6.2.1 Operating Model & Process Overview
- 3.6.2.2 Key Operating Locations & Capabilities by Company
- 3.6.3 Downstream – Market Channels & End Users
- 3.6.3.1 Direct Sales & Customer Engagement Channels
- 3.6.3.2 Indirect Sales, Intermediaries & Partner Channels
- 3.6.4 Value Chain Profitability Analysis
- 3.6.1 Upstream – Key Inputs, Resources & Suppliers
- 3.7 PESTEL Analysis
- 3.7.1 Political Factors
- 3.7.2 Economic Factors
- 3.7.3 Social Factors
- 3.7.4 Technological Factors
- 3.7.5 Environmental Factors
- 3.7.6 Legal Factors
- 3.8 Compressed Air Energy Storage Supply Chain Analysis
- 3.8.1 Critical Input & Resource Availability Risk Assessment
- 3.8.2 Supplier & Operational Concentration Risk (Geographic Exposure)
- 3.8.3 Supply & Service Disruption Impact Analysis
- 3.9 Regulatory & Policy Landscape
Note: The regulatory and policy landscape section covers regulations based on their applicability to the market, Compressed Air Energy Storage category, geography, and scope of the study. Only regulatory frameworks with a material impact on operations, compliance, trade, sustainability, or market access are analyzed in detail.
Chapter 4. Key Investment Pockets & Opportunity Analysis
- 4.1 Compressed Air Energy Storage Market Attractiveness Analysis
- 4.1.1 By Region – Investment Attractiveness Matrix (Market Size × CAGR)
- 4.2 Absolute Revenue Growth Opportunity
- 4.2.1 By Region – Absolute Revenue Growth Through 2032
- 4.3 Incremental Demand Opportunity
- 4.3.1 By Region – Incremental Demand Through 2032
- 4.3.2 Segment – Incremental Demand
- 4.4 Emerging Submarket Opportunity Deep Dive (Subject to Applicability)
- 4.5 Priority Market Opportunity Scorecards
- 4.5.1 United States
- 4.5.2 Europe
- 4.5.3 Asia
- 4.5.4 Middle East & Africa
Note: Priority market opportunity scorecards reflect the geographic scope and strategic relevance of the study. Listed markets are indicative and may be adapted to the industry.
Chapter 5. Compressed Air Energy Storage Cross-Border Trade & Market Access Analysis
- 5.1 International Trade & Cross-Border Activity Overview
- 5.1.1 Global Export Value by Country (2024)
- 5.1.2 Global Export Volume by Country (2024) (Volume Where Applicable)
- 5.1.3 Global Import Value by Country (2024)
- 5.1.4 Global Import Volume by Country (2024) (Volume Where Applicable)
- 5.1.5 Net Trade Balance by Country (2024)
- 5.2 Export Analysis – Segment
- 5.2.1 Category 1 (Applicable Classification Code)
- 5.2.2 Category 2 (Applicable Classification Code)
- 5.2.3 Category 3 (Applicable Classification Code)
- 5.2.4 Category 4 (Applicable Classification Code)
- 5.2.5 Category 5 (Applicable Classification Code)
- 5.3 Import Analysis – Segment
- 5.3.1 Category 1 (Applicable Classification Code)
- 5.3.2 Category 2 (Applicable Classification Code)
- 5.3.3 Category 3 (Applicable Classification Code)
- 5.3.4 Category 4 (Applicable Classification Code)
- 5.3.5 Category 5 (Applicable Classification Code)
- 5.4 Cross-Border Pricing & Transaction Benchmarks
- 5.4.1 Export Pricing – Segment & Country
- 5.4.2 Import Pricing – Segment & Source Country
- 5.4.3 Price Trends (2024)
- 5.5 Key Cross-Border Trade & Delivery Routes
- 5.5.1 Cross-Border Trade/Delivery Route 1
- 5.5.2 Cross-Border Trade/Delivery Route 2
- 5.5.3 Cross-Border Trade/Delivery Route 3
- 5.5.4 Cross-Border Trade/Delivery Route 4
- 5.5.5 Cross-Border Trade/Delivery Route 5
- 5.6 Trade Policy & Market Access Impact Assessment
- 5.6.1 Tariff & Non-Tariff Barriers
- 5.6.2 Regional Trade & Economic Integration Frameworks
- 5.6.3 Bilateral & Multilateral Trade Agreements
- 5.6.4 Cross-Border Operating, Licensing & Localization Requirements
Note: This chapter applies where cross-border trade or delivery is relevant to Compressed Air Energy Storage. Goods, services, and digital offerings are assessed using applicable classifications and transaction measures. Import-export volumes, trade balances, and route analyses are included only where meaningful to the market.
Chapter 6. Competitive Landscape & Company Benchmarking
- 6.1 Compressed Air Energy Storage Market Concentration & Structure
- 6.1.1 Herfindahl-Hirschman Index (HHI) – vs. 2024
- 6.1.2 Leading, Mid-Sized & Emerging Player Structure
- 6.1.3 Global, Regional & Local Player Dynamics
- 6.2 Compressed Air Energy Storage Market Share Analysis – 2024
- 6.2.1 Global Revenue Share by Company
- 6.2.2 Global Volume Share by Company (Volume Where Applicable)
- 6.2.3 Regional Revenue Share
- 6.2.4 Market Share Evolution ( vs. 2024)
- 6.2.5 Company Market Share by Key Segment
- 6.2.6 Company Market Share by Customer Group
- 6.3 Operating Scale, Capacity & Infrastructure Analysis
- 6.3.1 Global Operating Scale & Supply Capacity
- 6.3.2 Resource Utilization & Operating Efficiency
- 6.3.3 Output, Service Delivery & Activity Metrics
- 6.3.4 Operating Footprint & Infrastructure Map
- 6.3.5 Planned Operational & Capacity Expansion
- 6.4 Compressed Air Energy Storage Competitive Benchmarking Matrix
- 6.4.1 Revenue, Growth, Profitability & Operating Metric Comparison
- 6.4.2 Channel Revenue Mix
- 6.4.3 Geographic Revenue Exposure
- 6.4.4 R&D Intensity
- 6.4.5 Sustainability Maturity
- 6.5 Strategic Developments in Compressed Air Energy Storage (Last 24 Months)
- 6.5.1 Mergers, Acquisitions & Divestments
- 6.5.2 New Products, Services & Solutions in Compressed Air Energy Storage
- 6.5.3 Operational & Infrastructure Expansions
- 6.5.4 Strategic Alliances, Joint Ventures & Partnerships
- 6.5.5 Distribution Expansion & Market Entry
- 6.5.6 Sustainability & ESG Initiatives
- 6.6 Competitive Strategy Mapping
- 6.6.1 Leader, Challenger, Follower & Niche Classification
- 6.6.2 Pricing Strategy Comparison
- 6.6.3 Channel Strategy Matrix
Note: Strategic developments are included based on their materiality and the availability of reliable information.
Chapter 7. Global Compressed Air Energy Storage Market – By Sales & Delivery Channel
- 7.1 Segment Overview
- 7.1.1 Volume & Revenue Split by Channel (2024 & 2032) (Volume Where Applicable)
- 7.1.2 Channel Mix Evolution (2024-2032)
Chapter 8. Regional Market Analysis – Global Overview
- 8.1 Global Regional Overview
- 8.1.1 Regional Volume Share (Volume Where Applicable)
- 8.1.2 Regional Revenue Share
- 8.1.3 Regional Volume by Region (Volume Where Applicable)
- 8.1.4 Regional Revenue by Region
- 8.1.5 Regional Forecast Through 2032
- 8.2 Cross-Regional Segment Analysis
- 8.2.1 By Sales & Delivery Channel
- 8.2.2 By Competitive Positioning & Price Tier
Chapter 9. North America Compressed Air Energy Storage Market
- 9.1 United States
- 9.2 Canada
- 9.3 Mexico
Chapter 10. Europe Compressed Air Energy Storage Market
- 10.1 Germany
- 10.2 France
- 10.3 Italy
- 10.4 United Kingdom
- 10.5 Spain
- 10.6 Poland
- 10.7 Russia
- 10.8 Netherlands
- 10.9 Belgium
- 10.10 Sweden
- 10.11 Denmark
- 10.12 Norway
- 10.13 Rest of Europe
Chapter 11. Asia Pacific Compressed Air Energy Storage Market
- 11.1 China
- 11.2 India
- 11.3 Japan
- 11.4 South Korea
- 11.5 Thailand
- 11.6 Indonesia
- 11.7 Vietnam
- 11.8 Malaysia
- 11.9 Australia
- 11.10 Rest of Asia Pacific
Chapter 12. Latin America Compressed Air Energy Storage Market
- 12.1 Brazil
- 12.2 Argentina
- 12.3 Colombia
- 12.4 Chile
- 12.5 Rest of Latin America
Chapter 13. Middle East Compressed Air Energy Storage Market
- 13.1 Saudi Arabia
- 13.2 United Arab Emirates
- 13.3 Turkey
- 13.4 Israel
- 13.5 Iran
- 13.6 Rest of the Middle East
Chapter 14. Africa Compressed Air Energy Storage Market
- 14.1 South Africa
- 14.2 Egypt
- 14.3 Nigeria
- 14.4 Morocco
- 14.5 Rest of Africa
Chapter 15. Compressed Air Energy Storage Company Profiles
- 15.1 [Company 01]
- 15.1.1 Company Overview
- 15.1.2 Key Management Personnel
- 15.1.3 Products & Services Portfolio
- 15.1.4 Financial Performance
- 15.1.5 Key Market Focus & Geographic Presence
- 15.1.6 Recent Developments & Strategic Initiatives
Note: The company profile list is preliminary and may change based on research findings, market developments, data availability, and client requirements.
Chapter 16. Appendices
- Appendix A – List of Abbreviations & Acronyms
- Appendix B – Industry Classification Code Reference – Full Series
- Appendix C – Supply, Output & Operating Capacity Data Tables
- Appendix D – End-Use & Demand Base Tables
- Appendix E – Demand, Adoption & Usage Assumptions
- Appendix F – Pricing & Revenue Metric Reference Tables
- Appendix G – Company Operations & Infrastructure Database
- Appendix H – Cross-Border Trade & Activity Data Tables (Where Applicable)
- Appendix I – Regulatory Summary Tables
- Appendix J – Primary Research Participant List (Anonymized)
- Appendix K – Primary Research Questionnaire Framework
- Appendix L – Data Sources & Bibliography
- Appendix M – Market Size Divergence & Source Comparison
Chapter 17. Research Methodology
- 17.1 Research Framework & Philosophy
- 17.2 Secondary Research – Sources, Hierarchy & Data Extraction
- 17.3 Data Modeling – Bottom-Up & Top-Down Market Sizing
- 17.4 Primary Research – Stakeholder Framework, LOI & Sample Sizes
- 17.5 Forecast Methodology – Regression, Scenario & Sensitivity Analysis
- 17.6 Quality Control – Four-Layer Validation Framework
- 17.7 Limitations & Standard Assumptions
- 17.8 Disclaimer
