Steam and captured CO2 carry growth in mature fields
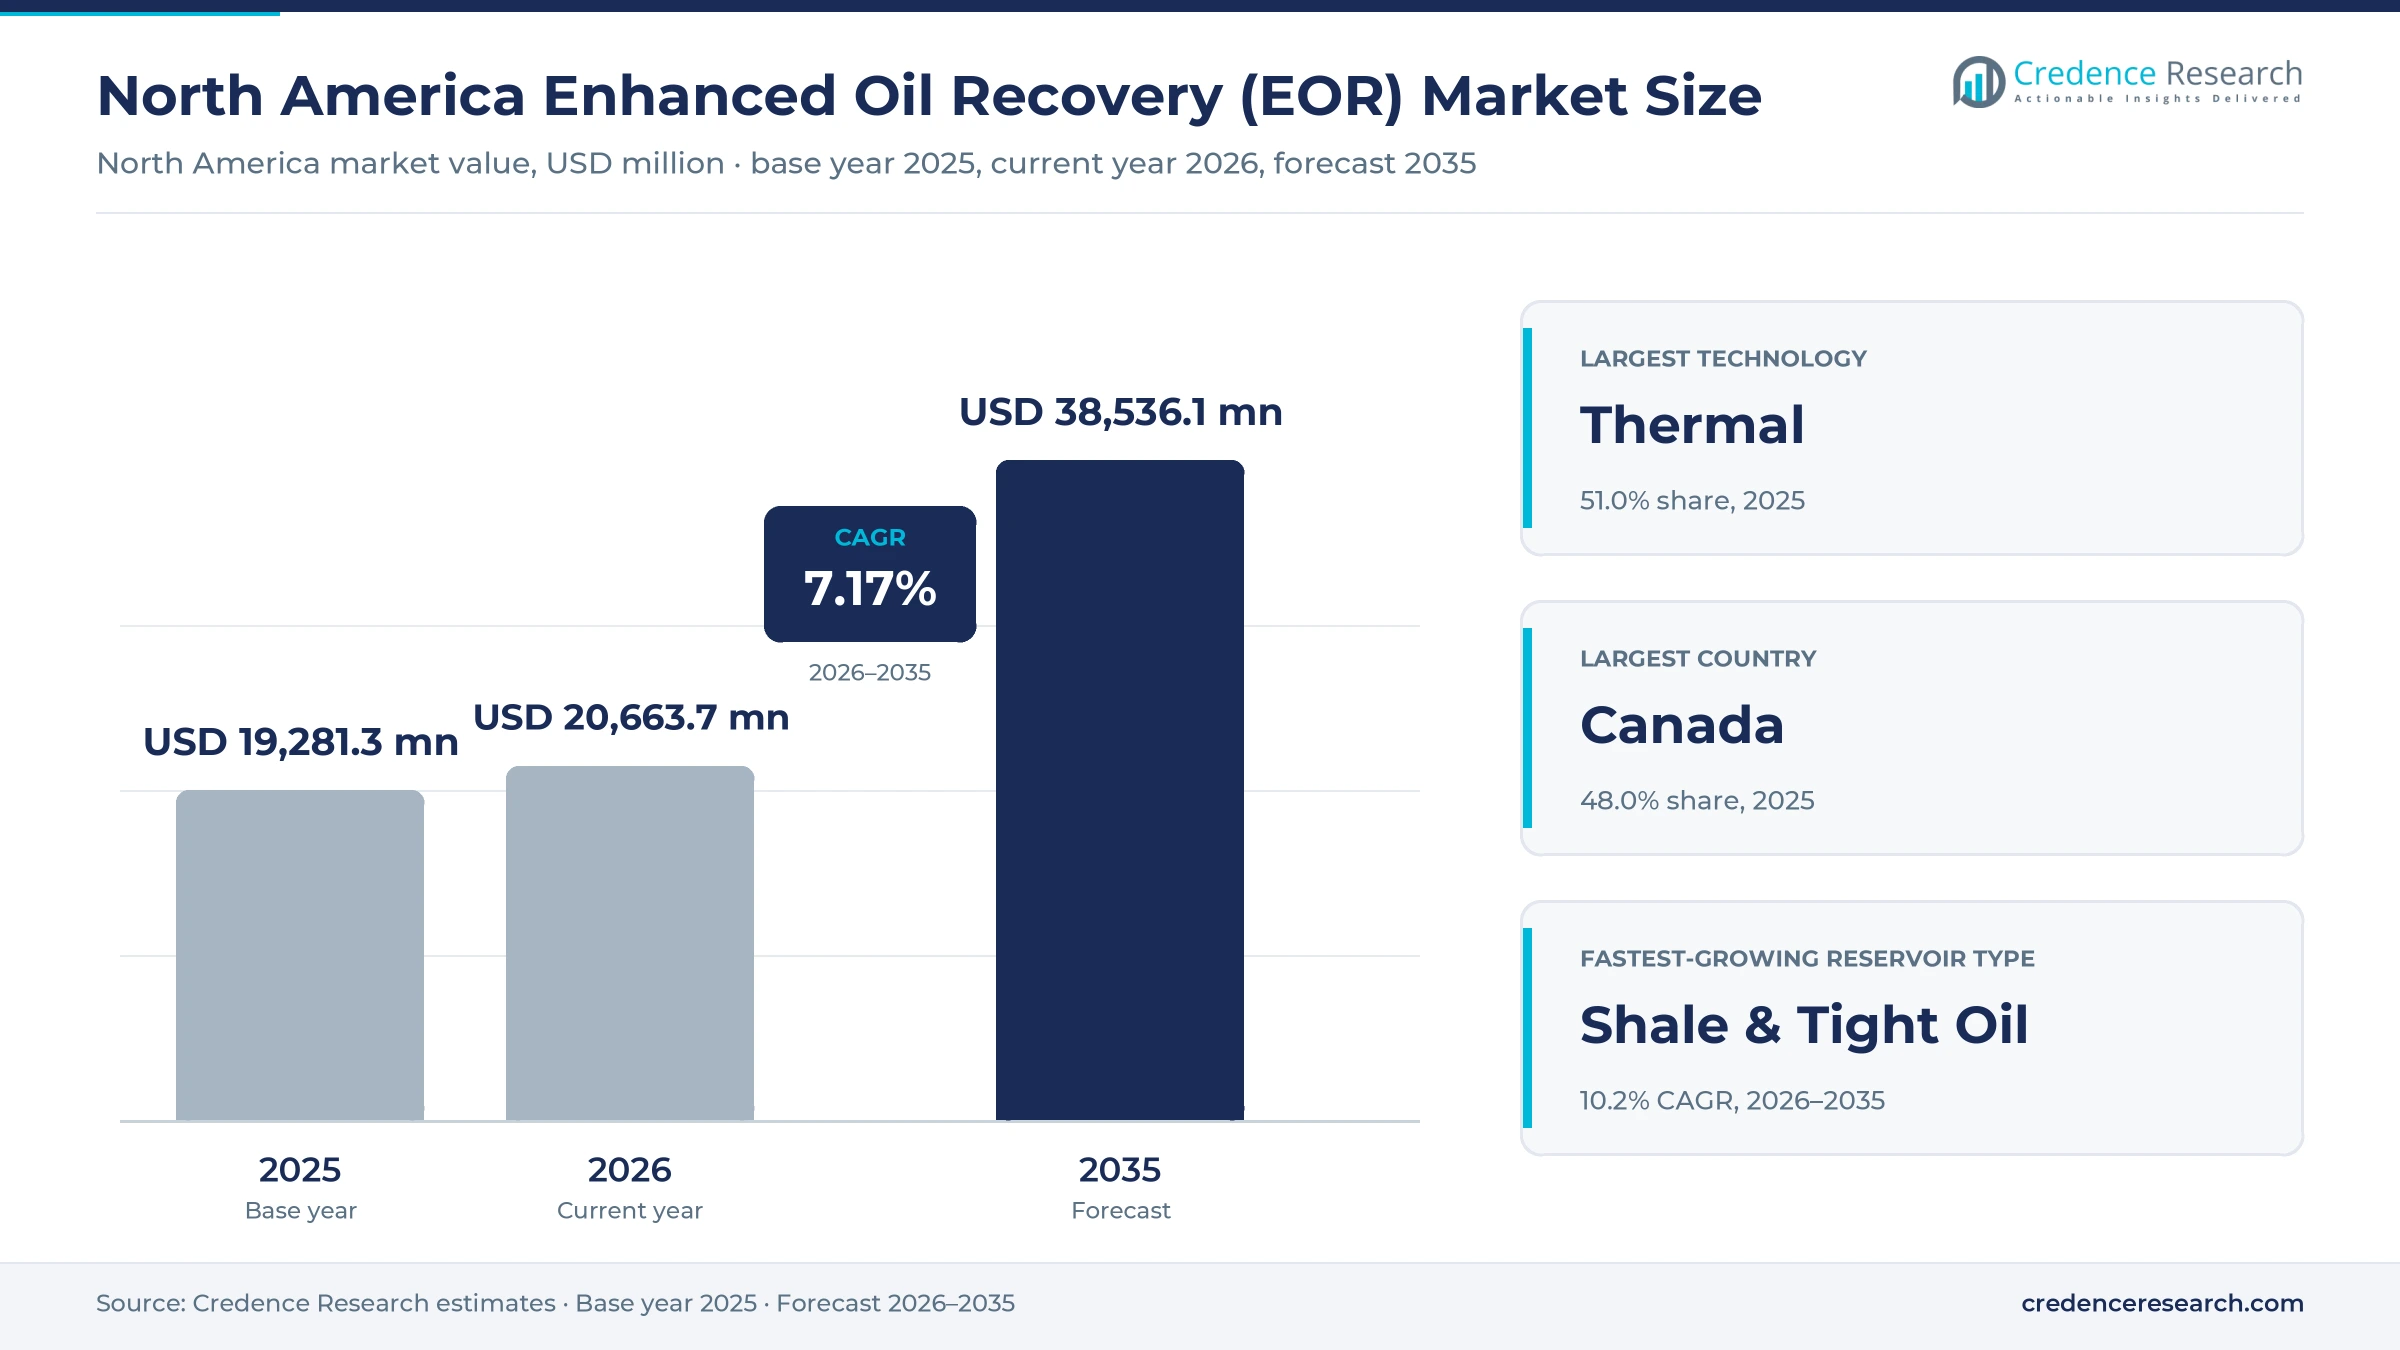
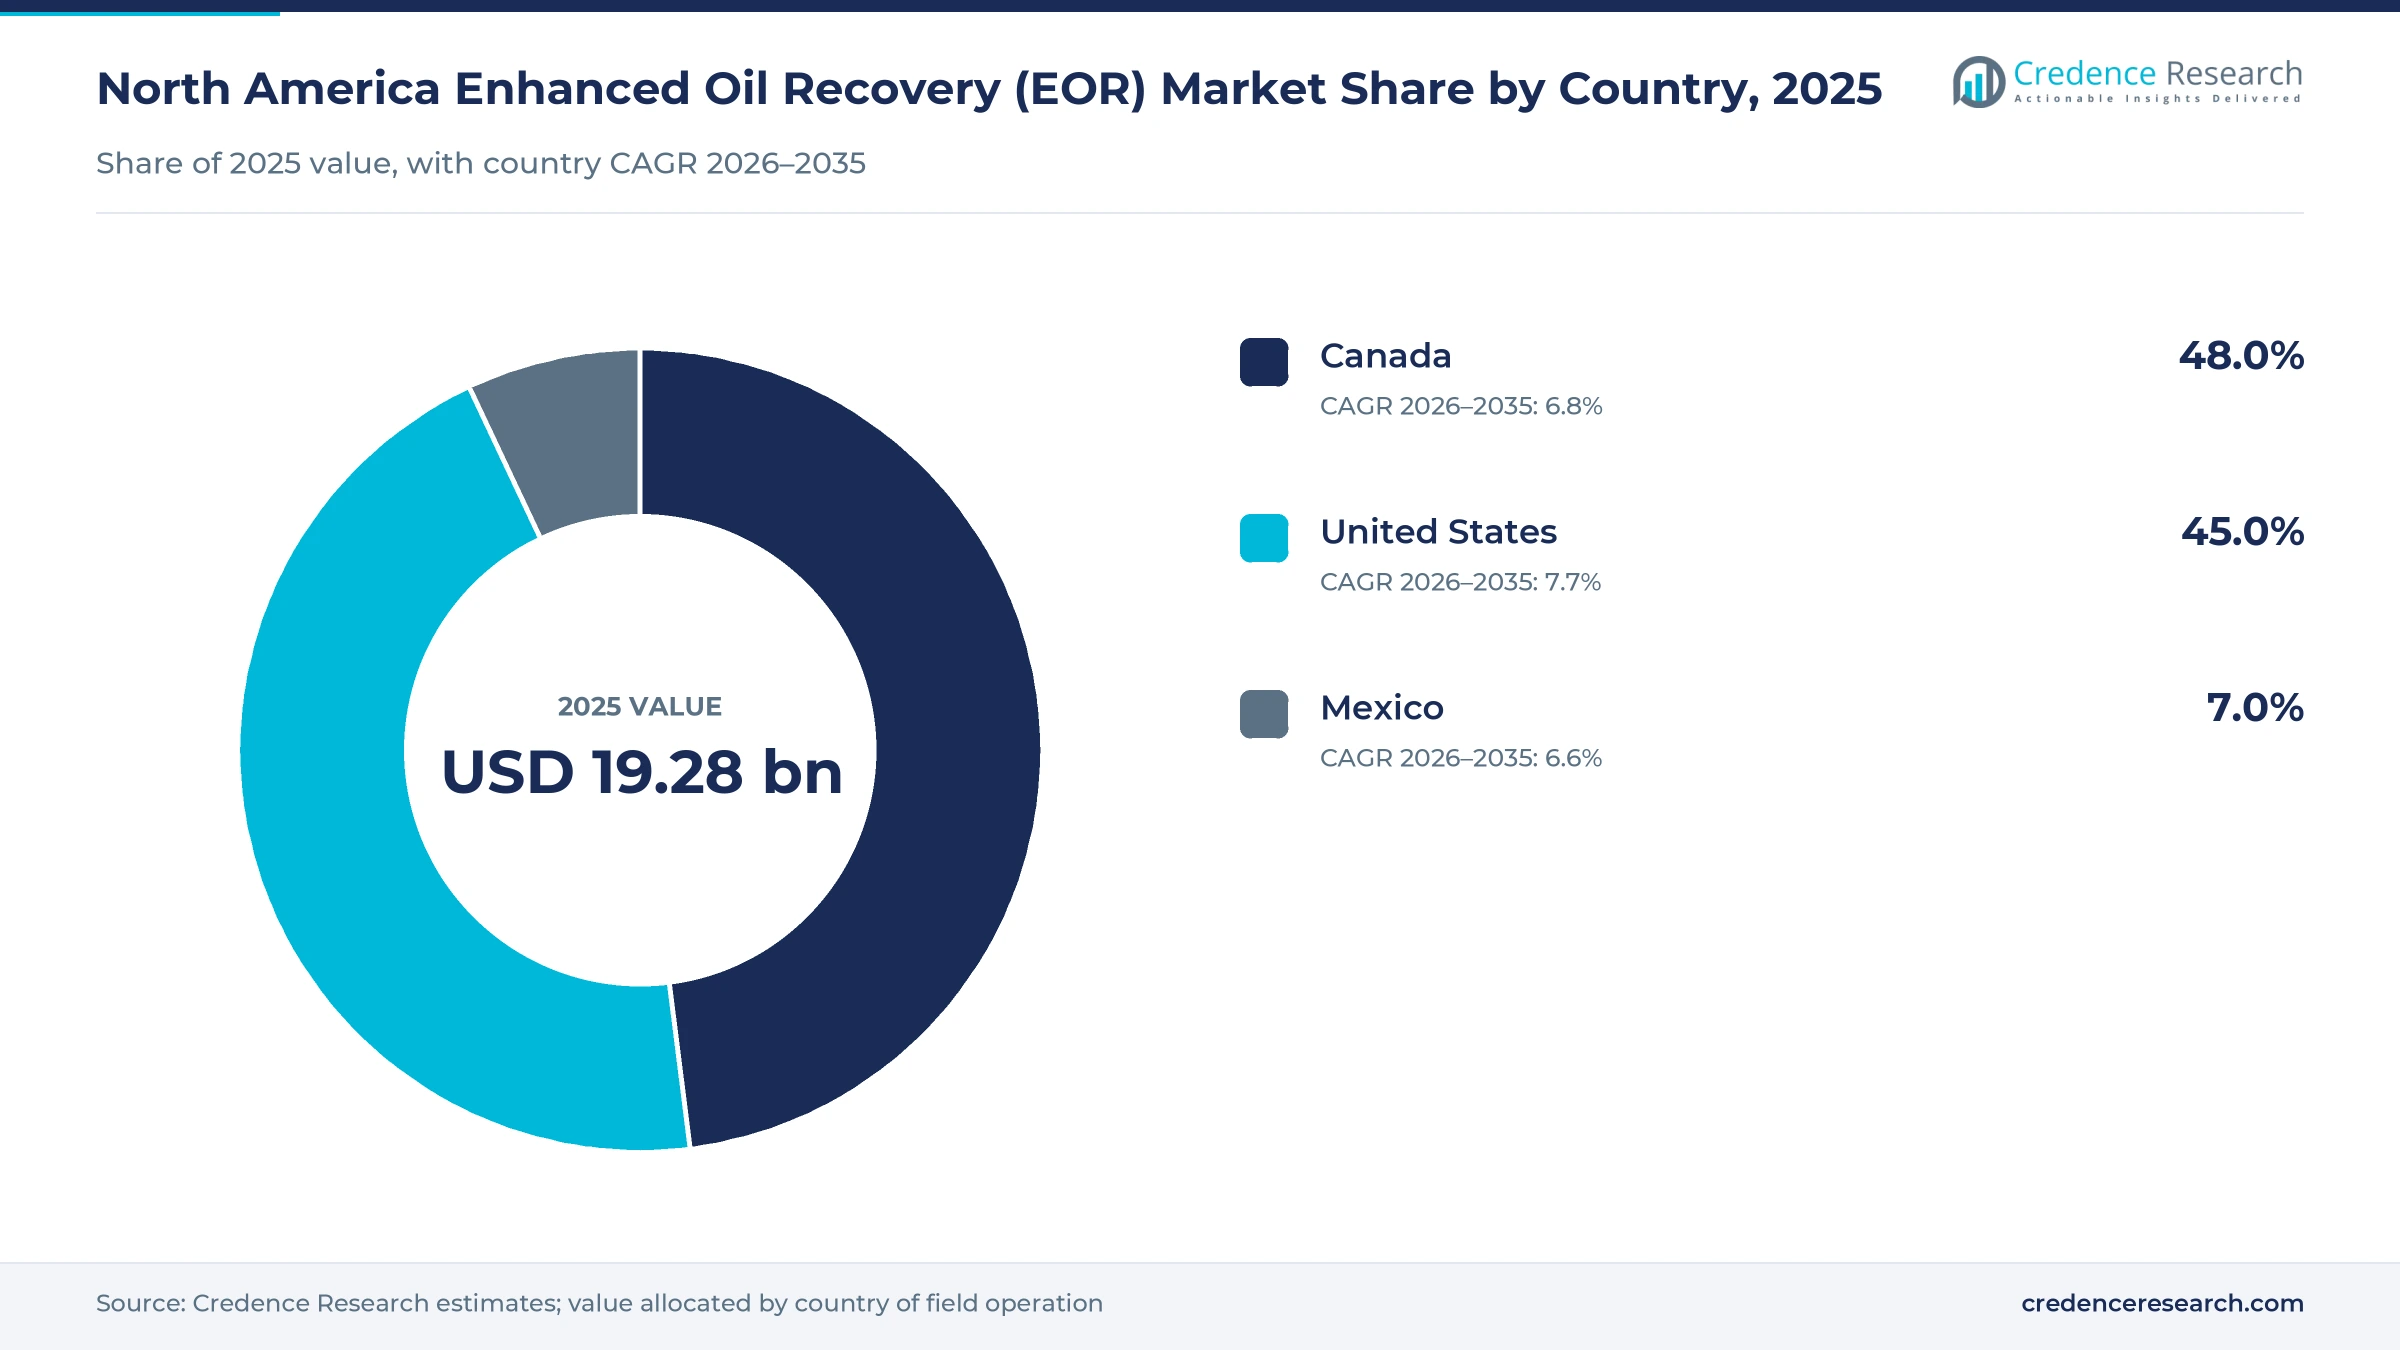
The North America enhanced oil recovery (EOR) market was valued at USD 19.28 billion in 2025 and is projected to increase from USD 20.66 billion in 2026 to USD 38.54 billion by 2035, registering a CAGR of 7.17% during 2026–2035. Demand comes from oil sands producers that inject steam to move bitumen, from Permian and Gulf Coast operators that flood mature fields with CO2, and from Pemex, which injects nitrogen to hold pressure in its largest offshore fields. Canada held the largest country share, 48.0% in 2025, because in situ bitumen output depends on steam for every barrel produced. The United States is the fastest-growing country at 7.7% a year, as CO2 captured at industrial plants adds to natural supply. The main policy change came in July 2025, when a federal budget law gave CO2 used in oil fields the same tax credit as CO2 placed in dedicated storage, which lowered the effective cost of captured CO2 for flood operators.
Steam, CO2 and nitrogen injection make up most spending
The market counts what operators spend to recover oil beyond primary and waterflood output in the United States, Canada and Mexico, including injectants such as CO2, nitrogen, steam fuel and chemicals, injection and recycle equipment, and field services. CO2 and steam that operators produce for their own fields are valued at cost, so integrated producers count as suppliers as well as buyers.
The count excludes enhanced gas recovery, ordinary waterflooding, hydraulic fracturing and the value of the crude itself. Value flows from CO2 sources, gas suppliers and chemical makers through pipelines and steam plants to injection wells, while service companies handle surveillance, workovers and reservoir modeling.
North America Enhanced Oil Recovery (EOR) Market Insights
- The North America enhanced oil recovery (EOR) market rises from USD 19.28 billion in 2025 to USD 38.54 billion by 2035, a 7.17% CAGR during 2026–2035, on captured CO2 and bitumen growth.
- Canada held 48.0% of 2025 value, as Alberta in situ bitumen output reached 1,950 thousand barrels a day in 2025, the Alberta Energy Regulator reports.
- Thermal recovery led with 51.0% of 2025 value, because SAGD and cyclic steam wells supply nearly all in situ bitumen in Alberta.
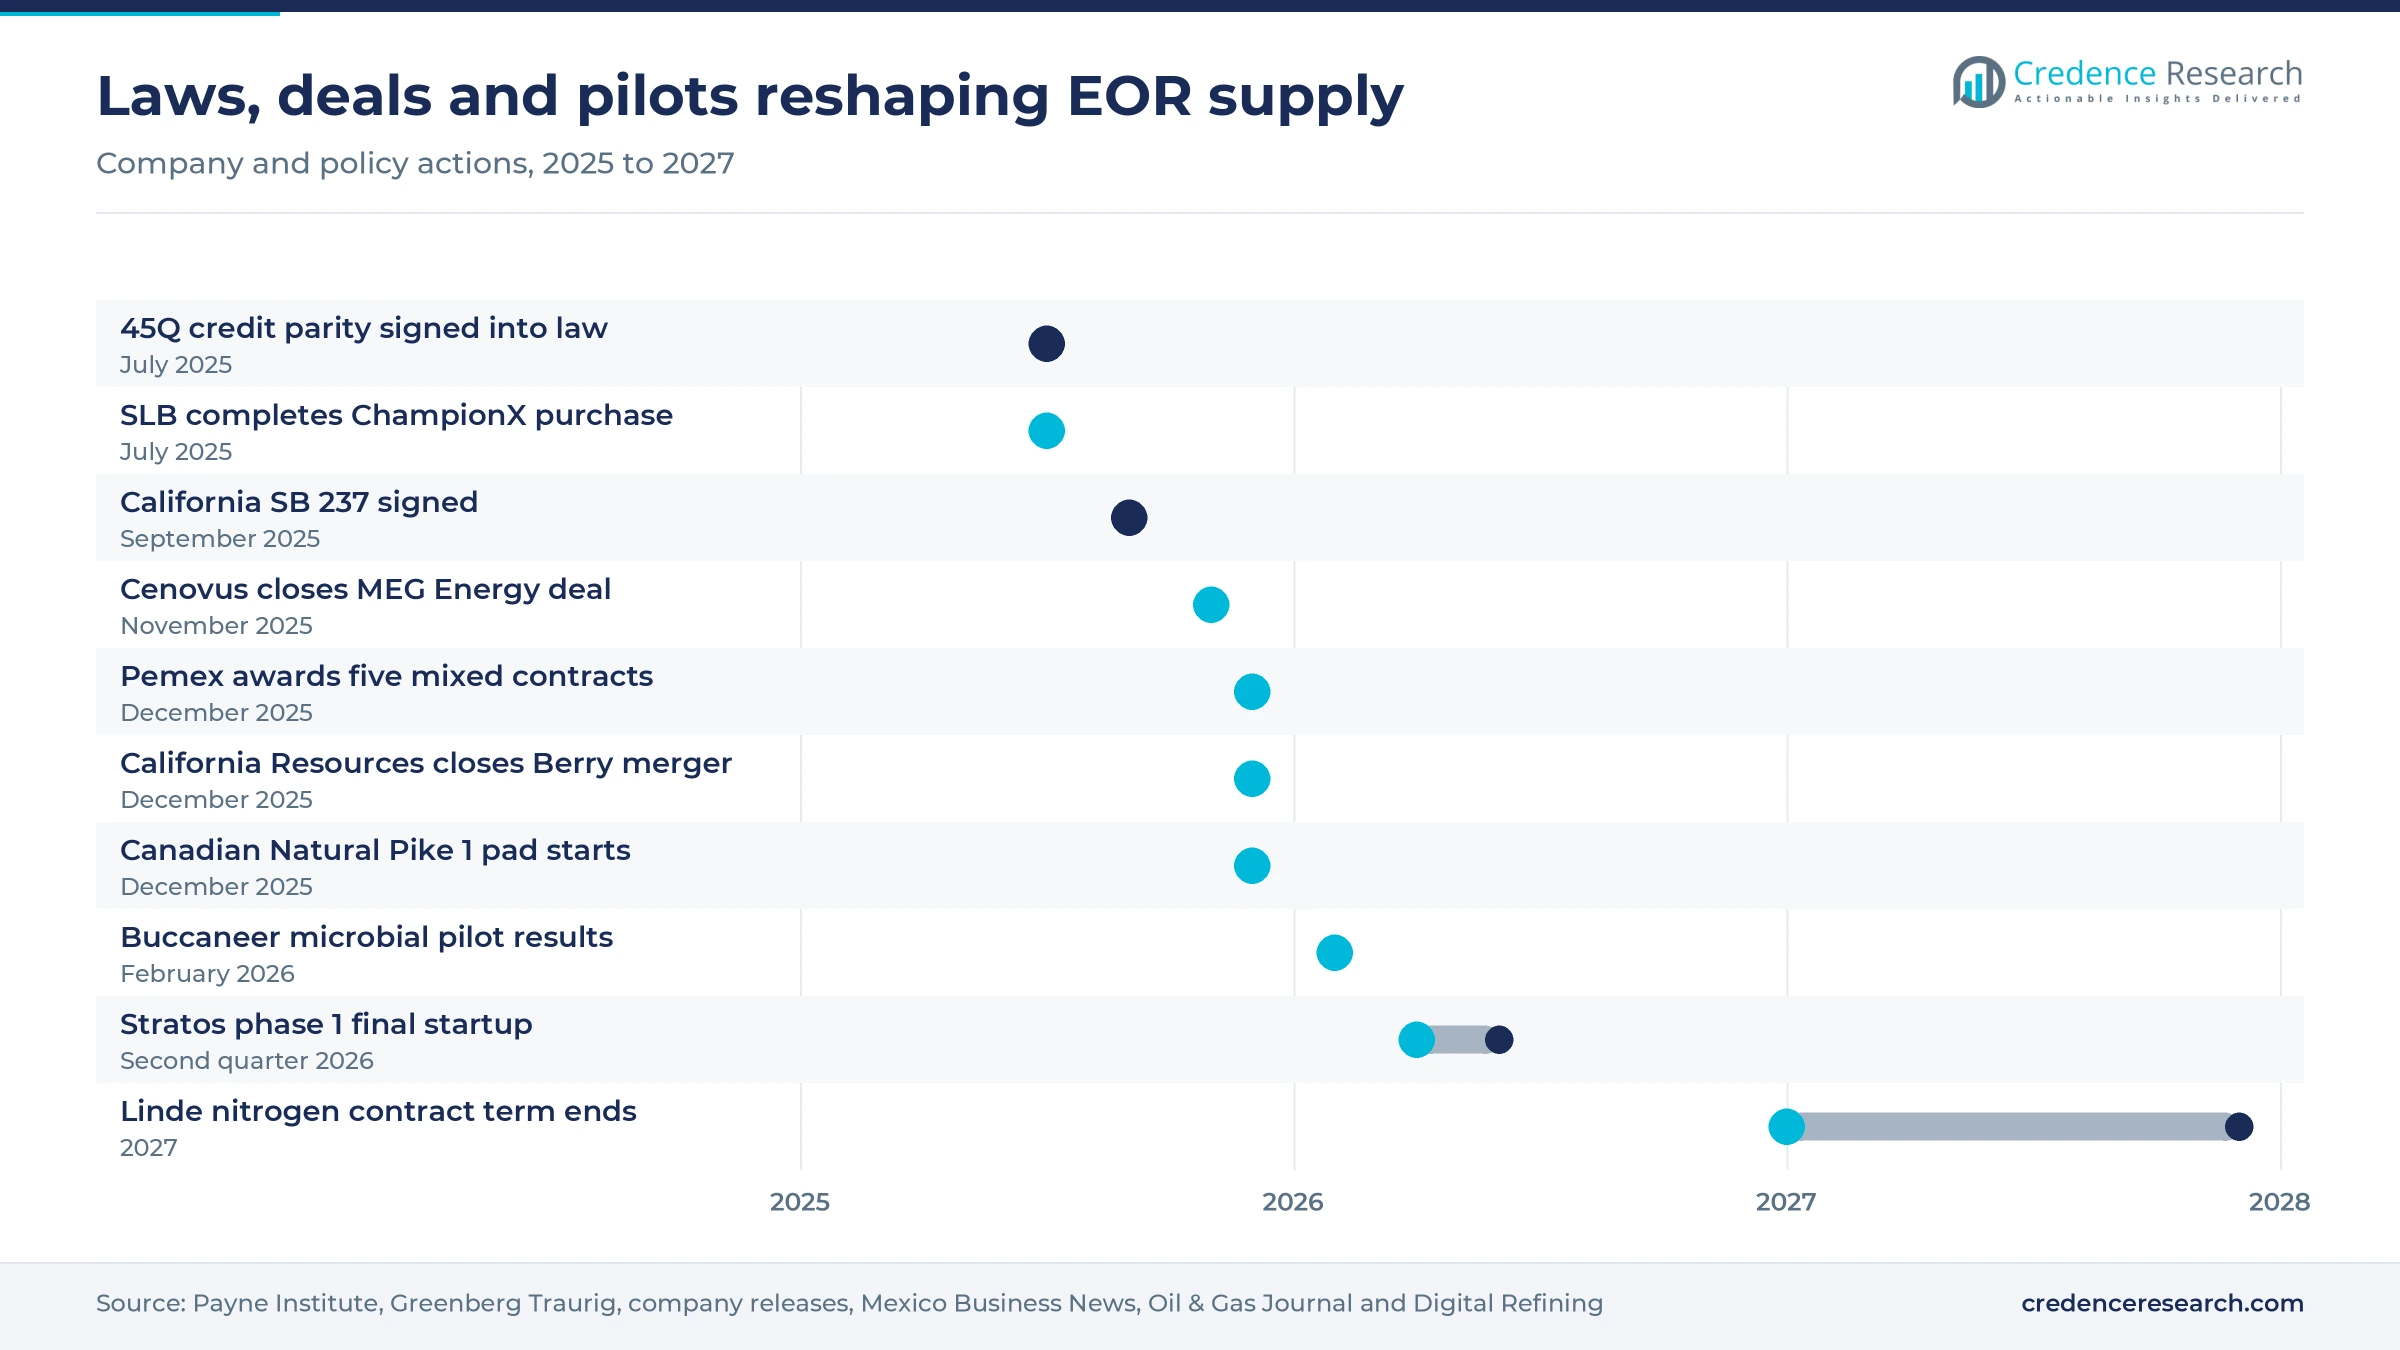
- A federal law signed on July 4, 2025, gave CO2 used for oil recovery the same USD 85 per metric ton credit as CO2 in dedicated storage.
- Cenovus closed its MEG Energy purchase on Nov. 13, 2025, adding about 110,000 barrels a day of oil sands output next to its Christina Lake asset.
Thermal recovery leads while gas injection grows fastest
Steam leads while CO2 and gas injection gain share
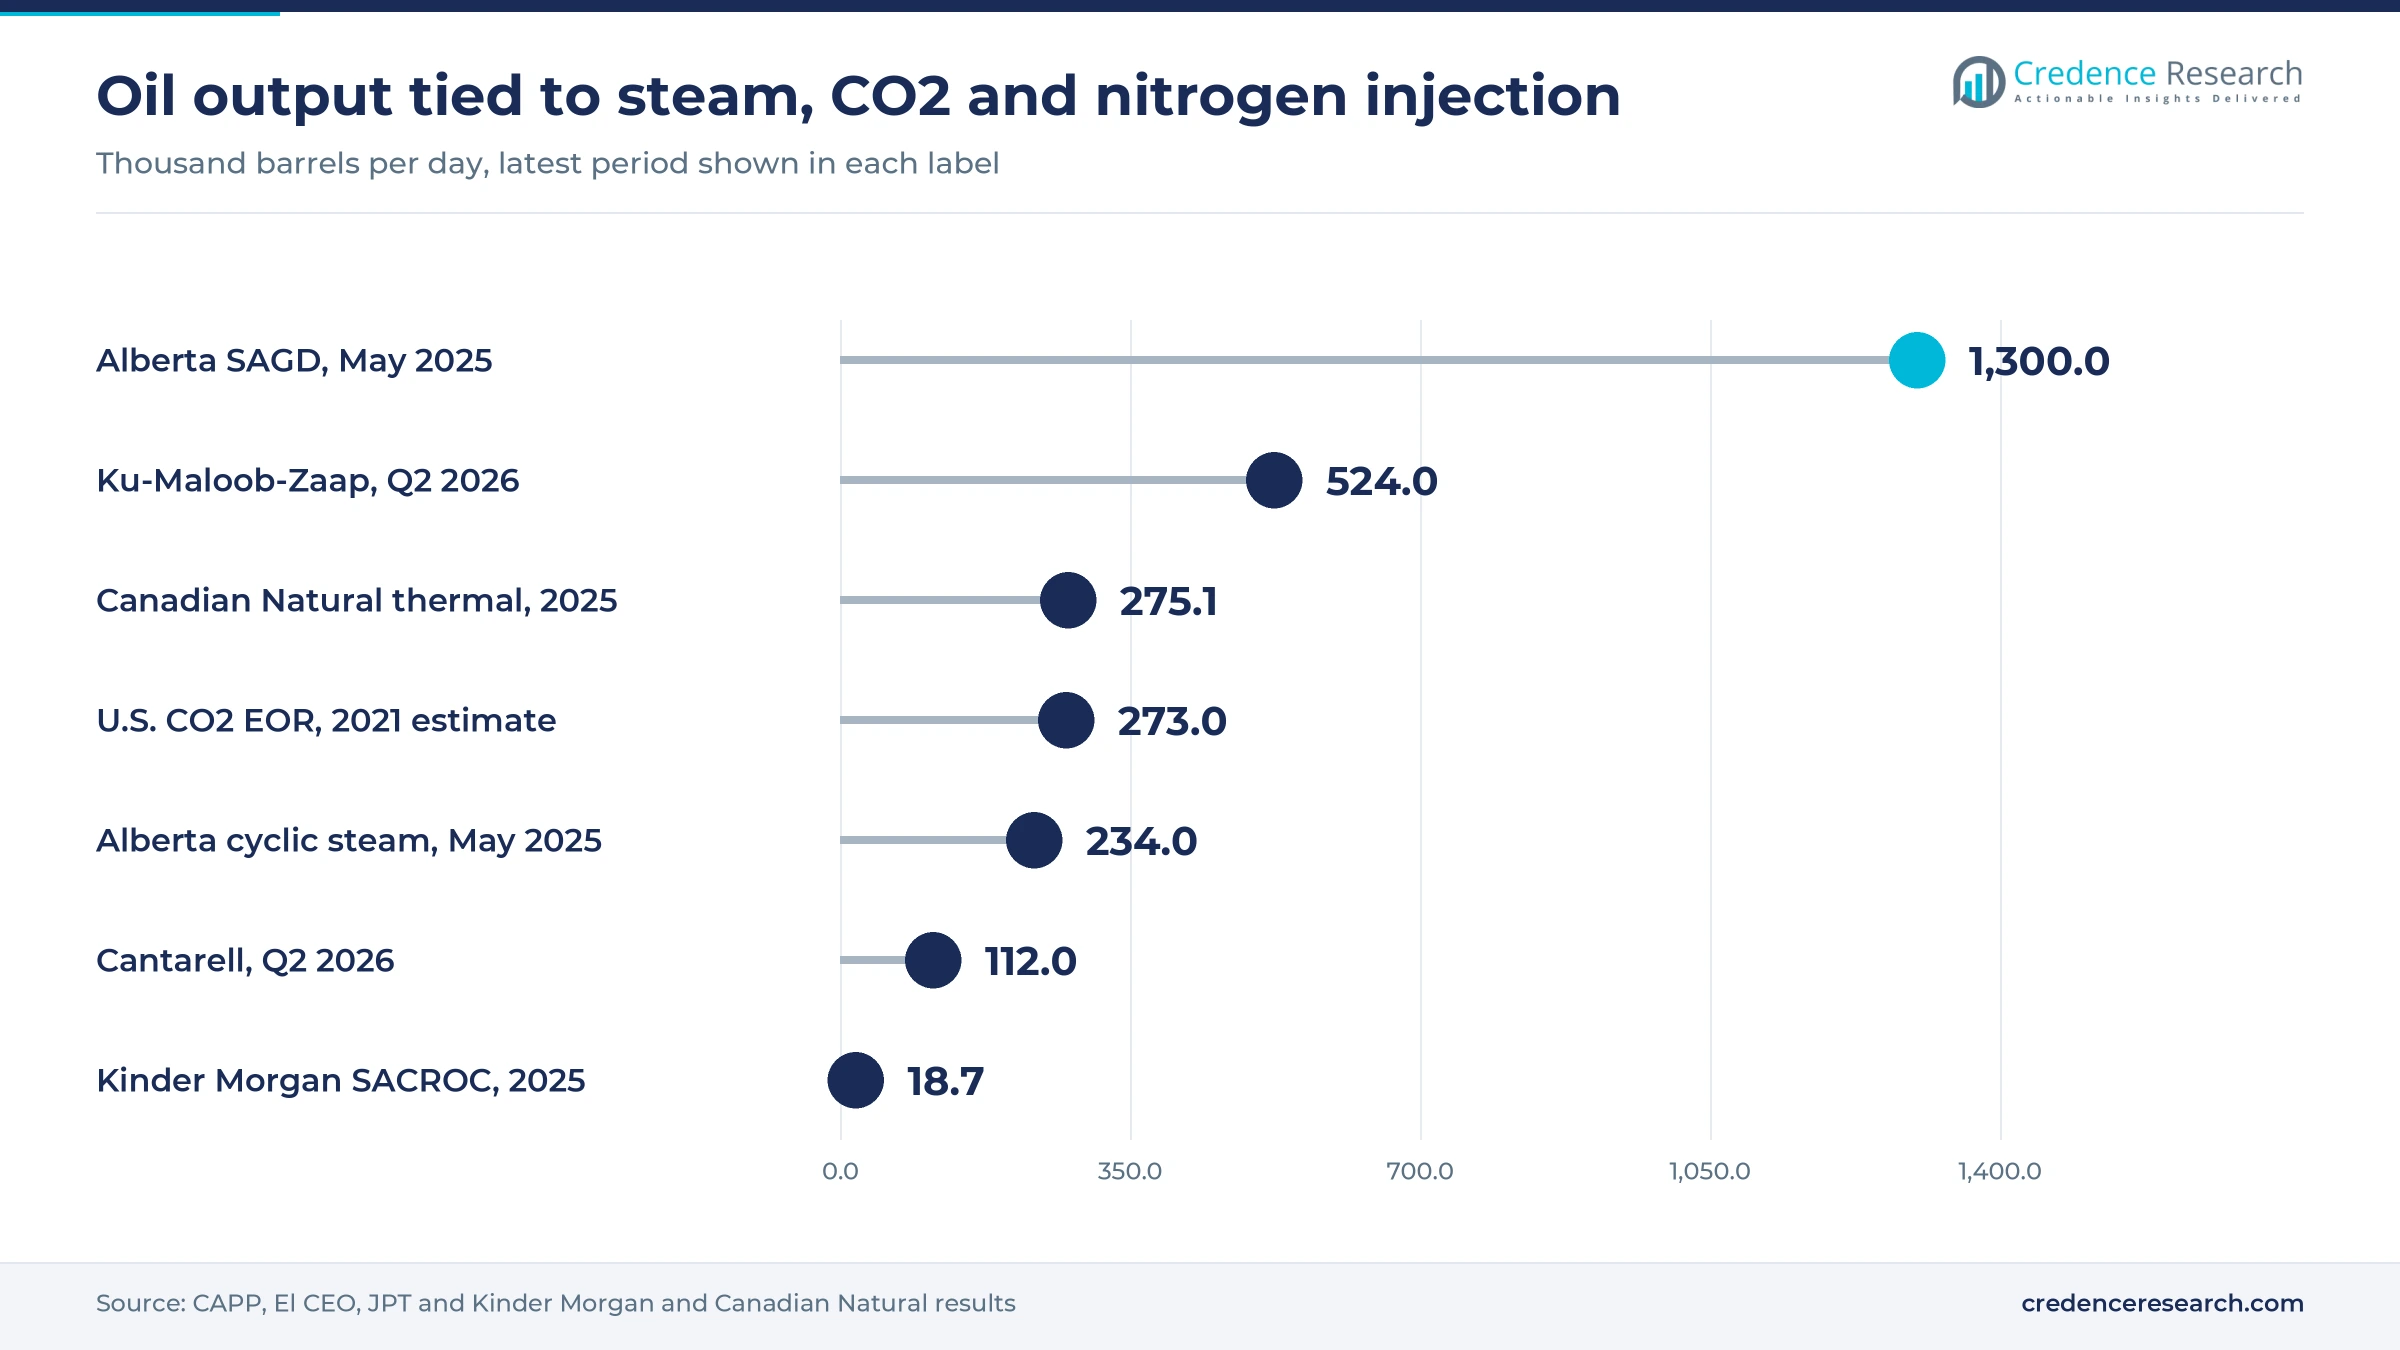
Based on technology, the market is categorized into thermal, gas injection, chemical and others. Thermal led with 51.0% of 2025 value because Alberta bitumen needs heat to flow. SAGD wells produced about 1.3 million barrels a day and cyclic steam wells about 234,000 barrels a day in May 2025, which anchors steam demand, CAPP data show. Gas Injection grows fastest at 7.8% a year, as Occidental alone injects 2.0 billion cubic feet of CO2 a day in the Permian. Chemical floods built on polyacrylamide stay small, and microbial methods in others remain at pilot scale.
Onshore fields hold most value and keep gaining
Based on application, the market is categorized into onshore and offshore. Onshore led with 88.0% of 2025 value because oil sands, Permian CO2 floods and California steamfloods all sit on land, and Kinder Morgan's SACROC and Yates CO2 floods in West Texas alone produced a net 24,650 barrels a day in 2025, its year-end results show. Onshore also grows faster, at 7.3% a year, as captured CO2 reaches inland floods by pipeline. Offshore value centers on Mexico, where nitrogen injection supports the Cantarell and Ku-Maloob-Zaap reservoirs, and it loses share as both fields deplete.
Heavy oil leads while shale injection grows fastest
Based on reservoir type, the market is categorized into heavy oil & oil sands, conventional light & medium oil, and shale & tight oil. Heavy Oil & Oil Sands led with 56.0% of 2025 value because heavy crude needs heat, solvent or polymer to move, and Canadian Natural says polymer flooding at Pelican Lake can lift ultimate recovery to about 28% of oil in place. A University of Alaska Fairbanks and Hilcorp polymer pilot at Milne Point also produced more heavy oil than water injection, the state said in October 2022. Shale & Tight Oil grows fastest at 10.2% a year as shale CO2 pilots by Occidental beat baseline output by a wide margin, JPT reported in September 2026.
| Segment Group | Leading Sub-segment | Share, 2025 | Fastest-growing Sub-segment | CAGR, 2026–2035 |
|---|---|---|---|---|
| By Technology | Thermal | 51.0% | Gas Injection | 7.8% |
| By Application | Onshore | 88.0% | Onshore | 7.3% |
| By Reservoir Type | Heavy Oil & Oil Sands | 56.0% | Shale & Tight Oil | 10.2% |
Tax credits and CO2 costs set flood economics
CO2 floods are priced per metric ton or per thousand cubic feet of CO2 delivered, and contracts are often confidential, as SaskPower says of its supply deal with Whitecap. Under the credit parity described in the drivers, a captured ton can be sold below its capture cost and still clear. Thermal costs track natural gas burned per barrel, which makes the steam-oil ratio the main cost lever in Alberta. Royalty design also matters, since Saskatchewan charges only 1% of gross EOR revenue before payout. Suppliers with low-cost captured CO2 gain pricing power over floods that lack pipeline options.
| Price, credit or fee | Typical price or fee | Basis |
|---|---|---|
| 45Q credit for point-source CO2 used in EOR | USD 85 per metric ton, up from USD 60 | Payne Institute, July 2025 law |
| 45Q credit for direct air capture CO2 | USD 180 per metric ton, now also for utilization | Payne Institute, July 2025 law |
| Earlier Dakota Gasification CO2 supply to Weyburn | About 30 dollars per metric ton | Pipeline Online via Your West Central, September 2023 |
| Saskatchewan EOR royalty | 1% of gross revenue before payout, 20% of operating income after on Crown land | Decarbonfuse, September 2025 |
| Canada CCUS investment tax credit, EOR use (proposed) | 18.75% to 30% of eligible capital, half the storage rate | MLT Aikins, May 2026 |
Request a Free Sample
Fill in your details and we'll send you a free sample report.
- Sample data tables & charts
- Research methodology
Tax credits and oil sands growth lift injection spending
Tax credit parity lowers the cost of captured CO2
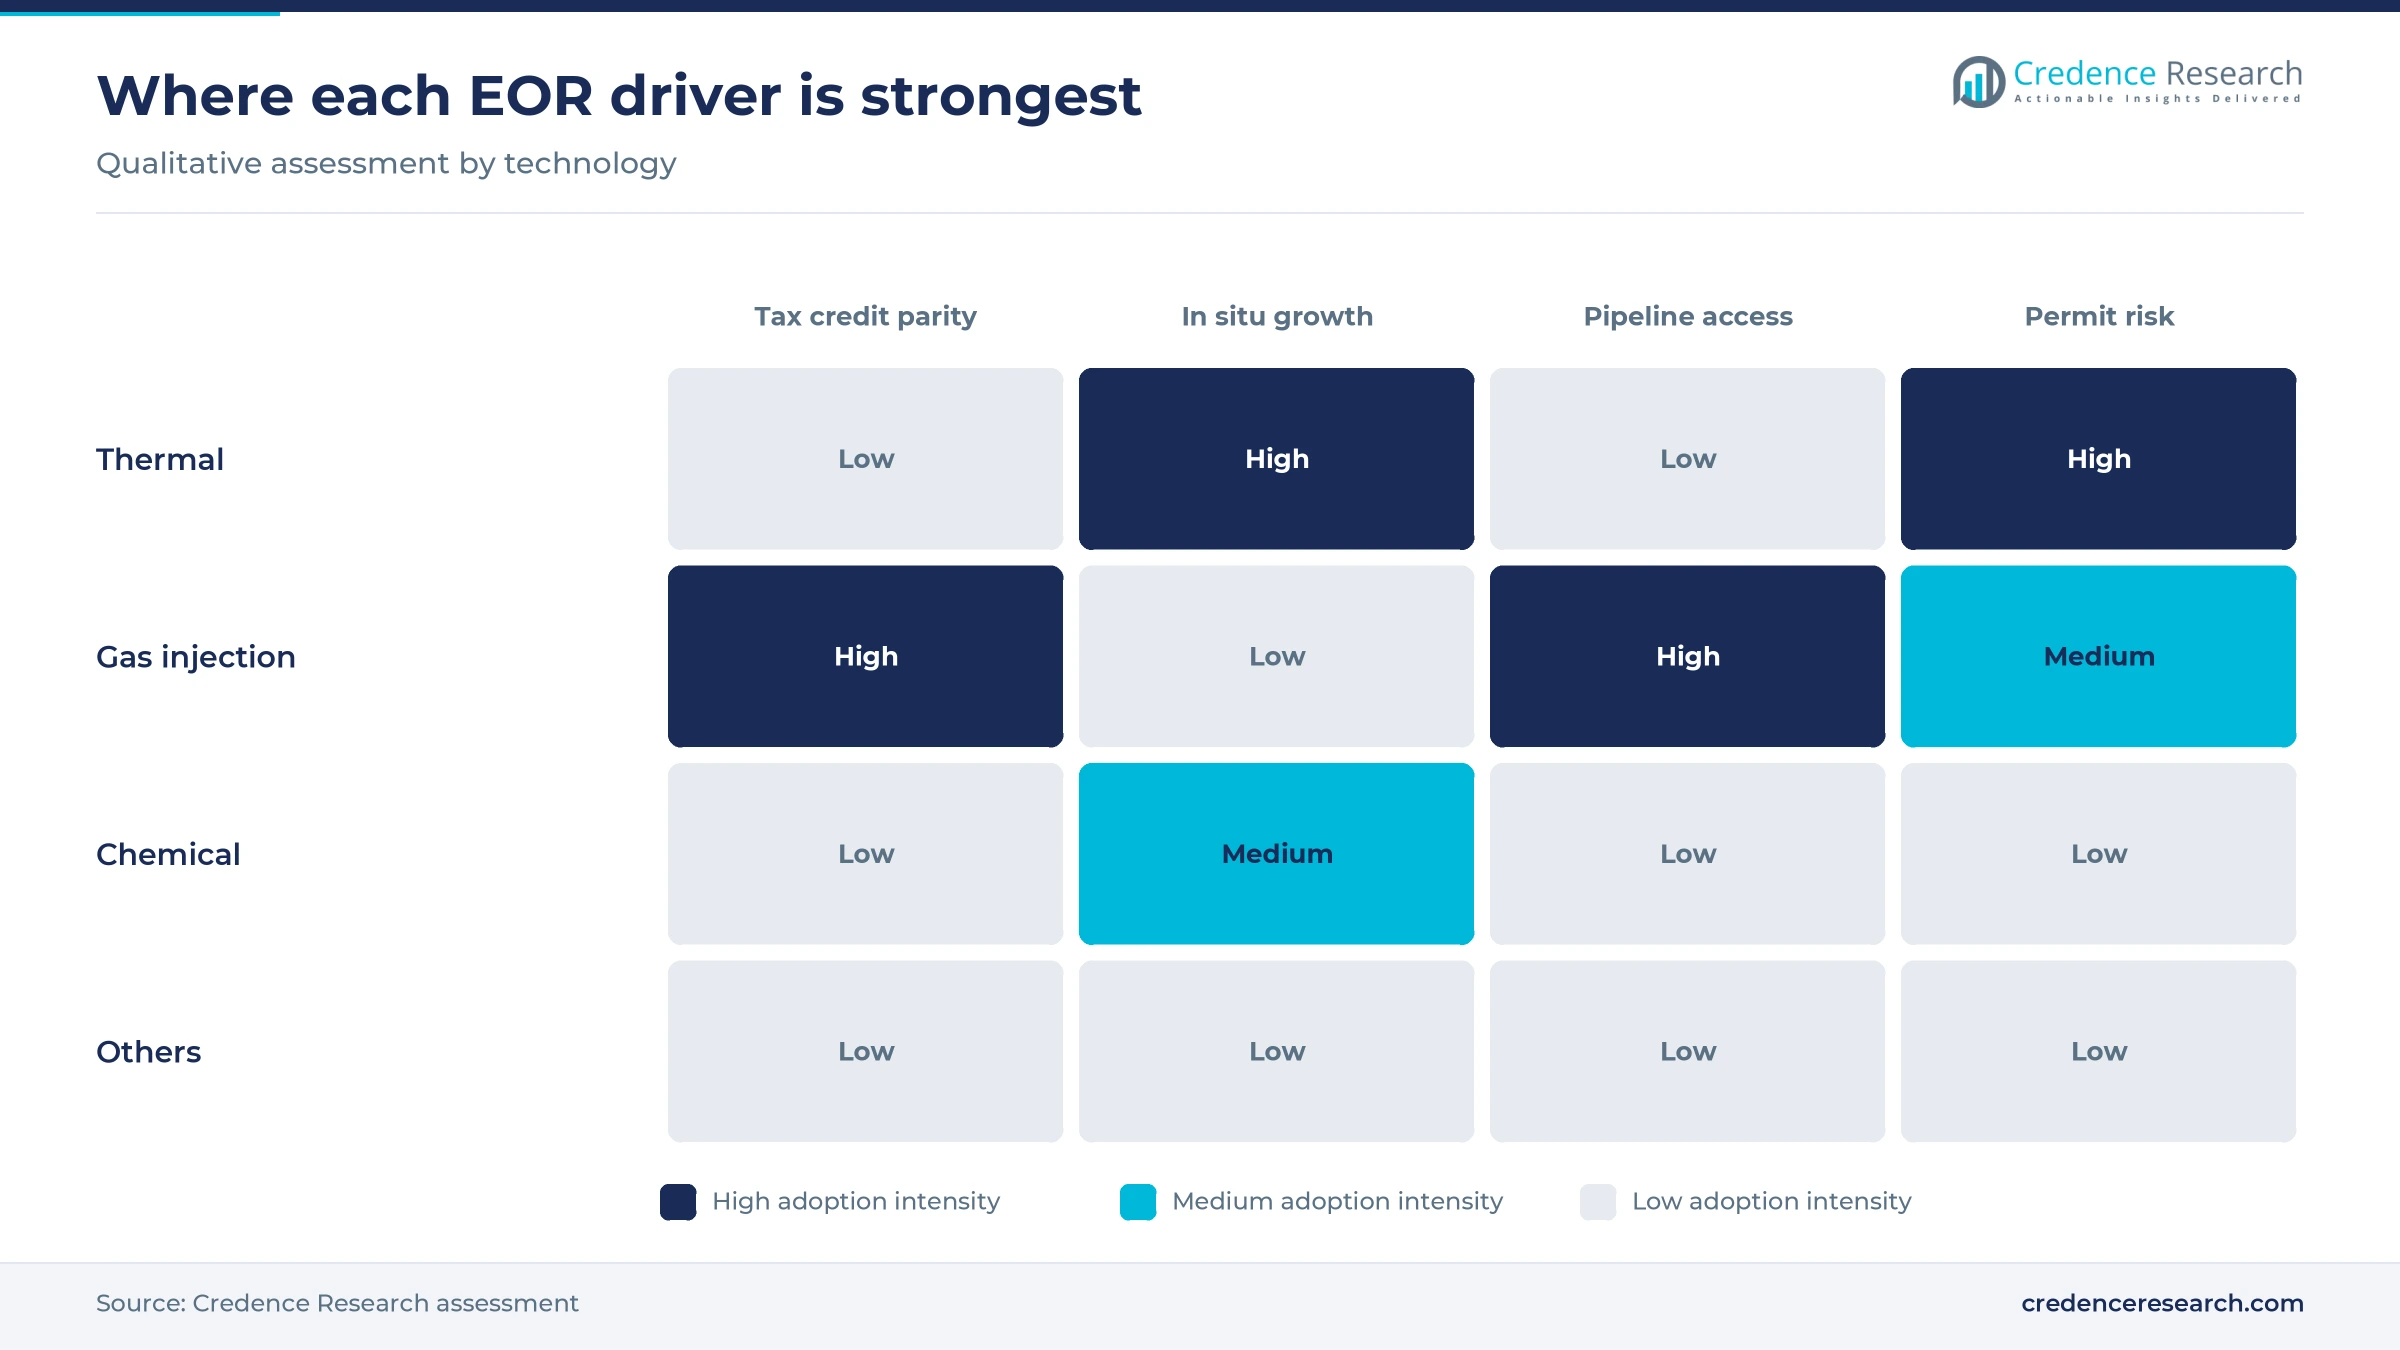
Tax credit parity has turned captured CO2 into a cheaper injectant, because operators now earn as much for CO2 left in an oil reservoir as for CO2 sent to saline storage. The federal budget law signed on July 4, 2025, kept the point-source credit at USD 85 per metric ton and extended that value to utilization, according to the Payne Institute at the Colorado School of Mines. The earlier utilization rate was USD 60 per metric ton, so each ton injected for oil recovery now earns USD 25 more. Supply already moves at scale, since Kinder Morgan sold a net 0.297 billion cubic feet of CO2 a day in 2025. Permian and Gulf Coast operators with pipeline access feel the benefit first, because fields far from CO2 sources still carry transport costs.
Rising in situ bitumen output keeps steam demand growing
Rising in situ bitumen output in Alberta keeps steam generation the largest spending line in the region, since every new SAGD or cyclic steam well needs fresh steam to produce. In situ production averaged 1,950 thousand barrels a day in 2025, up 6.1% from 2024, and supplied a 52% share of raw bitumen, according to the Alberta Energy Regulator. The regulator projects total raw bitumen output 18% higher by 2035, and the Canadian Association of Petroleum Producers says most of that growth comes from in situ projects. The same group notes that about 80% of recoverable bitumen in Alberta requires in situ methods. Producers carry the gas bill, so steam generator, water treatment and well service contracts in Athabasca and Cold Lake scale directly with new well pads.
Permian CO2 networks make each new flood cheaper
Decades of CO2 flooding have left the Permian Basin with injection networks that make each new flood cheaper than a standalone project. The basin produced 6.6 million barrels a day in 2025, close to half of national crude output, the U.S. Energy Information Administration reports, so CO2 flood demand sits beside a deep service base. Occidental lists access to 2,500 miles of CO2 pipeline and ultimate recovery gains of 10% to 25% in flooded fields on its EOR operations page. ExxonMobil gained nearly 925 miles of CO2 pipelines in Louisiana, Texas and Mississippi when it closed the Denbury purchase in November 2023. Because these owners control access to CO2, smaller operators pay delivered prices that set the floor on their flood economics.
Kern County permits reopen California steamflood work
California's reopening of Kern County permitting supports steamflood spending in the San Joaquin Valley, where heavy oil needs heat to flow. Governor Gavin Newsom signed SB 237 on Sept. 19, 2025, allowing up to 2,000 drilling permits a year in Kern County with the state geologic energy agency as lead agency, law firm Greenberg Traurig reported. In-state output has declined since 1985, and two refineries have announced closures, which sharpened concern over local crude supply. California Resources completed its all-stock combination with Berry Corporation on Dec. 18, 2025, adding assets in its core San Joaquin Basin. Steam and well service contractors in Kern County gain a steadier order book, although the permit protections carry a 10-year sunset.
Captured CO2 and low-steam designs reshape supply
Floods shift toward captured CO2 from plants and air
EOR operators are shifting toward CO2 captured at plants and from air to reduce reliance on naturally sourced CO2, creating openings for capture, compression and pipeline suppliers across North American floods. ExxonMobil's LaBarge plant in Wyoming, expanded in 2010 to capture about 365 million cubic feet of CO2 a day, remains the main captured source for Rocky Mountain floods, Oil & Gas Journal reported. In Alberta, the Alberta Carbon Trunk Line can carry up to 14.6 million metric tons a year over 240 kilometers to Enhance Energy's Clive field, Wolf Midstream says. Occidental's 1PointFive said in March 2026 that phase 1 of its Stratos direct air capture plant was in final startup, Oil & Gas Journal reported. Stratos holds saline storage permits, so its tonnage targets storage credits rather than floods.
Solvent-assisted and low-steam designs spread in situ
In situ producers are shifting toward solvent-assisted and lower-steam designs to cut gas use and emissions per barrel, creating openings for solvent supply, downhole monitoring and steam efficiency services at Cold Lake and Athabasca projects. Imperial started the first commercial solvent-assisted SAGD at Grand Rapids in Cold Lake in May 2024, targeting 15,000 gross barrels a day and up to 40% lower emissions intensity. The most efficient SAGD projects run below 3.0 barrels of steam per barrel of oil, according to the Canadian Association of Petroleum Producers. Canadian Natural started its Pike 1 pad in December 2025 at a steam-to-oil ratio of about 1.8, its year-end results show. Each cut in that ratio lowers the gas burned per barrel and protects margins when gas prices rise.
CO2 injection in shale wells opens a large new volume
CO2 and gas injection in shale wells offers the largest untapped volume for EOR suppliers, because tight oil wells decline quickly after completion and leave most oil in place. Occidental's shale CO2 pilots raised production 40% to 50% above baseline, JPT reported in September 2026. ExxonMobil has proposed a 900-mile CO2 network it calls a carbon superhighway. A network of that length would let industrial CO2 reach tight oil fields that now lack any supply. Compression, gas handling and reservoir modeling suppliers stand to gain if pilots convert to multi-well programs. Results still vary by well, and most shale acreage remains at pilot stage, which keeps this opening uncertain in timing.
Verified storage in oil fields opens monitoring work
Operators that can prove permanent storage in oil fields can sell verified metric tons as well as barrels, which opens work for monitoring, reporting and verification services. Occidental says it received the first two EPA-certified monitoring plans for CO2 injection, at its Denver Unit in 2015 and Hobbs Unit in 2017, and added West Seminole San Andres in 2021. Saskatchewan's Weyburn project had stored more than 44 megatonnes of CO2 and produced over 120 million barrels of oil by September 2025, the Saskatchewan government said. Providers of carbon capture and storage services that pair seismic monitoring with well integrity checks can serve credit buyers and regulators at once.
CO2 supply limits and permit risks slow new floods
Canada's capture credit pays oil fields only half
Canada's capture credit still favors dedicated storage over oil fields, which leaves floods in Saskatchewan and Alberta competing for captured CO2 on weaker terms. The April 28, 2026, Spring Economic Update proposed making EOR an eligible use, but at half the standard rates, 25% for capture equipment against 50% for storage, and only where at least 95% of the CO2 stays underground, law firm MLT Aikins reported. The change is not yet law, and draft legislation had not been released by May 2026. Operators such as Whitecap Resources remain exposed until the rules pass and provinces are designated.
CO2 supply, not reservoirs, caps U.S. flood growth
CO2 supply, rather than reservoir potential, limits how fast floods expand across the United States. Combined CO2 EOR output was about 273,000 barrels a day in a 2021 Enhanced Oil Recovery Institute estimate that JPT called dated in September 2026, and no newer national series is published, an evidence gap. Stratos cost about USD 1.3 billion to build, the same article noted, which shows how costly new non-natural supply remains. Small operators without pipeline access are most exposed, since delivered CO2 costs rise with distance.
Mexico relies on one nitrogen supply arrangement
Mexico's offshore pressure maintenance depends on a single nitrogen supply arrangement, which concentrates risk for Pemex. Linde supplies about 1,500 million cubic feet of nitrogen a day from its Atasta plant in Campeche to the Cantarell and Ku-Maloob-Zaap reservoirs under a contract that runs through 2027, according to a January 2016 report by World Oil. Any delay in renewing or replacing that supply would hit the fields that still carry Pemex output, and offshore service contractors would lose injection work.
Litigation keeps California thermal projects uncertain
Legal challenges to permitting remain a constraint for thermal EOR in California, where steam-based recovery draws organized opposition. Kern County spent more than a decade revising its oil and gas zoning and environmental review, and its latest environmental impact report remains under challenge, Greenberg Traurig noted in October 2025. SB 237 shields new drilling from lawsuits for only 10 years. Operators planning long-life steamfloods are most exposed, because project payback can extend beyond the sunset of those protections.
Canada leads on steam while U.S. CO2 floods grow fastest
| Country | Value, 2025 (USD billion) | Share, 2025 | CAGR, 2026–2035 |
|---|---|---|---|
| Canada | 9.26 | 48.0% | 6.8% |
| United States | 8.68 | 45.0% | 7.7% |
| Mexico | 1.35 | 7.0% | 6.6% |
Canada leads because steam is built into bitumen supply
Canada held 48.0% of 2025 value and grows at 6.8% a year through 2035. Alberta had 22 SAGD and 3 cyclic steam projects producing in 2025, data from the Canadian Association of Petroleum Producers show. Cenovus completed its purchase of MEG Energy on Nov. 13, 2025, adding about 110,000 barrels a day of oil sands output beside its Christina Lake asset. Canadian Natural produced a record 275,086 barrels a day of thermal in situ bitumen in 2025. Steam spending grows with each new well pad, so Canada stays ahead even when oil prices soften.
The United States grows fastest on CO2 floods
The United States held 45.0% of 2025 value and is the fastest-growing country at 7.7% a year. Crude output reached a record 13.6 million barrels a day in 2025, the Energy Information Administration reports, and that sustains demand for compression and well services in mature basins. ExxonMobil's Denbury business brought more than 15 onshore CO2 storage sites and about 46,000 barrels of oil equivalent a day of Gulf Coast and Rocky Mountain production. Occidental says its Permian floods can store up to 20 million metric tons of CO2 a year, which links oil output to storage credits.
Mexico depends on offshore nitrogen and new partners
Mexico held 7.0% of 2025 value and grows at 6.6% a year, the slowest pace in the region. Ku-Maloob-Zaap produced about 524,000 barrels a day and Cantarell about 112,000 in the second quarter of 2026, El CEO reported, and both are in natural decline. Pemex awarded five mixed contracts to Mexican partners in December 2025 and keeps 46% to 84% of each. Mexican EOR spending hinges on offshore nitrogen and on whether partners fund recovery work onshore, and public data on Mexican EOR volumes are an evidence gap.
Acquisitions, contract awards and pilots, 2025 to 2026
| Development | Status and market relevance |
|---|---|
| In July 2025, SLB completed its acquisition of ChampionX, adding production chemicals and artificial lift to its production business. | Completed acquisition; places chemical and lift supply for North American floods inside one service group. |
| In November 2025, Cenovus Energy completed its purchase of MEG Energy, whose SAGD operations sit beside Christina Lake. | Completed acquisition; consolidates steam-based bitumen output at Christina Lake. |
| In December 2025, California Resources completed its all-stock combination with Berry Corporation. | Completed merger; consolidates San Joaquin Basin assets under one operator. |
| In December 2025, Pemex awarded five mixed contracts for onshore fields to Mexican partners. | Contract award; signing set for Dec. 19, with about 70,000 barrels a day targeted. |
| In February 2026, Buccaneer Energy reported production gains from a microbial recovery pilot in the Pine Mills field in East Texas. | Testing milestone; pilot output rose from about 15 to 30 barrels a day, and two more wells are planned. |
Recycle plants and solvent steam cut cost per barrel
- CO2 recycle plants separate and recompress CO2 produced with the oil, and Occidental runs eight such processing and recycling plants, so purchased CO2 tops up each flood rather than replacing it.
- Solvent-assisted SAGD adds light hydrocarbons to injected steam, which lowers the steam needed per barrel and cuts gas use at the steam plant.
- Polymer flooding thickens injected water so it sweeps heavy oil more evenly, so recovery improves in reservoirs where water alone channels past the oil.
- Monitoring and verification plans track injected CO2 for regulators and credit buyers, which lets a flood earn storage-linked credits alongside oil sales.
Need a Custom Version of This Report?
Tailor the scope, geography, or segments to your exact requirements.
- Custom geography or segment scope
- Direct access to our analyst team
CO2 ownership and steam efficiency decide who wins
Competition in North American EOR splits between owners of injectant supply and the service companies that keep floods running. Occidental, ExxonMobil with Denbury and Kinder Morgan compete on CO2 sources, pipeline reach and recycle capacity, and they sell surplus CO2 to independent operators. In Canada, Cenovus, Canadian Natural, Suncor and ConocoPhillips at Surmont compete on steam-oil ratio and well pad cost, since lower steam use cuts the largest operating expense. Whitecap Resources runs the Weyburn CO2 flood in Saskatchewan, while Chevron at Kern River and California Resources hold heavy oil acreage in the San Joaquin Valley. SLB, Halliburton and Baker Hughes compete for reservoir modeling, well services, artificial lift and chemicals, and Linde supplies the nitrogen that Pemex injects offshore. Buyers of enhanced oil recovery services judge suppliers on incremental barrels per dollar, injection uptime and data for credit claims, and long CO2 contracts favor incumbents.
Who controls CO2 and steam supply in the region?
Supply is concentrated where it is hardest to copy, in CO2 sources and pipelines. Occidental, ExxonMobil through Denbury and Kinder Morgan own large source and pipeline networks in the Permian, Gulf Coast and Rocky Mountains, so independents often buy delivered CO2 from them. Steam supply is integrated, because Cenovus, Canadian Natural and other oil sands producers run their own steam plants. Services are more open, with SLB, Halliburton and Baker Hughes competing with regional firms on surveillance, workovers and production chemicals. Margins sit with CO2 owners and with producers that hold low steam-oil ratios.
Operators and service firms buyers shortlist
| Company | Type | Role in the market |
|---|---|---|
| Occidental Petroleum Corporation | CO2 EOR operator and CO2 supplier | Runs Permian CO2 floods with its own source fields, pipelines and recycle plants |
| Exxon Mobil Corporation (Denbury, Imperial Oil) | CO2 pipeline owner and operator | Runs Denbury CO2 pipelines and floods and, via Imperial Oil, Cold Lake steam operations |
| Kinder Morgan, Inc. | CO2 supplier and flood operator | Sells CO2 and operates the SACROC and Yates floods in West Texas |
| Chevron Corporation | Thermal operator | Operates the steamflooded Kern River heavy oil field near Bakersfield, California |
| ConocoPhillips | In situ thermal operator | Runs the Surmont SAGD project in Alberta at full working interest |
| Cenovus Energy Inc. | In situ thermal operator | Runs SAGD at Christina Lake, enlarged by the MEG Energy purchase |
| Canadian Natural Resources Limited | Thermal and polymer flood operator | Runs Primrose, Kirby and Jackfish thermal sites and the Pelican Lake polymer flood |
| Suncor Energy Inc. | In situ thermal operator | Runs Firebag and MacKay River SAGD projects in the Athabasca region |
| Whitecap Resources Inc. | CO2 EOR operator | Operates the Weyburn CO2 flood in Saskatchewan using captured CO2 |
| California Resources Corporation | California oil producer | Operates San Joaquin Basin fields, enlarged by the December 2025 Berry combination |
| Linde plc | Nitrogen supplier | Supplies injection nitrogen to Pemex's Cantarell and Ku-Maloob-Zaap fields from Atasta |
| SLB (incl. ChampionX) | Service and chemicals supplier | Supplies reservoir modeling, production chemicals and artificial lift for floods |
CO2 supply sets the pace more than oil prices
Credence Research's view is that CO2 supply, more than oil prices, will set the pace of growth in North American EOR through 2035. Tax credit parity has made captured CO2 cheaper for oil fields, yet the region still relies on a few owners of natural CO2 sources and pipelines, so independents gain mainly where new capture plants connect to existing networks. In Canada, steam spending follows in situ output and the steam-oil ratio, which rewards producers that cut steam use per barrel. Mexico is the weak link, since offshore recovery rests on one nitrogen arrangement that runs only through 2027. Buyers that plan new floods should secure CO2 or nitrogen contracts early.
Estimates rest on regulator, company and tax data
The report uses 2025 as the base year and 2026 to 2035 as the forecast period. Market values come from the Credence Research model, and the country, technology, application and reservoir splits are Credence Research estimates informed by public data. Sources include energy regulator and statistics agency data, government releases, company filings and results, tax policy analysis and trade press. The 2025 value was checked against in situ bitumen output, CO2 flood volumes, nitrogen supply and per-barrel cost ranges. No current national series on U.S. or Mexican EOR volumes is published, an evidence gap. No interviews or surveys were used to build these estimates.
Captured CO2 and in situ output carry growth to 2035
Credence Research expects the North America enhanced oil recovery (EOR) market to reach USD 38.54 billion by 2035, as captured CO2 reaches more floods and in situ bitumen output keeps rising. Canada remains the largest country on steam-based recovery, while the United States grows fastest as CO2 from industrial plants reaches Permian and Gulf Coast fields. Shale and tight oil grows at 10.2% a year during 2026–2035 from a small base if pilots turn into field programs. The main risks are a reversal of credit parity, slow capture project startups and a gap in Mexican nitrogen supply after 2027.
CO2 supply and gas costs decide the range of outcomes
The range depends on how fast captured CO2 reaches oil fields under credit parity, whether Alberta in situ growth holds with gas for steam at workable prices, and whether Mexico renews nitrogen supply beyond 2027. Slower capture builds or a rollback of parity would cut new CO2 floods, while shale CO2 programs moving past pilot stage would lift growth above the base case.
| Scenario | CAGR, 2026–2035 | Value, 2035 | What has to hold |
|---|---|---|---|
| Downside | 5.4% | USD 33.17 billion | Credit parity is reversed, capture projects slip and Mexican nitrogen supply lapses after 2027 |
| Base | 7.17% | USD 38.54 billion | Captured CO2 grows steadily and in situ output follows the regulator outlook to 2035 |
| Upside | 8.5% | USD 43.06 billion | Shale CO2 injection scales to multi-well programs and new capture plants sell to floods |
Frequently Asked Questions
How big is the North America enhanced oil recovery (EOR) market?
Which country leads EOR spending in North America?
Which EOR technology grows fastest?
Which enhanced oil recovery companies lead in North America?
Who provides enhanced oil recovery services?
How large is microbial enhanced oil recovery in the region?
Where is chemical enhanced oil recovery used?
Is enhanced oil recovery bad for the environment?
Table of Content
Chapter 1 Market Segmentation
- 1.1 Segmentation Framework
- 1.1.1 Product and Service Classification
- 1.1.2 Application and End-Use Classification
- 1.1.3 Technology and Solution Classification
- 1.1.4 Customer and Distribution Channel Classification
- 1.1.5 Geographic Segmentation
- 1.1.6 Market Segment Definitions and Boundaries
- 1.2 By Technology
- 1.2.1 Thermal
- 1.2.2 Gas Injection
- 1.2.3 Chemical
- 1.2.4 Others
- 1.3 By Application
- 1.3.1 Onshore
- 1.3.2 Offshore
- 1.4 By Reservoir Type
- 1.4.1 Heavy Oil & Oil Sands
- 1.4.2 Conventional Light & Medium Oil
- 1.4.3 Shale & Tight Oil
- 1.5 By Country
- 1.5.1 Canada
- 1.5.2 United States
- 1.5.3 Mexico
Chapter 2 Introduction
- 2.1 Report Objectives and Scope
- 2.2 Product Definition and Industry Terminology
- 2.3 Market Inclusions and Exclusions
- 2.4 Research Process
- 2.4.1 Primary Research and Expert Interviews
- 2.4.2 Secondary Research and Source Review
- 2.4.3 Top-Down and Bottom-Up Estimation
- 2.4.4 Data Triangulation and Verification
- 2.5 Market Size Measurement Basis
- 2.5.1 2025: USD 19.28 billion → 2035: USD 38.54 billion
- 2.6 Historical and Forecast Reference Periods
- 2.6.1 Historical Period: 2018-2025
- 2.6.2 Base Year: 2025
- 2.6.3 Forecast Period: 2025-2035
- 2.7 Research Assumptions and Limitations
Chapter 3 Executive Summary
- 3.1 Market Snapshot and Key Findings
- 3.2 Base-Year Market Size, 2025
- 3.3 Forecast Market Size, 2035
- 3.4 Revenue and Volume Growth Outlook
- 3.5 Key Demand and Supply Indicators
- 3.6 Leading Market Segments
- 3.7 Fastest-Growing Market Opportunities
- 3.8 Regional Performance Highlights
- 3.9 Technology and Industry Transformation
- 3.10 Competitive Landscape Summary
- 3.11 Analyst View and Strategic Implications
Chapter 4 North America Enhanced Oil Recovery (EOR) Market Trends and Developments
- 4.1 Historical Industry Development, 2018-2025
- 4.2 Recent Market Trends and Developments
- 4.3 Demand and Customer Behavior Trends
- 4.4 Technology and Product Innovation
- 4.5 Artificial Intelligence, Automation and Digitalization
- 4.6 Local Manufacturing and Supply Chain Realignment
- 4.7 Industry Partnerships, Mergers and Acquisitions
- 4.8 Sustainability and Circular Economy Developments
- 4.9 Government and Private Sector Investment Trends
- 4.10 Emerging Business Models and Commercialization
- 4.11 Industry Developments and Announcements
Chapter 5 North America Enhanced Oil Recovery (EOR) Market Production, Supply and Demand Analysis
- 5.1 Demand Trend and Consumption Analysis, 2018-2025
- 5.2 Demand Forecast, 2025-2035
- 5.3 Production and Output Trend, 2018-2025
- 5.4 Production and Output Forecast, 2025-2035
- 5.5 Installed Capacity and Capacity Utilization
- 5.6 Company-Wise Production Plants and Statistics
- 5.6.1 Installed Production Capacity
- 5.6.2 Actual Production
- 5.6.3 Planned Capacity and Expansion Targets
- 5.7 Supply Chain Structure and Procurement Trends
- 5.8 Supply-Demand Gap and Bottlenecks
- 5.9 Import Dependence and Sourcing Structure
- 5.10 Contract Manufacturing and Outsourcing
- 5.11 Regional Supply and Demand Concentration
Chapter 6 North America Enhanced Oil Recovery (EOR) Market Pricing Analysis
- 6.1 Pricing Structure and Measurement
- 6.2 Historical Pricing Trends, 2018-2025
- 6.3 Pricing Outlook, 2025-2035
- 6.4 Average Selling Price and Unit Economics
- 6.5 Pricing by Product and Market Segment
- 6.6 Geographic Pricing Differences
- 6.7 Key Input, Energy, Labor and Logistics Costs
- 6.8 Contract Pricing and Purchasing Models
- 6.9 Pricing Sensitivity and Competitive Positioning
- 6.10 Price, Margin and Profitability Implications
Chapter 7 North America Enhanced Oil Recovery (EOR) Market Dynamics
- 7.1 Market Growth Drivers
- 7.1.1 Demand-Side Drivers
- 7.1.2 Technology and Innovation Drivers
- 7.1.3 Infrastructure and Investment Drivers
- 7.1.4 Regulatory and Policy Drivers
- 7.2 Market Restraints
- 7.2.1 Cost and Affordability Constraints
- 7.2.2 Technology and Adoption Barriers
- 7.2.3 Supply Chain and Operational Constraints
- 7.3 Market Challenges
- 7.3.1 Competitive Pressure and Margin Erosion
- 7.3.2 Skills, Infrastructure and Implementation Gaps
- 7.4 Emerging Market Opportunities
- 7.5 Market Dynamics Impact and Time-Horizon Assessment
Chapter 8 North America Enhanced Oil Recovery (EOR) Value Chain Analysis
- 8.1 Industry Value Chain Overview
- 8.2 Upstream Suppliers and Critical Inputs
- 8.3 Technology and Component Providers
- 8.4 Manufacturing or Service Delivery
- 8.5 Distribution, Channel Partners and Integrators
- 8.6 Downstream Applications and End Users
- 8.7 Value Addition and Profit Pools
- 8.8 Vertical Integration and Outsourcing
- 8.9 Supplier Concentration and Risk
- 8.10 Supply Chain Localization and Resilience
Chapter 9 North America Enhanced Oil Recovery (EOR) Market Regulations and Policies
- 9.1 Relevant Laws, Standards and Compliance Frameworks
- 9.2 Product, Service, Safety and Quality Requirements
- 9.3 Government Policies, Incentives and Subsidies
- 9.4 Imports, Exports and Trade Barriers
- 9.5 Public Procurement and Local Content Requirements
- 9.6 Environmental and Sustainability Compliance
- 9.7 Upcoming Policy Changes and Market Implications
Chapter 10 North America Enhanced Oil Recovery (EOR) Market Hotspots and Opportunities
- 10.1 Market Opportunity Mapping and Growth Hotspots
- 10.2 High-Growth Applications and Customer Groups
- 10.3 Underserved Markets and White-Space Opportunities
- 10.4 Emerging Technology and Product Opportunities
- 10.5 New Capacity and Investment Hotspots
- 10.6 Market Entry and Expansion Opportunities
- 10.7 Distribution and Partnership Opportunities
- 10.8 Near-Term and Long-Term Commercial Potential
- 10.9 Opportunity Attractiveness and Execution Risks
Chapter 11 North America Enhanced Oil Recovery (EOR) Market Outlook, 2025-2035
- 11.1 Market Size and Analysis
- 11.1.1 Revenue (Market Measurement: 2025: USD 19.28 billion → 2035: USD 38.54 billion)
- 11.1.2 Market Volume and Quantity Sold
- 11.1.3 Historical Market Size, 2018-2025
- 11.1.4 Base-Year Market Size, 2025
- 11.2 Market Forecast, 2025-2035
- 11.2.1 Revenue Forecast to 2035
- 11.2.2 Volume Forecast to 2035
- 11.2.3 CAGR and Year-on-Year Growth
- 11.2.4 Incremental Revenue Opportunity
- 11.3 Forecast Assumptions and Scenario Analysis
- 11.3.1 Base-Case Forecast
- 11.3.2 Optimistic and Conservative Scenarios
- 11.3.3 Technology, Pricing and Policy Sensitivities
- 11.4 Market Attractiveness and Growth Outlook
Chapter 12 North America Enhanced Oil Recovery (EOR) Market Segmentation and Outlook
- 12.1 Segmentation Summary and Market Shares, 2025
- 12.2 Largest and Fastest-Growing Segments
- 12.3 By Technology - Market Size and Forecast, 2025-2035
- 12.3.1 Segment Definition and Scope
- 12.3.2 Historical Market Size, 2018-2025
- 12.3.3 Revenue Forecast, 2025-2035
- 12.3.4 Volume Forecast, 2025-2035
- 12.3.5 Base-Year Market Share, 2025
- 12.3.6 Segment CAGR and Growth Drivers
- 12.3.7 Subsegment Market Size and Forecast
- 12.3.7.1 Thermal
- 12.3.7.2 Gas Injection
- 12.3.7.3 Chemical
- 12.3.7.4 Others
- 12.3.8 Subsegment Pricing and Adoption Trends
- 12.3.9 Leading Suppliers and Competition
- 12.3.10 Regional Demand and Opportunities
- 12.4 By Application - Market Size and Forecast, 2025-2035
- 12.4.1 Segment Definition and Scope
- 12.4.2 Historical Market Size, 2018-2025
- 12.4.3 Revenue Forecast, 2025-2035
- 12.4.4 Volume Forecast, 2025-2035
- 12.4.5 Base-Year Market Share, 2025
- 12.4.6 Segment CAGR and Growth Drivers
- 12.4.7 Subsegment Market Size and Forecast
- 12.4.7.1 Onshore
- 12.4.7.2 Offshore
- 12.4.8 Subsegment Pricing and Adoption Trends
- 12.4.9 Leading Suppliers and Competition
- 12.4.10 Regional Demand and Opportunities
- 12.5 By Reservoir Type - Market Size and Forecast, 2025-2035
- 12.5.1 Segment Definition and Scope
- 12.5.2 Historical Market Size, 2018-2025
- 12.5.3 Revenue Forecast, 2025-2035
- 12.5.4 Volume Forecast, 2025-2035
- 12.5.5 Base-Year Market Share, 2025
- 12.5.6 Segment CAGR and Growth Drivers
- 12.5.7 Subsegment Market Size and Forecast
- 12.5.7.1 Heavy Oil & Oil Sands
- 12.5.7.2 Conventional Light & Medium Oil
- 12.5.7.3 Shale & Tight Oil
- 12.5.8 Subsegment Pricing and Adoption Trends
- 12.5.9 Leading Suppliers and Competition
- 12.5.10 Regional Demand and Opportunities
- 12.6 By Country - Market Size and Forecast, 2025-2035
- 12.6.1 Segment Definition and Scope
- 12.6.2 Historical Market Size, 2018-2025
- 12.6.3 Revenue Forecast, 2025-2035
- 12.6.4 Volume Forecast, 2025-2035
- 12.6.5 Base-Year Market Share, 2025
- 12.6.6 Segment CAGR and Growth Drivers
- 12.6.7 Subsegment Market Size and Forecast
- 12.6.7.1 Canada
- 12.6.7.2 United States
- 12.6.7.3 Mexico
- 12.6.8 Subsegment Pricing and Adoption Trends
- 12.6.9 Leading Suppliers and Competition
- 12.6.10 Regional Demand and Opportunities
- 12.7 Segment Growth Comparison
- 12.8 Segment Attractiveness and Priority Matrix
Chapter 13 North America Enhanced Oil Recovery (EOR) End-Use and Application Market Outlook
- 13.1 End-Use Industry and Customer Demand Structure
- 13.2 Leading Applications and Customer Groups
- 13.3 End-Use Market Size, Share and Forecast
- 13.4 Major End-Use Industry Deep Dives
- 13.4.1 Customer Requirements and Use Cases
- 13.4.2 Demand and Replacement Cycles
- 13.4.3 Technical and Regulatory Considerations
- 13.4.4 Purchasing and Procurement Models
- 13.4.5 Leading Vendors and Distribution Channels
- 13.4.6 Forecast and Commercial Opportunities
- 13.5 Emerging Applications and Cross-Segment Demand
- 13.6 End-Use Industry Investment Priorities
Chapter 14 North America Enhanced Oil Recovery (EOR) Geographic Market Outlook, 2025-2035
- 14.1 Regional Market Size and Country-Level Shares, 2025
- 14.2 Country Market Size Comparison, 2025
- 14.3 Country Market Forecasts, 2025-2035
- 14.4 Subregional Industrial and Demand Clusters
- 14.5 Intra-Regional Pricing and Cost Differences
- 14.6 Cross-Border Trade and Supply Networks
- 14.7 Regional Supply and Demand Balances
- 14.8 Country Opportunity Comparison and Prioritization
Note: Every listed country is covered on the structure shown under the first country.
Chapter 15 North America Enhanced Oil Recovery (EOR) Technology, Innovation and Sustainability Outlook
- 15.1 Technology Landscape and Maturity
- 15.2 Product, Process and Service Innovation
- 15.3 AI, Automation and Digital Tools in the Industry
- 15.4 Technology Adoption and Performance Benchmarking
- 15.5 Innovation Pipeline and R&D Investment
- 15.6 Patent and Intellectual Property Trends
- 15.7 Energy Efficiency and Resource Management
- 15.8 Sustainability, Recycling and Circularity
- 15.9 Technology Roadmap, 2025-2035
- 15.10 Risks of Obsolescence and Technology Substitution
Chapter 16 North America Enhanced Oil Recovery (EOR) Market Key Strategic Imperatives
- 16.1 Growth and Market Entry Priorities
- 16.2 High-Return Products and Segments
- 16.3 Pricing, Profitability and Cost Optimization
- 16.4 Technology Investment and Product Differentiation
- 16.5 Supply Chain Localization and Resilience
- 16.6 Distribution and Customer Acquisition
- 16.7 Partnership, Acquisition and Capacity Strategy
- 16.8 Regional Expansion Priorities
- 16.9 Short-, Medium- and Long-Term Actions
Chapter 17 Competition Outlook
- 17.1 Industry Competition Characteristics
- 17.2 Market Structure and Concentration
- 17.3 Market Share and Competitive Positioning, 2025
- 17.4 Company-Wise Revenue and Product Benchmarking
- 17.5 Production and Service Capacity Benchmarking
- 17.6 Technology, Pricing and Differentiation
- 17.7 Regional Footprint and Distribution Strength
- 17.8 Mergers, Acquisitions and Strategic Alliances
- 17.9 New Entrants and Competitive Threats
- 17.10 Porter's Five Forces and Industry Attractiveness
- 17.11 Competitive Outlook, 2025-2035
Chapter 18 Company Profiles
- 18.1 Company Coverage and Selection Criteria
- 18.2 Occidental Petroleum Corporation
- 18.2.1 Business Description
- 18.2.2 Company Ownership and Geographic Presence
- 18.2.3 Product and Service Portfolio
- 18.2.4 Manufacturing and Operating Footprint
- 18.2.5 Production Capacity and Expansion Plans
- 18.2.6 Financial Performance and Investment
- 18.2.7 Market Share and Competitive Position
- 18.2.8 Technology and Innovation Capabilities
- 18.2.9 Strategic Alliances or Partnerships
- 18.2.10 Recent Developments
- 18.2.11 Growth Strategy and Outlook
- 18.3 Exxon Mobil Corporation (Denbury, Imperial Oil)
- 18.4 Kinder Morgan, Inc.
- 18.5 Chevron Corporation
- 18.6 ConocoPhillips
- 18.7 Cenovus Energy Inc.
- 18.8 Canadian Natural Resources Limited
- 18.9 Suncor Energy Inc.
- 18.10 Whitecap Resources Inc.
- 18.11 California Resources Corporation
- 18.12 Linde plc
- 18.13 SLB (incl. ChampionX)
- 18.14 Other Relevant Market Participants
Note: Every listed company is profiled on the structure shown under the first company. The company list is preliminary and may change based on research findings, market developments, data availability and client requirements.
Chapter 19 Disclaimer
- 19.1 Research and Forecast Disclaimer
- 19.2 Data Source and Estimation Limitations
Note: The depth of individual sections depends on data availability for this market. Volume, capacity, trade and other unit-based metrics are included where applicable.