Fewer rigs, longer wells and automation lift field software
The U.S. digital oilfield solutions market was valued at USD 8.45 billion in 2025 and is projected to increase from USD 8.97 billion in 2026 to USD 15.28 billion by 2035, registering a CAGR of 6.10% during 2026–2035. Demand comes from shale operators that drill fewer but much longer wells, deepwater producers that run subsea fields from shore, and gas producers that supply a growing LNG export trade. The Permian Basin held the largest regional share, 40.0% in 2025, because it produces close to half of the country’s crude oil, while the Gulf of America Offshore is the fastest-growing region at 6.9% a year as new floating production units come online. Supplier structure is also changing, because SLB completed its purchase of ChampionX in July 2025, joining its software with a large North American artificial lift and chemicals base. Buyers now weigh integrated service contracts against open platforms that work with several vendors.
Sensors, software and services that run wells remotely
The estimate covers field hardware such as wellhead sensors, flow meters, edge controllers and rig automation systems, software for drilling, production, reservoir and data management, and the integration, monitoring and managed services that connect them. It counts spending by exploration and production companies, drilling contractors and completion crews working onshore and in federal and state offshore waters.
The estimate excludes physical well equipment such as pumps, tubulars and chemicals, refinery and pipeline automation, and general corporate IT. Most spending moves through service companies that bundle software with drilling, completion or lift contracts, while large producers also buy platforms and cloud capacity directly.
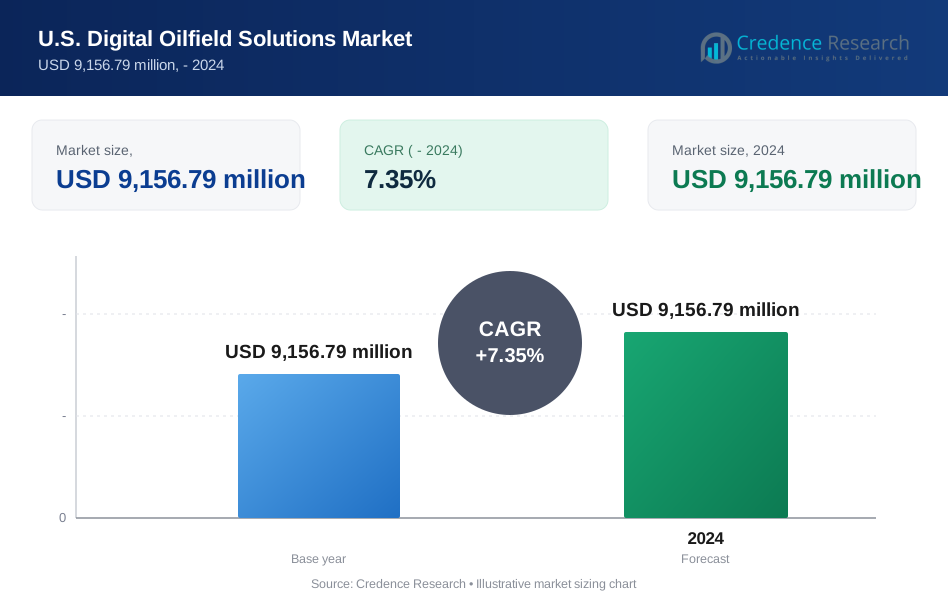
U.S. Digital Oilfield Solutions Market Insights
- The U.S. digital oilfield solutions market was valued at USD 8.45 billion in 2025 and is projected to reach USD 15.28 billion by 2035, registering a CAGR of 6.10% during 2026–2035.
- The Permian Basin held a 40.0% share of 2025 value, because 275 of the 601 U.S. rigs active on Nov. 13, 2026, worked in the basin.
- Services led with a 39.0% share of 2025 value, because most operators buy monitoring, integration and automation as part of drilling, completion and lift contracts.
- SLB completed its acquisition of ChampionX on July 16, 2025, adding production chemicals, artificial lift, digital and emissions technologies.
- Drilling optimization grows fastest among processes at 6.8% a year, as ExxonMobil plans to automate half of its Permian rig fleet by 2028.
Services lead while cloud software and drilling grow fastest
Services lead while software grows fastest
Based on solution, the market is categorized into hardware, software and services. Services led with a 39.0% share of 2025 value, because operators buy monitoring, integration and automation inside drilling, completion and lift contracts, and Weatherford describes a Permian ForeSite rollout that grew from an 80-well pilot to nearly 1,000 wells, with more than 4,000 planned. Software grows fastest at 7.1% a year, as SLB’s Lumi data and AI platform, launched Sept. 17, 2024, runs on all major clouds and on-premises. Hardware grows slowest, because sensors are replaced on long cycles.
Onshore shale leads while offshore grows faster
Based on application, the market is categorized into onshore and offshore fields. Onshore fields led with a 78.0% share of 2025 value, because the Lower 48 shale basins host most active rigs and about 6,000 new Permian horizontal completions a year, according to EIA, each needing geosteering, frac monitoring and lift control. Offshore fields grow fastest at 6.7% a year, as federal Gulf output reached 1,942 thousand barrels a day in 2025 and new floating units keep adding subsea wells that operators monitor from shore around the clock.
Production optimization leads while drilling grows fastest
Based on process, the market is categorized into reservoir optimization, production optimization and drilling optimization. Production Optimization led with a 44.0% share of 2025 value, because every producing well needs artificial lift control, allocation and surveillance, and Lower 48 gas output reached a record 117.2 Bcf a day in August 2025, according to EIA. Drilling Optimization grows fastest at 6.8% a year, as Patterson-UTI said nearly all of its rigs now carry Cortex automation applications. Reservoir optimization trails, because subsurface studies are bought per project.
On-premises leads while cloud deployment grows faster
Based on deployment, the market is categorized into on-premises and cloud-based systems. On-Premises systems led with a 57.0% share of 2025 value, because SCADA systems and wellsite control must keep working when links fail, and Honeywell presented Cognition Edge in June 2026 as a pad controller that runs optimization locally and resyncs later. Cloud-Based systems grow fastest at 7.0% a year, as AI workflows such as the Lucy production assistant that Expand Energy plans to pilot need pooled data from thousands of wells. Most new installations are hybrid designs that keep control local and analytics in the cloud.
| Segment Group | Leading Sub-segment | Share, 2025 | Fastest-growing Sub-segment | CAGR, 2026–2035 |
|---|---|---|---|---|
| By Solution | Services | 39.0% | Software | 7.1% |
| By Application | Onshore | 78.0% | Offshore | 6.7% |
| By Process | Production Optimization | 44.0% | Drilling Optimization | 6.8% |
| By Deployment | On-Premises | 57.0% | Cloud-Based | 7.0% |
Per-well subscriptions and bundled contracts set prices
Pricing follows the unit that creates value, which is usually the well, the rig day or the connected site. Production software is sold as a subscription per well or per asset, drilling automation as a day-rate adder or a performance bonus, and connectivity as a monthly plan. Vendors rarely publish list prices, so the ranges in the table are Credence Research estimates from contract structures rather than quoted prices. Patterson-UTI said performance-based agreements are working well as customers seek contractors that improve efficiency. Bundling lets service companies price software below stand-alone vendors, which favors integrated suppliers, while open platforms compete on lower switching costs. Field hardware prices move with steel, electronics and tariff costs.
| Offer | Typical price or fee | Basis |
|---|---|---|
| Production surveillance and lift optimization software | USD 20 to 120 per well per month | Credence Research estimate, indicative range |
| Rig automation and remote drilling applications | USD 1,000 to 3,500 per rig day | Credence Research estimate, indicative range |
| Wireless wellhead pressure or flow instrument | USD 1,500 to 4,000 per point installed | Credence Research estimate, indicative range |
Request a Free Sample
Fill in your details and we'll send you a free sample report.
- Sample data tables & charts
- Research methodology
Higher crude prices and leaner crews push automation
How do higher 2026 crude prices restart field activity?
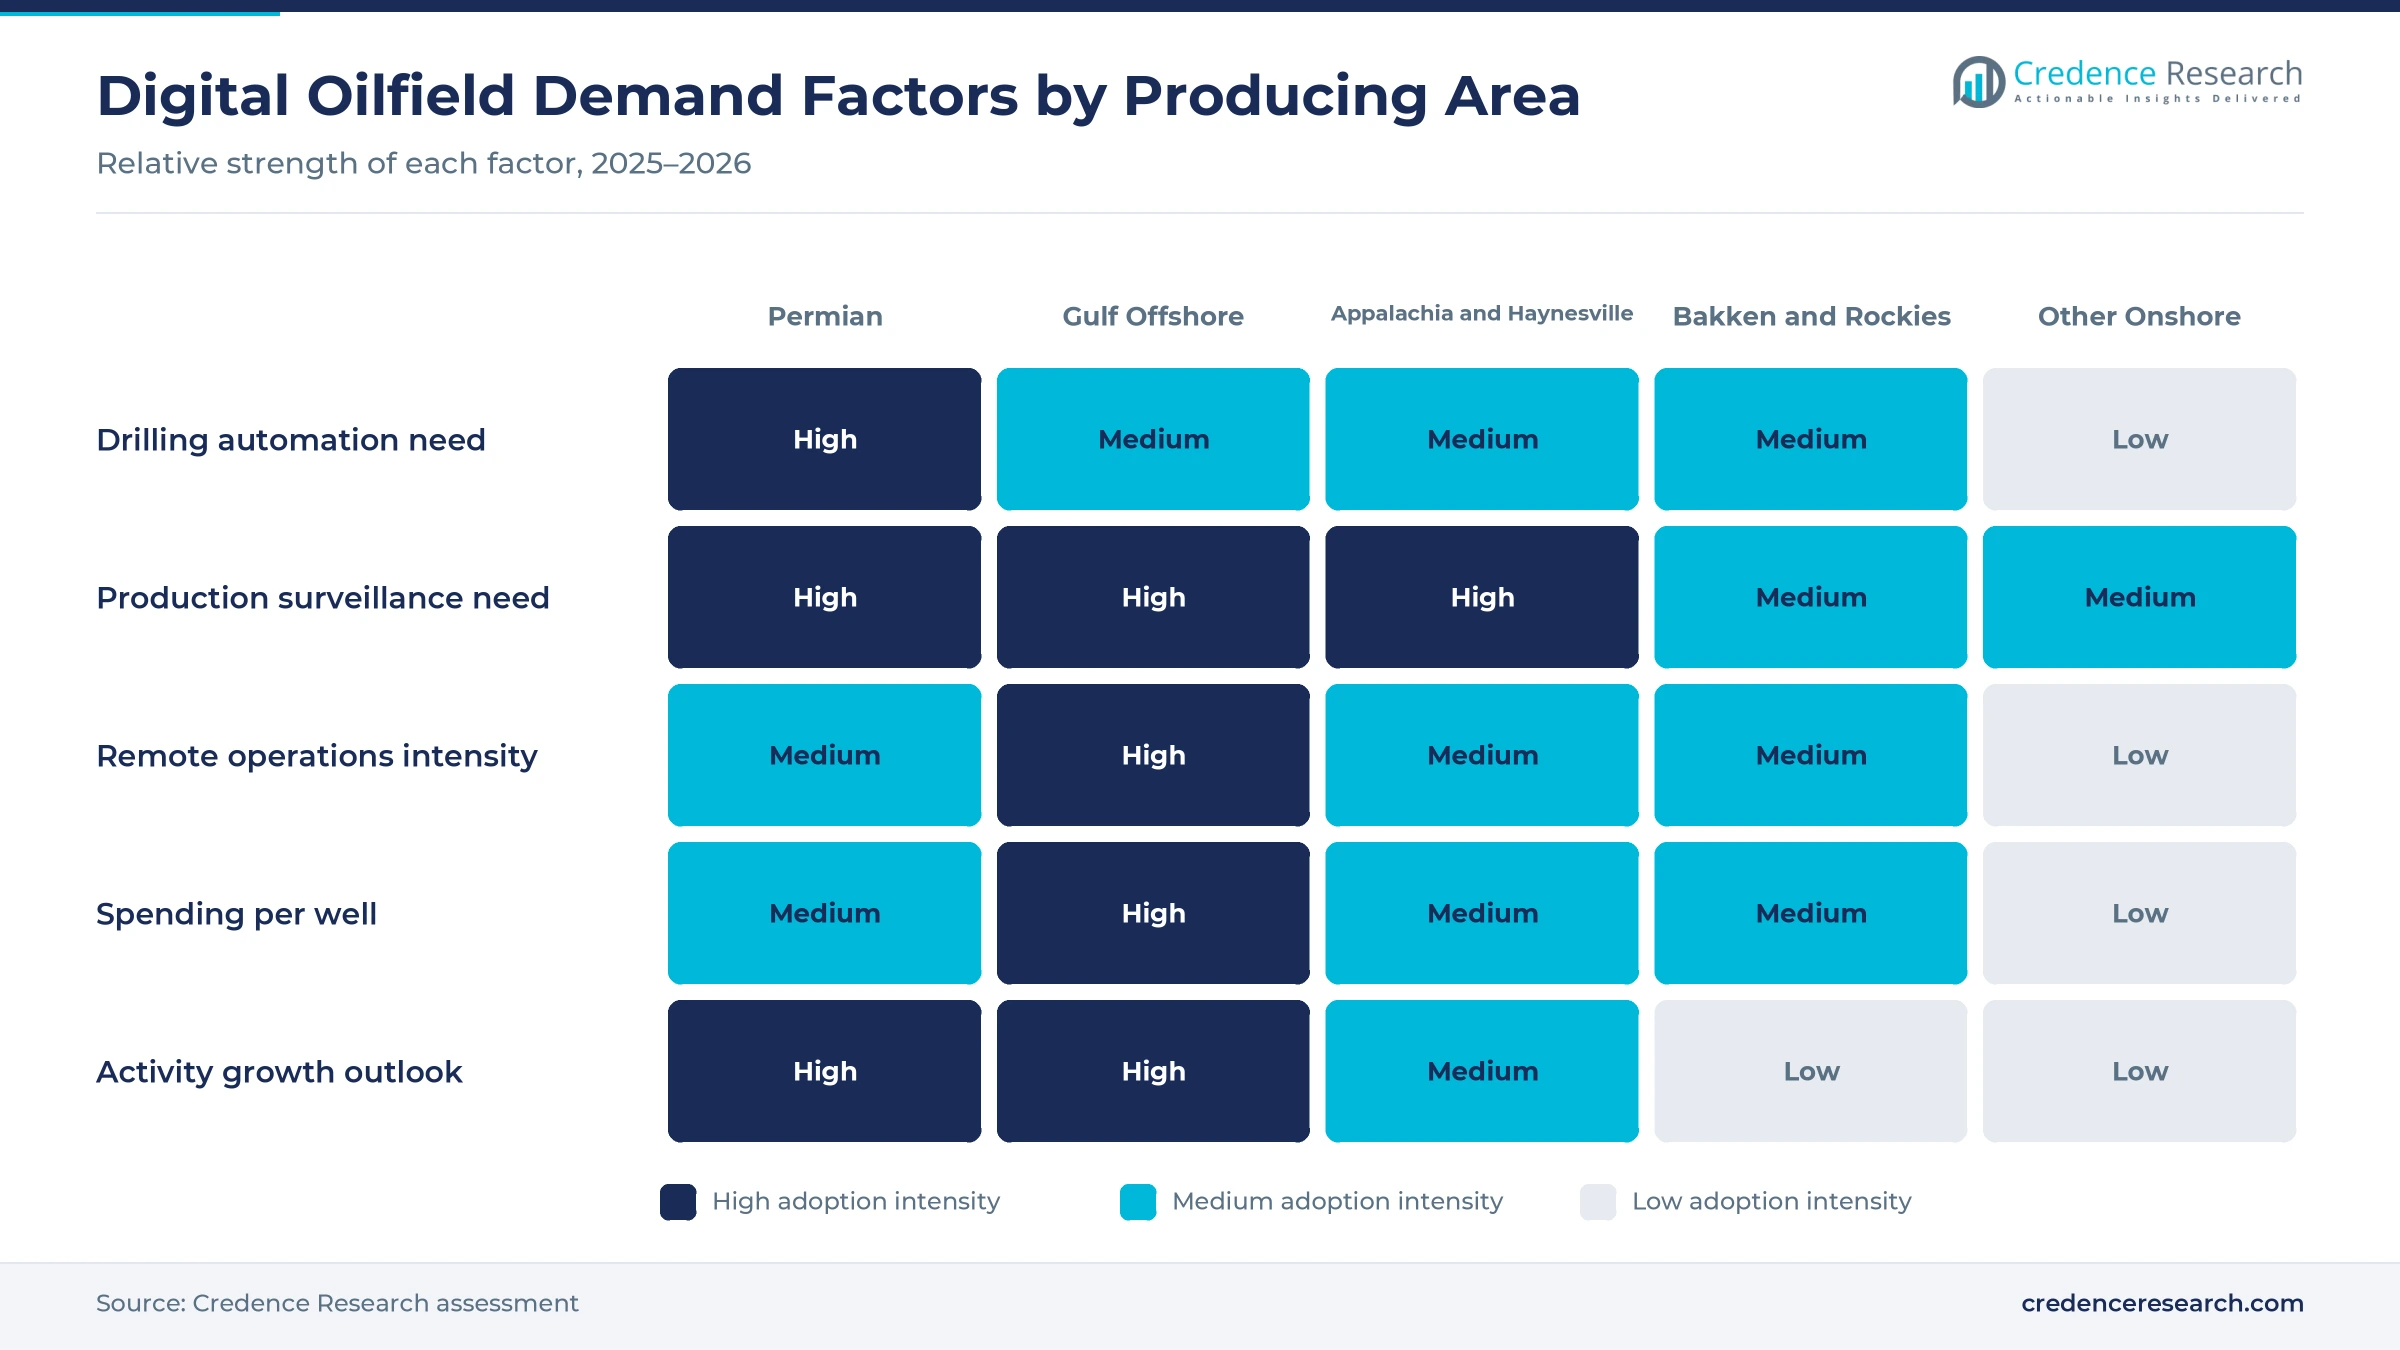
Higher prices give operators cash to drill and to upgrade the systems that run new wells. Brent is expected to stay close to $100 a barrel for the rest of 2026, as Middle East shut-ins and tanker attacks constrain supply, according to EIA’s November 2026 Short-Term Energy Outlook. U.S. rigs reached 601 on Nov. 13, 2026, 52 more than a year earlier, with 275 in the Permian, according to Baker Hughes counts. EIA expects crude output to set new annual records in both 2026 and 2027. Each added rig brings drilling automation, geosteering and real-time data contracts, so this demand gives drilling optimization the fastest growth among processes.
Why do longer laterals raise the value of drilling data?
Longer wells concentrate more capital in each borehole, so every steering error now costs more and drives adoption of real-time drilling data. The average lateral of new Permian horizontal wells reached 10,867 feet in 2025, and wells longer than 15,000 feet made up 15% of completions, according to an EIA analysis of August 2026. Lower 48 active rigs fell by about a third between December 2022 and October 2025, yet oil output set a monthly record in July 2025, according to EIA. Fewer rigs producing more oil means each rig must drill faster, which favors closed-loop drilling software, downhole sensors and remote steering centers.
How does producer consolidation create enterprise buyers?
Mergers turn many small field systems into a few enterprise programs, because acquirers want one data model across every basin they own. Chevron completed its purchase of Hess on July 18, 2025, adding about 463,000 net acres in the Bakken, according to its filing. ExxonMobil runs more than 30 Permian rigs and plans to automate a quarter of them in 2027 and half by 2028, Reuters reported in August 2026. Weatherford describes a West Texas operator scaling ForeSite to more than 4,000 wells over about two years. Large buyers sign multi-year platform contracts, which favors suppliers that can integrate drilling, production and lift data at scale.
Why does a shrinking field workforce favor remote operations?
Operators automate because they are producing record volumes with fewer people in the field. Oil and gas extraction employed 114,600 people in July 2026, the lowest level since 2022, according to a Rigzone analysis of BLS data. Upstream direct jobs fell by 9,218 to 373,478 in 2025, according to the Texas Independent Producers and Royalty Owners Association. About a third of significant rig injuries occur on the rig floor, ExxonMobil told Reuters, which makes robotic pipe handling a safety case as well as a cost case. Remote operations centers let one engineer supervise many pads, and this demand for remote supervision keeps services the largest solution group.
AI production tools and closed-loop fracturing spread
How is AI moving into daily production work?
Large producers are shifting from dashboards toward AI assistants that recommend actions, creating openings for data platforms across gas and oil fields. Baker Hughes won a multi-year award on Jan. 29, 2026, to deploy Leucipa production workflows across thousands of Expand Energy wells in the Marcellus, Utica and Haynesville, with a pilot of the Lucy AI assistant planned. SLB embedded large language models into its Lumi platform and links production data through Cognite Data Fusion. Adoption is uneven, because 62% of 45 producers in the December 2025 Dallas Fed Energy Survey expected AI to cut no cost from their breakeven prices within five years.
Why is closed-loop fracturing spreading across shale fields?
Completion crews are shifting from manual pump control toward automated, feedback-driven fracturing to cut variability between stages, creating openings for frac control software across shale basins. Chevron and Halliburton said in June 2025 that they had enabled intelligent fracturing in Colorado, combining OCTIV auto frac and Sensori monitoring in the ZEUS IQ platform with Chevron’s own subsurface algorithm. Patterson-UTI launched its eos completions digital platform in the fourth quarter of 2025 and holds revenue-generating agreements for its Vertex frac automation. Frac spreads numbered 195 in mid-November 2026, 22 more than a year earlier, according to OilPrice.com, and each automated fleet carries its software across many pads in a Permian Basin that completes about 6,000 horizontal wells a year.
Deepwater Gulf projects open demand for remote monitoring
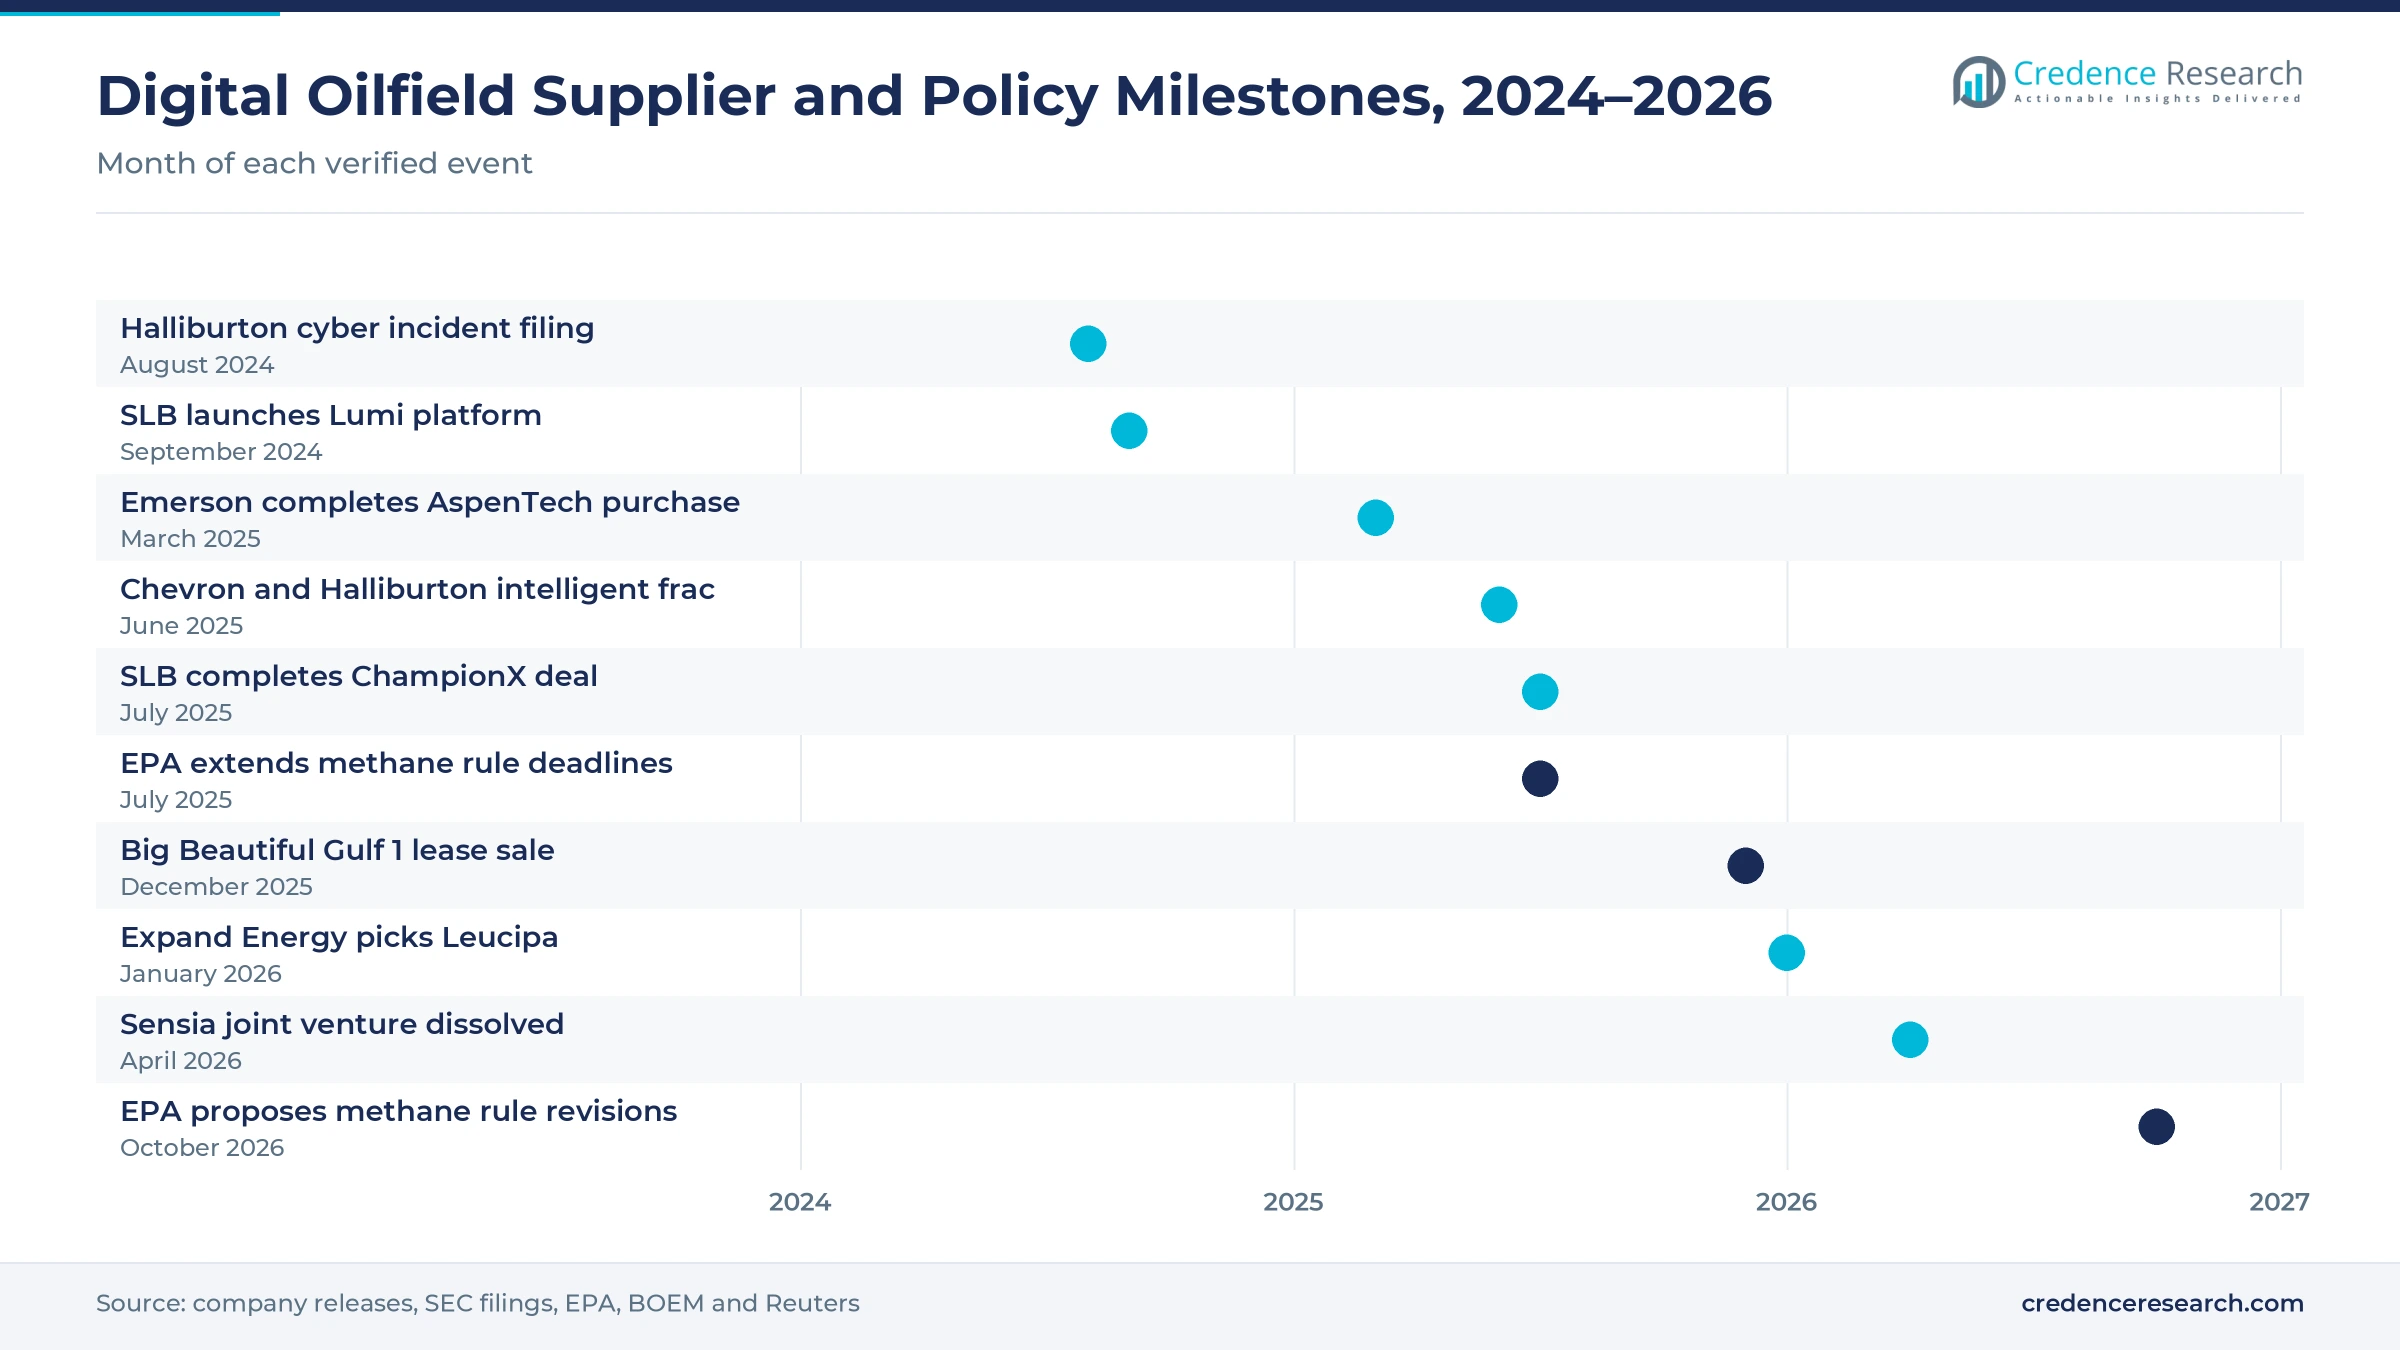
New deepwater projects give suppliers an opening in subsea monitoring, digital twins and onshore control rooms, because each floating unit runs for decades with small crews. The Shenandoah unit has produced about 70,000 barrels a day since July 2025, Ballymore 58,000 since April 2025 and Whale 38,000 since January 2025, according to EIA data reported by World Oil. The first Big Beautiful Gulf 1 lease sale on Dec. 10, 2025, drew $300.4 million in high bids from 30 companies on 181 blocks. Fresh leases imply future tiebacks, which supports faster offshore growth through the next decade.
LNG feedgas growth opens gas-field optimization work
Rising LNG exports offer gas producers a reason to forecast and schedule output more precisely, opening work for nominations and field forecasting software. U.S. LNG exports averaged 15.1 Bcf a day in 2025, up 26% from 2024, according to EIA. Appalachia gas output rose 10%, or 3.3 Bcf a day, between December 2022 and late 2025 while its rig count fell 29%, according to EIA analysis of Baker Hughes data. The Expand Energy award noted above includes co-developed gas nomination and forecasting workflows. Gas producers that supply export terminals under contract gain the most from tools that cut forecast error, and their demand anchors growth in the Appalachia and Haynesville zone.
Cyber risk, rule changes and small-operator doubts
How does cyber risk slow connected field systems?
Every remote connection to a wellsite adds a path for attackers, which slows approvals for cloud links and vendor access. Halliburton disclosed in an Aug. 22, 2024, filing that an unauthorized third party had gained access to certain of its systems, and it took some systems offline to protect them. Service companies that hold remote access to many operators are most exposed, while producers respond with stricter network segmentation that lengthens deployment projects.
Rule changes leave methane monitoring orders on hold
Monitoring vendors depend on federal methane rules, and those rules keep moving. EPA extended several compliance deadlines of its 2024 oil and gas methane standards in an interim final rule on July 31, 2025, according to Holland & Knight. On Oct. 29, 2026, EPA proposed further revisions that would rescind the Super Emitter Program, with comments due Dec. 16, 2026. Sellers of continuous emissions sensors and leak analytics face slower orders until the rule is final, while operators delay purchases tied only to compliance.
Why do small producers doubt the payback of AI tools?
Smaller operators run fewer wells, so a platform license weighs more on each barrel. In the December 2025 Dallas Fed Energy Survey, 70% of 37 small producers expected AI to cut nothing from their breakeven price within five years, against 25% of eight large producers. EIA also expects Brent to fall to $77 by the fourth quarter of 2027, which would tighten budgets again. Vendors that sell subscriptions to small private operators are most exposed, while bundled service contracts face less resistance.
How do supplier breakups disrupt installed systems?
Changes in supplier ownership force operators to remap support contracts for systems already in the field. SLB and Rockwell Automation completed the dissolution of their Sensia joint venture on April 1, 2026, with SLB taking lift control, measurement and digital solutions and Rockwell taking process automation and vMonitor products. Producers that run mixed Sensia installations now deal with two suppliers for one site. Integration projects slow while roadmaps and licensing terms are confirmed.
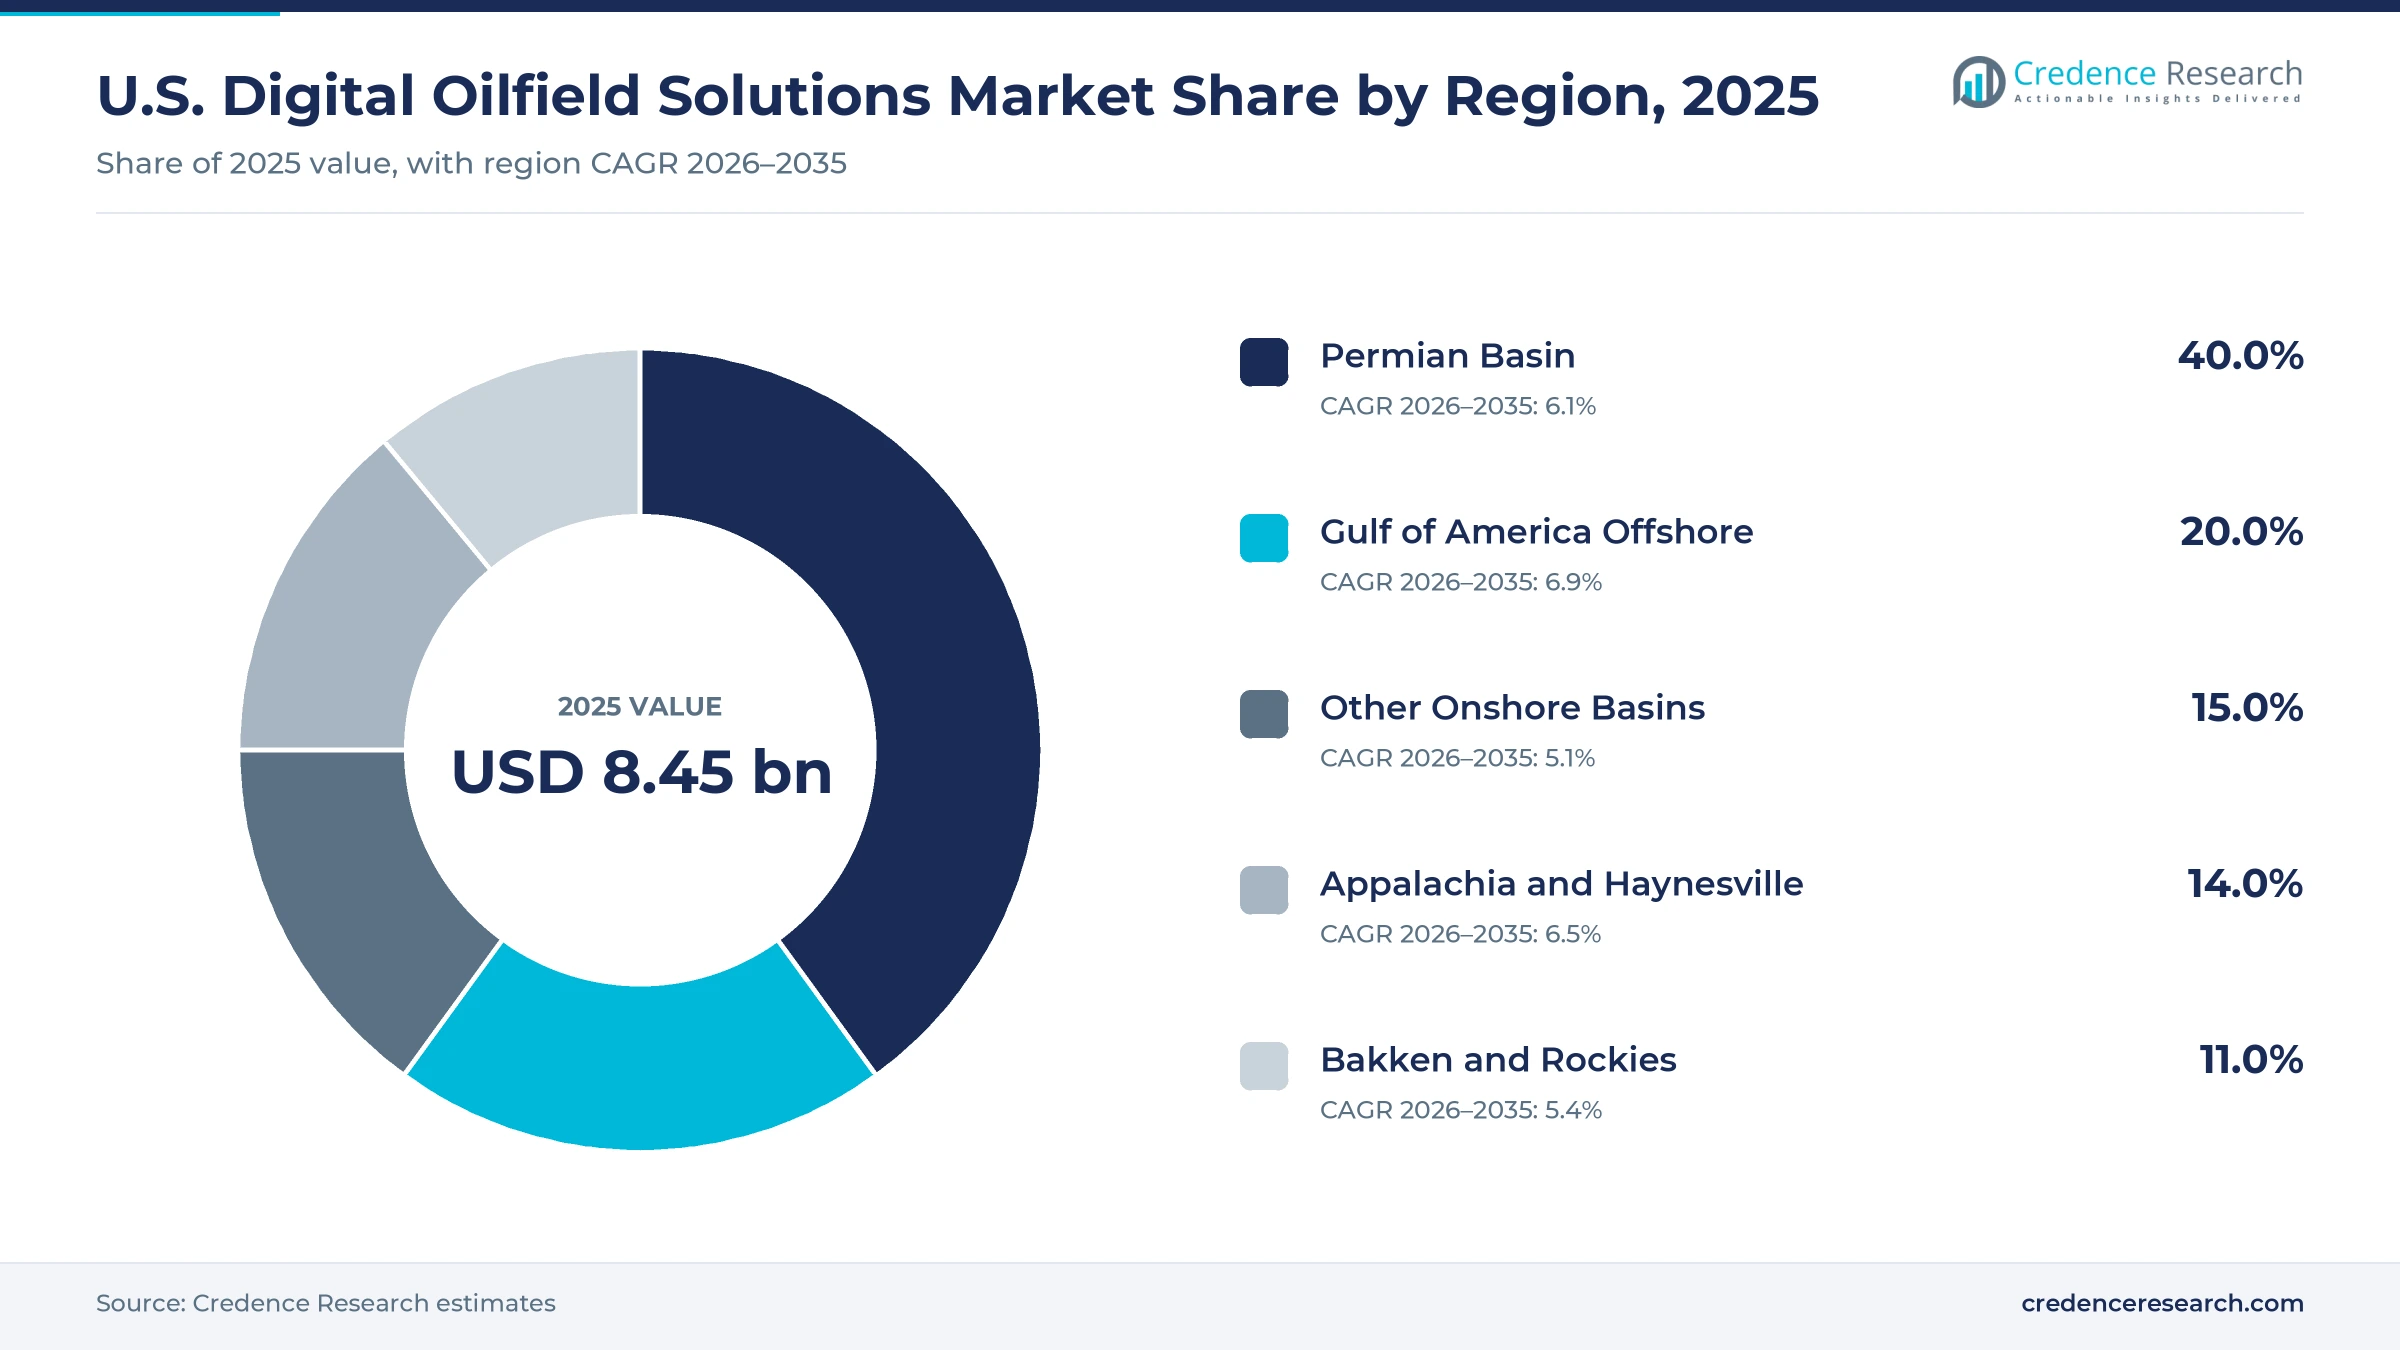
The Permian leads while the deepwater Gulf grows fastest
The U.S. digital oilfield solutions market is split into five producing areas, from the Permian Basin to the Gulf of America Offshore, where demand for subsea monitoring rises with each new floating unit. Zone shares and growth rates are Credence Research estimates based on EIA crude output by state and offshore area, rig counts and gas production.
| Region | Value, 2025 (USD billion) | Share, 2025 | CAGR, 2026–2035 |
|---|---|---|---|
| Permian Basin | 3.38 | 40.0% | 6.1% |
| Gulf of America Offshore | 1.69 | 20.0% | 6.9% |
| Other Onshore Basins | 1.27 | 15.0% | 5.1% |
| Appalachia and Haynesville | 1.18 | 14.0% | 6.5% |
| Bakken and Rockies | 0.93 | 11.0% | 5.4% |
Why does the Permian Basin lead?
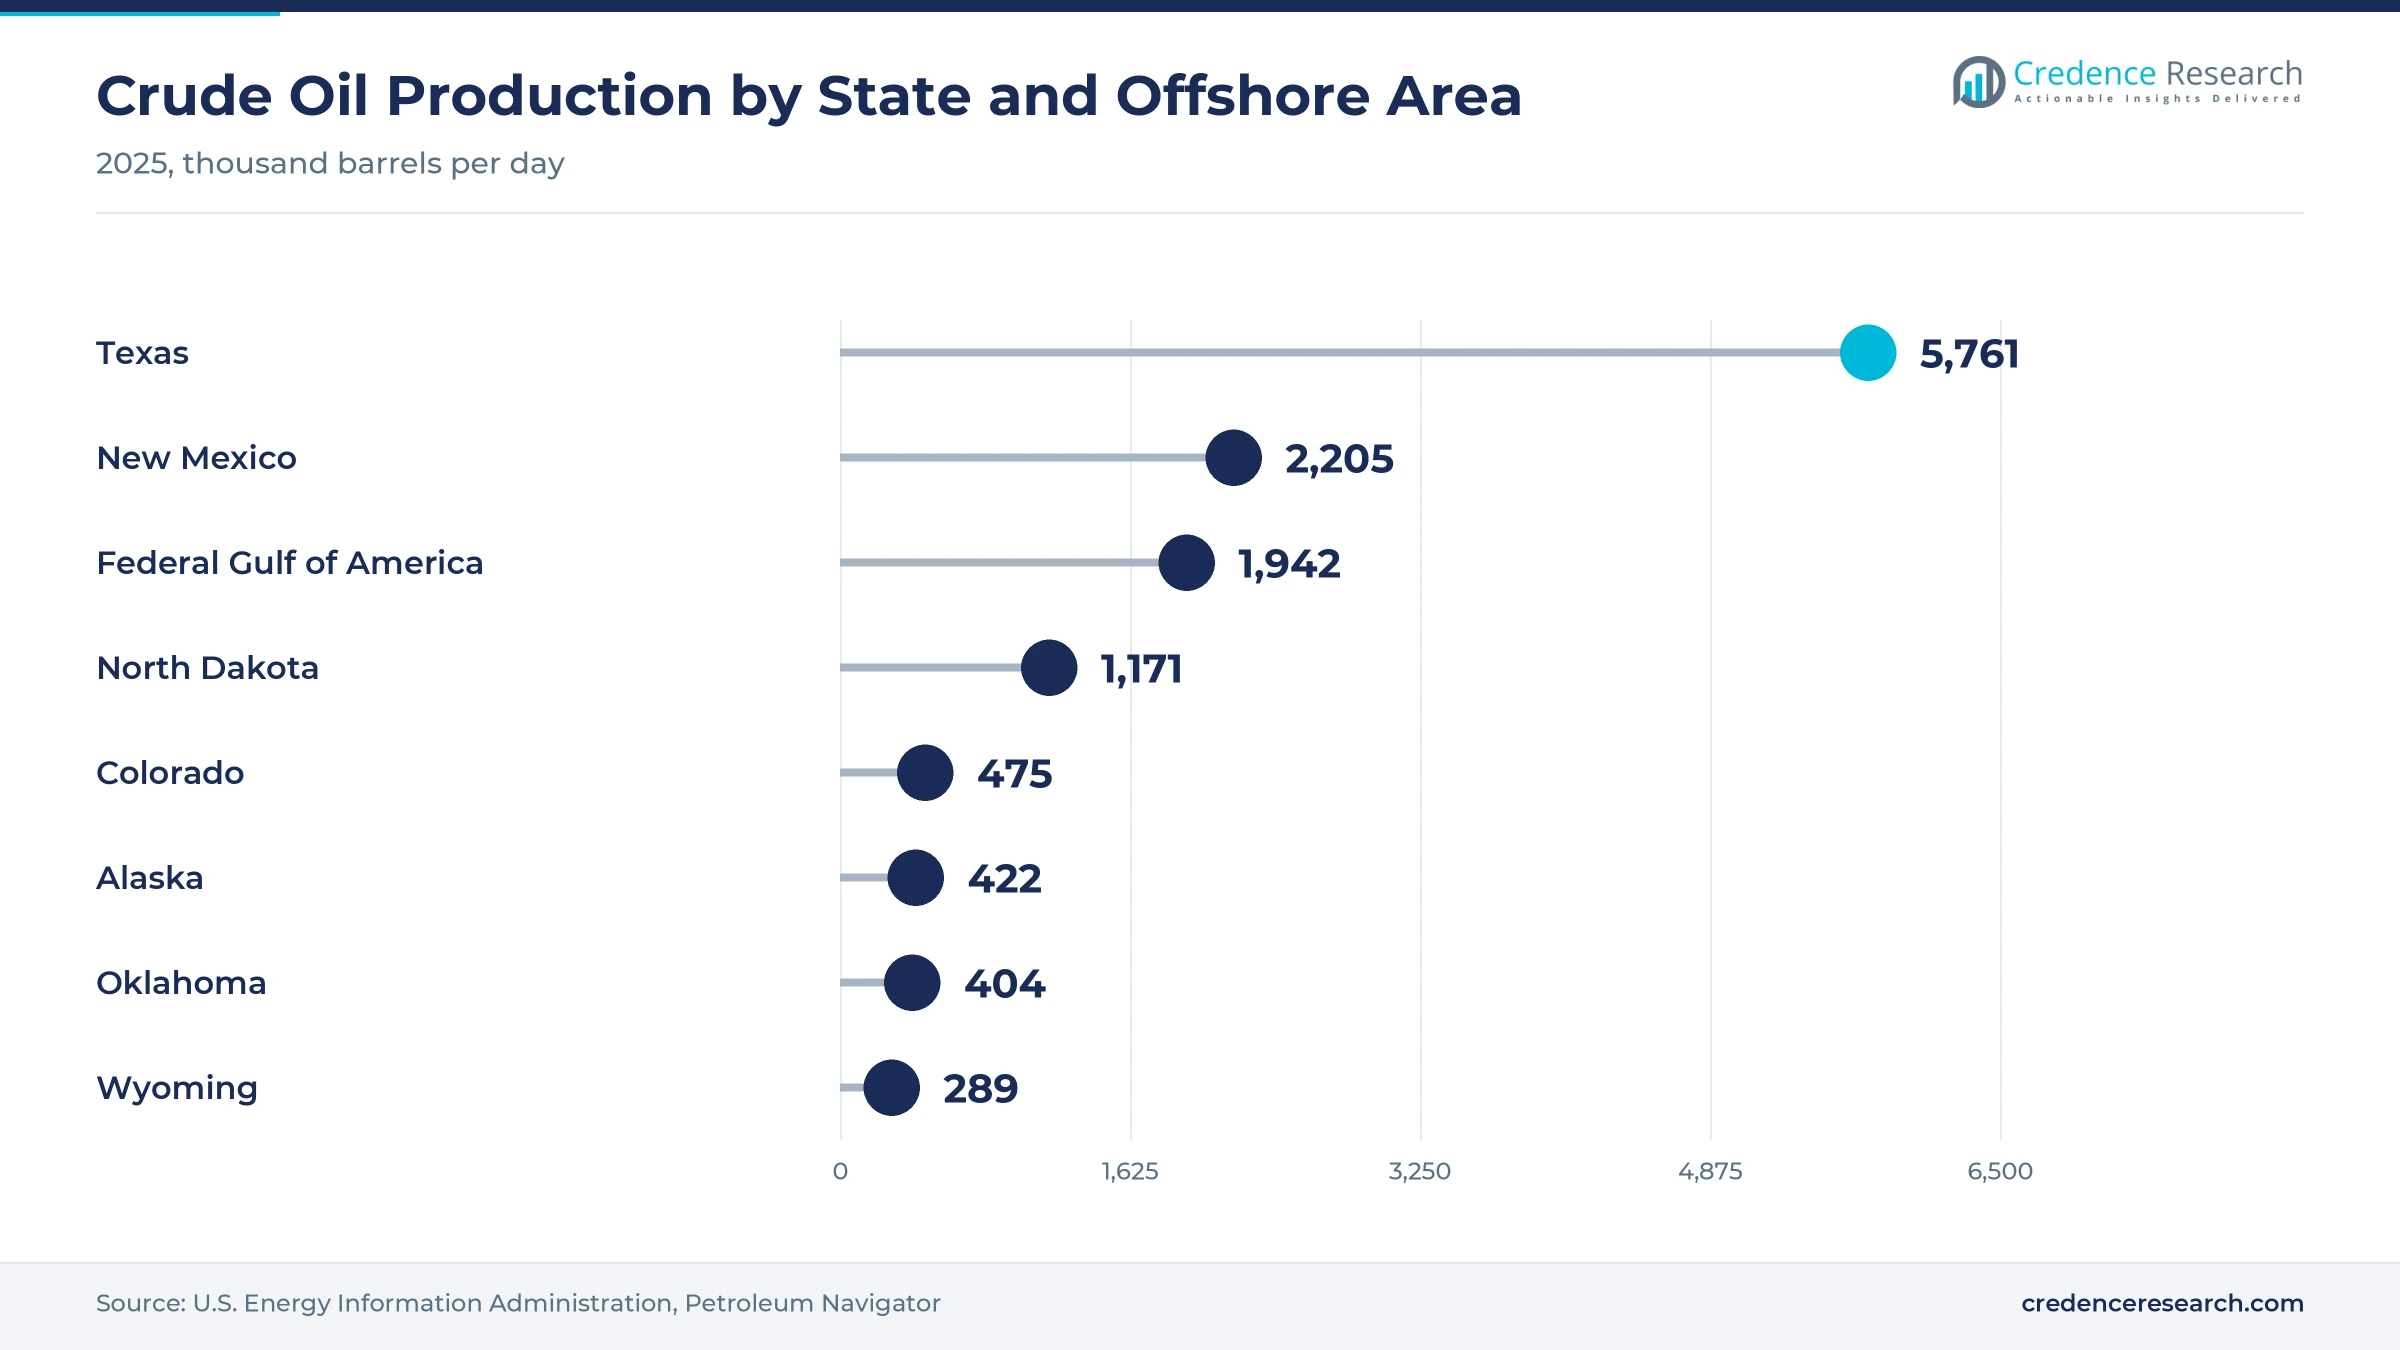
The Permian Basin held a 40.0% share of 2025 value and grows at 6.1% a year in the regional model. Its lead reflects the largest concentration of rigs and wells in the country. New Mexico produced 2,205 thousand barrels a day in 2025, more than double its 2020 level, according to EIA state production data, and EIA expects Permian output of 6.8 million barrels a day in 2026. Pad drilling with super-laterals and automated rigs keeps spending per well high, although a mature supplier base keeps price competition intense.
Deepwater units make the Gulf the fastest-growing zone
The Gulf of America Offshore held a 20.0% share of 2025 value and grows fastest of all five zones. Federal Gulf production rose 10%, or about 200,000 barrels a day, in the first half of 2026 from a year earlier, according to EIA data reported by World Oil. Operators run these fields from onshore control rooms with small offshore crews, so subsea sensors, digital twins and integrity analytics win larger shares of each project budget. Smaller Pacific and Alaskan offshore output grows more slowly, which keeps offshore as a whole at 6.7%.
How does LNG demand shape Appalachia and Haynesville?
Appalachia and Haynesville held a 14.0% share of 2025 value and grow at 6.5% a year. Growth rests on gas producers that must hit LNG and pipeline nominations precisely. Gas rigs stood at 127 on Nov. 13, 2026, and the Expand Energy award noted above covers its wells in both basins. Long-term export contracts reward accurate field forecasting, although gas producers cut discretionary software budgets quickly when rig counts fall.
A mature Bakken well stock favors production software
The Bakken and Rockies zone held an 11.0% share of 2025 value and grows at 5.4% a year. Growth is slower because North Dakota output of 1,171 thousand barrels a day in 2025 sat slightly below its 2020 level. Colorado added 475 thousand barrels a day and hosts the Chevron and Halliburton intelligent fracturing work described above. Chevron’s Bakken position from the Hess deal could bring enterprise standards to the basin, although a mature well stock favors production software over new drilling systems.
Shrinking legacy basins keep spending on surveillance
Other onshore basins held a 15.0% share of 2025 value and grow slowest at 5.1% a year. Several of these basins are shrinking, which limits new drilling work. California crude output fell from 395 thousand barrels a day in 2020 to 288 thousand in 2025, Oklahoma held near 404 thousand and Alaska near 422 thousand, according to EIA. The zone also includes the Eagle Ford and Mid-Continent, where smaller operators dominate. Spending here centers on production surveillance for aging wells rather than on new drilling automation.
Acquisitions, contracts and automation plans since 2025
| Development | Status and market relevance |
|---|---|
| In June 2025, Chevron and Halliburton said they had enabled intelligent hydraulic fracturing in Colorado with the ZEUS IQ platform. | Field deployment of a closed-loop completion process |
| In July 2025, SLB completed its acquisition of ChampionX, adding production chemicals, artificial lift, digital and emissions technologies. | Completed acquisition, closed July 16, 2025 |
| In January 2026, Baker Hughes won a multi-year award from Expand Energy to deploy Leucipa across thousands of U.S. gas wells. | Contract award, with the Lucy AI assistant still at pilot stage |
| In April 2026, SLB and Rockwell Automation completed the dissolution of the Sensia joint venture and split its businesses. | Completed transaction, effective April 1, 2026 |
| In August 2026, ExxonMobil said it plans to automate a quarter of its Permian rigs in 2027 and half by 2028. | Plan, with two automated rigs in operation |
Edge control, robotics and satellite links reshape wells
- Edge controllers on the well pad run optimization and control locally, so wells keep producing when links to central systems drop and data resyncs once the connection returns.
- Robotic pipe handling and closed-loop drilling take crews off the rig floor, where about a third of significant rig injuries occur, and hold drilling parameters steadier across two-mile laterals.
- Feedback-driven frac control adjusts pump rates and fluid design for each stage from live subsurface signals, cutting variability between stages, wells and crews.
- Low-orbit satellite links bring broadband to remote pads at monthly plan prices, making cloud analytics and remote supervision practical at sites far from fiber or cellular coverage.
Need a Custom Version of This Report?
Tailor the scope, geography, or segments to your exact requirements.
- Custom geography or segment scope
- Direct access to our analyst team
Service majors bundle software with wells and lift
Competition centers on who controls the data from each well, because that data steers later drilling and production spending. SLB combines its Lumi platform with ChampionX lift and production chemicals and the Sensia lift control businesses, which gives it a strong position in producing wells. Halliburton links LOGIX drilling automation and the ZEUS IQ fracturing platform to its own crews. Baker Hughes sells Leucipa to large producers such as Expand Energy, and Weatherford offers ForeSite for production optimization across large well counts. Emerson now owns AspenTech outright, while Honeywell and Rockwell Automation compete in control systems and edge devices. Patterson-UTI and Helmerich & Payne sell rig automation with their fleets. Suppliers that tie software to physical services hold the deepest customer relationships, while independent platforms compete on openness.
How is the supplier base organized?
Supply splits into three groups that often work on the same well. Integrated service majors, SLB, Halliburton, Baker Hughes and Weatherford, bundle software with drilling, completion, lift and chemical contracts. Automation suppliers such as Emerson, Honeywell and Rockwell Automation sell control systems, instruments and edge devices. Drilling contractors such as Patterson-UTI and Helmerich & Payne now own their rig automation software, while NOV sells its NOVOS rig control system to many contractors. Entry barriers are highest in production platforms with thousands of connected wells, while margins sit with software and recurring monitoring rather than with field hardware.
Which suppliers do U.S. operators shortlist?
| Company | Type | Role in the market |
|---|---|---|
| SLB | Integrated service major | Lumi data and AI platform, ChampionX lift and chemicals, Sensia lift control |
| Halliburton | Integrated service major | LOGIX drilling automation and ZEUS IQ intelligent fracturing platform |
| Baker Hughes | Integrated service major | Leucipa automated production platform for oil and gas wells |
| Weatherford International | Production specialist | ForeSite production optimization and artificial lift control |
| Emerson Electric (AspenTech) | Automation and software supplier | Instruments, control systems and AspenTech subsurface software |
| Honeywell International | Automation supplier | Experion control systems and Cognition Edge well pad controllers |
| Rockwell Automation | Automation supplier | Process automation and vMonitor remote monitoring products |
| Patterson-UTI Energy | Drilling and completion contractor | Cortex rig automation, eos completions platform and Vertex frac automation |
| Helmerich & Payne | Drilling contractor | Automated rigs and drilling software, including ExxonMobil’s first automated Permian rig |
| NOV Inc. | Drilling equipment and automation supplier | NOVOS rig operating system and drilling automation software for land rigs |
Why drilling and production software gain most
Credence Research's view is that American spending on field digital systems will rise faster in drilling and production software than in sensors, because operators are producing record volumes with fewer rigs and fewer workers. The software segment grows at 7.1% a year to 2035, because operators pay for recurring analytics rather than new sensors. High 2026 prices give a near-term lift, but the lasting driver is labor and capital efficiency. Suppliers that own the well data through service contracts should gain share, while vendors selling stand-alone tools to small operators face slow payback debates if prices fall in 2027.
Rig, well and output data anchor the estimate
The report uses 2025 as the base year on a calendar basis, and market values come from the Credence Research model. The earlier estimate was rebuilt from U.S. rig activity, well completions and crude and gas output as shares of national and regional spending, which lowered the 2025 value from the earlier figure. Segment splits and zone shares are Credence Research estimates from public data. Sources used are EIA statistics, federal agency releases, company filings and releases, industry surveys and trade press, and no interviews or surveys were conducted.
Automation and gas wells carry growth to 2035
The U.S. digital oilfield solutions market is expected to reach USD 15.28 billion by 2035, registering a 6.10% CAGR during 2026–2035, as operators automate drilling, completions and production to hold output with leaner crews. Growth should be strongest in drilling optimization, cloud-based systems and the Gulf of America Offshore, because rig automation and deepwater projects carry the highest spending per asset. Price swings, cyber risk and changing methane rules could slow some years. Cloud-based systems should grow at 7.0% a year, faster than on-premises control, as AI workflows pool data from thousands of wells. Suppliers that pair software with field services should keep the strongest positions.
What decides the range of outcomes to 2035?
The base case assumes crude prices ease from 2026 highs but stay above most shale breakevens, with automation spreading steadily through large operators. The downside case follows a sharp price fall that cuts rigs and freezes software budgets at small producers. The upside case needs faster rig automation, wider AI use in production and steady deepwater tiebacks from the new Gulf leases.
| Scenario | CAGR, 2026–2035 | Value, 2035 | What has to hold |
|---|---|---|---|
| Downside | 4.5% | USD 13.32 billion | Prices fall below shale breakevens and small producers cancel software programs |
| Base | 6.10% | USD 15.28 billion | Prices ease from 2026 highs and large operators automate steadily |
| Upside | 7.4% | USD 17.05 billion | Rig automation reaches most large fleets and Gulf tiebacks keep coming |
Frequently Asked Questions
How big is the U.S. digital oilfield solutions market?
How large is the onshore share of U.S. digital oilfield spending?
What do digital oilfield solutions include?
Which technology providers support enterprise-scale programs for U.S. operators?
How do upstream data platforms for oil and gas operations compare?
Which producing region leads the U.S. digital oilfield solutions market?
How is the U.S. onshore digital oilfield market split?
How is automation changing drilling in the Permian?
Table of Content
Chapter 1 Market Segmentation
- 1.1 Segmentation Framework
- 1.1.1 Product and Service Classification
- 1.1.2 Application and End-Use Classification
- 1.1.3 Technology and Solution Classification
- 1.1.4 Customer and Distribution Channel Classification
- 1.1.5 Geographic Segmentation
- 1.1.6 Market Segment Definitions and Boundaries
- 1.2 By Solution
- 1.2.1 Services
- 1.2.2 Hardware
- 1.2.3 Software
- 1.3 By Application
- 1.3.1 Onshore
- 1.3.2 Offshore
- 1.4 By Process
- 1.4.1 Production Optimization
- 1.4.2 Drilling Optimization
- 1.4.3 Reservoir Optimization
- 1.5 By Deployment
- 1.5.1 On-Premises
- 1.5.2 Cloud-Based
Chapter 2 Introduction
- 2.1 Report Objectives and Scope
- 2.2 Product Definition and Industry Terminology
- 2.3 Market Inclusions and Exclusions
- 2.4 Research Process
- 2.4.1 Primary Research and Expert Interviews
- 2.4.2 Secondary Research and Source Review
- 2.4.3 Top-Down and Bottom-Up Estimation
- 2.4.4 Data Triangulation and Verification
- 2.5 Market Size Measurement Basis
- 2.5.1 2025: USD 8.45 billion → 2035: USD 15.28 billion
- 2.6 Historical and Forecast Reference Periods
- 2.6.1 Historical Period: 2018-2025
- 2.6.2 Base Year: 2025
- 2.6.3 Forecast Period: 2025-2035
- 2.7 Research Assumptions and Limitations
Chapter 3 Executive Summary
- 3.1 Market Snapshot and Key Findings
- 3.2 Base-Year Market Size, 2025
- 3.3 Forecast Market Size, 2035
- 3.4 Revenue and Volume Growth Outlook
- 3.5 Key Demand and Supply Indicators
- 3.6 Leading Market Segments
- 3.7 Fastest-Growing Market Opportunities
- 3.8 Regional Performance Highlights
- 3.9 Technology and Industry Transformation
- 3.10 Competitive Landscape Summary
- 3.11 Analyst View and Strategic Implications
Chapter 4 U.S. Digital Oilfield Solutions Market Trends and Developments
- 4.1 Historical Industry Development, 2018-2025
- 4.2 Recent Market Trends and Developments
- 4.3 Demand and Customer Behavior Trends
- 4.4 Technology and Product Innovation
- 4.5 Artificial Intelligence, Automation and Digitalization
- 4.6 Local Manufacturing and Supply Chain Realignment
- 4.7 Industry Partnerships, Mergers and Acquisitions
- 4.8 Sustainability and Circular Economy Developments
- 4.9 Government and Private Sector Investment Trends
- 4.10 Emerging Business Models and Commercialization
- 4.11 Industry Developments and Announcements
Chapter 5 U.S. Digital Oilfield Solutions Market Production, Supply and Demand Analysis
- 5.1 Demand Trend and Consumption Analysis, 2018-2025
- 5.2 Demand Forecast, 2025-2035
- 5.3 Production and Output Trend, 2018-2025
- 5.4 Production and Output Forecast, 2025-2035
- 5.5 Installed Capacity and Capacity Utilization
- 5.6 Company-Wise Production Plants and Statistics
- 5.6.1 Installed Production Capacity
- 5.6.2 Actual Production
- 5.6.3 Planned Capacity and Expansion Targets
- 5.7 Supply Chain Structure and Procurement Trends
- 5.8 Supply-Demand Gap and Bottlenecks
- 5.9 Import Dependence and Sourcing Structure
- 5.10 Contract Manufacturing and Outsourcing
- 5.11 Regional Supply and Demand Concentration
Chapter 6 U.S. Digital Oilfield Solutions Market Pricing Analysis
- 6.1 Pricing Structure and Measurement
- 6.2 Historical Pricing Trends, 2018-2025
- 6.3 Pricing Outlook, 2025-2035
- 6.4 Average Selling Price and Unit Economics
- 6.5 Pricing by Product and Market Segment
- 6.6 Geographic Pricing Differences
- 6.7 Key Input, Energy, Labor and Logistics Costs
- 6.8 Contract Pricing and Purchasing Models
- 6.9 Pricing Sensitivity and Competitive Positioning
- 6.10 Price, Margin and Profitability Implications
Chapter 7 U.S. Digital Oilfield Solutions Market Dynamics
- 7.1 Market Growth Drivers
- 7.1.1 Demand-Side Drivers
- 7.1.2 Technology and Innovation Drivers
- 7.1.3 Infrastructure and Investment Drivers
- 7.1.4 Regulatory and Policy Drivers
- 7.2 Market Restraints
- 7.2.1 Cost and Affordability Constraints
- 7.2.2 Technology and Adoption Barriers
- 7.2.3 Supply Chain and Operational Constraints
- 7.3 Market Challenges
- 7.3.1 Competitive Pressure and Margin Erosion
- 7.3.2 Skills, Infrastructure and Implementation Gaps
- 7.4 Emerging Market Opportunities
- 7.5 Market Dynamics Impact and Time-Horizon Assessment
Chapter 8 U.S. Digital Oilfield Solutions Value Chain Analysis
- 8.1 Industry Value Chain Overview
- 8.2 Upstream Suppliers and Critical Inputs
- 8.3 Technology and Component Providers
- 8.4 Manufacturing or Service Delivery
- 8.5 Distribution, Channel Partners and Integrators
- 8.6 Downstream Applications and End Users
- 8.7 Value Addition and Profit Pools
- 8.8 Vertical Integration and Outsourcing
- 8.9 Supplier Concentration and Risk
- 8.10 Supply Chain Localization and Resilience
Chapter 9 U.S. Digital Oilfield Solutions Market Regulations and Policies
- 9.1 Relevant Laws, Standards and Compliance Frameworks
- 9.2 Product, Service, Safety and Quality Requirements
- 9.3 Government Policies, Incentives and Subsidies
- 9.4 Imports, Exports and Trade Barriers
- 9.5 Public Procurement and Local Content Requirements
- 9.6 Environmental and Sustainability Compliance
- 9.7 Upcoming Policy Changes and Market Implications
Chapter 10 U.S. Digital Oilfield Solutions Market Hotspots and Opportunities
- 10.1 Market Opportunity Mapping and Growth Hotspots
- 10.2 High-Growth Applications and Customer Groups
- 10.3 Underserved Markets and White-Space Opportunities
- 10.4 Emerging Technology and Product Opportunities
- 10.5 New Capacity and Investment Hotspots
- 10.6 Market Entry and Expansion Opportunities
- 10.7 Distribution and Partnership Opportunities
- 10.8 Near-Term and Long-Term Commercial Potential
- 10.9 Opportunity Attractiveness and Execution Risks
Chapter 11 U.S. Digital Oilfield Solutions Market Outlook, 2025-2035
- 11.1 Market Size and Analysis
- 11.1.1 Revenue (Market Measurement: 2025: USD 8.45 billion → 2035: USD 15.28 billion)
- 11.1.2 Market Volume and Quantity Sold
- 11.1.3 Historical Market Size, 2018-2025
- 11.1.4 Base-Year Market Size, 2025
- 11.2 Market Forecast, 2025-2035
- 11.2.1 Revenue Forecast to 2035
- 11.2.2 Volume Forecast to 2035
- 11.2.3 CAGR and Year-on-Year Growth
- 11.2.4 Incremental Revenue Opportunity
- 11.3 Forecast Assumptions and Scenario Analysis
- 11.3.1 Base-Case Forecast
- 11.3.2 Optimistic and Conservative Scenarios
- 11.3.3 Technology, Pricing and Policy Sensitivities
- 11.4 Market Attractiveness and Growth Outlook
Chapter 12 U.S. Digital Oilfield Solutions Market Segmentation and Outlook
- 12.1 Segmentation Summary and Market Shares, 2025
- 12.2 Largest and Fastest-Growing Segments
- 12.3 By Solution - Market Size and Forecast, 2025-2035
- 12.3.1 Segment Definition and Scope
- 12.3.2 Historical Market Size, 2018-2025
- 12.3.3 Revenue Forecast, 2025-2035
- 12.3.4 Volume Forecast, 2025-2035
- 12.3.5 Base-Year Market Share, 2025
- 12.3.6 Segment CAGR and Growth Drivers
- 12.3.7 Subsegment Market Size and Forecast
- 12.3.7.1 Services
- 12.3.7.2 Hardware
- 12.3.7.3 Software
- 12.3.8 Subsegment Pricing and Adoption Trends
- 12.3.9 Leading Suppliers and Competition
- 12.3.10 Regional Demand and Opportunities
- 12.4 By Application - Market Size and Forecast, 2025-2035
- 12.4.1 Segment Definition and Scope
- 12.4.2 Historical Market Size, 2018-2025
- 12.4.3 Revenue Forecast, 2025-2035
- 12.4.4 Volume Forecast, 2025-2035
- 12.4.5 Base-Year Market Share, 2025
- 12.4.6 Segment CAGR and Growth Drivers
- 12.4.7 Subsegment Market Size and Forecast
- 12.4.7.1 Onshore
- 12.4.7.2 Offshore
- 12.4.8 Subsegment Pricing and Adoption Trends
- 12.4.9 Leading Suppliers and Competition
- 12.4.10 Regional Demand and Opportunities
- 12.5 By Process - Market Size and Forecast, 2025-2035
- 12.5.1 Segment Definition and Scope
- 12.5.2 Historical Market Size, 2018-2025
- 12.5.3 Revenue Forecast, 2025-2035
- 12.5.4 Volume Forecast, 2025-2035
- 12.5.5 Base-Year Market Share, 2025
- 12.5.6 Segment CAGR and Growth Drivers
- 12.5.7 Subsegment Market Size and Forecast
- 12.5.7.1 Production Optimization
- 12.5.7.2 Drilling Optimization
- 12.5.7.3 Reservoir Optimization
- 12.5.8 Subsegment Pricing and Adoption Trends
- 12.5.9 Leading Suppliers and Competition
- 12.5.10 Regional Demand and Opportunities
- 12.6 By Deployment - Market Size and Forecast, 2025-2035
- 12.6.1 Segment Definition and Scope
- 12.6.2 Historical Market Size, 2018-2025
- 12.6.3 Revenue Forecast, 2025-2035
- 12.6.4 Volume Forecast, 2025-2035
- 12.6.5 Base-Year Market Share, 2025
- 12.6.6 Segment CAGR and Growth Drivers
- 12.6.7 Subsegment Market Size and Forecast
- 12.6.7.1 On-Premises
- 12.6.7.2 Cloud-Based
- 12.6.8 Subsegment Pricing and Adoption Trends
- 12.6.9 Leading Suppliers and Competition
- 12.6.10 Regional Demand and Opportunities
- 12.7 Segment Growth Comparison
- 12.8 Segment Attractiveness and Priority Matrix
Chapter 13 U.S. Digital Oilfield Solutions End-Use and Application Market Outlook
- 13.1 End-Use Industry and Customer Demand Structure
- 13.2 Leading Applications and Customer Groups
- 13.3 End-Use Market Size, Share and Forecast
- 13.4 Major End-Use Industry Deep Dives
- 13.4.1 Customer Requirements and Use Cases
- 13.4.2 Demand and Replacement Cycles
- 13.4.3 Technical and Regulatory Considerations
- 13.4.4 Purchasing and Procurement Models
- 13.4.5 Leading Vendors and Distribution Channels
- 13.4.6 Forecast and Commercial Opportunities
- 13.5 Emerging Applications and Cross-Segment Demand
- 13.6 End-Use Industry Investment Priorities
Chapter 14 U.S. Digital Oilfield Solutions Geographic Market Outlook, 2025-2035
- 14.1 Domestic Market Distribution and Demand Clusters
- 14.2 State- or Province-Wise Market Size and Forecast, 2025-2035
- 14.3 City and Metropolitan Market Outlook
- 14.4 Industrial, Manufacturing and Commercial Clusters
- 14.5 Geographic Concentration of Key End Users
- 14.6 Local Pricing and Purchasing Differences
- 14.7 Domestic Production Facilities and Capacity Map
- 14.8 Local Infrastructure and Project Pipeline
- 14.9 State-Level Policy and Incentive Differences
- 14.10 Subnational Investment Hotspots and Opportunities
- 14.11 Distribution and Logistics Networks
- 14.12 Domestic Competitive Footprint
Chapter 15 U.S. Digital Oilfield Solutions Technology, Innovation and Sustainability Outlook
- 15.1 Technology Landscape and Maturity
- 15.2 Product, Process and Service Innovation
- 15.3 AI, Automation and Digital Tools in the Industry
- 15.4 Technology Adoption and Performance Benchmarking
- 15.5 Innovation Pipeline and R&D Investment
- 15.6 Patent and Intellectual Property Trends
- 15.7 Energy Efficiency and Resource Management
- 15.8 Sustainability, Recycling and Circularity
- 15.9 Technology Roadmap, 2025-2035
- 15.10 Risks of Obsolescence and Technology Substitution
Chapter 16 U.S. Digital Oilfield Solutions Market Key Strategic Imperatives
- 16.1 Growth and Market Entry Priorities
- 16.2 High-Return Products and Segments
- 16.3 Pricing, Profitability and Cost Optimization
- 16.4 Technology Investment and Product Differentiation
- 16.5 Supply Chain Localization and Resilience
- 16.6 Distribution and Customer Acquisition
- 16.7 Partnership, Acquisition and Capacity Strategy
- 16.8 Regional Expansion Priorities
- 16.9 Short-, Medium- and Long-Term Actions
Chapter 17 Competition Outlook
- 17.1 Industry Competition Characteristics
- 17.2 Market Structure and Concentration
- 17.3 Market Share and Competitive Positioning, 2025
- 17.4 Company-Wise Revenue and Product Benchmarking
- 17.5 Production and Service Capacity Benchmarking
- 17.6 Technology, Pricing and Differentiation
- 17.7 Regional Footprint and Distribution Strength
- 17.8 Mergers, Acquisitions and Strategic Alliances
- 17.9 New Entrants and Competitive Threats
- 17.10 Porter's Five Forces and Industry Attractiveness
- 17.11 Competitive Outlook, 2025-2035
Chapter 18 Company Profiles
- 18.1 Company Coverage and Selection Criteria
- 18.2 SLB
- 18.2.1 Business Description
- 18.2.2 Company Ownership and Geographic Presence
- 18.2.3 Product and Service Portfolio
- 18.2.4 Manufacturing and Operating Footprint
- 18.2.5 Production Capacity and Expansion Plans
- 18.2.6 Financial Performance and Investment
- 18.2.7 Market Share and Competitive Position
- 18.2.8 Technology and Innovation Capabilities
- 18.2.9 Strategic Alliances or Partnerships
- 18.2.10 Recent Developments
- 18.2.11 Growth Strategy and Outlook
- 18.3 Halliburton
- 18.4 Baker Hughes
- 18.5 Weatherford International
- 18.6 Emerson Electric (AspenTech)
- 18.7 Honeywell International
- 18.8 Rockwell Automation
- 18.9 Patterson-UTI Energy
- 18.10 Helmerich & Payne
- 18.11 NOV Inc.
- 18.12 Other Relevant Market Participants
Note: Every listed company is profiled on the structure shown under the first company. The company list is preliminary and may change based on research findings, market developments, data availability and client requirements.
Chapter 19 Disclaimer
- 19.1 Research and Forecast Disclaimer
- 19.2 Data Source and Estimation Limitations
Note: The depth of individual sections depends on data availability for this market. Volume, capacity, trade and other unit-based metrics are included where applicable.