Service contracts follow a record turbine order wave
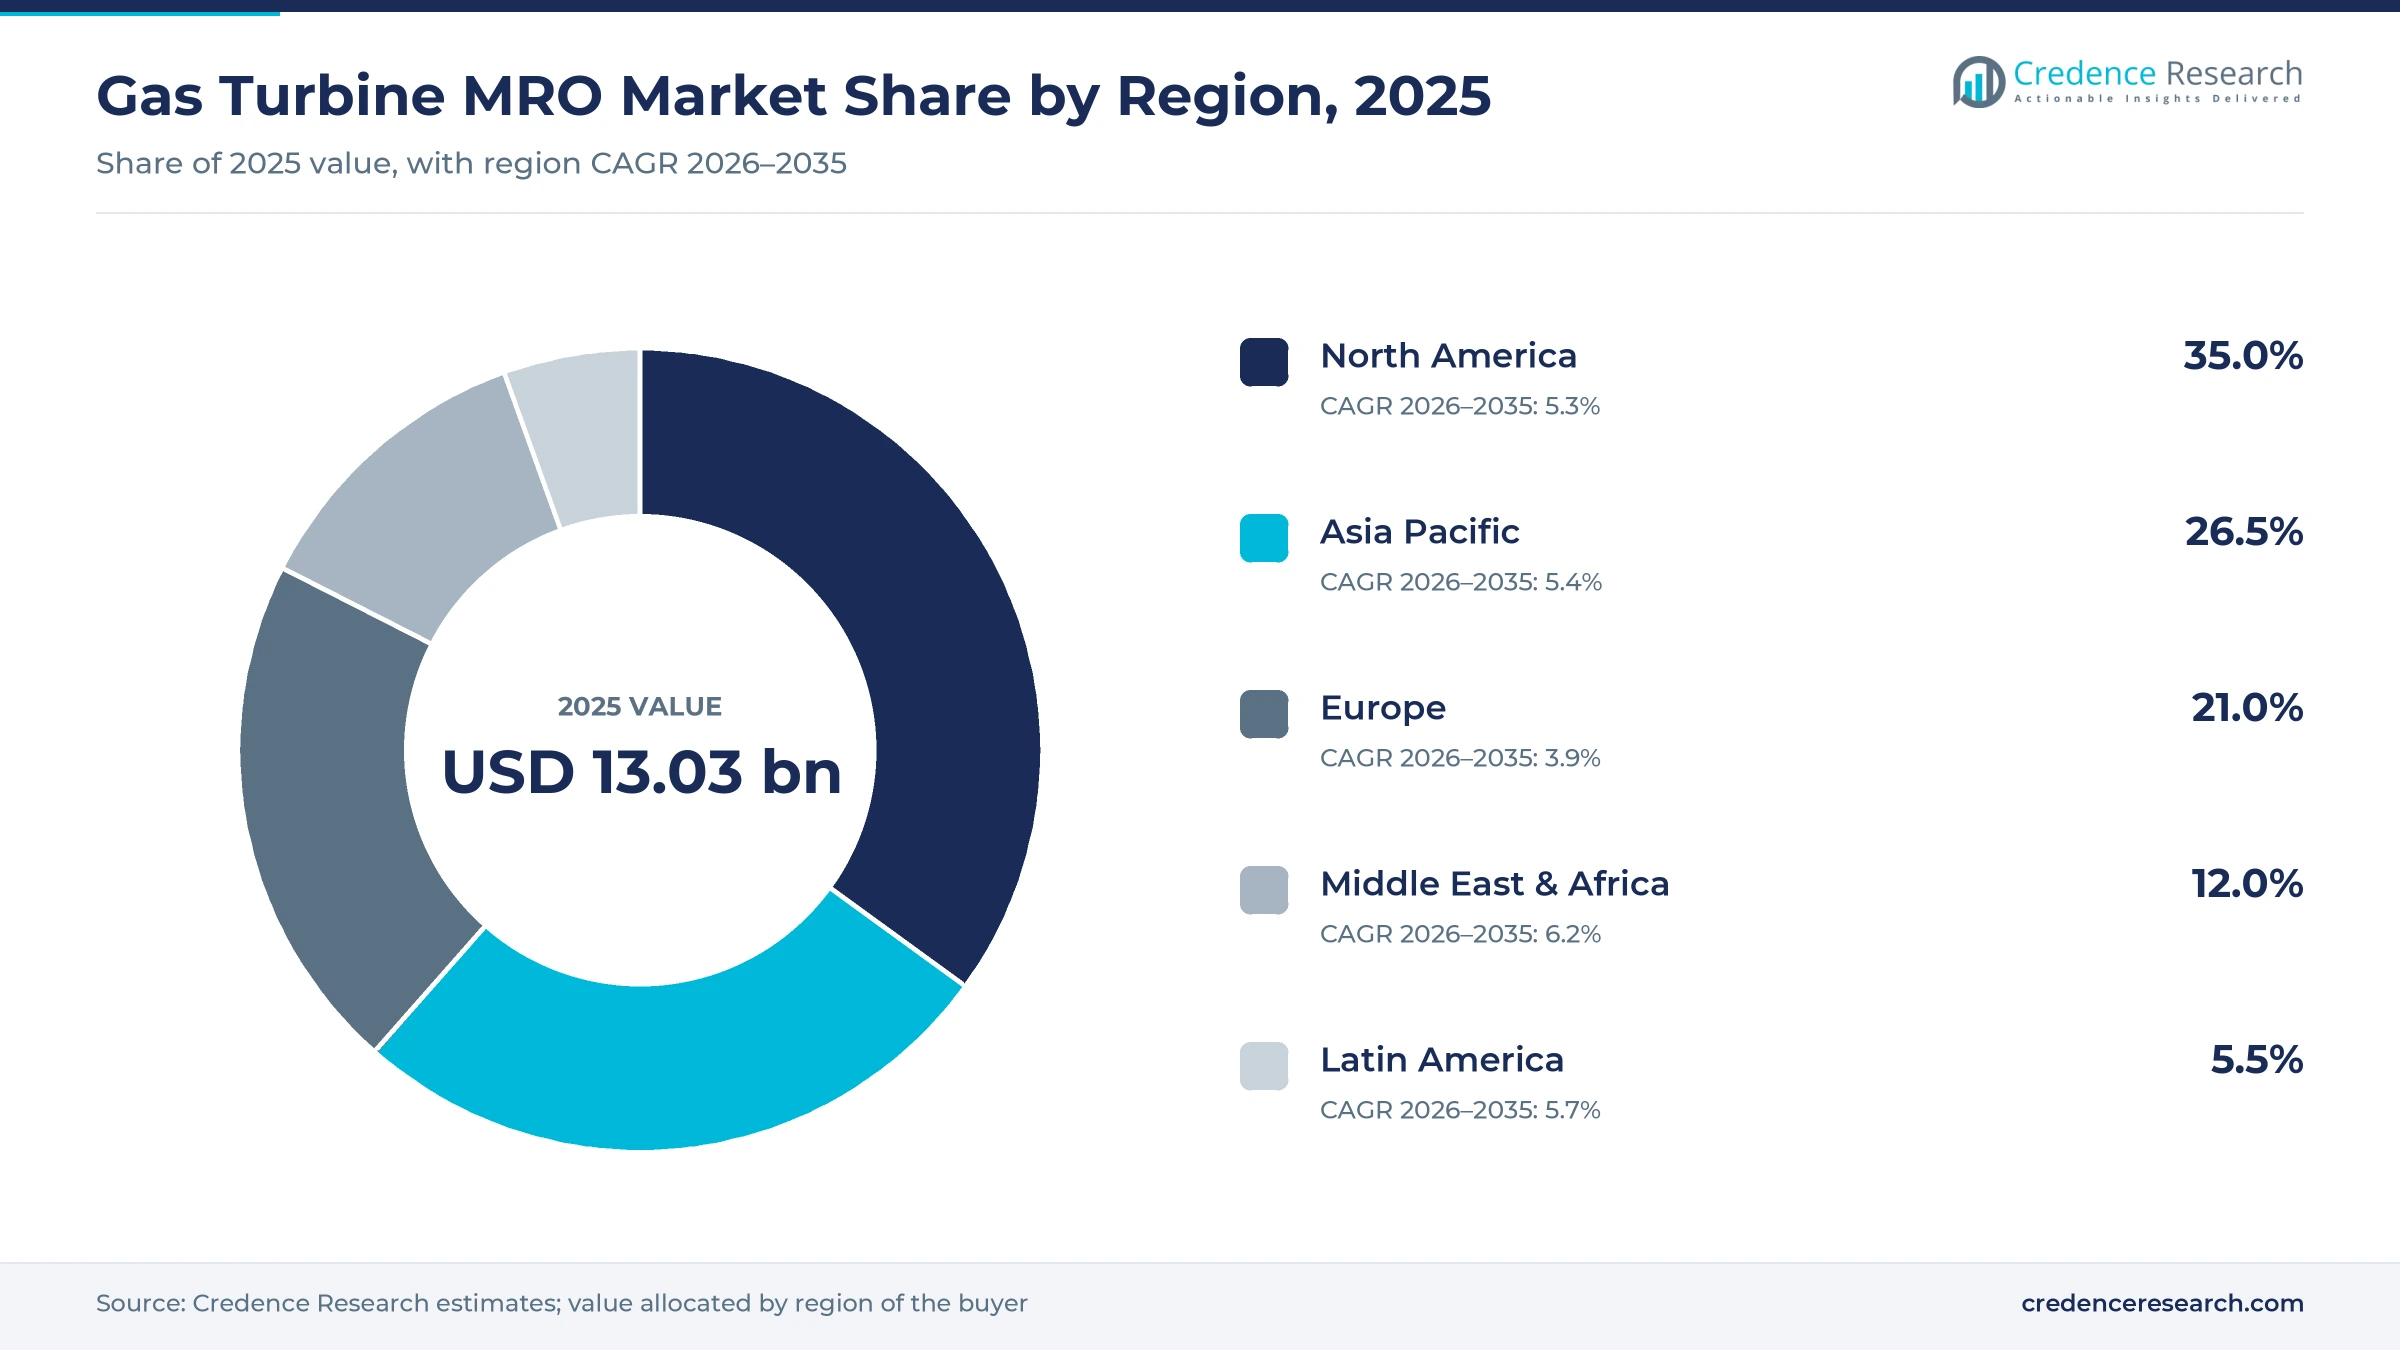
The global gas turbine MRO market was valued at USD 13.03 billion in 2025 and is projected to increase from USD 13.71 billion in 2026 to USD 21.64 billion by 2035, registering a CAGR of 5.20% during 2026–2035. Spending comes from utilities, independent power producers and industrial plants that buy scheduled inspections, hot-gas-path and major overhauls, component repair and upgrades for heavy-duty and aero-derivative units, most of it under long-term service agreements priced per fired hour or start. North America held the largest regional share, 35.0% in 2025, because the United States runs the largest gas-fired fleet and is adding units for data centers. Middle East & Africa is the fastest-growing region at 6.2% a year, as Gulf utilities sign 20- to 25-year agreements with new combined-cycle plants. The main commercial change is scarcity, since multi-year waits for new turbines push owners to extend, uprate and repair the units they already run.
Who pays for turbine upkeep and how contracts are priced
The market counts what owners of power-generation gas turbines pay for routine maintenance, unplanned repair and scheduled overhaul of the turbine and its hot section, including parts, shop work, field service and performance upgrades. Buyers sign long-term agreements with the original maker, contract an independent service provider for parts and outages, or keep the work in-house with their own crews and purchased components.
Balance-of-plant work on steam turbines, boilers, transformers and plant operation staff is excluded unless it is bundled in a turbine service contract, and aviation engine MRO is outside scope. Value concentrates in hot-section parts and major inspections, which explains why parts supply and intellectual property shape competition more than labor rates.

Gas Turbine MRO Market Insights
- The global gas turbine MRO market was valued at USD 13.03 billion in 2025 and is projected to reach USD 21.64 billion by 2035, growing at a 5.20% CAGR.
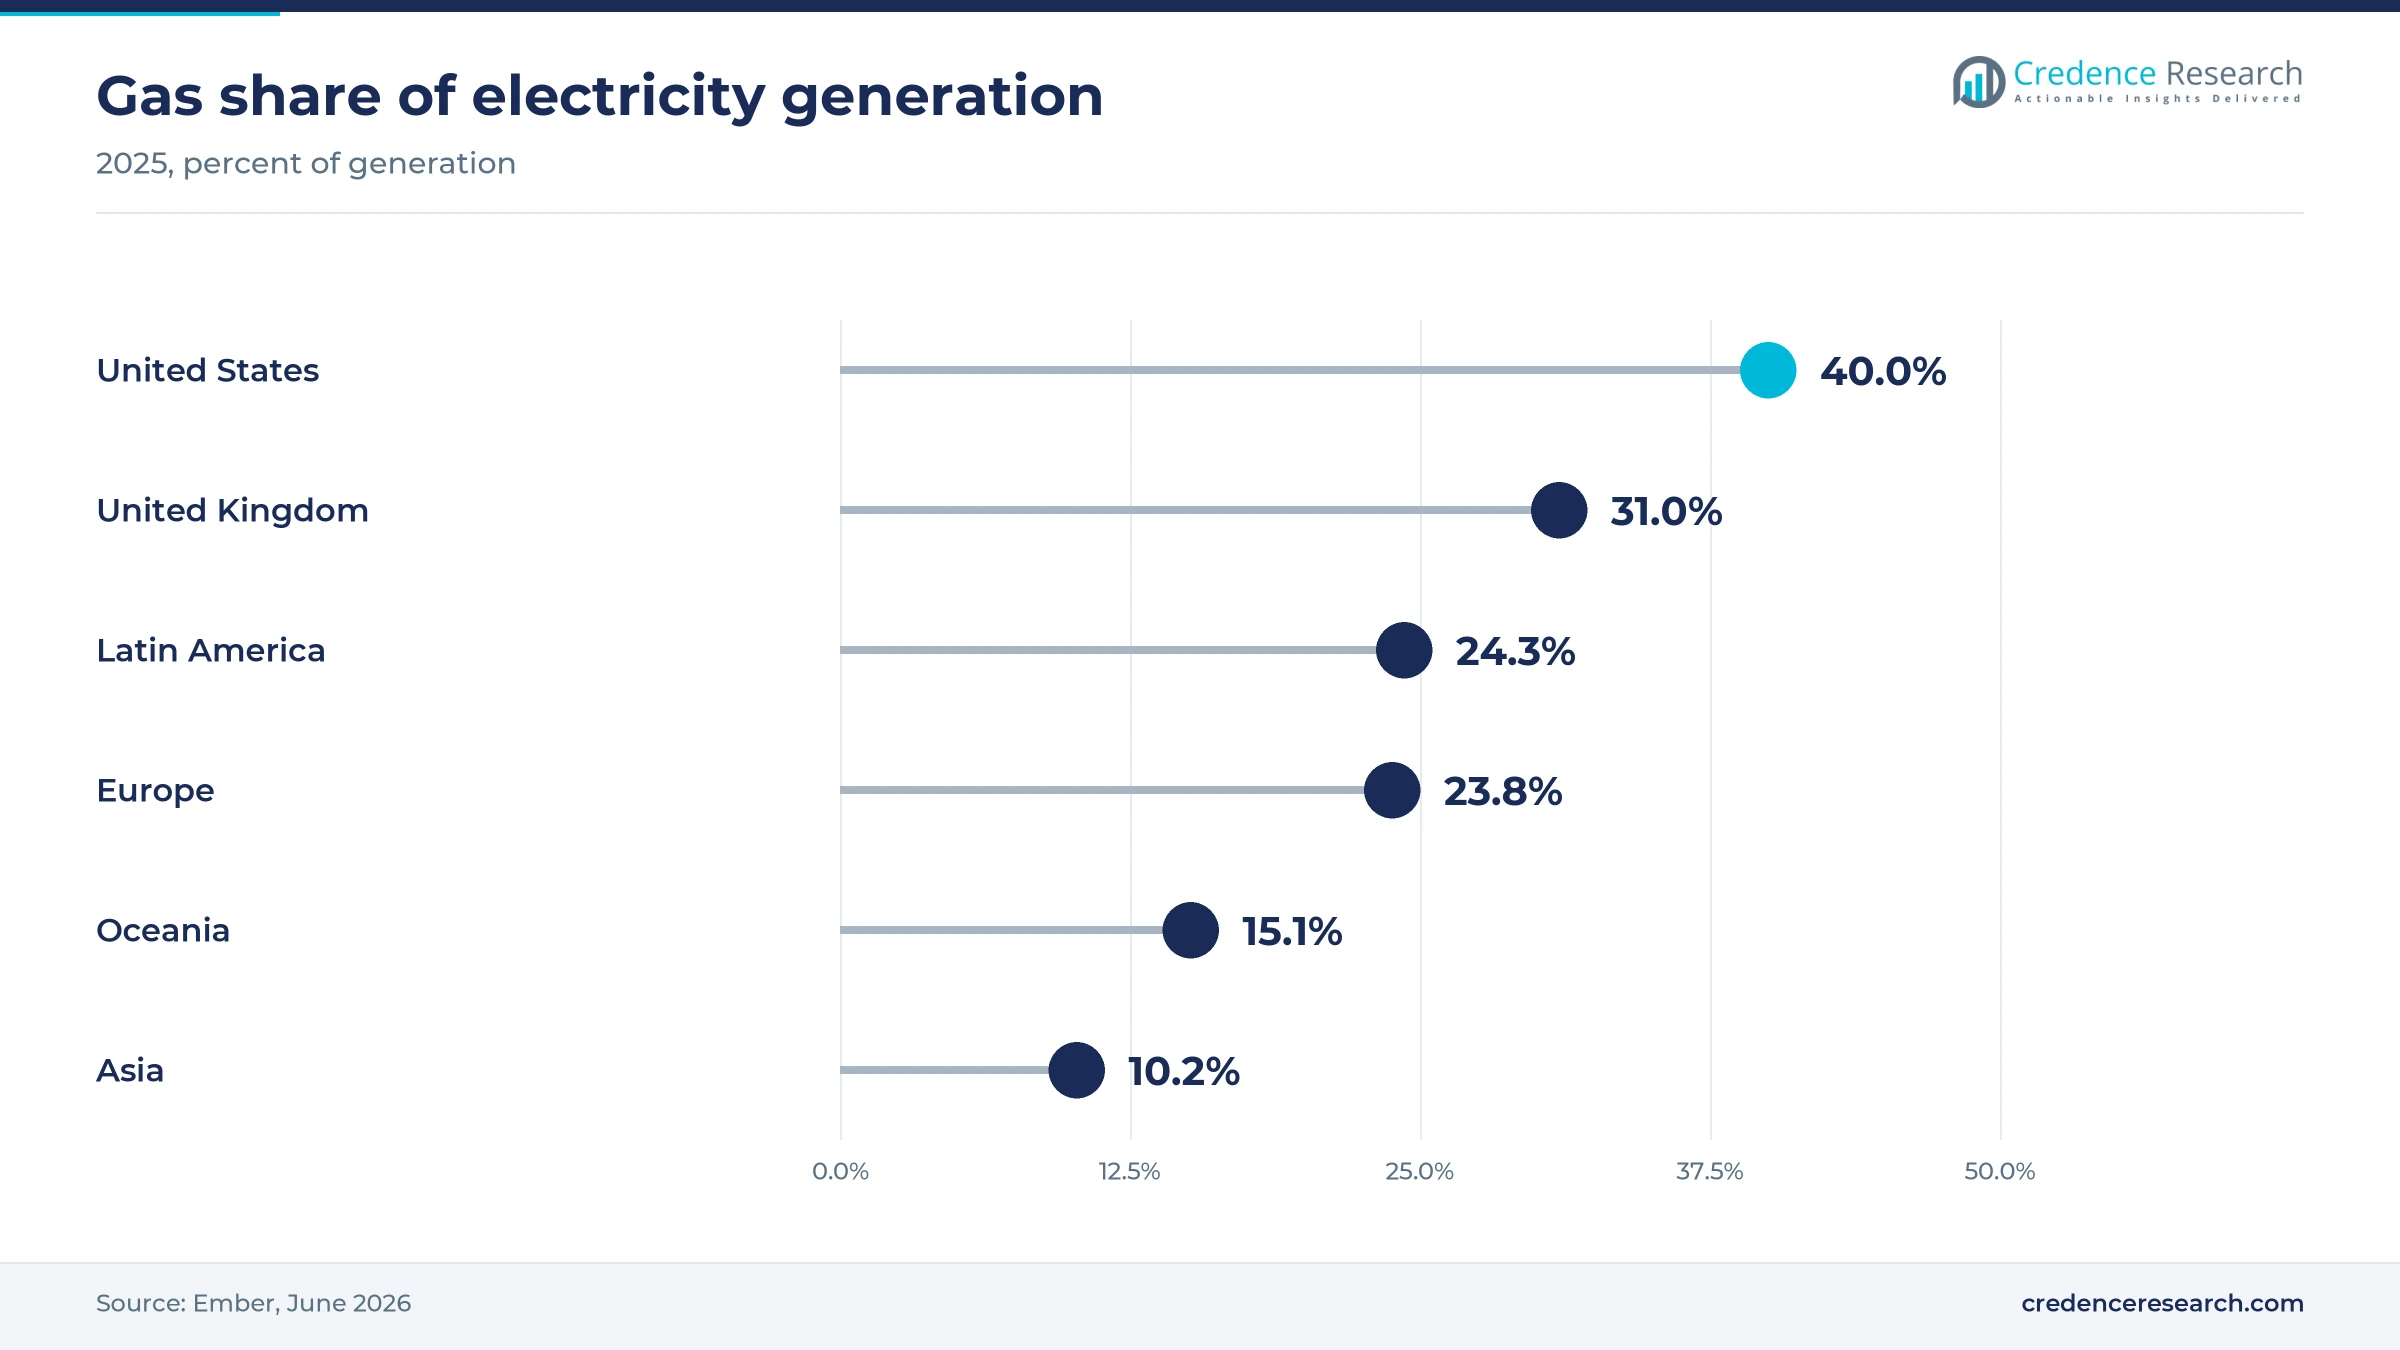
- North America held 35.0% of 2025 value, because natural gas supplied about 40% of U.S. power sector generation in 2025.
- Maintenance held 46.0% of 2025 value, as multi-decade service agreements fix inspection intervals for most new combined-cycle units.
- Worldwide orders reached 846 turbines and 100.3 GW in 2025, more than double 2024, according to EPRI, building the service base of the 2030s.
- Original makers hold the largest provider share, while independent providers buy design rights and repair capacity to service older F-class frames leaving first contracts.
Scheduled maintenance leads while repair grows fastest
Inspection contracts lead as hot-section repair accelerates
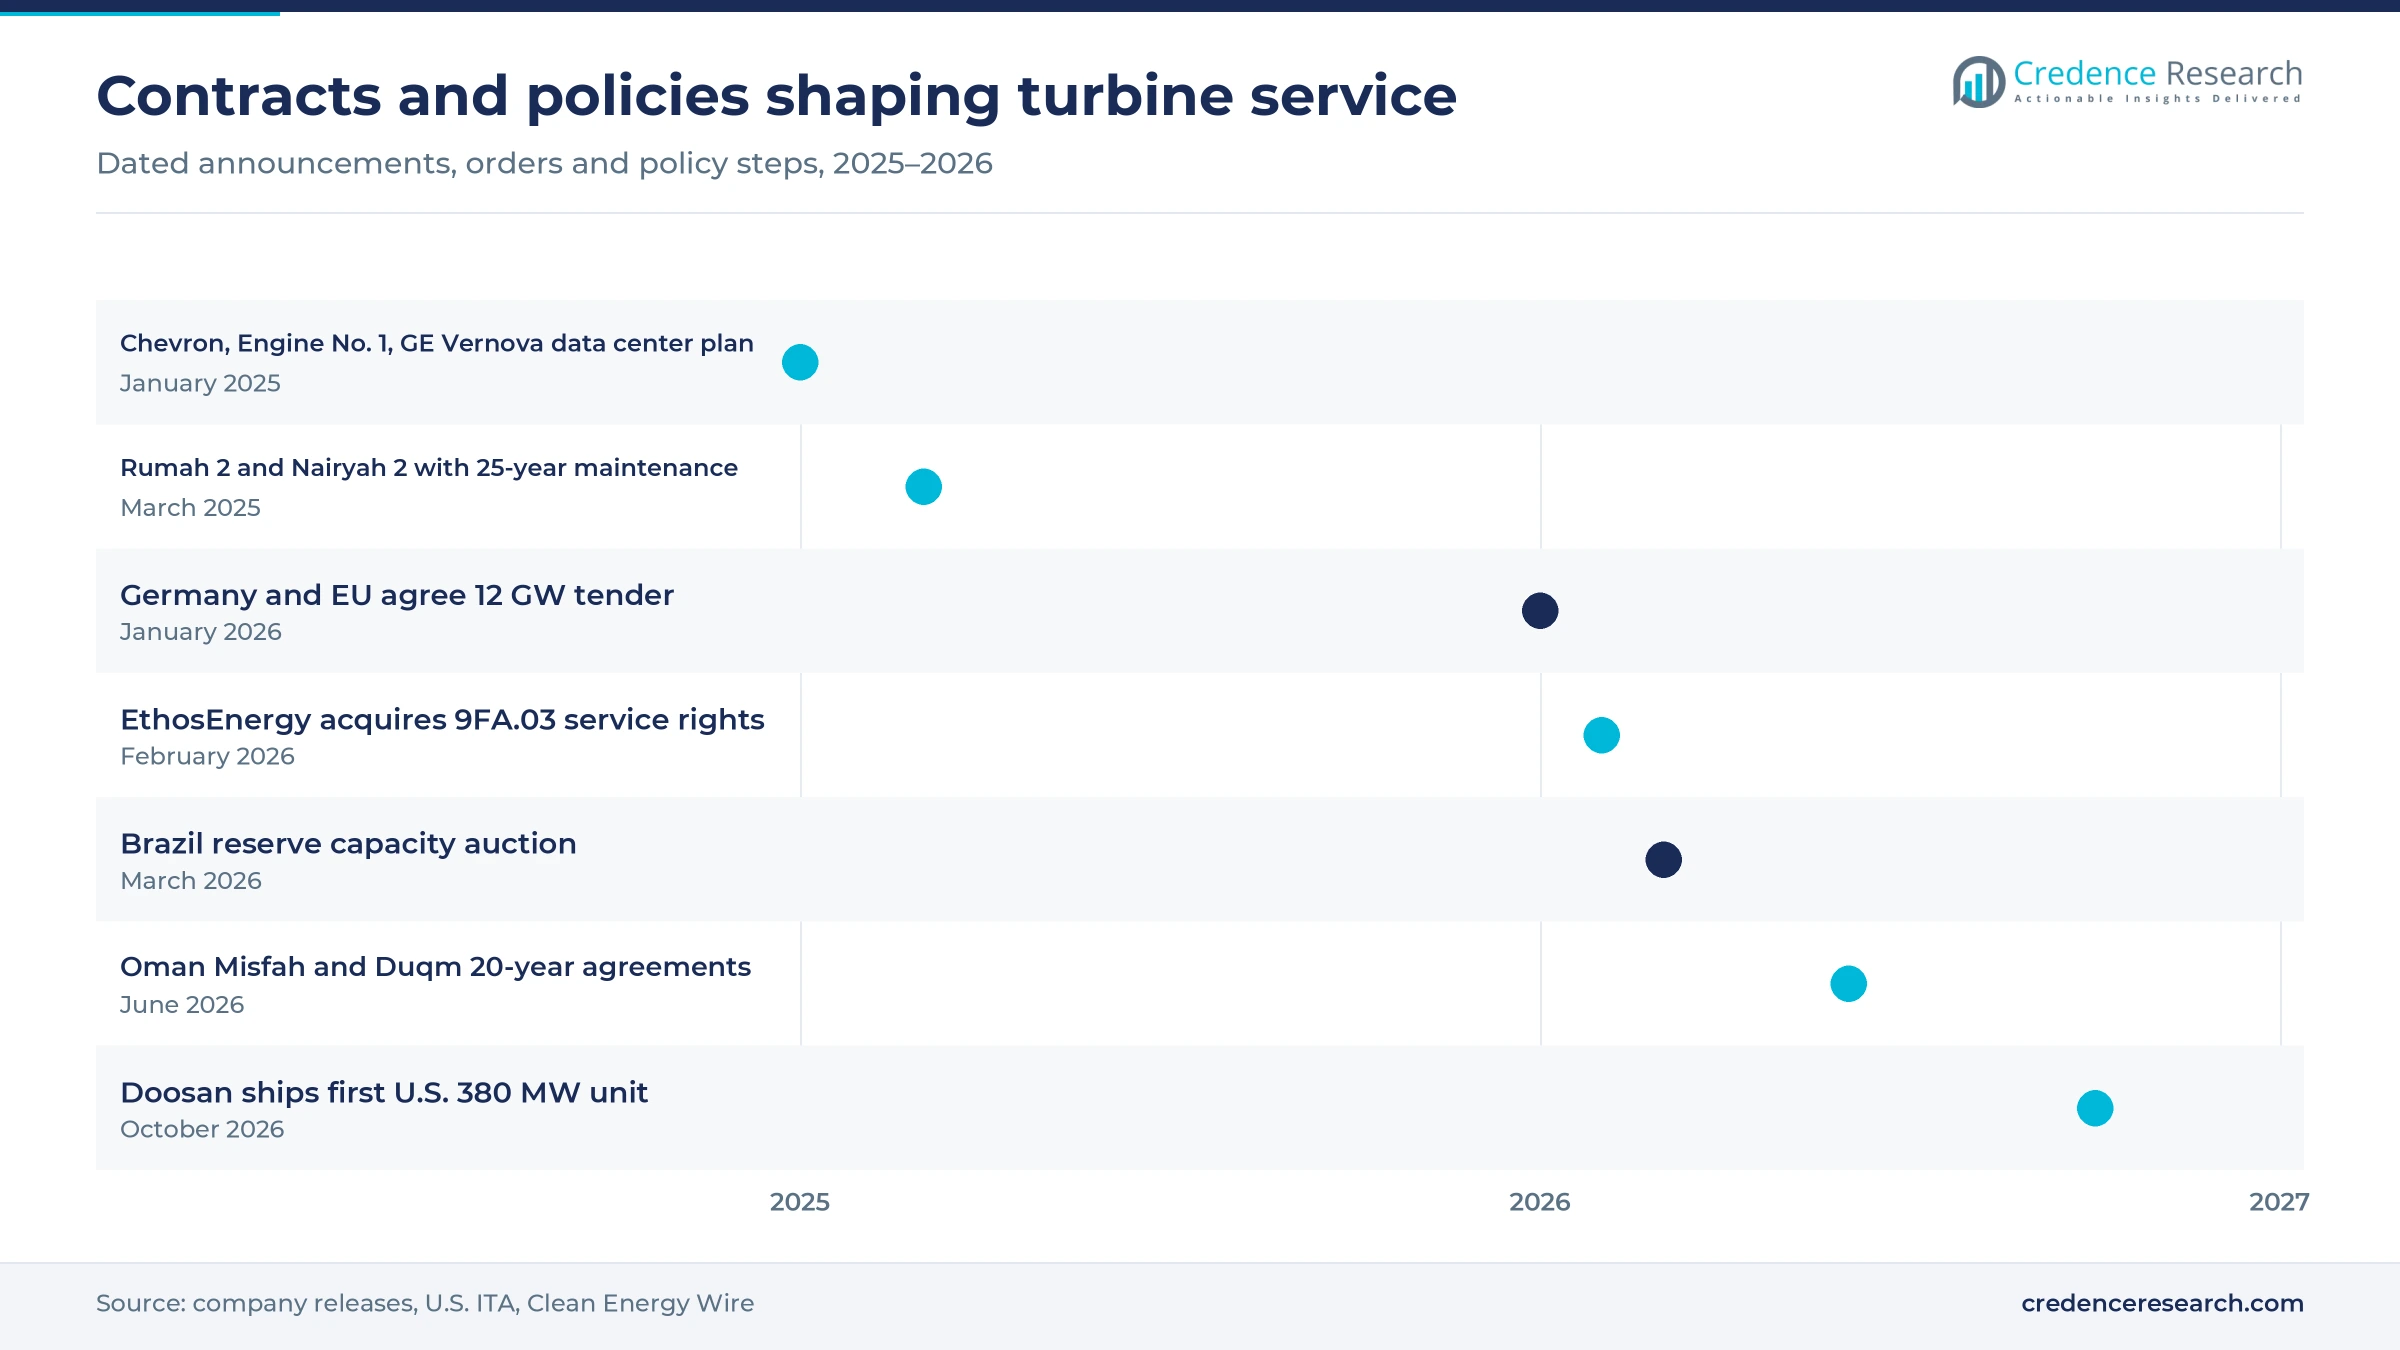
Based on service type, the market is categorized into maintenance, repair and overhaul. Maintenance led with 46.0% of 2025 value because most heavy-duty units run under agreements that fix combustion and hot-gas-path inspection intervals, and the 25-year maintenance agreements attached to the 3.6 GW Rumah 2 and Nairyah 2 plants in Saudi Arabia in March 2025 show how new fleets lock in that work. Repair grows fastest at 5.9% a year as owners refurbish blades and vanes instead of waiting for new castings, a shift EthosEnergy supported in February 2026 by acquiring design rights to service Frame 9FA.03 hot-gas-path and combustion parts.
Original makers lead while independents widen their reach
Based on provider type, the market is categorized into OEM, independent service providers and in-house teams. OEM providers led with 62.0% of 2025 value, because the makers bundle parts, software and outage crews into contracts signed with new units, as when GE Vernova took a 12-year maintenance contract after completing the replacement of JERA's Futtsu Group 4 with three 9HA.01 units in August 2023. Independent Service Providers grow fastest at 5.7% a year as F-class units age out of first contracts, and Sulzer has built aero-derivative capacity by acquiring Alba Power and Turbo Services for Rolls-Royce and Pratt & Whitney frames.
Heavy frames dominate value as smaller units multiply
Based on turbine type, the market is categorized into heavy-duty and aero-derivative units. Heavy-Duty turbines led with 78.0% of 2025 value because large frames in baseload combined-cycle plants carry the most expensive hot-section parts, and GE Vernova booked 55 heavy-duty units, 21 of them HA class, in the third quarter of 2026. Aero-Derivative units grow fastest at 6.0% a year as data centers and peaking plants buy fast-start machines, and the same quarter brought GE Vernova 57 aero-derivative orders that will need regular engine shop visits.
| Segment Group | Leading Sub-segment | Share, 2025 | Fastest-growing Sub-segment | CAGR, 2026–2035 |
|---|---|---|---|---|
| By Service Type | Maintenance | 46.0% | Repair | 5.9% |
| By Provider Type | OEM | 62.0% | Independent Service Providers | 5.7% |
| By Turbine Type | Heavy-Duty | 78.0% | Aero-Derivative | 6.0% |
Plant O&M costs show where turbine service money sits
Turbine service is priced through a fixed annual fee per kilowatt plus variable charges per megawatt-hour, fired hour or start, and the variable element carries most hot-section parts. Simple-cycle peakers carry a charge per start, so frequent cycling for data centers or renewables backup raises their bills faster than baseload use does. New-build prices also shape service demand, since EPRI found average turbine prices rose from about USD 2,000 to USD 3,000 per kW within six months. That jump makes overhaul and upgrade of existing units cheaper per added megawatt, which favors providers with parts on hand.
| Plant type | Typical price or fee | Basis |
|---|---|---|
| Combined cycle, 2x2x1 H-class | USD 12.12 per kW-year fixed, USD 3.41 per MWh variable | EIA AEO2025 capital cost study |
| Combined cycle, 1x1x1 H-class | USD 15.51 per kW-year fixed, USD 3.33 per MWh variable | EIA AEO2025 capital cost study |
| Simple cycle, aero-derivative | USD 9.56 per kW-year fixed, USD 5.70 per MWh variable | EIA AEO2025 capital cost study |
| Simple cycle, H-class frame | USD 6.87 per kW-year fixed, USD 1.24 per MWh plus USD 23,100 per start | EIA AEO2025 capital cost study |
Request a Free Sample
Fill in your details and we'll send you a free sample report.
- Sample data tables & charts
- Research methodology
Orders, lead times and capacity auctions lift service demand
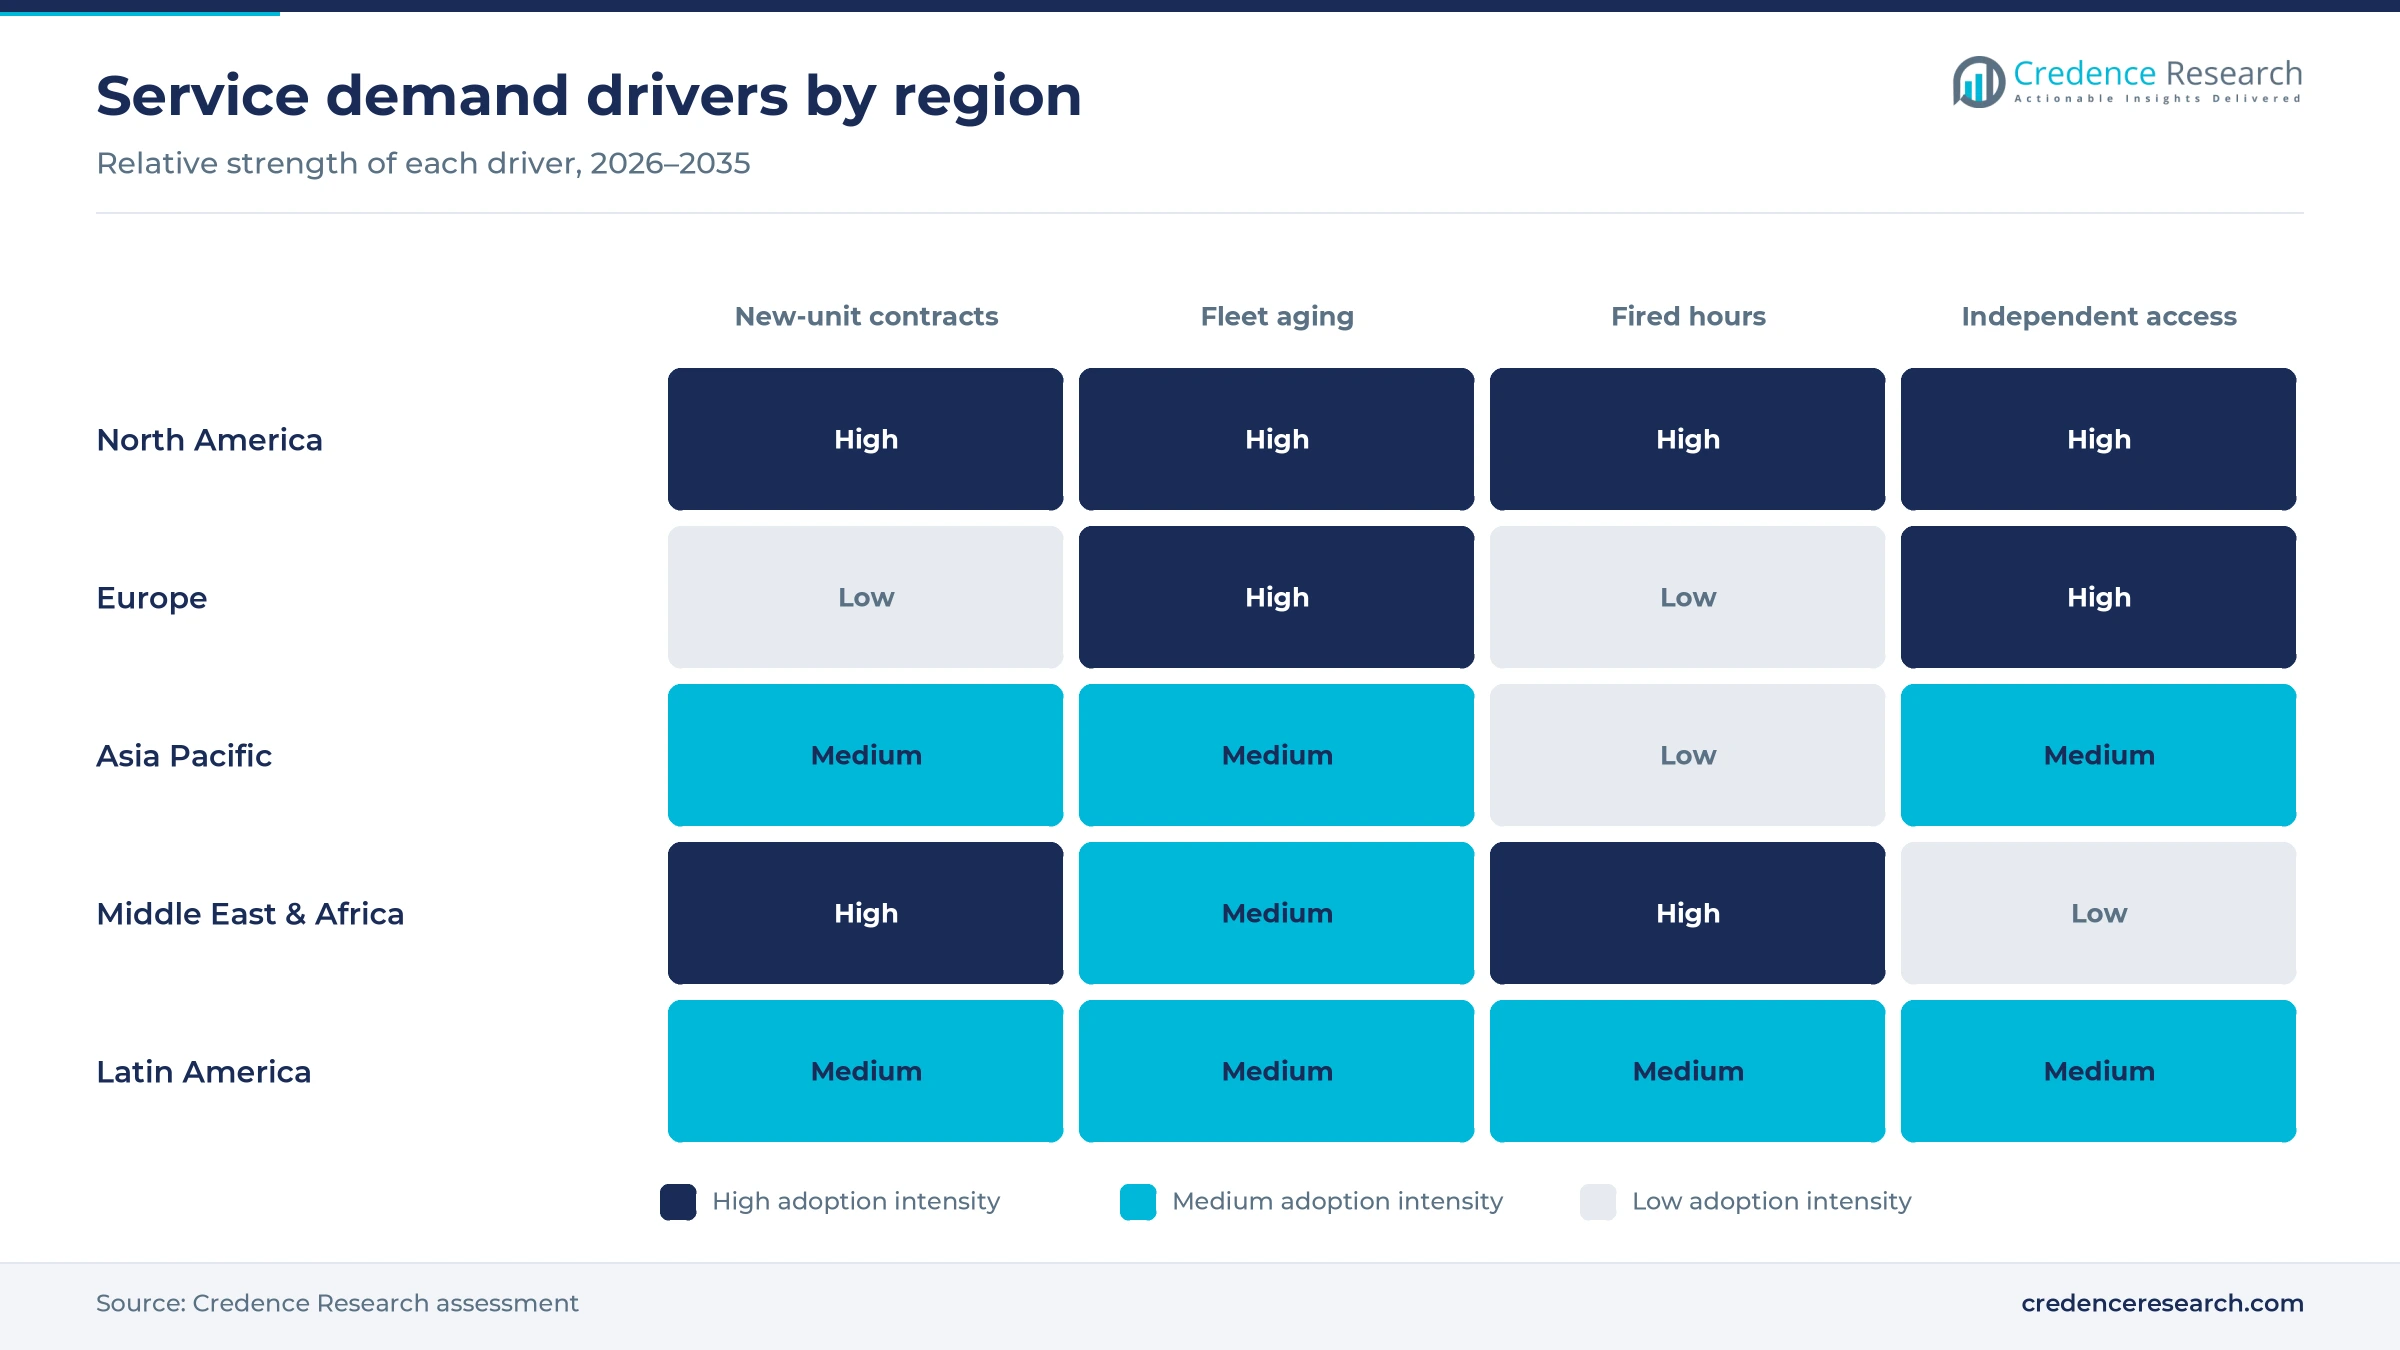
U.S. load growth keeps gas units running longer hours
Rising U.S. electricity use keeps gas turbines on line for more hours, and maintenance intervals are counted in fired hours and starts, so higher utilization brings inspections forward. Natural gas supplied about 40% of U.S. power sector generation in 2025, according to the U.S. Energy Information Administration, close to its 2024 peak. The pipeline is larger still, since Global Energy Monitor counts 252 GW of U.S. gas capacity in development, more than a third of it meant to supply data centers directly. Chevron, Engine No. 1 and GE Vernova announced on Jan. 28, 2025 a plan for seven 7HA turbines of up to 4 GW for co-located data centers, targeting first service by the end of 2027. Each such unit adds a multi-decade parts and outage stream for its service provider.
A record order wave builds the service base of the 2030s
Turbines ordered today become the service fleet of the next decade, because buyers sign parts and outage agreements at the time of purchase. EPRI counted 846 turbine orders totaling 100.3 GW worldwide in 2025, more than double the 2024 total. GE Vernova alone reported gas equipment backlog and slot reservations of 122 GW in the third quarter of 2026, of which 64 GW was firm backlog, with most of the increase coming from slot agreements converting into firm orders. Most of these units enter service between 2027 and 2031, so contract revenue builds gradually through the forecast period. The original makers gain most, since the first agreement on a new unit usually goes to them.
Five-year waits for new units favor life extension
Long delivery queues make life extension and replacement of hot sections the faster route to capacity for many owners. EPRI estimates that a large unit ordered in 2026 would on average not operate until 2031, while smaller machines take 18 to 36 months. Owners have responded with major upgrades, and Hanwha Power alone lists more than 350 gas turbine upgrade packages installed worldwide on its own and other makers' frames. EPRI and the National Energy Technology Laboratory are also studying uprates with potential double-digit output gains, according to POWER magazine. Each route turns capital that would buy new plants into upgrade and overhaul spending on existing fleets.
Capacity auctions keep existing gas plants under contract
Capacity auctions pay owners to keep units available, which protects maintenance budgets even where fired hours fall. Brazil's reserve capacity auction of March 18, 2026 contracted about 19 GW of firm capacity, with gas-fired plants dominating awards and many existing assets selected, according to the U.S. International Trade Administration. Germany agreed in principle with the European Commission on Jan. 15, 2026 to tender 12 GW of controllable capacity in 2026, of which 10 GW should operate by 2031. The IEA expects natural gas to meet half of Middle East and North Africa demand growth to 2035. Each mechanism secures outage and upgrade budgets for plants that might otherwise close.
Parts scarcity shifts work toward repair and small units
Scarce blades and forgings shift work toward repair
Service providers are shifting toward component repair and re-use to address shortages of new hot-section parts, creating openings for coating, welding and reverse-engineering shops across heavy-duty fleets. POWER magazine reported on Jan. 15, 2026 that rotor forgings and hot-section blades are the main bottlenecks, and that some large frames have shipped without rotors or blades to protect construction schedules. EthosEnergy sold its operations business to Brown & Root in July 2026 to focus on turbine repair and overhaul. Independents are also buying design data, as the Frame 9FA.03 service rights noted in the segment analysis show for one of the largest F-class fleets. Buyers gain shorter outages when a refurbished part replaces a new one on back order.
Smaller and aero-derivative units raise shop-visit demand
Data center developers and grid operators are shifting toward smaller, fast-start units to address short connection windows, creating more engine shop visits per megawatt than large frames. Units under 100 MW made up 70% of 2025 turbine sales by count, according to EPRI. Baker Hughes booked 76 NovaLT16 units of about 1.3 GW for Dynamis Power Solutions in the second quarter of 2026 for data center and oilfield distributed power generation. MTU Maintenance expects about 30% more aero-derivative shop visits at its Berlin-Brandenburg site, where an expansion is due to open in January 2027. Providers with LM-series and NovaLT engine shops gain the most from this mix.
Hydrogen-ready retrofits create an upgrade opening
Combustion retrofits for hydrogen blending are an opening for upgrade specialists, because new rules require fuel flexibility from plants that are already in service or about to be built. Germany's planned tenders require all new gas plants to be hydrogen-ready and to decarbonize by 2045 at the latest. Hanwha Power's PSM unit reached 60% hydrogen by volume at baseload on a refurbished Frame 7E at Daesan, South Korea, in July 2023 with its FlameSheet combustor. Germany also plans separate hydrogen-switch support tenders from 2027, targeting 2 GW by 2040 and another 2 GW by 2043, according to Clean Energy Wire. Owners that retrofit early keep their units eligible for capacity payments and lower-carbon contracts.
Outsourced operation of merchant plants opens new contracts
Merchant and data center plant owners without large engineering staffs are an opening for providers that bundle operation with turbine service. EthosEnergy signed a multi-year operations and maintenance agreement in July 2025 for Shell Energy North America's 596 MW Rhode Island State Energy Center. Brown & Root took over an operations business covering more than 200 facilities and over 50 GW in July 2026, giving it a base for remote monitoring and outage work. Doosan Enerbility supports its U.S. contracts for 12 gas turbines through its Houston service unit DTS. These buyers value single-point responsibility for availability more than the lowest parts price.
Cost inflation and falling fired hours squeeze contracts
Material and labor costs raise parts prices
Higher material costs squeeze fixed-price service agreements signed before 2024. Mitsubishi Heavy Industries' chief executive said on Aug. 29, 2025 that raw material, component and labor costs had raised manufacturing costs. Nickel superalloy and cobalt prices are also rising, according to POWER magazine. Providers locked into older escalation formulas absorb the gap, while owners renewing contracts in 2026 face higher parts rates. Smaller independent providers with thin parts inventories are most exposed, because they buy castings and coatings at spot prices.
Falling fired hours shrink usage-based revenue
Lower utilization cuts the fired hours that trigger paid inspections, which reduces revenue for usage-priced contracts. Gas supplied 21.8% of world electricity in 2025, down from 23.9% in 2020, according to Ember. India's gas fleet ran at an average 14.5% load factor in the year to March 2025, and about 5 GW became unusable after years idle, according to Central Electricity Authority data reported in May 2025. Providers with large Asian fleets face lower spare-part sales and longer gaps between paid outages.
Advanced-class designs limit independent access
Proprietary designs on the newest units keep independents out of much of the high-value work for a decade or more. Advanced H- and J-class machines were about 14% of units ordered in 2025 but more than half of the megawatts, according to EPRI. Independents need years of fleet data and reverse engineering before they can offer parts for such frames. Owners of new advanced units therefore have fewer competing quotes when their first agreements expire.
LNG price exposure weakens Asian fleet utilization
Imported fuel costs make gas units in Asia vulnerable to displacement by coal and renewables, which lowers maintenance demand. Vietnam's gas share of electricity fell from 30% in 2015 to 6% in 2025, according to Ember. Japan's gas share dropped to 33% in 2025 from a 43% peak in 2017. Providers serving importers face deferred outages whenever LNG prices rise sharply. Owners in these markets often stretch inspection intervals and defer upgrades until utilization recovers, which shifts spending into later years.
North America leads as Middle East fleets grow fastest
| Region | Value, 2025 (USD billion) | Share, 2025 | CAGR, 2026–2035 |
|---|---|---|---|
| North America | 4.56 | 35.0% | 5.3% |
| Asia Pacific | 3.45 | 26.5% | 5.4% |
| Europe | 2.74 | 21.0% | 3.9% |
| Middle East & Africa | 1.56 | 12.0% | 6.2% |
| Latin America | 0.72 | 5.5% | 5.7% |
North America leads on fleet size and data center load
North America held 35.0% of 2025 value and grows at 5.3% a year, supported by the largest installed fleet and new units for data centers. Texas alone has 80.6 GW of gas capacity in development, including about 40 GW planned to supply data centers directly, according to Global Energy Monitor. MTU Maintenance planned to occupy a Houston field-service facility in summer 2026, adding local aero-derivative capacity. Original makers, independents and in-house utility crews all compete in this region.
Asia Pacific balances new Chinese units with older fleets
Asia Pacific held 26.5% of 2025 value and grows at 5.4% a year. China installed a record 22.4 GW of gas capacity in 2025 and has 30.9 GW under construction, according to Global Energy Monitor, which adds new service contracts. JERA has started an environmental assessment to replace 3.6 GW of 1970s steam units at Sodegaura with 2.6 GW of combined-cycle units from fiscal 2032. Weak utilization in India and Vietnam keeps growth below the region's capacity additions.
Europe services an older fleet with fewer fired hours
Europe held 21.0% of 2025 value and grows at 3.9% a year, the slowest rate, because gas generation has declined for years. Ember counts 1,212 TWh of European gas generation in 2025 against a 1,443 TWh peak in 2010. Spending shifts toward upgrades that keep units eligible for capacity payments, and the Thisvi plant in Greece contracted Ansaldo Energia in February 2026 for an AE94.3A upgrade. Independent repair shops compete strongly on older E- and F-class frames.
Middle East & Africa grows fastest on new combined cycles
Middle East & Africa held 12.0% of 2025 value and grows fastest at 6.2% a year. Natural gas and oil supply more than 90% of electricity in the Middle East and North Africa, and regional demand is projected to rise about 50% by 2035, according to the IEA. Siemens Energy's Misfah and Duqm plants will add nearly 20% to Oman's national capacity. Heat, dust and high load factors shorten inspection intervals across the Gulf fleet, where each new combined-cycle power plant typically signs a multi-decade service agreement.
Latin America grows on Brazilian thermal contracts
Latin America held 5.5% of 2025 value and grows at 5.7% a year. Gas supplied 24.3% of the region's electricity in 2025, according to Ember. Petrobras operates roughly 40 LM6000 units in Brazil, a fleet that supports repeat aero-derivative overhaul contracts. New gas projects contracted in Brazil enter service between 2028 and 2031, so most of the added service value arrives late in the forecast period.
Factories, shop capacity and multi-decade contracts expand
| Development | Status and market relevance |
|---|---|
| In October 2026, Doosan Enerbility shipped its first 380 MW DGT6-300H S2 gas turbine to the United States from its Changwon plant, part of supply contracts for 12 units with U.S. customers. | Completed shipment; it gives a new maker a U.S. fleet to service and widens owner choice beyond the three established makers. |
| In October 2026, Mitsubishi Power announced a USD 490 million expansion of its Savannah Machinery Works gas turbine plant in Georgia, roughly doubling floor space to about 880,000 square feet. | Announced plan with no completion date; added U.S. output enlarges the future fleet under Mitsubishi service agreements. |
| In July 2026, MTU Maintenance signed a five-year exclusive contract with Petrobras for maintenance, repair and overhaul of 10 LM6000 engines and three hot sections. | Signed contract; it shows independents winning aero-derivative fleets with combined shop and in-country field service. |
| In June 2026, Siemens Energy won orders for six F-class gas turbines for the 2.6 GW Misfah and Duqm combined-cycle plants in Oman, with 20-year long-term service agreements. | Order with service agreements; it locks two decades of parts and outage work to the original maker. |
| In February 2026, Enerwave contracted Ansaldo Energia for an AE94.3A upgrade at the Thisvi plant in Greece and renewed its long-term service agreement for 14 years. | Contracted, installation planned for March 2027; upgrades bundled with renewals help makers keep aging fleets. |
Combustor retrofits and uprates extend fleet value
- Combustor retrofits replace burners and liners so older frames can cut emissions, widen fuel range and run hydrogen blends.
- Hot-section uprates add improved blades, vanes and cooling to raise output and efficiency without a new turbine order.
- Remote monitoring tracks vibration, temperatures and combustion dynamics so outages can be planned from actual condition, which links turbine service to predictive maintenance software.
- Component repair restores coatings and blade tips through welding and recoating, shortening outages when new castings are on back order.
Need a Custom Version of This Report?
Tailor the scope, geography, or segments to your exact requirements.
- Custom geography or segment scope
- Direct access to our analyst team
Original makers hold the fleet while independents gain IP
Competition turns on access to installed fleets, parts supply and outage speed. GE Vernova, Siemens Energy and Mitsubishi Power sell most new heavy-duty units and attach long-term agreements that cover parts, inspections and monitoring for 12 to 25 years. Ansaldo Energia defends its own fleet and older Alstom-design frames through upgrades and contract renewals. Doosan Enerbility has entered the U.S. with new 380 MW units, which gives owners another maker for future service tenders. Baker Hughes, Solar Turbines and Everllence serve smaller industrial and aero-derivative fleets. Independent providers such as EthosEnergy, Hanwha Power, Sulzer and MTU Maintenance win business when agreements expire, offering repaired parts, combustor upgrades and faster shop turnaround. Owners of large mixed fleets often split work, keeping the original maker for advanced units and tendering older frames to independents.
Three makers control the fleet, independents work the gaps
Supply is concentrated, since GE Vernova, Siemens Energy and Mitsubishi hold more than 75% of projects with a named maker, according to Global Energy Monitor. These makers sell the first long-term agreement with each unit and earn the highest margins on proprietary hot-section parts. Independent providers such as EthosEnergy, Sulzer, Hanwha Power and MTU Maintenance enter once units leave their first agreement, competing on repaired parts, reverse-engineered components and outage speed. Barriers are design data, coating qualification and the capital tied up in rotable parts pools, which keeps the number of credible heavy-duty independents small.
Twelve providers that owners shortlist for turbine service
| Company | Type | Role in the market |
|---|---|---|
| GE Vernova | Original maker | Heavy-duty and aero-derivative service agreements, parts, upgrades and monitoring |
| Siemens Energy | Original maker | Long-term service agreements, hot-section parts and modernization for SGT fleets |
| Mitsubishi Power (Mitsubishi Heavy Industries) | Original maker | J-series and F-series service contracts, parts and remote monitoring |
| Ansaldo Energia | Original maker | AE-series and GT26/GT36 upgrades, parts and long-term service agreements |
| Baker Hughes | Original maker | NovaLT and Frame 5 service, parts and package support for power users |
| Solar Turbines (Caterpillar) | Original maker | Overhaul, exchange engines and field service for industrial turbines |
| Doosan Enerbility | Original maker | Service for DGT6 heavy-duty units through its Houston unit DTS |
| Hanwha Power (Hanwha Group) | Independent specialist | PSM combustor upgrades, aftermarket hot-section parts and hydrogen retrofits |
| EthosEnergy | Independent specialist | Repair and overhaul of heavy-duty and aero-derivative turbines and rotating equipment |
| MTU Maintenance (MTU Aero Engines) | Independent specialist | LM2500 and LM6000 shop overhaul and field service |
| Sulzer Ltd. | Independent specialist | Repair centers for heavy-duty and aero-derivative turbines and components |
| Everllence (formerly MAN Energy Solutions) | Original maker | Service and spare parts for MGT industrial gas turbines |
Service value moves to life extension and new fleets
Credence Research's view is that service value is moving from routine inspections on mature fleets toward life extension, uprates and the first agreements on units ordered in 2025 and 2026. The original makers will capture most of that first wave, because they control parts for advanced-class machines. Independents gain where units leave their first contracts and where repaired parts beat long waits for new castings. Owners should expect higher parts rates at renewal and should weigh upgrade offers against the cost and wait for new capacity.
Gas-fired output and plant O&M costs anchor the estimate
The report uses 2025 as the base year and 2026 to 2035 as the forecast period. Market values come from the Credence Research model, checked against gas-fired generation statistics and plant operation and maintenance cost data from public agencies. Regional, service, provider and turbine splits are Credence Research estimates built from fleet size, generation data and company disclosures. Sources include government statistics, company filings and releases, and trade press. The estimates do not rely on interviews or surveys of any kind.
New units and older F-class fleets carry growth to 2035
Service spending rises from USD 13.71 billion in 2026 to USD 21.64 billion by 2035, with growth weighted to the second half as new units leave warranty and enter paid inspections. North America and the Gulf add the most new contracts, while Europe and parts of Asia spend more on upgrades than on hours-based maintenance. The balance between makers and independents depends on how quickly independents gain design data for the newest frames. Hydrogen and uprate retrofits offer the clearest upside if capacity auctions reward them.
New units and fired hours decide the range of outcomes
The base case assumes most 2025 and 2026 orders enter service between 2027 and 2031 and that fired hours stay near current levels in North America and the Gulf. The downside follows if data center projects slip and Asian utilization keeps falling, which would delay new contracts and cut usage-based revenue. The upside requires faster factory expansion and widespread uprates of existing fleets, both of which raise parts and outage volumes.
| Scenario | CAGR, 2026–2035 | Value, 2035 | What has to hold |
|---|---|---|---|
| Downside | 3.7% | USD 19.01 billion | Data center demand slips, LNG prices stay high and Asian gas units run fewer hours |
| Base | 5.20% | USD 21.64 billion | Most units ordered in 2025 and 2026 enter service on schedule between 2027 and 2031 |
| Upside | 6.4% | USD 23.96 billion | Factories expand faster and owners uprate or upgrade a large share of existing F-class units |
Frequently Asked Questions
How big is the gas turbine MRO market?
Which region leads gas turbine maintenance, repair and overhaul spending?
Which service type holds the largest share?
How are power plant turbine service contracts priced?
Why do turbine order backlogs matter for service providers?
Who are the main companies in this market?
What limits growth in gas turbine MRO spending?
Which turbine type grows fastest?
Table of Content
Chapter 1 Market Segmentation
- 1.1 Segmentation Framework
- 1.1.1 Product and Service Classification
- 1.1.2 Application and End-Use Classification
- 1.1.3 Technology and Solution Classification
- 1.1.4 Customer and Distribution Channel Classification
- 1.1.5 Geographic Segmentation
- 1.1.6 Market Segment Definitions and Boundaries
- 1.2 By Service Type
- 1.2.1 Maintenance
- 1.2.2 Overhaul
- 1.2.3 Repair
- 1.3 By Provider Type
- 1.3.1 OEM
- 1.3.2 Independent Service Providers
- 1.3.3 In-house
- 1.4 By Turbine Type
- 1.4.1 Heavy-Duty
- 1.4.2 Aero-Derivative
Chapter 2 Introduction
- 2.1 Report Objectives and Scope
- 2.2 Product Definition and Industry Terminology
- 2.3 Market Inclusions and Exclusions
- 2.4 Research Process
- 2.4.1 Primary Research and Expert Interviews
- 2.4.2 Secondary Research and Source Review
- 2.4.3 Top-Down and Bottom-Up Estimation
- 2.4.4 Data Triangulation and Verification
- 2.5 Market Size Measurement Basis
- 2.5.1 2025: USD 13.03 billion → 2035: USD 21.64 billion
- 2.6 Historical and Forecast Reference Periods
- 2.6.1 Historical Period: 2018-2025
- 2.6.2 Base Year: 2025
- 2.6.3 Forecast Period: 2025-2035
- 2.7 Research Assumptions and Limitations
Chapter 3 Executive Summary
- 3.1 Market Snapshot and Key Findings
- 3.2 Base-Year Market Size, 2025
- 3.3 Forecast Market Size, 2035
- 3.4 Revenue and Volume Growth Outlook
- 3.5 Key Demand and Supply Indicators
- 3.6 Leading Market Segments
- 3.7 Fastest-Growing Market Opportunities
- 3.8 Regional Performance Highlights
- 3.9 Technology and Industry Transformation
- 3.10 Competitive Landscape Summary
- 3.11 Analyst View and Strategic Implications
Chapter 4 Global Gas Turbine MRO Market Trends and Developments
- 4.1 Historical Industry Development, 2018-2025
- 4.2 Recent Market Trends and Developments
- 4.3 Demand and Customer Behavior Trends
- 4.4 Technology and Product Innovation
- 4.5 Artificial Intelligence, Automation and Digitalization
- 4.6 Local Manufacturing and Supply Chain Realignment
- 4.7 Industry Partnerships, Mergers and Acquisitions
- 4.8 Sustainability and Circular Economy Developments
- 4.9 Government and Private Sector Investment Trends
- 4.10 Emerging Business Models and Commercialization
- 4.11 Industry Developments and Announcements
Chapter 5 Global Gas Turbine MRO Market Production, Supply and Demand Analysis
- 5.1 Demand Trend and Consumption Analysis, 2018-2025
- 5.2 Demand Forecast, 2025-2035
- 5.3 Production and Output Trend, 2018-2025
- 5.4 Production and Output Forecast, 2025-2035
- 5.5 Installed Capacity and Capacity Utilization
- 5.6 Company-Wise Production Plants and Statistics
- 5.6.1 Installed Production Capacity
- 5.6.2 Actual Production
- 5.6.3 Planned Capacity and Expansion Targets
- 5.7 Supply Chain Structure and Procurement Trends
- 5.8 Supply-Demand Gap and Bottlenecks
- 5.9 Import Dependence and Sourcing Structure
- 5.10 Contract Manufacturing and Outsourcing
- 5.11 Regional Supply and Demand Concentration
Chapter 6 Global Gas Turbine MRO Market Pricing Analysis
- 6.1 Pricing Structure and Measurement
- 6.2 Historical Pricing Trends, 2018-2025
- 6.3 Pricing Outlook, 2025-2035
- 6.4 Average Selling Price and Unit Economics
- 6.5 Pricing by Product and Market Segment
- 6.6 Geographic Pricing Differences
- 6.7 Key Input, Energy, Labor and Logistics Costs
- 6.8 Contract Pricing and Purchasing Models
- 6.9 Pricing Sensitivity and Competitive Positioning
- 6.10 Price, Margin and Profitability Implications
Chapter 7 Global Gas Turbine MRO Market Dynamics
- 7.1 Market Growth Drivers
- 7.1.1 Demand-Side Drivers
- 7.1.2 Technology and Innovation Drivers
- 7.1.3 Infrastructure and Investment Drivers
- 7.1.4 Regulatory and Policy Drivers
- 7.2 Market Restraints
- 7.2.1 Cost and Affordability Constraints
- 7.2.2 Technology and Adoption Barriers
- 7.2.3 Supply Chain and Operational Constraints
- 7.3 Market Challenges
- 7.3.1 Competitive Pressure and Margin Erosion
- 7.3.2 Skills, Infrastructure and Implementation Gaps
- 7.4 Emerging Market Opportunities
- 7.5 Market Dynamics Impact and Time-Horizon Assessment
Chapter 8 Global Gas Turbine MRO Value Chain Analysis
- 8.1 Industry Value Chain Overview
- 8.2 Upstream Suppliers and Critical Inputs
- 8.3 Technology and Component Providers
- 8.4 Manufacturing or Service Delivery
- 8.5 Distribution, Channel Partners and Integrators
- 8.6 Downstream Applications and End Users
- 8.7 Value Addition and Profit Pools
- 8.8 Vertical Integration and Outsourcing
- 8.9 Supplier Concentration and Risk
- 8.10 Supply Chain Localization and Resilience
Chapter 9 Global Gas Turbine MRO Market Regulations and Policies
- 9.1 Relevant Laws, Standards and Compliance Frameworks
- 9.2 Product, Service, Safety and Quality Requirements
- 9.3 Government Policies, Incentives and Subsidies
- 9.4 Imports, Exports and Trade Barriers
- 9.5 Public Procurement and Local Content Requirements
- 9.6 Environmental and Sustainability Compliance
- 9.7 Upcoming Policy Changes and Market Implications
Chapter 10 Global Gas Turbine MRO Market Hotspots and Opportunities
- 10.1 Market Opportunity Mapping and Growth Hotspots
- 10.2 High-Growth Applications and Customer Groups
- 10.3 Underserved Markets and White-Space Opportunities
- 10.4 Emerging Technology and Product Opportunities
- 10.5 New Capacity and Investment Hotspots
- 10.6 Market Entry and Expansion Opportunities
- 10.7 Distribution and Partnership Opportunities
- 10.8 Near-Term and Long-Term Commercial Potential
- 10.9 Opportunity Attractiveness and Execution Risks
Chapter 11 Global Gas Turbine MRO Market Outlook, 2025-2035
- 11.1 Market Size and Analysis
- 11.1.1 Revenue (Market Measurement: 2025: USD 13.03 billion → 2035: USD 21.64 billion)
- 11.1.2 Market Volume and Quantity Sold
- 11.1.3 Historical Market Size, 2018-2025
- 11.1.4 Base-Year Market Size, 2025
- 11.2 Market Forecast, 2025-2035
- 11.2.1 Revenue Forecast to 2035
- 11.2.2 Volume Forecast to 2035
- 11.2.3 CAGR and Year-on-Year Growth
- 11.2.4 Incremental Revenue Opportunity
- 11.3 Forecast Assumptions and Scenario Analysis
- 11.3.1 Base-Case Forecast
- 11.3.2 Optimistic and Conservative Scenarios
- 11.3.3 Technology, Pricing and Policy Sensitivities
- 11.4 Market Attractiveness and Growth Outlook
Chapter 12 Global Gas Turbine MRO Market Segmentation and Outlook
- 12.1 Segmentation Summary and Market Shares, 2025
- 12.2 Largest and Fastest-Growing Segments
- 12.3 By Service Type - Market Size and Forecast, 2025-2035
- 12.3.1 Segment Definition and Scope
- 12.3.2 Historical Market Size, 2018-2025
- 12.3.3 Revenue Forecast, 2025-2035
- 12.3.4 Volume Forecast, 2025-2035
- 12.3.5 Base-Year Market Share, 2025
- 12.3.6 Segment CAGR and Growth Drivers
- 12.3.7 Subsegment Market Size and Forecast
- 12.3.7.1 Maintenance
- 12.3.7.2 Overhaul
- 12.3.7.3 Repair
- 12.3.8 Subsegment Pricing and Adoption Trends
- 12.3.9 Leading Suppliers and Competition
- 12.3.10 Regional Demand and Opportunities
- 12.4 By Provider Type - Market Size and Forecast, 2025-2035
- 12.4.1 Segment Definition and Scope
- 12.4.2 Historical Market Size, 2018-2025
- 12.4.3 Revenue Forecast, 2025-2035
- 12.4.4 Volume Forecast, 2025-2035
- 12.4.5 Base-Year Market Share, 2025
- 12.4.6 Segment CAGR and Growth Drivers
- 12.4.7 Subsegment Market Size and Forecast
- 12.4.7.1 OEM
- 12.4.7.2 Independent Service Providers
- 12.4.7.3 In-house
- 12.4.8 Subsegment Pricing and Adoption Trends
- 12.4.9 Leading Suppliers and Competition
- 12.4.10 Regional Demand and Opportunities
- 12.5 By Turbine Type - Market Size and Forecast, 2025-2035
- 12.5.1 Segment Definition and Scope
- 12.5.2 Historical Market Size, 2018-2025
- 12.5.3 Revenue Forecast, 2025-2035
- 12.5.4 Volume Forecast, 2025-2035
- 12.5.5 Base-Year Market Share, 2025
- 12.5.6 Segment CAGR and Growth Drivers
- 12.5.7 Subsegment Market Size and Forecast
- 12.5.7.1 Heavy-Duty
- 12.5.7.2 Aero-Derivative
- 12.5.8 Subsegment Pricing and Adoption Trends
- 12.5.9 Leading Suppliers and Competition
- 12.5.10 Regional Demand and Opportunities
- 12.6 Segment Growth Comparison
- 12.7 Segment Attractiveness and Priority Matrix
Chapter 13 Global Gas Turbine MRO Geographic Market Outlook, 2025-2035
- 13.1 Regional Market Size and Share, 2025
- 13.2 Regional Market Forecast, 2025-2035
- 13.3 Regional Pricing, Production and Demand Differences
- 13.4 North America
- 13.4.1 United States
- 13.4.2 Canada
- 13.4.3 Mexico
- 13.5 Europe
- 13.5.1 Germany
- 13.5.2 France
- 13.5.3 Italy
- 13.5.4 United Kingdom
- 13.5.5 Spain
- 13.5.6 Poland
- 13.5.7 Russia
- 13.5.8 Netherlands
- 13.5.9 Belgium
- 13.5.10 Sweden
- 13.5.11 Denmark
- 13.5.12 Norway
- 13.5.13 Rest of Europe
- 13.6 Asia Pacific
- 13.6.1 China
- 13.6.2 India
- 13.6.3 Japan
- 13.6.4 South Korea
- 13.6.5 Thailand
- 13.6.6 Indonesia
- 13.6.7 Vietnam
- 13.6.8 Malaysia
- 13.6.9 Australia
- 13.6.10 Rest of Asia Pacific
- 13.7 Latin America
- 13.7.1 Brazil
- 13.7.2 Argentina
- 13.7.3 Colombia
- 13.7.4 Chile
- 13.7.5 Rest of Latin America
- 13.8 Middle East
- 13.8.1 Saudi Arabia
- 13.8.2 United Arab Emirates
- 13.8.3 Turkey
- 13.8.4 Israel
- 13.8.5 Iran
- 13.8.6 Rest of the Middle East
- 13.9 Africa
- 13.9.1 South Africa
- 13.9.2 Egypt
- 13.9.3 Nigeria
- 13.9.4 Morocco
- 13.9.5 Rest of Africa
- 13.10 Regional Investment, Policy and Supply Chain Differences
- 13.11 Regional Competitive Landscape
- 13.12 Geographic Growth Hotspots
Chapter 14 Global Gas Turbine MRO Technology, Innovation and Sustainability Outlook
- 14.1 Technology Landscape and Maturity
- 14.2 Product, Process and Service Innovation
- 14.3 AI, Automation and Digital Tools in the Industry
- 14.4 Technology Adoption and Performance Benchmarking
- 14.5 Innovation Pipeline and R&D Investment
- 14.6 Patent and Intellectual Property Trends
- 14.7 Energy Efficiency and Resource Management
- 14.8 Sustainability, Recycling and Circularity
- 14.9 Technology Roadmap, 2025-2035
- 14.10 Risks of Obsolescence and Technology Substitution
Chapter 15 Global Gas Turbine MRO Market Key Strategic Imperatives
- 15.1 Growth and Market Entry Priorities
- 15.2 High-Return Products and Segments
- 15.3 Pricing, Profitability and Cost Optimization
- 15.4 Technology Investment and Product Differentiation
- 15.5 Supply Chain Localization and Resilience
- 15.6 Distribution and Customer Acquisition
- 15.7 Partnership, Acquisition and Capacity Strategy
- 15.8 Regional Expansion Priorities
- 15.9 Short-, Medium- and Long-Term Actions
Chapter 16 Competition Outlook
- 16.1 Industry Competition Characteristics
- 16.2 Market Structure and Concentration
- 16.3 Market Share and Competitive Positioning, 2025
- 16.4 Company-Wise Revenue and Product Benchmarking
- 16.5 Production and Service Capacity Benchmarking
- 16.6 Technology, Pricing and Differentiation
- 16.7 Regional Footprint and Distribution Strength
- 16.8 Mergers, Acquisitions and Strategic Alliances
- 16.9 New Entrants and Competitive Threats
- 16.10 Porter's Five Forces and Industry Attractiveness
- 16.11 Competitive Outlook, 2025-2035
Chapter 17 Company Profiles
- 17.1 Company Coverage and Selection Criteria
- 17.2 GE Vernova
- 17.2.1 Business Description
- 17.2.2 Company Ownership and Geographic Presence
- 17.2.3 Product and Service Portfolio
- 17.2.4 Manufacturing and Operating Footprint
- 17.2.5 Production Capacity and Expansion Plans
- 17.2.6 Financial Performance and Investment
- 17.2.7 Market Share and Competitive Position
- 17.2.8 Technology and Innovation Capabilities
- 17.2.9 Strategic Alliances or Partnerships
- 17.2.10 Recent Developments
- 17.2.11 Growth Strategy and Outlook
- 17.3 Siemens Energy
- 17.4 Mitsubishi Power (Mitsubishi Heavy Industries)
- 17.5 Ansaldo Energia
- 17.6 Baker Hughes
- 17.7 Solar Turbines (Caterpillar)
- 17.8 Doosan Enerbility
- 17.9 Hanwha Power (Hanwha Group)
- 17.10 EthosEnergy
- 17.11 MTU Maintenance (MTU Aero Engines)
- 17.12 Sulzer Ltd.
- 17.13 Everllence (formerly MAN Energy Solutions)
- 17.14 Other Relevant Market Participants
Note: Every listed company is profiled on the structure shown under the first company. The company list is preliminary and may change based on research findings, market developments, data availability and client requirements.
Chapter 18 Disclaimer
- 18.1 Research and Forecast Disclaimer
- 18.2 Data Source and Estimation Limitations
Note: The depth of individual sections depends on data availability for this market. Volume, capacity, trade and other unit-based metrics are included where applicable.