
Aging sites and faster refreshes fill retirement pipelines
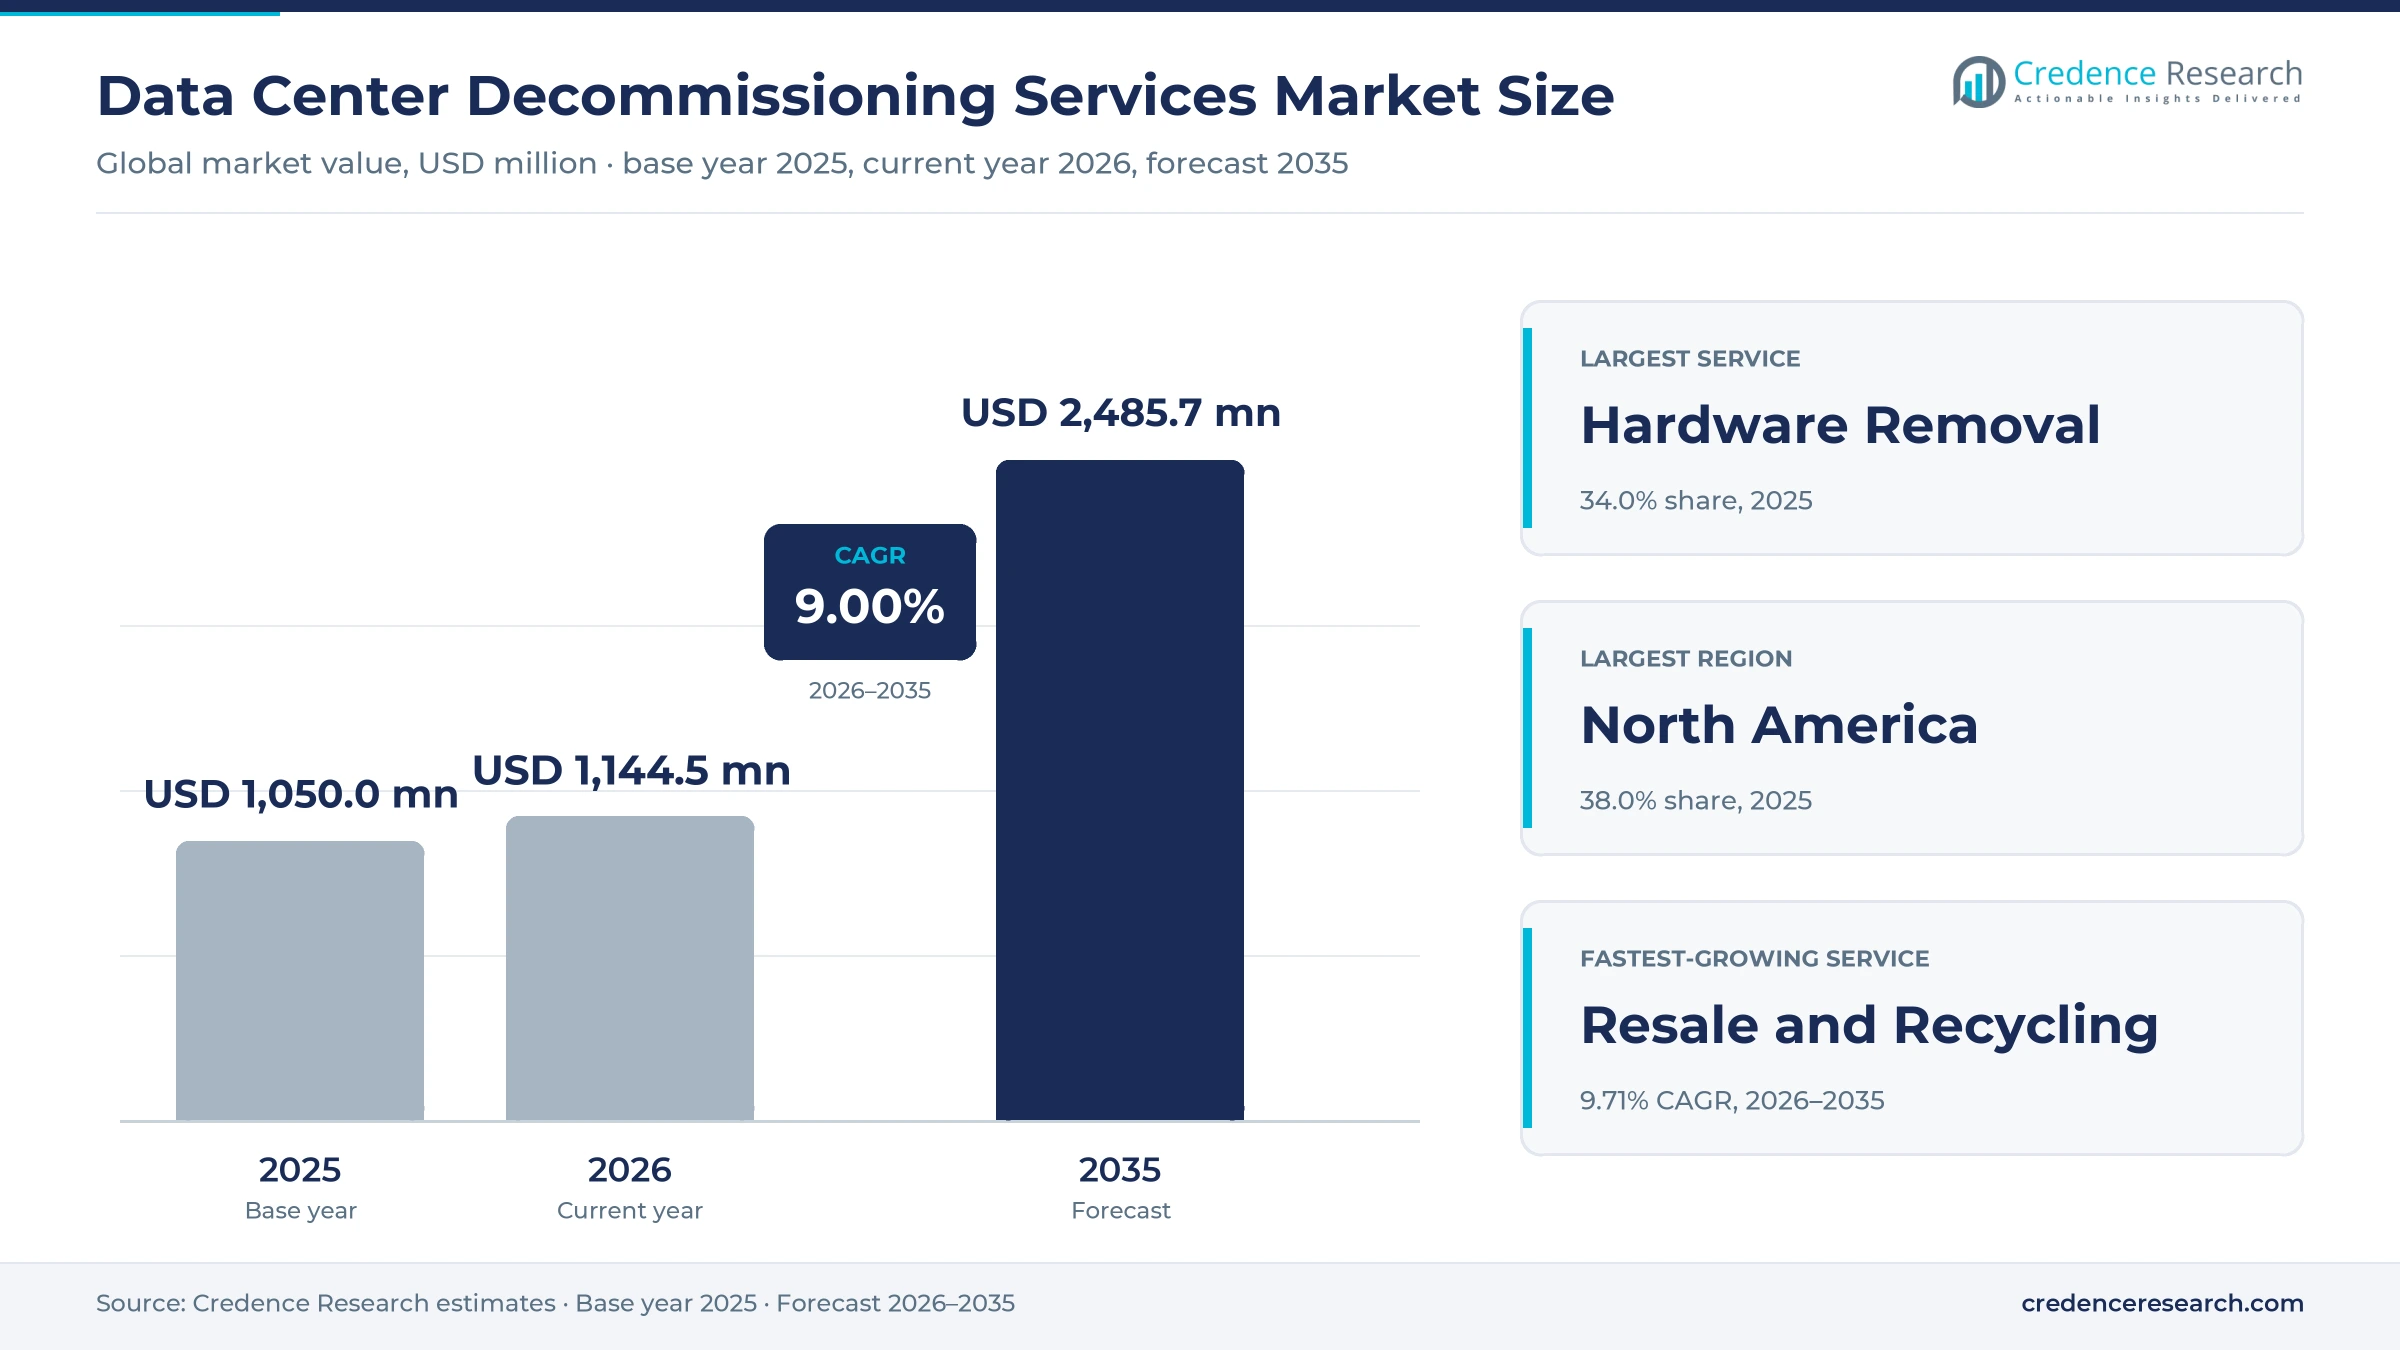
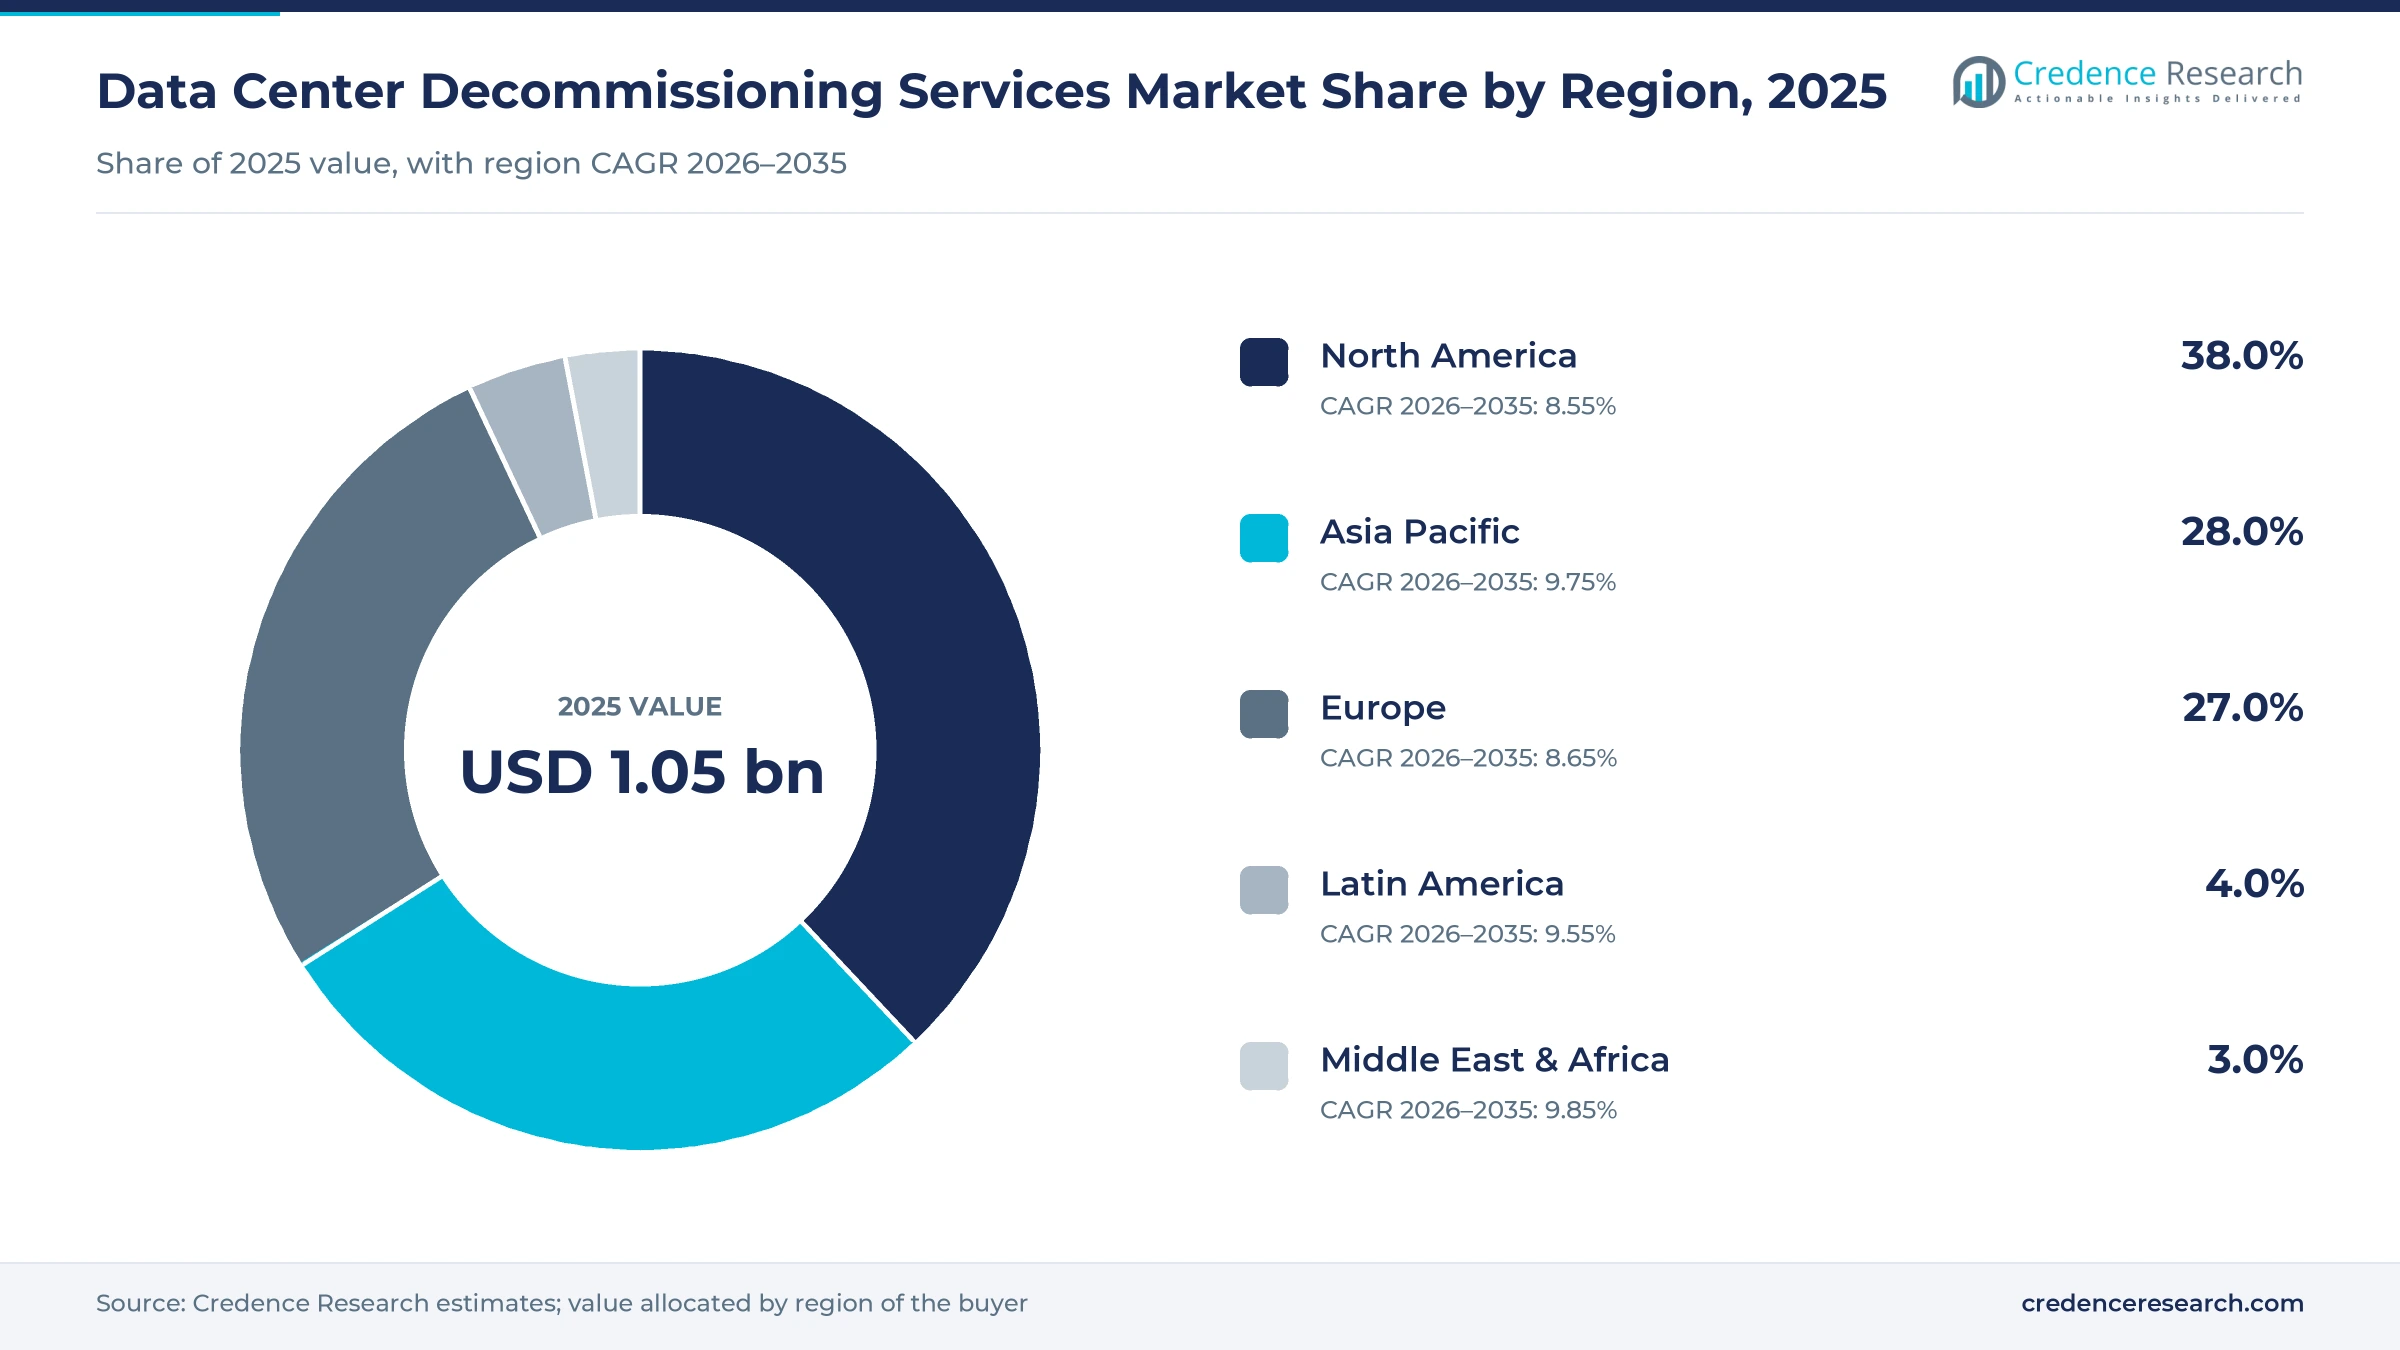
The global data center decommissioning services market was valued at USD 1.05 billion in 2025 and is projected to increase from USD 1.14 billion in 2026 to USD 2.49 billion by 2035, registering a CAGR of 9.00% during 2026–2035. Spending comes from hyperscale operators, colocation companies and enterprises that pay specialists to de-install servers, storage and network gear, erase or destroy data, resell or recycle recovered equipment and return empty halls to landlords. North America held the largest regional share, 38.0% in 2025, because the region has the largest installed base and the tightest disposal audits. Middle East & Africa is the fastest-growing region at 9.85% a year as new campuses in the Gulf start their first refresh cycles. Accelerator servers now retire faster than general compute, which shortens the gap between projects. The National Institute of Standards and Technology also replaced its 2014 media sanitization guide in September 2025, so many buyers are rewriting disposal contracts.
Which retirement tasks and fees does this market count?
The data center decommissioning services market covers paid work that takes IT equipment and supporting plant out of service. This includes de-racking and removal of servers, storage arrays and switches, on-site or off-site data erasure and shredding, chain-of-custody logistics, remarketing and certified recycling, and restoration of the vacated space. Clients pay per asset, per project or under multi-year retirement agreements.
The scope excludes the resale value of recovered equipment when it is returned to the client, new hardware deployment, construction of replacement facilities and the disposal of office laptops and phones. Value is counted at the service provider level, including labor, transport, erasure software, destruction equipment and reporting fees.
Data Center Decommissioning Services Market Insights
- The market is valued at USD 1.05 billion in 2025 and is projected to reach USD 2.49 billion by 2035, growing at a 9.00% CAGR as aging sites and AI clusters retire.
- North America led with 38.0% of 2025 value, while Middle East & Africa grows fastest at 9.85% a year as Gulf campuses reach their first refresh.
- Hardware Removal held 34.0% of 2025 value, and Resale and Recycling is the fastest-growing service at 9.71% a year to 2035.
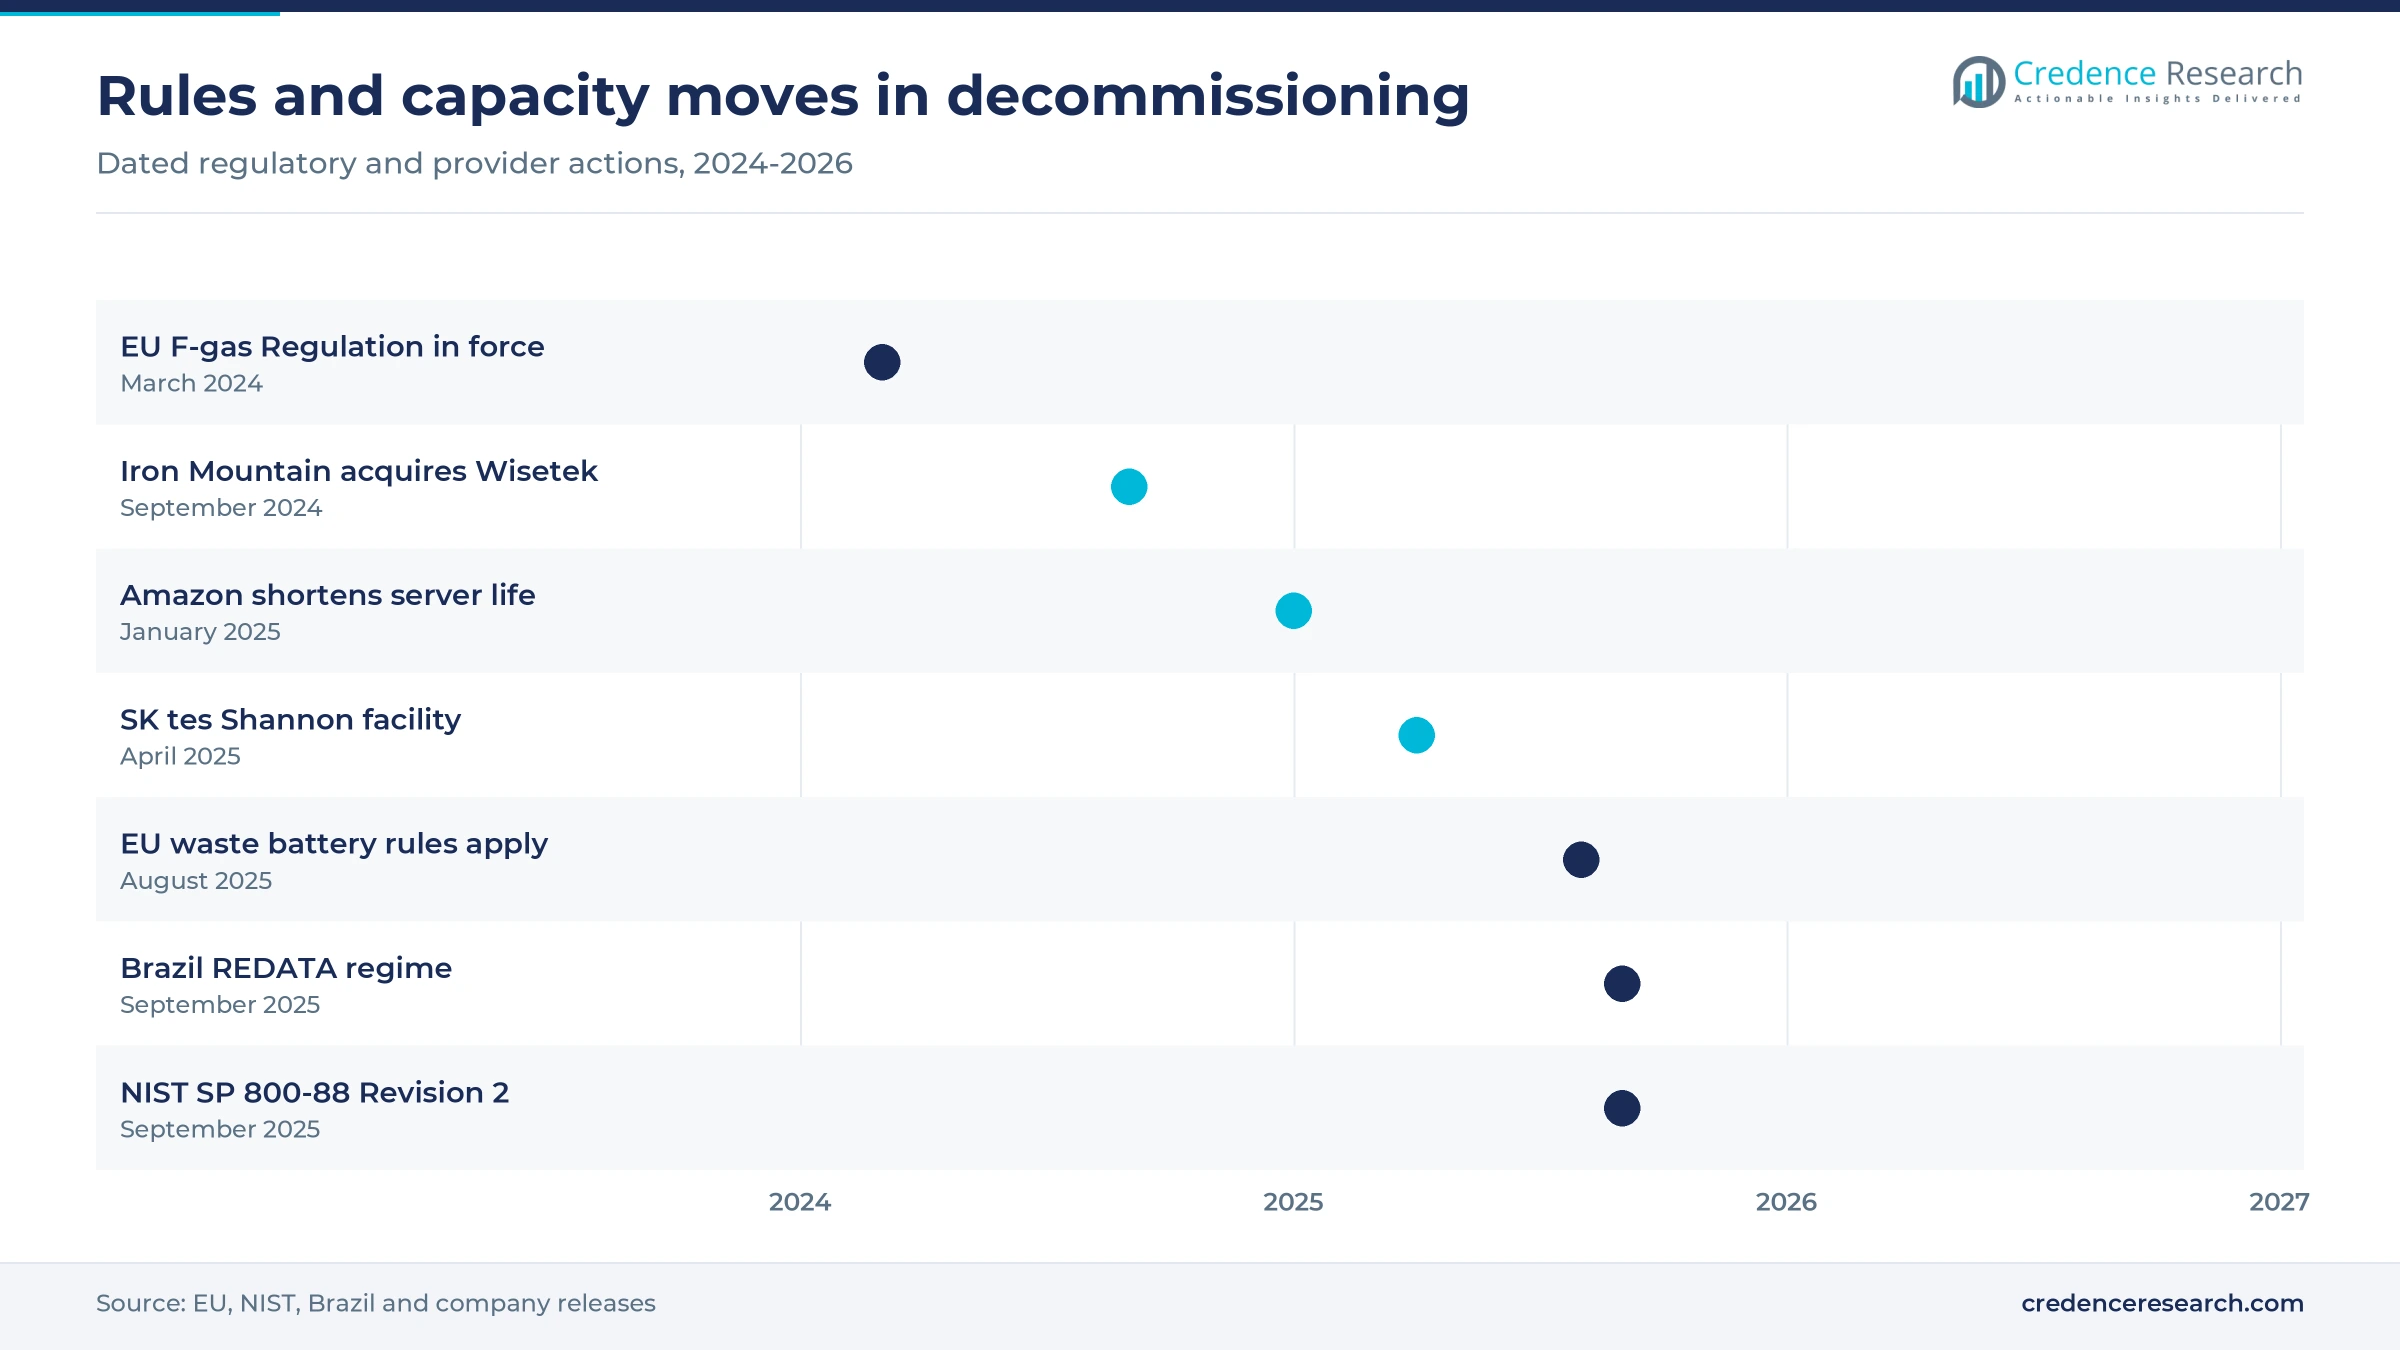
- NIST published SP 800-88 Revision 2 on Sept. 26, 2025, replacing the 2014 media sanitization guide that most disposal contracts reference.
- Iron Mountain acquired Wisetek of Cork, Ireland, in September 2024, adding about 400 staff and sites in Europe, the United States and Thailand.
Hardware removal leads while resale and recycling grow
Why does hardware removal hold the largest share?
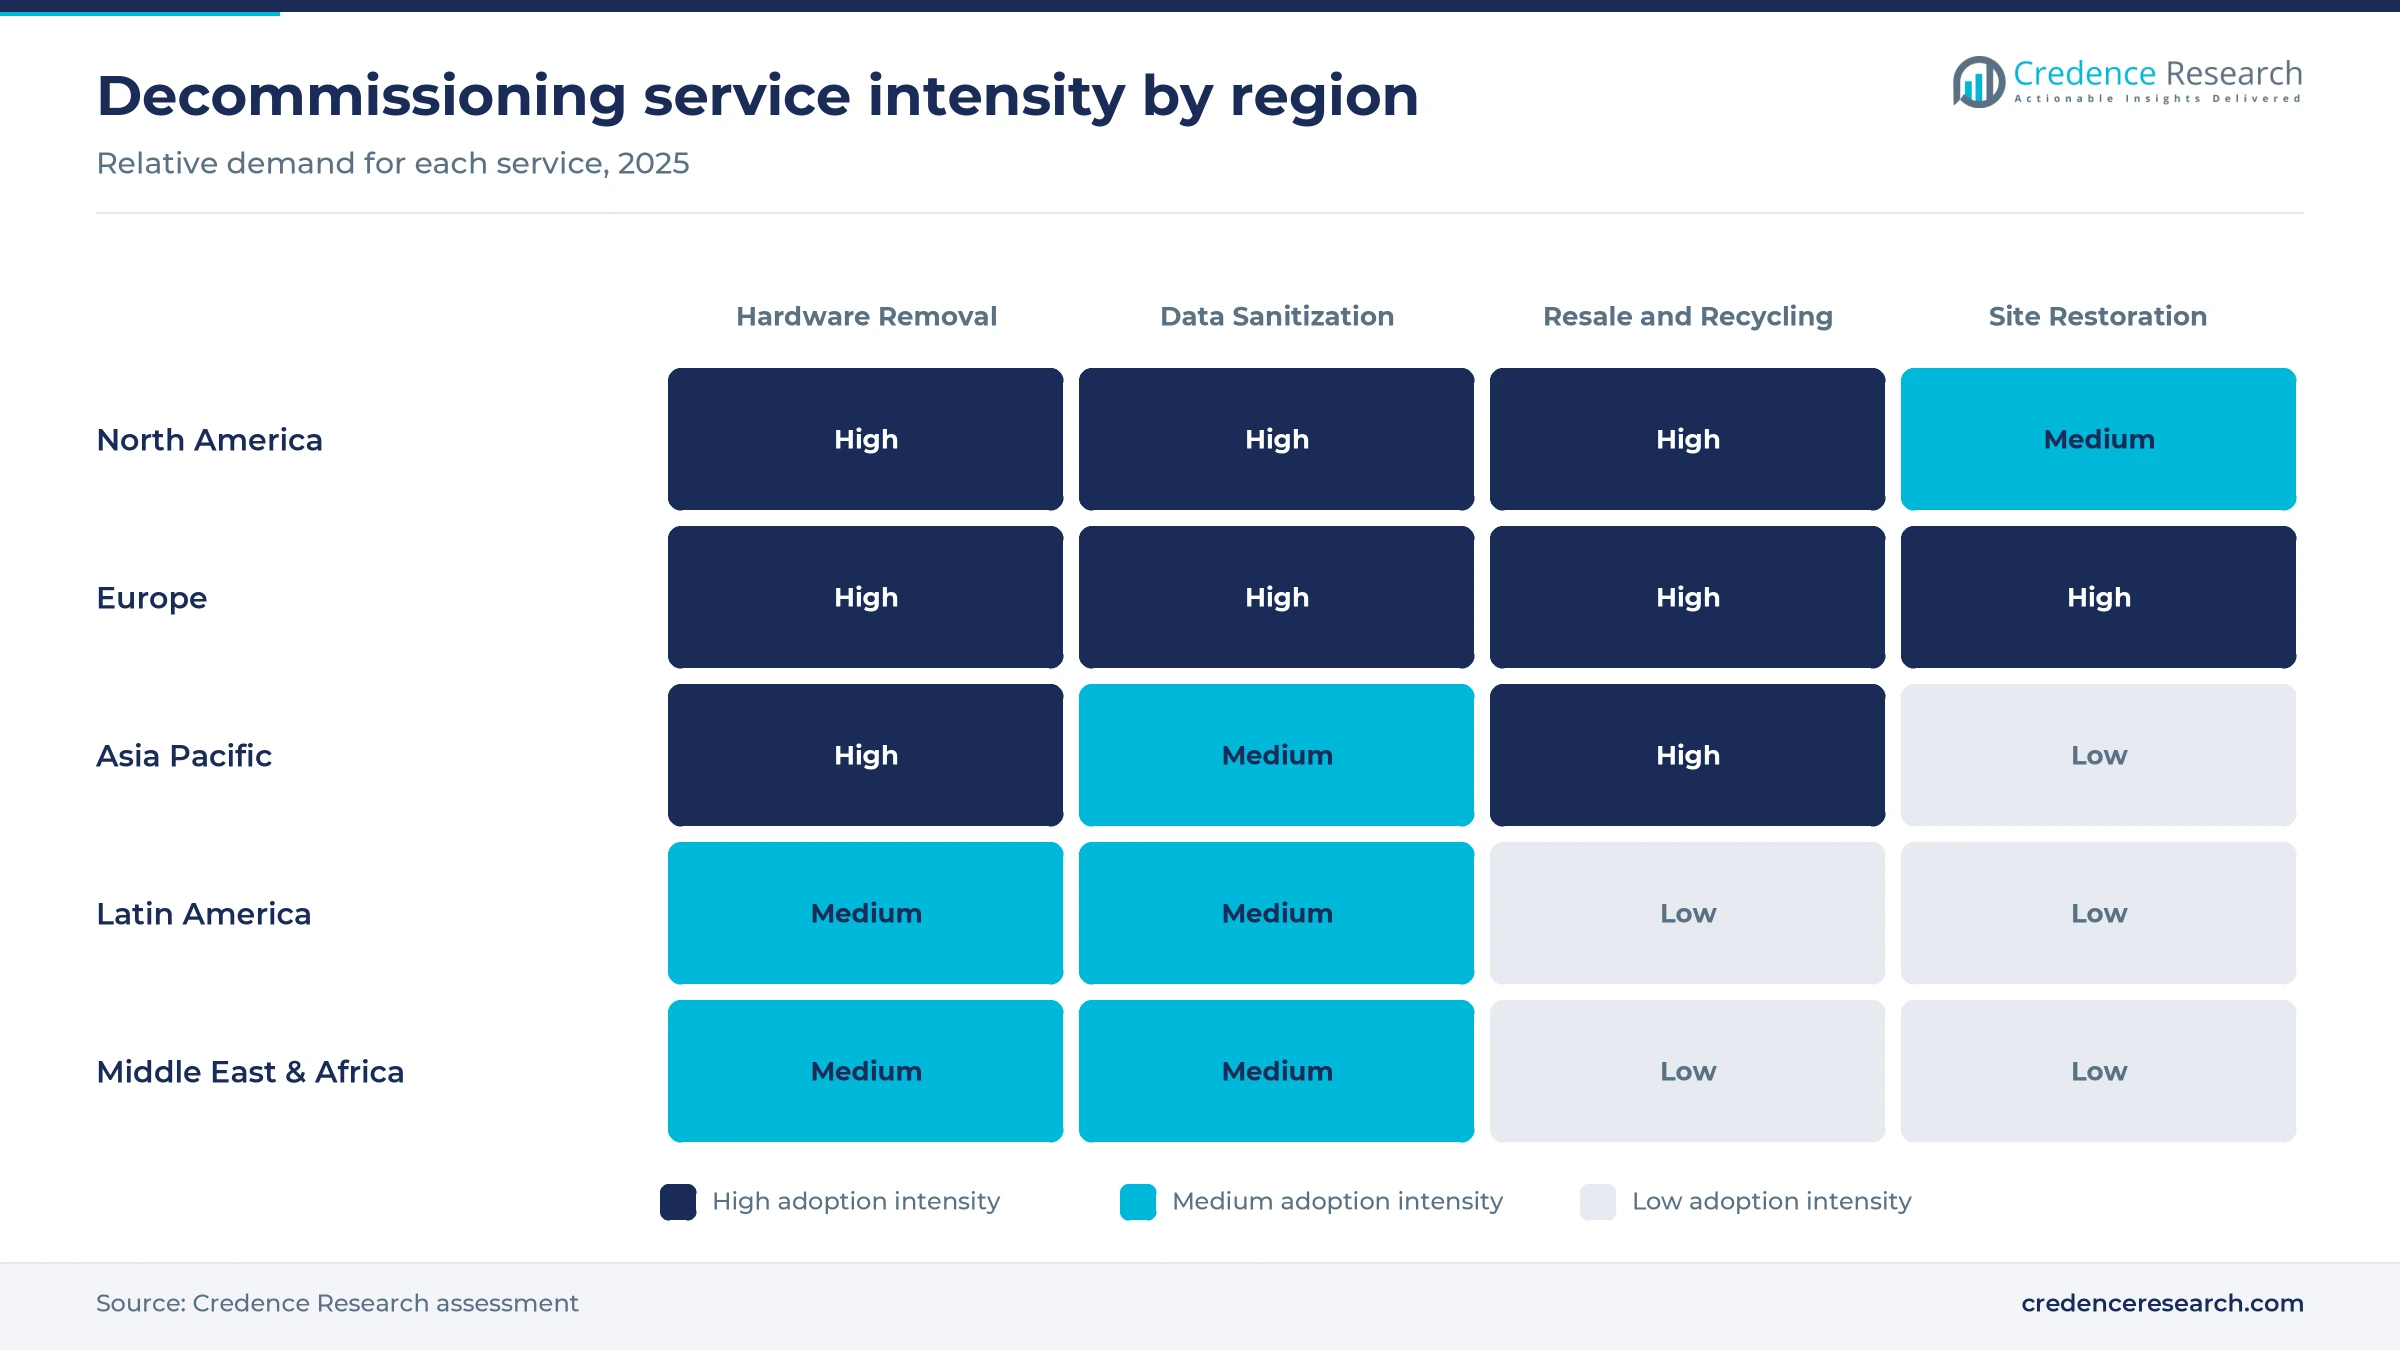
Based on service, the market is categorized into hardware removal, data sanitization, resale and recycling, and site restoration. Hardware Removal led with 34.0% of 2025 value because every project starts with de-racking, cable removal and secure transport of each device. A 2016 Morgan Stanley project at two retired sites involved about 4,900 devices, including 53 storage arrays holding roughly 1,000 drives, according to DatacenterDynamics. Resale and Recycling grows fastest at 9.71% a year as recovered material gains value. The United Nations Institute for Training and Research put the metals in 2022 e-waste at $91 billion, yet only $28 billion was recovered.
Why do enterprises lead while hyperscalers grow fastest?
Based on client, the market is categorized into enterprises, hyperscalers and colocation providers. Enterprises led with 41.0% of 2025 value because banks, insurers and agencies retire many small server rooms and outsource nearly all of the work. Iron Mountain says its lifecycle services reach more than 90% of the Fortune 1000 in over 30 countries. Hyperscalers grow fastest at 9.73% a year as their fleets turn over sooner. Amazon cut the useful life of a subset of servers from six to five years from January 2025, as The Register reported. Meanwhile, colocation operators handle tenant exits on their own floors.
| Segment Group | Leading Sub-segment | Share, 2025 | Fastest-growing Sub-segment | CAGR, 2026–2035 |
|---|---|---|---|---|
| By Service | Hardware Removal | 34.0% | Resale and Recycling | 9.71% |
| By Client | Enterprises | 41.0% | Hyperscalers | 9.73% |
Request a Free Sample
Fill in your details and we'll send you a free sample report.
- Sample data tables & charts
- Research methodology
Old facilities, audits and AI refresh cycles lift demand
Aging sites and workload migrations trigger retirements
Retirement projects rise because a large share of the installed base is old and much enterprise work is moving to cloud regions and hyperscale campuses. Uptime Institute survey data show that facilities older than 10 years make up 48% of sites and hold 38% of IT capacity, according to DatacenterDynamics. U.S. federal agencies closed 58 data centers in fiscal 2021 against a goal of 43, the Government Accountability Office reported in February 2023. DatacenterDynamics also reported that TES opened a 120,000-square-foot plant in Fredericksburg, Virginia, to process hyperscale and enterprise equipment near the largest U.S. cluster. In the Credence Research model this driver adds about 3.8 percentage points to annual growth to 2035.
Certified data destruction raises demand for audited work
Buyers pay for certified destruction because regulators now punish weak disposal. The Securities and Exchange Commission fined Morgan Stanley $35 million on Sept. 20, 2022, after drives from retired sites were resold with customer data still on them, affecting about 15 million people, according to Banking Dive. The National Institute of Standards and Technology then published SP 800-88 Revision 2 on Sept. 26, 2025, replacing the 2014 guide that most contracts cite. Apto Solutions now lists NAID AAA, R2v3 and ISO 27001 certifications, plus memory sanitization for GPU clusters. In the Credence Research model this driver adds about 2.3 percentage points to annual growth to 2035.
Sustainability reporting favors responsible recycling
Corporate waste and climate reporting pushes owners toward reuse and documented recycling instead of bulk scrap sales. The Global E-waste Monitor 2024 counted 62 million metric tons of e-waste in 2022 and found only 22.3% formally collected and recycled, a gap that auditors now question. Microsoft reported that 90.9% of its servers and components were reused or recycled in 2024, beating its 2025 goal of 90%, according to ITPro in April 2025. Google says it harvested about 8.8 million components from retired hardware in 2024 for reuse or resale. These targets require certified downstream partners and detailed asset-level reports for each project. In the Credence Research model this driver adds about 1.5 percentage points to annual growth to 2035.
AI hardware cycles shorten the time between projects
AI clusters add a fourth source of growth because accelerator servers age out much faster than general compute. An SK tes release dated May 5, 2026, said GPU-dense servers are now replaced in as little as 10 to 18 months, against traditional cycles of four to six years. Hashrate Index reported in April 2026 that used H100 GPUs reached $50,000 each during the mid-2024 shortage, and that a used eight-GPU H100 server still traded at about $150,000 to $180,000 in early 2026. Such values make fast, certified recovery of accelerator hardware worth paying for. Hyperscalers therefore grow at 9.73% a year, the fastest client rate in the Credence Research model.
Buyers consolidate providers as reuse becomes the default
Consolidation shift as lifecycle groups buy specialists
Ownership is consolidating as large records and lifecycle groups buy specialists to cover more countries under one chain of custody. Iron Mountain agreed to buy 80% of ITRenew for about $725 million in cash, with closing expected in the first quarter of 2022, according to DatacenterDynamics. Sustainable Tech Partner reported on Sept. 26, 2024, that Iron Mountain had acquired Wisetek of Cork, Ireland, which has about 400 staff and sites in the U.K., four U.S. states, Fujairah and Thailand. SK ecoplant bought TES for $1 billion in February 2022 and now runs more than 40 owned facilities. As a result, global clients increasingly award multi-country retirement programs to one provider.
Rise of component harvesting and memory reuse
Recovery is moving from whole-server resale toward harvesting parts that can run again in live fleets. Sims Lifecycle Services said on April 25, 2025, that a robotic microfactory now sorts, tests and qualifies recovered memory modules for production CXL systems. Microsoft opened its first Asian Circular Center in Singapore in September 2022, using routing software to send each retired part to reuse, resale or recycling. Data Center Frontier reported in June 2023 that AWS pairs each reverse logistics hub with an asset disposition center and a failure analysis lab. This shift feeds the wider e-waste recycling and reuse chain with cleaner, sorted streams.
Opportunity in producer responsibility regimes
Producer responsibility rules open room for certified recyclers that can document every retired asset. India's E-Waste (Management) Rules, notified on Nov. 2, 2022, took effect on April 1, 2023, and set recycling targets of 60% for 2023-24 rising to 80% from 2027-28, according to the International Energy Agency policy database. The EU Batteries Regulation brought its waste battery chapter into force on Aug. 18, 2025, which covers the UPS strings removed during restoration. Europe already collects 42.8% of its e-waste formally, against a world average of 22.3%. Providers with registered recycling plants can therefore sell compliance documentation alongside removal.
Opportunity in new hubs in Ireland and North America
New processing hubs near dense clusters create room for providers that can cut transport time and keep data in country. SK tes announced a 36,000-square-foot facility in Shannon on April 24, 2025, offering decommissioning, certified data destruction and recycling for hyperscale sites in Ireland, with more than 25 new jobs. Finnish provider 3stepIT said on Feb. 9, 2025, that it would open a North American headquarters in Texas and a U.S. refurbishment center before 2026. SK tes also lists 21 facilities across 13 Asia Pacific countries and territories. Local plants therefore become a strong selling point in decommissioning services tenders.
Resale swings, rules and weak recycling outlets add risk
Volatile resale prices squeeze recovery margins
Recovery margins depend on secondary prices that can fall quickly once supply arrives. Hashrate Index reported that used H100 prices dropped sharply after their mid-2024 peak and expected used A100 prices to fall another 10% to 15% through 2026. SK tes said in May 2026 that DDR4 memory prices surged in the first quarter and then fell after large inventory releases. Providers that share resale proceeds with clients therefore face uneven project returns and must price removal and erasure work separately.
Weak formal recycling outside Europe limits outlets
Compliant downstream outlets are scarce in many emerging regions, which raises transport costs for certified projects. The Global E-waste Monitor 2024 found that Africa formally recycles less than 1% of its e-waste, against 42.8% in Europe. Operators of new campuses in Africa and parts of Asia must often ship retired drives and boards across borders for certified processing. As a result, local permits, export rules and longer timelines add cost, which providers offset by shredding drives on site before shipment.
Chain-of-custody failures expose owners to penalties
Clients face large penalties when a subcontractor mishandles retired hardware, so they demand costly audits. In the case the SEC settled in September 2022, a moving company without data destruction experience handled the devices, and the vast majority of lost hardware was never recovered, according to DatacenterDynamics. The same review found 42 branch servers unaccounted for after a 2019 refresh. Buyers therefore require serial-level tracking, sealed transport and witnessed erasure, which raise project costs for smaller providers.
Refrigerant and battery rules lengthen site restoration
Site restoration takes longer because cooling and power plant now fall under stricter end-of-life rules. The EU F-gas Regulation 2024/573 entered into force on March 11, 2024, setting rules on recovery, recycling and destruction of fluorinated gases, according to UL. The EU Batteries Regulation added a carbon footprint declaration for large industrial batteries from Feb. 18, 2026, according to ComplianceGate. Contractors therefore need certified refrigerant technicians and battery handlers, which raises restoration bids for colocation exits.
North America leads while Middle East & Africa grows fastest
| Region | Value, 2025 (USD billion) | Share, 2025 | CAGR, 2026–2035 |
|---|---|---|---|
| North America | 0.40 | 38.0% | 8.55% |
| Asia Pacific | 0.29 | 28.0% | 9.75% |
| Europe | 0.28 | 27.0% | 8.65% |
| Latin America | 0.04 | 4.0% | 9.55% |
| Middle East & Africa | 0.03 | 3.0% | 9.85% |
North America leads on fleet size and audits
North America held 38.0% of 2025 value and grows at 8.55% a year. The region combines the largest hyperscale fleets with strict disposal oversight from banking and federal regulators. Apto Solutions runs full-service facilities in Atlanta, Austin and San Leandro, offering on-site wipe and shred under two-person controls. Finnish provider 3stepIT chose Texas for its North American headquarters in February 2025, which signals how new entrants follow retirement volumes to the United States.
Asia Pacific grows on new campuses and reuse hubs
Asia Pacific held 28.0% of 2025 value and grows at 9.75% a year, faster than both Western regions. Microsoft chose Singapore for its first Asian Circular Center in September 2022 to reuse hardware from its regional cloud sites. SK tes lists 21 facilities across 13 countries and territories, from Kanagawa in Japan to Johor Bahru in Malaysia and Jakarta in Indonesia. India's producer responsibility targets, which step up again from 2027-28, add documented recycling demand.
Europe is shaped by ecodesign and reuse rules
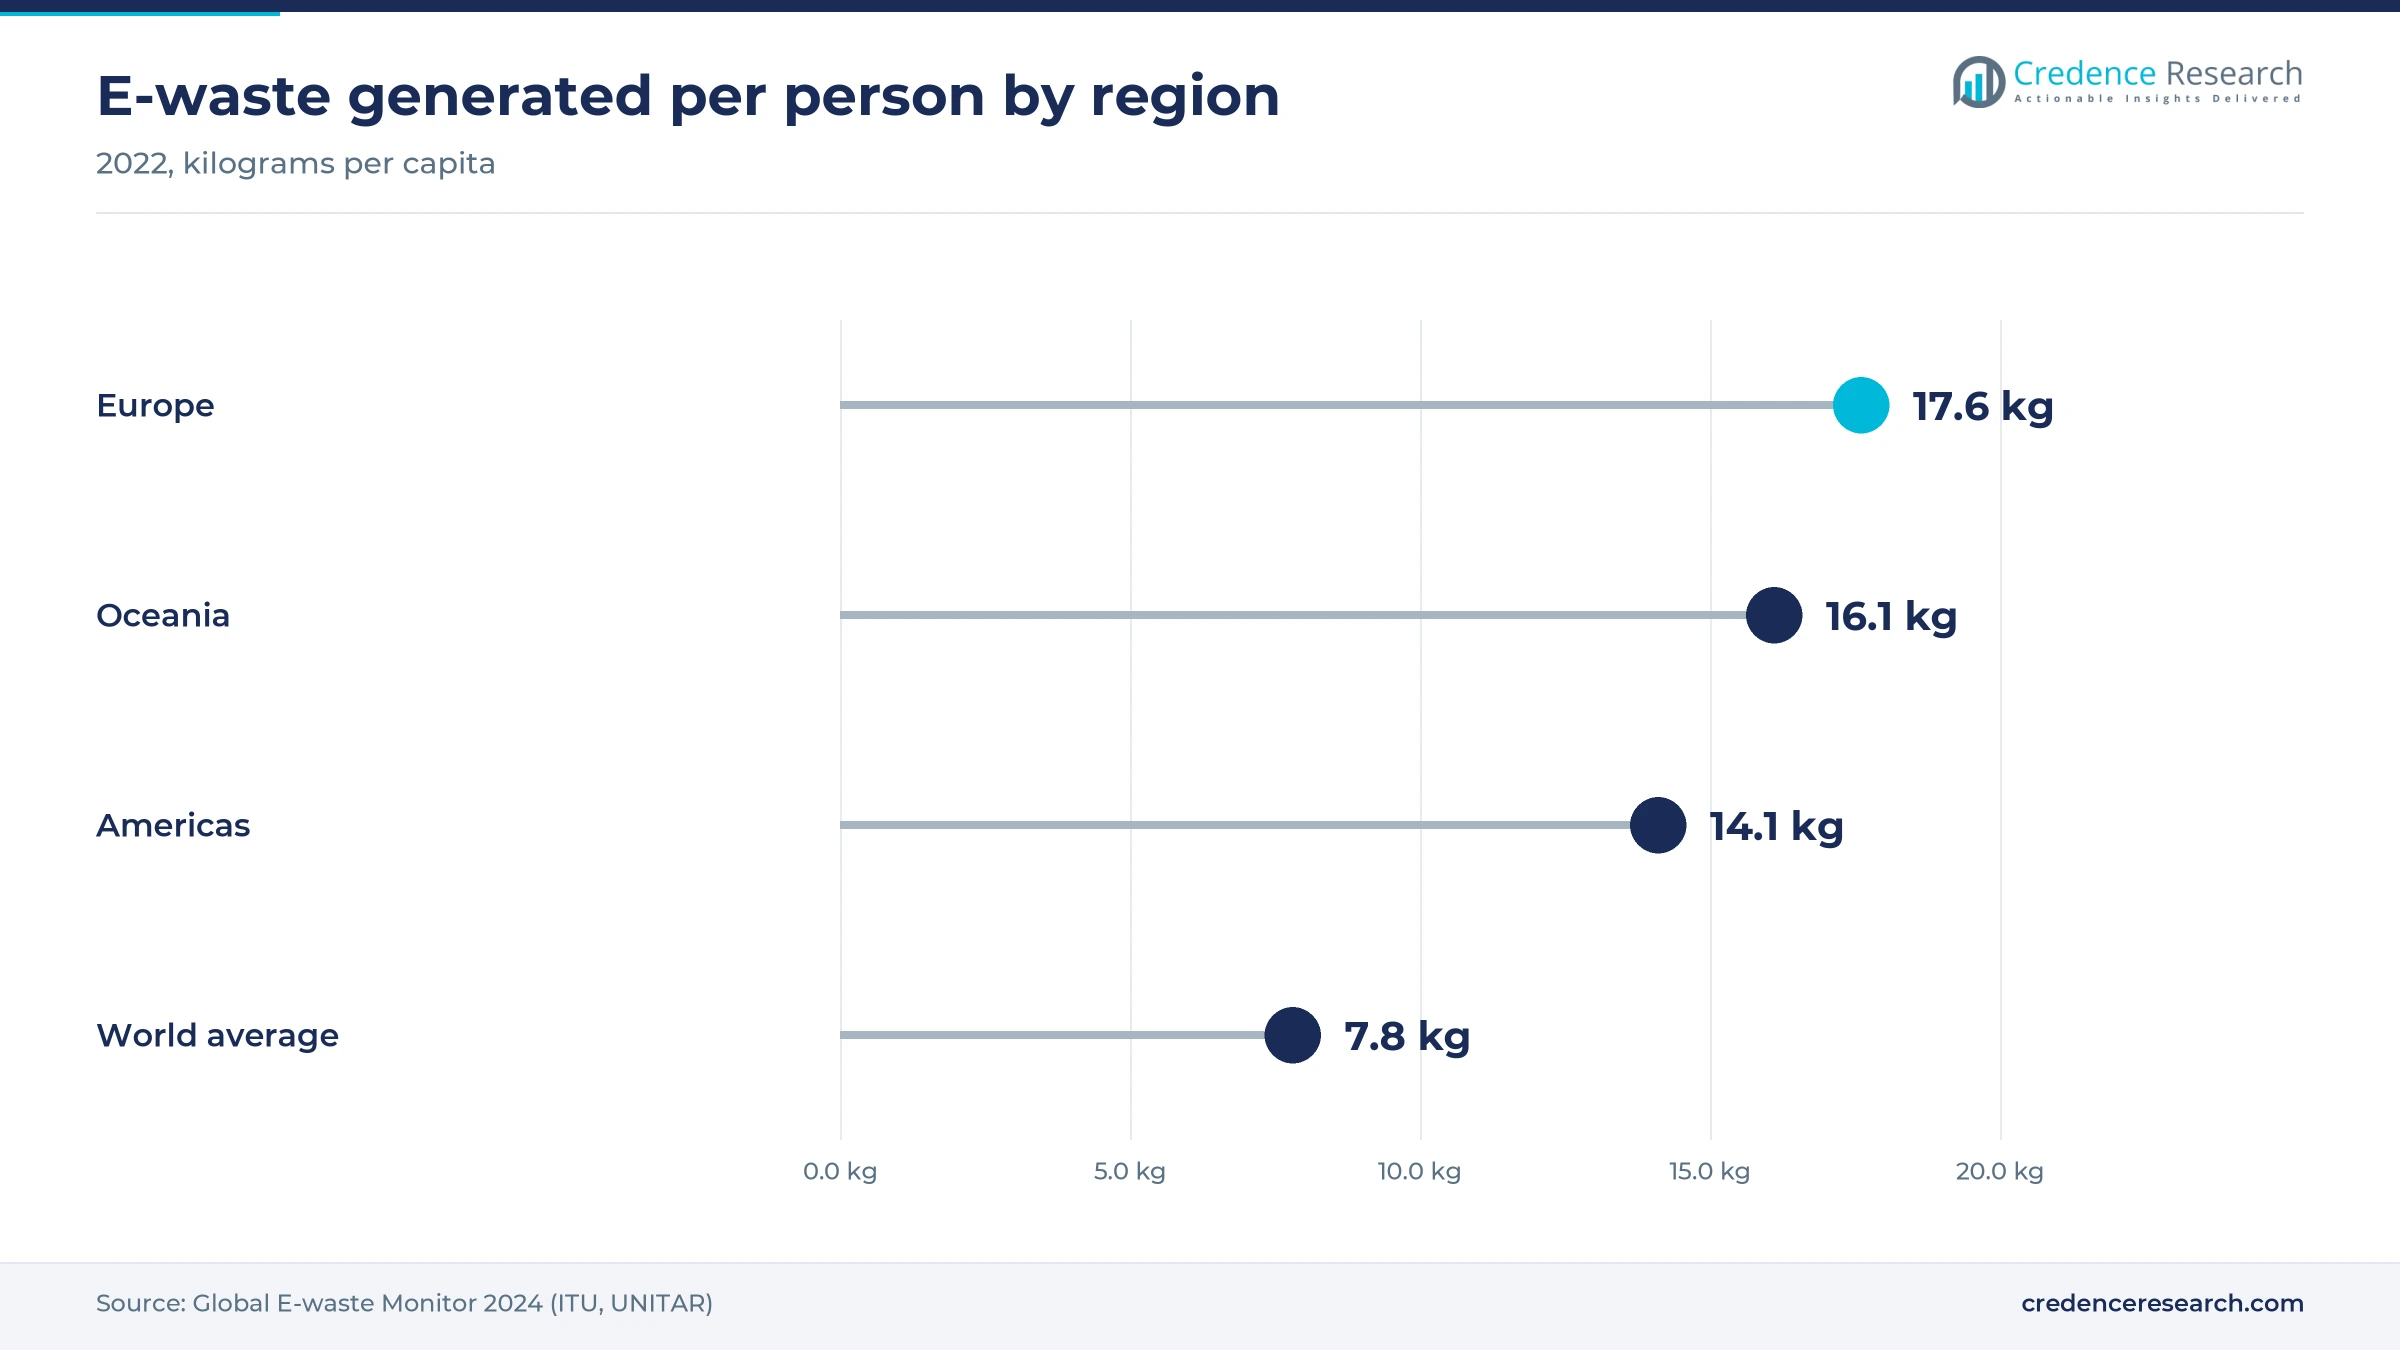
Europe held 27.0% of 2025 value and grows at 8.65% a year. The EU ecodesign regulation for servers and data storage products, Regulation 2019/424, has applied since March 1, 2020, and sets binding design rules for new equipment sold in the bloc. Europe also generates the most e-waste per person, at 17.6 kilograms in 2022, according to the Global E-waste Monitor. Ireland is a hub, with Wisetek based in Cork and SK tes opening in Shannon in 2025.
Latin America builds a base for future retirements
Latin America held 4.0% of 2025 value and grows at 9.55% a year. Brazil published Provisional Measure 1,318 in September 2025, creating the REDATA tax regime that exempts imported and domestic IT equipment for data center projects, according to Mayer Brown. The regime requires 100% clean or renewable power and at least 10% of capacity for the Brazilian market. Equipment bought under REDATA will reach its first refresh within the forecast period.
Middle East & Africa grows fastest from a small base
Middle East & Africa held 3.0% of 2025 value and grows at 9.85% a year, the fastest rate of any region. Large Gulf campuses opened in recent years will reach their first hardware refresh before 2030. Wisetek, now owned by Iron Mountain, already runs a site in Fujairah in the United Arab Emirates. Africa formally recycles less than 1% of its e-waste, so most certified processing still depends on facilities outside the continent.
Acquisitions, new plants and a NIST update shaped 2024-2026
| Development | Status and market relevance |
|---|---|
| In September 2024, Iron Mountain acquired Wisetek, an asset disposition and data sanitization provider based in Cork, Ireland, with about 400 staff. | Completed; extends Iron Mountain's retirement coverage in Europe, the United States, Fujairah and Thailand |
| In April 2025, SK tes announced a 36,000-square-foot facility in Shannon, Ireland, for decommissioning, data destruction and recycling. | Opened in 2025; serves hyperscale and enterprise sites in Ireland with more than 25 new jobs |
| In April 2025, Sims Lifecycle Services presented large-scale reuse of recovered memory modules in production CXL systems at the OCP EMEA Summit. | Deployed; a robotic microfactory tests and qualifies recovered modules for live fleets |
| In September 2025, the National Institute of Standards and Technology published SP 800-88 Revision 2, replacing the 2014 media sanitization guide. | Final; disposal contracts and erasure reports are being updated to the new revision |
Erasure tools, robotics and routing software cut costs
- Certified erasure software overwrites or cryptographically purges drives under NIST SP 800-88 and produces an audit report for each serial number.
- Mobile shredders and degaussers destroy failed or high-risk media on site, and Procurri issues a removal certificate for every item it degausses, crushes or shreds.
- Robotic test cells sort, inspect and qualify recovered memory and drives at volume, as Sims Lifecycle Services does for CXL memory reuse.
- Routing and tracking platforms assign each retired part to reuse, resale or recycling, like Microsoft's routing system, and log sealed, GPS-tracked transport.
Need a Custom Version of This Report?
Tailor the scope, geography, or segments to your exact requirements.
- Custom geography or segment scope
- Direct access to our analyst team
Certifications and global reach decide contract awards
Competition in decommissioning services centers on certifications, global reach and the ability to return value from recovered hardware. Iron Mountain built its lifecycle business around ITRenew and added Wisetek in 2024, so it can run multi-country retirements under one contract. SK tes, owned by SK ecoplant, competes on more than 40 owned facilities and new plants in Virginia and Ireland. Sims Lifecycle Services focuses on hyperscale reuse, including memory recovery for CXL systems and its Rack Renew program for open-source servers. Apto Solutions targets regulated enterprises with NAID AAA, R2v3 and ISO 27001 credentials and on-site wipe and shred. Procurri offers physical removal, secure transport and destruction with item-level certificates. Many contracts are bundled with IT asset disposition programs, so providers that can handle both site work and remarketing win larger awards.
Companies profiled and their roles in this market
| Company | Type | Role in the market |
|---|---|---|
| Iron Mountain (ITRenew) | Lifecycle services group | Runs data center retirements, NIST 800-88 sanitization and remarketing in over 30 countries |
| SK tes (TES) | ITAD and recycling specialist | Operates more than 40 owned facilities, including Fredericksburg, Virginia and Shannon, Ireland |
| Sims Lifecycle Services | Hyperscale reuse specialist | Repurposes servers and recovered memory modules for cloud and hyperscale clients |
| Apto Solutions | Enterprise ITAD provider | Offers on-site wipe and shred and GPU memory sanitization from Atlanta, Austin and San Leandro |
| Procurri | Lifecycle and ITAD provider | Provides physical decommissioning, secure transport and certified data destruction |
Proof of erasure and reuse rates will decide winners
Credence Research's view is that the market will be decided by proof rather than by price. Clients remember the $35 million SEC penalty of 2022 and now ask for serial-level erasure reports under the 2025 NIST revision. At the same time, hyperscalers now publish reuse rates for retired fleets, so providers must show how much of each fleet goes back into service. The strongest position belongs to providers that combine on-site removal, certified erasure, component testing and resale. Smaller firms can still win regional enterprise work if they hold recognized certifications and local plants.
Service-fee model checked against hardware retirements
The report uses 2025 as the base year and forecasts to 2035. Market values come from the Credence Research model, which estimates retired server, storage and network volumes and applies service fees for removal, sanitization, recycling and site restoration. Regional, service and client splits within decommissioning services are Credence Research estimates. Inputs include regulator documents, United Nations e-waste statistics, company releases and trade press. No interviews or surveys were used to build these estimates.
AI refresh cycles keep retirement work rising to 2035
Through 2035, demand for decommissioning services will grow as aging enterprise sites close and AI clusters cycle hardware within two years. Asia Pacific and Middle East & Africa will gain share as campuses built in the early 2020s reach their first refresh. Resale and recycling will expand faster than removal because reuse targets and producer responsibility rules reward documented recovery. Price swings for used GPUs and memory will remain the main risk to provider margins, so contracts will separate service fees from shared resale proceeds more often.
Frequently Asked Questions
How big is the data center decommissioning services market?
Which region leads the market?
Which region grows fastest?
Which service holds the largest share?
Why do certified data destruction standards matter?
How does AI affect decommissioning demand?
Who are the main companies in the market?
What are the main challenges for providers?
Table of Content
Chapter 1 Market Segmentation
- 1.1 Segmentation Framework
- 1.1.1 Product and Service Classification
- 1.1.2 Application and End-Use Classification
- 1.1.3 Technology and Solution Classification
- 1.1.4 Customer and Distribution Channel Classification
- 1.1.5 Geographic Segmentation
- 1.1.6 Market Segment Definitions and Boundaries
- 1.2 By Service
- 1.2.1 Hardware Removal
- 1.2.2 Data Sanitization
- 1.2.3 Resale and Recycling
- 1.2.4 Site Restoration
- 1.3 By Client
- 1.3.1 Enterprises
- 1.3.2 Hyperscalers
- 1.3.3 Colocation Providers
Chapter 2 Introduction
- 2.1 Report Objectives and Scope
- 2.2 Product Definition and Industry Terminology
- 2.3 Market Inclusions and Exclusions
- 2.4 Research Process
- 2.4.1 Primary Research and Expert Interviews
- 2.4.2 Secondary Research and Source Review
- 2.4.3 Top-Down and Bottom-Up Estimation
- 2.4.4 Data Triangulation and Verification
- 2.5 Market Size Measurement Basis
- 2.5.1 2025: USD 1.05 billion → 2035: USD 2.49 billion
- 2.6 Historical and Forecast Reference Periods
- 2.6.1 Historical Period: 2018-2025
- 2.6.2 Base Year: 2025
- 2.6.3 Forecast Period: 2025-2035
- 2.7 Research Assumptions and Limitations
Chapter 3 Executive Summary
- 3.1 Market Snapshot and Key Findings
- 3.2 Base-Year Market Size, 2025
- 3.3 Forecast Market Size, 2035
- 3.4 Revenue and Volume Growth Outlook
- 3.5 Key Demand and Supply Indicators
- 3.6 Leading Market Segments
- 3.7 Fastest-Growing Market Opportunities
- 3.8 Regional Performance Highlights
- 3.9 Technology and Industry Transformation
- 3.10 Competitive Landscape Summary
- 3.11 Analyst View and Strategic Implications
Chapter 4 Global Data Center Decommissioning Services Market Trends and Developments
- 4.1 Historical Industry Development, 2018-2025
- 4.2 Recent Market Trends and Developments
- 4.3 Demand and Customer Behavior Trends
- 4.4 Technology and Product Innovation
- 4.5 Artificial Intelligence, Automation and Digitalization
- 4.6 Local Manufacturing and Supply Chain Realignment
- 4.7 Industry Partnerships, Mergers and Acquisitions
- 4.8 Sustainability and Circular Economy Developments
- 4.9 Government and Private Sector Investment Trends
- 4.10 Emerging Business Models and Commercialization
- 4.11 Industry Developments and Announcements
Chapter 5 Global Data Center Decommissioning Services Market Supply and Demand Analysis
- 5.1 Demand Trend and Consumption Analysis, 2018-2025
- 5.2 Demand Forecast, 2025-2035
- 5.3 Supply Chain Structure and Procurement Trends
- 5.4 Supply-Demand Gap and Bottlenecks
- 5.5 Import Dependence and Sourcing Structure
- 5.6 Regional Supply and Demand Concentration
Chapter 6 Global Data Center Decommissioning Services Market Pricing Analysis
- 6.1 Pricing Structure and Measurement
- 6.2 Historical Pricing Trends, 2018-2025
- 6.3 Pricing Outlook, 2025-2035
- 6.4 Pricing by Product and Market Segment
- 6.5 Geographic Pricing Differences
- 6.6 Key Input, Energy, Labor and Logistics Costs
- 6.7 Contract Pricing and Purchasing Models
- 6.8 Pricing Sensitivity and Competitive Positioning
- 6.9 Price, Margin and Profitability Implications
Chapter 7 Global Data Center Decommissioning Services Market Dynamics
- 7.1 Market Growth Drivers
- 7.1.1 Demand-Side Drivers
- 7.1.2 Technology and Innovation Drivers
- 7.1.3 Infrastructure and Investment Drivers
- 7.1.4 Regulatory and Policy Drivers
- 7.2 Market Restraints
- 7.2.1 Cost and Affordability Constraints
- 7.2.2 Technology and Adoption Barriers
- 7.2.3 Supply Chain and Operational Constraints
- 7.3 Market Challenges
- 7.3.1 Competitive Pressure and Margin Erosion
- 7.3.2 Skills, Infrastructure and Implementation Gaps
- 7.4 Emerging Market Opportunities
- 7.5 Market Dynamics Impact and Time-Horizon Assessment
Chapter 8 Global Data Center Decommissioning Services Value Chain Analysis
- 8.1 Industry Value Chain Overview
- 8.2 Upstream Suppliers and Critical Inputs
- 8.3 Technology and Component Providers
- 8.4 Manufacturing or Service Delivery
- 8.5 Distribution, Channel Partners and Integrators
- 8.6 Downstream Applications and End Users
- 8.7 Value Addition and Profit Pools
- 8.8 Vertical Integration and Outsourcing
- 8.9 Supplier Concentration and Risk
- 8.10 Supply Chain Localization and Resilience
Chapter 9 Global Data Center Decommissioning Services Market Regulations and Policies
- 9.1 Relevant Laws, Standards and Compliance Frameworks
- 9.2 Product, Service, Safety and Quality Requirements
- 9.3 Government Policies, Incentives and Subsidies
- 9.4 Imports, Exports and Trade Barriers
- 9.5 Public Procurement and Local Content Requirements
- 9.6 Data Protection, AI and Cybersecurity Compliance
- 9.7 Upcoming Policy Changes and Market Implications
Chapter 10 Global Data Center Decommissioning Services Market Hotspots and Opportunities
- 10.1 Market Opportunity Mapping and Growth Hotspots
- 10.2 High-Growth Applications and Customer Groups
- 10.3 Underserved Markets and White-Space Opportunities
- 10.4 Emerging Technology and Product Opportunities
- 10.5 New Capacity and Investment Hotspots
- 10.6 Market Entry and Expansion Opportunities
- 10.7 Distribution and Partnership Opportunities
- 10.8 Near-Term and Long-Term Commercial Potential
- 10.9 Opportunity Attractiveness and Execution Risks
Chapter 11 Global Data Center Decommissioning Services Market Outlook, 2025-2035
- 11.1 Market Size and Analysis
- 11.1.1 Revenue (Market Measurement: 2025: USD 1.05 billion → 2035: USD 2.49 billion)
- 11.1.2 Historical Market Size, 2018-2025
- 11.1.3 Base-Year Market Size, 2025
- 11.2 Market Forecast, 2025-2035
- 11.2.1 Revenue Forecast to 2035
- 11.2.2 CAGR and Year-on-Year Growth
- 11.2.3 Incremental Revenue Opportunity
- 11.3 Forecast Assumptions and Scenario Analysis
- 11.3.1 Base-Case Forecast
- 11.3.2 Optimistic and Conservative Scenarios
- 11.3.3 Technology, Pricing and Policy Sensitivities
- 11.4 Market Attractiveness and Growth Outlook
Chapter 12 Global Data Center Decommissioning Services Market Segmentation and Outlook
- 12.1 Segmentation Summary and Market Shares, 2025
- 12.2 Largest and Fastest-Growing Segments
- 12.3 By Service - Market Size and Forecast, 2025-2035
- 12.3.1 Segment Definition and Scope
- 12.3.2 Historical Market Size, 2018-2025
- 12.3.3 Revenue Forecast, 2025-2035
- 12.3.4 Base-Year Market Share, 2025
- 12.3.5 Segment CAGR and Growth Drivers
- 12.3.6 Subsegment Market Size and Forecast
- 12.3.6.1 Hardware Removal
- 12.3.6.2 Data Sanitization
- 12.3.6.3 Resale and Recycling
- 12.3.6.4 Site Restoration
- 12.3.7 Subsegment Pricing and Adoption Trends
- 12.3.8 Leading Suppliers and Competition
- 12.3.9 Regional Demand and Opportunities
- 12.4 By Client - Market Size and Forecast, 2025-2035
- 12.4.1 Segment Definition and Scope
- 12.4.2 Historical Market Size, 2018-2025
- 12.4.3 Revenue Forecast, 2025-2035
- 12.4.4 Base-Year Market Share, 2025
- 12.4.5 Segment CAGR and Growth Drivers
- 12.4.6 Subsegment Market Size and Forecast
- 12.4.6.1 Enterprises
- 12.4.6.2 Hyperscalers
- 12.4.6.3 Colocation Providers
- 12.4.7 Subsegment Pricing and Adoption Trends
- 12.4.8 Leading Suppliers and Competition
- 12.4.9 Regional Demand and Opportunities
- 12.5 Segment Growth Comparison
- 12.6 Segment Attractiveness and Priority Matrix
Chapter 13 Global Data Center Decommissioning Services Geographic Market Outlook, 2025-2035
- 13.1 Regional Market Size and Share, 2025
- 13.2 Regional Market Forecast, 2025-2035
- 13.3 Regional Pricing, Production and Demand Differences
- 13.4 North America
- 13.4.1 United States
- 13.4.2 Canada
- 13.4.3 Mexico
- 13.5 Europe
- 13.5.1 Germany
- 13.5.2 France
- 13.5.3 Italy
- 13.5.4 United Kingdom
- 13.5.5 Spain
- 13.5.6 Poland
- 13.5.7 Russia
- 13.5.8 Netherlands
- 13.5.9 Belgium
- 13.5.10 Sweden
- 13.5.11 Denmark
- 13.5.12 Norway
- 13.5.13 Rest of Europe
- 13.6 Asia Pacific
- 13.6.1 China
- 13.6.2 India
- 13.6.3 Japan
- 13.6.4 South Korea
- 13.6.5 Thailand
- 13.6.6 Indonesia
- 13.6.7 Vietnam
- 13.6.8 Malaysia
- 13.6.9 Australia
- 13.6.10 Rest of Asia Pacific
- 13.7 Latin America
- 13.7.1 Brazil
- 13.7.2 Argentina
- 13.7.3 Colombia
- 13.7.4 Chile
- 13.7.5 Rest of Latin America
- 13.8 Middle East
- 13.8.1 Saudi Arabia
- 13.8.2 United Arab Emirates
- 13.8.3 Turkey
- 13.8.4 Israel
- 13.8.5 Iran
- 13.8.6 Rest of the Middle East
- 13.9 Africa
- 13.9.1 South Africa
- 13.9.2 Egypt
- 13.9.3 Nigeria
- 13.9.4 Morocco
- 13.9.5 Rest of Africa
- 13.10 Regional Investment, Policy and Supply Chain Differences
- 13.11 Regional Competitive Landscape
- 13.12 Geographic Growth Hotspots
Chapter 14 Global Data Center Decommissioning Services Technology, Innovation and Sustainability Outlook
- 14.1 Technology Landscape and Maturity
- 14.2 Product, Process and Service Innovation
- 14.3 AI, Automation and Digital Tools in the Industry
- 14.4 Technology Adoption and Performance Benchmarking
- 14.5 Innovation Pipeline and R&D Investment
- 14.6 Energy Efficiency and Resource Management
- 14.7 Sustainability, Recycling and Circularity
- 14.8 Technology Roadmap, 2025-2035
- 14.9 Risks of Obsolescence and Technology Substitution
Chapter 15 Global Data Center Decommissioning Services Market Key Strategic Imperatives
- 15.1 Growth and Market Entry Priorities
- 15.2 High-Return Products and Segments
- 15.3 Pricing, Profitability and Cost Optimization
- 15.4 Technology Investment and Product Differentiation
- 15.5 Supply Chain Localization and Resilience
- 15.6 Distribution and Customer Acquisition
- 15.7 Partnership, Acquisition and Capacity Strategy
- 15.8 Regional Expansion Priorities
- 15.9 Short-, Medium- and Long-Term Actions
Chapter 16 Competition Outlook
- 16.1 Industry Competition Characteristics
- 16.2 Market Structure and Concentration
- 16.3 Market Share and Competitive Positioning, 2025
- 16.4 Company-Wise Revenue and Product Benchmarking
- 16.5 Production and Service Capacity Benchmarking
- 16.6 Technology, Pricing and Differentiation
- 16.7 Regional Footprint and Distribution Strength
- 16.8 Mergers, Acquisitions and Strategic Alliances
- 16.9 New Entrants and Competitive Threats
- 16.10 Porter's Five Forces and Industry Attractiveness
- 16.11 Competitive Outlook, 2025-2035
Chapter 17 Company Profiles
- 17.1 Company Coverage and Selection Criteria
- 17.2 Iron Mountain (ITRenew)
- 17.2.1 Business Description
- 17.2.2 Company Ownership and Geographic Presence
- 17.2.3 Product and Service Portfolio
- 17.2.4 Manufacturing and Operating Footprint
- 17.2.5 Financial Performance and Investment
- 17.2.6 Market Share and Competitive Position
- 17.2.7 Technology and Innovation Capabilities
- 17.2.8 Strategic Alliances or Partnerships
- 17.2.9 Recent Developments
- 17.2.10 Growth Strategy and Outlook
- 17.3 Sims Lifecycle Services
- 17.4 SK tes (TES)
- 17.5 Apto Solutions
- 17.6 Procurri
- 17.7 Other Relevant Market Participants
Note: Every listed company is profiled on the structure shown under the first company. The company list is preliminary and may change based on research findings, market developments, data availability and client requirements.
Chapter 18 Disclaimer
- 18.1 Research and Forecast Disclaimer
- 18.2 Data Source and Estimation Limitations
Note: The depth of individual sections depends on data availability for this market. Volume, capacity, trade and other unit-based metrics are included where applicable.

