Market Overview
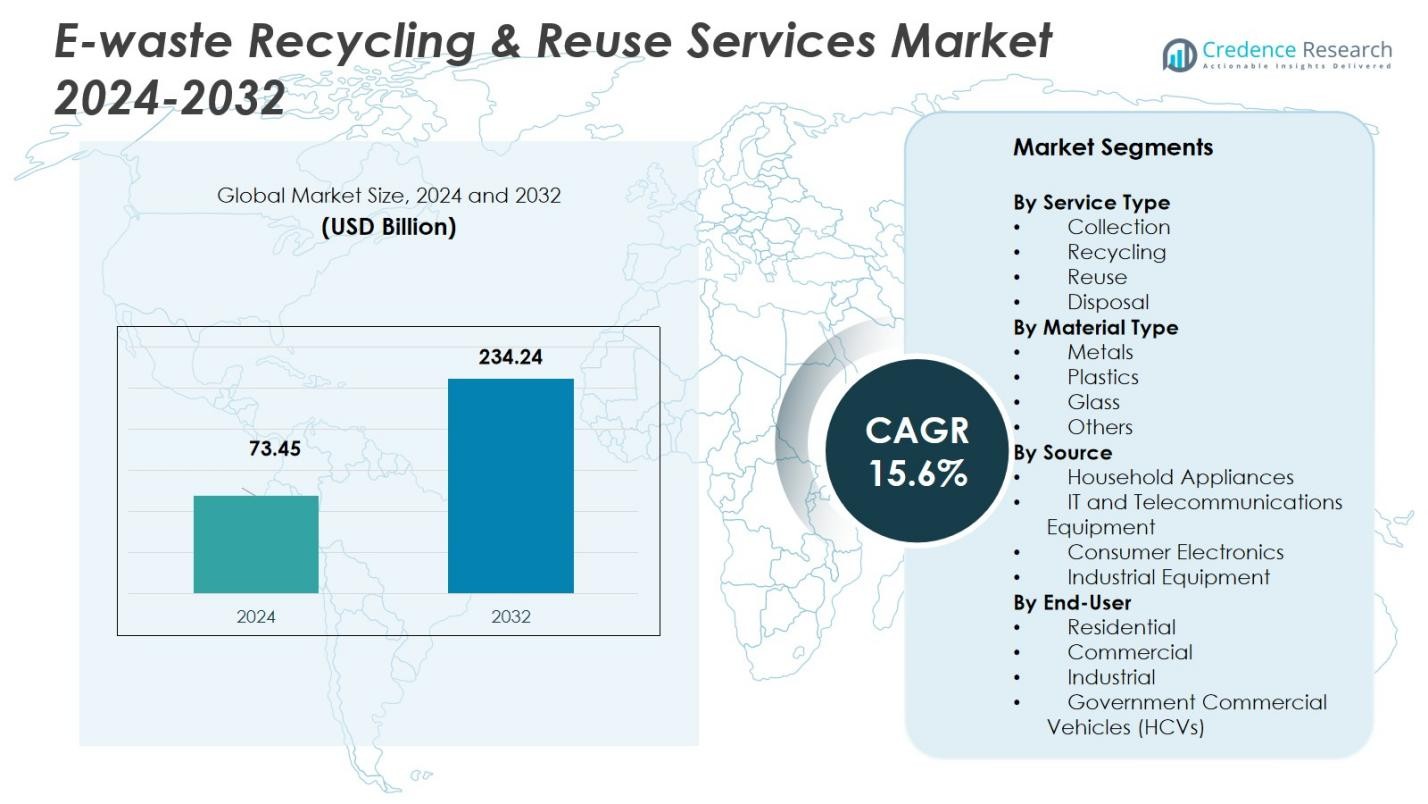
The E-waste Recycling & Reuse Services Market is projected to grow significantly over the forecast period. The market size was valued at USD 73.45 billion in 2024 and is anticipated to reach USD 234.24 billion by 2032, growing at a CAGR of 15.6% during the forecast period.
| REPORT ATTRIBUTE |
DETAILS |
| Historical Period |
2020-2023 |
| Base Year |
2024 |
| Forecast Period |
2025-2032 |
| E-waste Recycling & Reuse Services Market Size 2024 |
USD 73.45 Billion |
| E-waste Recycling & Reuse Services Market, CAGR |
15.6% |
| E-waste Recycling & Reuse Services Market Size 2032 |
USD 234.24 Billion |
The E‑waste Recycling & Reuse Services Market features leading players such as Sims Recycling Solutions, Electronic Recyclers International (ERI), Veolia Environmental Services, MBA Polymers, Inc., and Umicore, each playing a pivotal role through comprehensive e‑waste collection, material recovery, and secure data destruction services. These companies operate at global scale and leverage advanced technologies to extract valuable metals, plastics, and other materials, enabling resource recovery and supporting circular‑economy goals. The market’s leading region is Asia‑Pacific, holding a 46.7% share in 2024, driven by high electronics consumption, rapid device turnover, and increasing regulatory enforcement promoting formal recycling. This regional dominance underscores Asia‑Pacific’s strategic importance in shaping global e‑waste recovery dynamics.
Access crucial information at unmatched prices!
Request your sample report today & start making informed decisions powered by Credence Research Inc.!
Download Sample
Market Insights
- The E-waste Recycling & Reuse Services Market was valued at USD 73.45 billion in 2024 and is expected to reach USD 234.24 billion by 2032, growing at a CAGR of 15.6% during the forecast period.
- Key growth drivers include increasing environmental awareness, strict regulations on e-waste disposal, and the growing volume of discarded electronics, particularly from consumer electronics.
- The market is witnessing a shift towards advanced recycling technologies, improving efficiency in material recovery and reducing environmental impacts.
- The Recycling sub-segment leads the market, accounting for 35.6% of the share, driven by demand for valuable metals recovery like gold and copper.
- Asia-Pacific holds the largest regional share of 46.7%, supported by high consumption of electronics in countries such as China and India, alongside regulatory developments promoting formal recycling.
 Market Segmentation Analysis:
By Service Type
The E-waste Recycling & Reuse Services market is categorized into four primary service types: Collection, Recycling, Reuse, and Disposal. The Recycling sub-segment holds the largest share, accounting for 35.6% of the market. This dominance is driven by the increasing demand for recovering valuable metals like gold, silver, and copper from electronic waste, alongside the growing awareness of environmental sustainability. The Collection and Reuse sub-segments also contribute significantly, as global regulations push for more sustainable disposal methods. The rise of eco-conscious consumers and regulatory policies further fuels the growth of these services.
- For instance, companies using AI-driven sorting technologies are enhancing the accuracy and efficiency of e-waste dismantling processes, maximizing the extraction of precious metals and reducing environmental harm.
By Material Type
In terms of material types, the E-waste Recycling & Reuse Services market is segmented into Metals, Plastics, Glass, and Others. The Metals sub-segment leads with a market share of 42.1%, driven by the high value and demand for precious metals such as gold, silver, and palladium found in electronics. These metals are critical for industrial applications, thereby driving their recovery through e-waste recycling. Plastics and Glass also hold substantial shares, but their recycling processes are less lucrative compared to metals, with Plastics contributing 29.8% of the segment share.
- For instance, Mint Innovations in New Zealand employs microbes and low-cost chemicals to efficiently recover precious metals like gold and palladium from e-waste, lowering energy use and operational costs.
By Source
The E-waste Recycling & Reuse Services market is further segmented by source into Household Appliances, IT and Telecommunications Equipment, Consumer Electronics, and Industrial Equipment. The Consumer Electronics sub-segment is the dominant contributor, holding 38.5% of the market share. This is driven by the rapid pace of technological innovation, leading to frequent upgrades and the disposal of old devices such as smartphones, laptops, and televisions. IT and Telecommunications Equipment follows closely, benefiting from corporate IT equipment upgrades and the need for secure disposal and data destruction. Industrial Equipment also plays a role, albeit with a smaller share of 17.3%.
Key Growth Drivers
Rising Environmental Concerns
The growing awareness regarding environmental pollution and the harmful effects of electronic waste has been a major growth driver for the E-waste Recycling & Reuse Services market. Increasing environmental regulations worldwide, particularly in developed regions, are pushing industries and consumers to recycle and reuse electronic devices responsibly. Governments are imposing stricter e-waste disposal laws, which compel manufacturers to take responsibility for the end-of-life management of their products, further driving the demand for recycling services. This trend is expected to continue, contributing significantly to market growth.
- For instance, Dell has recycled over 635 million pounds of electronics through its program partnering with R2-certified recyclers, ensuring material recovery while adhering to strict environmental standards.
Technological Advancements in Recycling Processes
Technological advancements in e-waste recycling processes are helping businesses recover valuable materials more efficiently. Innovations such as advanced shredding technology, automated sorting, and the development of new chemical processes have improved the recovery rates for precious metals and plastics from e-waste. These innovations not only increase the profitability of recycling but also reduce the environmental footprint of the process, making it more sustainable. As technology continues to evolve, these advancements are expected to further boost the adoption of e-waste recycling services globally.
- For instance, Recycleye and SWEEEP Kuusakoski have implemented an AI-powered sorting system that visually identifies and sorts circuit boards, batteries, and plastics with high accuracy, boosting recovery rates while enhancing safety by detecting hazardous components early in the process.
Growing Volume of E-waste Generation
The rapid pace of technological advancement and shorter product lifecycles are leading to a significant increase in the volume of e-waste generated worldwide. The widespread use of consumer electronics, IT equipment, and household appliances results in large amounts of electronic waste being discarded each year. This growing e-waste generation is driving the demand for recycling and reuse services as consumers and businesses seek responsible methods for disposal. As urbanization and technological dependence continue to rise, the volume of e-waste is expected to increase, thus further expanding the market for recycling services.
Key Trends & Opportunities
Integration of Circular Economy Models
The increasing adoption of circular economy models in the electronics industry is creating significant opportunities in the E-waste Recycling & Reuse Services market. Companies are shifting from a traditional linear production model to one that emphasizes the reuse, remanufacturing, and recycling of products and materials. This trend not only reduces environmental waste but also lowers costs for manufacturers by reintroducing valuable materials into the production cycle. The circular economy approach offers tremendous growth potential for e-waste recycling firms, as more businesses and industries seek sustainable solutions for managing electronic waste.
- For instance, Apple uses its Daisy robot to disassemble used iPhones, recovering materials like aluminum, cobalt, and gold for reuse in new devices. This supports Apple’s goal of 100% carbon neutrality across its supply chain by 2030.
Growth of E-commerce and Online Platforms
The rise of e-commerce platforms is presenting new opportunities for the E-waste Recycling & Reuse Services market. As consumers purchase electronics online, the number of discarded devices has increased, creating a larger pool of e-waste. Additionally, e-commerce platforms are integrating take-back programs and offering recycling services for old electronics to enhance sustainability efforts. This has opened new avenues for businesses in the e-waste management industry to partner with online retailers and provide convenient and eco-friendly disposal solutions to consumers, accelerating market growth.
- For instance, IBM collaborates with Earth Sense Recycle in India to manage the collection and recycling of its products at no cost to consumers, sometimes even offering reimbursements based on the product technology.
Key Challenges
Lack of Standardized Regulations
A significant challenge in the E-waste Recycling & Reuse Services market is the lack of standardized regulations across regions. While many countries have stringent e-waste management laws, these regulations often vary, creating confusion and inefficiencies for recycling firms operating internationally. The absence of globally recognized standards complicates the logistics of e-waste collection, recycling, and disposal, and hampers the seamless flow of materials across borders. This lack of regulatory uniformity remains a challenge for companies in the sector, affecting operational efficiency and increasing compliance costs.
High Cost of Recycling Infrastructure
The establishment and maintenance of e-waste recycling infrastructure require substantial investment, which can be a barrier for many companies entering the market. The cost of setting up advanced recycling facilities, procuring the necessary equipment, and ensuring compliance with environmental regulations is often prohibitively high. Smaller businesses may struggle to bear these costs, limiting competition and creating a barrier to market entry. Additionally, fluctuations in the value of recovered materials like metals can further strain the profitability of recycling operations, making financial sustainability a critical challenge.
Regional Analysis
Asia‑Pacific
The Asia‑Pacific region commands the largest share of the global e‑waste recycling and reuse services market, with 46.7% of revenue in 2024. Strong electronics consumption in densely populated countries such as China and India, combined with robust manufacturing activity and rapid device replacement cycles, drives high volumes of e‑waste. Governments across the region increasingly implement regulatory frameworks and formal recycling infrastructure, turning discarded electronics into resource streams. This dynamic, supported by rising urbanization and middle‑class growth, underpins Asia‑Pacific’s dominant role in the market.
North America
North America holds a significant share of the market, contributing 22.3% in 2024. The region is driven by high per‑capita consumption of electronics and strong regulatory pressure for proper disposal and recycling. State‑level regulations and extended producer responsibility (EPR) programmes promote certified recycling and asset‑disposition services, prompting businesses and consumers to favour formal e‑waste channels. The region’s established infrastructure, advanced recycling technologies, and corporate demand for secure data destruction and sustainable disposal keep North America competitive in the global landscape.
Europe
Europe constitutes a major regional contributor to e‑waste recycling and reuse services, accounting for 19.1% of the global market in 2024. The region is underpinned by stringent environmental regulations, widespread public awareness of sustainability, and strong circular‑economy initiatives. Regulatory frameworks such as EPR and WEEE‑driven mandates encourage consumers and businesses to return end‑of‑life electronics for refurbishment, recycling, or safe disposal. High per‑capita e‑waste generation paired with organized collection and formal recycling channels support stable demand. The maturity of recycling infrastructure further consolidates Europe’s position in the global market.
Latin America
Latin America represents a smaller yet emerging region in the global e‑waste recycling and reuse services market, with a market share of 6.5% in 2024. Growing penetration of consumer electronics and rising awareness of environmental and health hazards are beginning to drive demand for formal e‑waste services. However, constrained by limited recycling infrastructure and comparatively low formal collection rates, the region remains underdeveloped relative to Asia‑Pacific, North America, and Europe. Regulatory initiatives and investment in processing facilities could unlock potential, but current structural and logistical challenges limit short‑term growth.
Middle East & Africa (MEA)
The Middle East & Africa region holds 5.4% of the global e‑waste recycling and reuse services market in 2024. It is gradually gaining traction, driven by increasing digitization, urbanization, and rising consumption of electronic devices. Governments and private stakeholders show growing interest in establishing waste‑management and recycling infrastructure, especially in urban centers and Gulf Cooperation Council (GCC) states. However, the region faces challenges including underdeveloped collection networks, limited awareness about e‑waste hazards, and nascent regulatory frameworks. As investments in infrastructure and legislation progress, MEA could become a growth frontier for e‑waste services.
Market Segmentations:
By Service Type
- Collection
- Recycling
- Reuse
- Disposal
By Material Type
- Metals
- Plastics
- Glass
- Others
By Source
- Household Appliances
- IT and Telecommunications Equipment
- Consumer Electronics
- Industrial Equipment
By End-User
- Residential
- Commercial
- Industrial
- Government
By Geography
- North America
- Europe
- Germany
- France
- U.K.
- Italy
- Spain
- Rest of Europe
- Asia Pacific
- China
- Japan
- India
- South Korea
- South-east Asia
- Rest of Asia Pacific
- Latin America
- Brazil
- Argentina
- Rest of Latin America
- Middle East & Africa
- GCC Countries
- South Africa
- Rest of the Middle East and Africa
Competitive Landscape
The E-waste Recycling & Reuse Services market is highly fragmented with the presence of numerous global and regional players. Key companies such as Sims Recycling Solutions, Electronic Recyclers International (ERI), Veolia Environmental Services, MBA Polymers, and Umicore dominate the market, driving the industry’s growth through their advanced recycling technologies and extensive service networks. These leading players focus on innovation, offering specialized services such as the recovery of precious metals, secure data destruction, and environmental sustainability. Increasingly, companies are expanding their operations through strategic mergers, acquisitions, and partnerships to strengthen their market presence and enhance their technological capabilities. Additionally, these companies are heavily investing in the development of state-of-the-art recycling infrastructure to increase processing capacity and improve efficiency. With growing regulatory pressures and rising environmental awareness, competition in the market is expected to intensify, prompting players to focus on technological advancements and sustainability practices to stay competitive in the evolving landscape.
Key Player Analysis
- Umicore
- Global Electric Electronic Processing (GEEP)
- Stena Technoworld
- Waste Management, Inc.
- Tetronics International
- Sims Recycling Solutions
- MBA Polymers, Inc.
- Enviro‑Hub Holdings Ltd.
- Electronic Recyclers International (ERI)
- Veolia Environmental Services
Recent Developments
- In June 2025 a U.S.-based electronics recycler Ewaste+ acquired Take 2 Recycling, expanding its footprint and service offerings in the Northeast United States.
- In November 2025 a circular‑economy firm in India, Black Gold Recycling, acquired a majority stake in Reteck Envirotech Pvt. Ltd., strengthening its capabilities in electronics and lithium-ion battery recycling across India.
- In June 2025, Mitsubishi Corporation announced that it acquired shares in DEScycle Ltd. (UK), entering a strategic partnership to leverage DEScycle’s innovative metal‑recovery technology from e‑scrap.
- In November 2025, Electronic Recyclers International (ERI) partnered with ReElement Technologies to supply end‑of‑life magnet materials from electronics for rare‑earth oxide refining a step enhancing resource recovery from e‑waste.
Shape Your Report to Specific Countries or Regions & Enjoy 30% Off!
Report Coverage
The research report offers an in-depth analysis based on Service Type, Material Type, Source, End User and Geography. It details leading market players, providing an overview of their business, product offerings, investments, revenue streams, and key applications. Additionally, the report includes insights into the competitive environment, SWOT analysis, current market trends, as well as the primary drivers and constraints. Furthermore, it discusses various factors that have driven market expansion in recent years. The report also explores market dynamics, regulatory scenarios, and technological advancements that are shaping the industry. It assesses the impact of external factors and global economic changes on market growth. Lastly, it provides strategic recommendations for new entrants and established companies to navigate the complexities of the market.
Future Outlook
- The E-waste Recycling & Reuse Services market is expected to continue expanding due to increasing global e-waste generation and stricter environmental regulations.
- Advancements in recycling technologies will lead to higher efficiency and improved recovery rates for precious metals and other valuable materials.
- Consumer demand for sustainable electronics disposal solutions will drive the adoption of formal recycling channels across both households and businesses.
- The integration of circular economy principles will encourage companies to reuse, remanufacture, and recycle electronic products, creating more sustainable business models.
- Governments worldwide are expected to enforce more stringent e-waste management laws, further accelerating market growth.
- The growing prevalence of e-commerce platforms and online retail will increase the volume of e-waste, creating new opportunities for recycling services.
- The demand for secure data destruction and responsible disposal of IT and telecommunications equipment will boost the market for specialized e-waste services.
- The development of advanced e-waste processing infrastructure in emerging markets will drive regional market growth, particularly in Asia-Pacific and Latin America.
- Collaborative initiatives between the public and private sectors will create incentives for responsible e-waste recycling and support long-term sustainability goals.
- As technology continues to evolve, the need for recycling and reuse services for newer electronic products such as smartphones, electric vehicle batteries, and wearable devices will create new market opportunities.


