
Market Overview
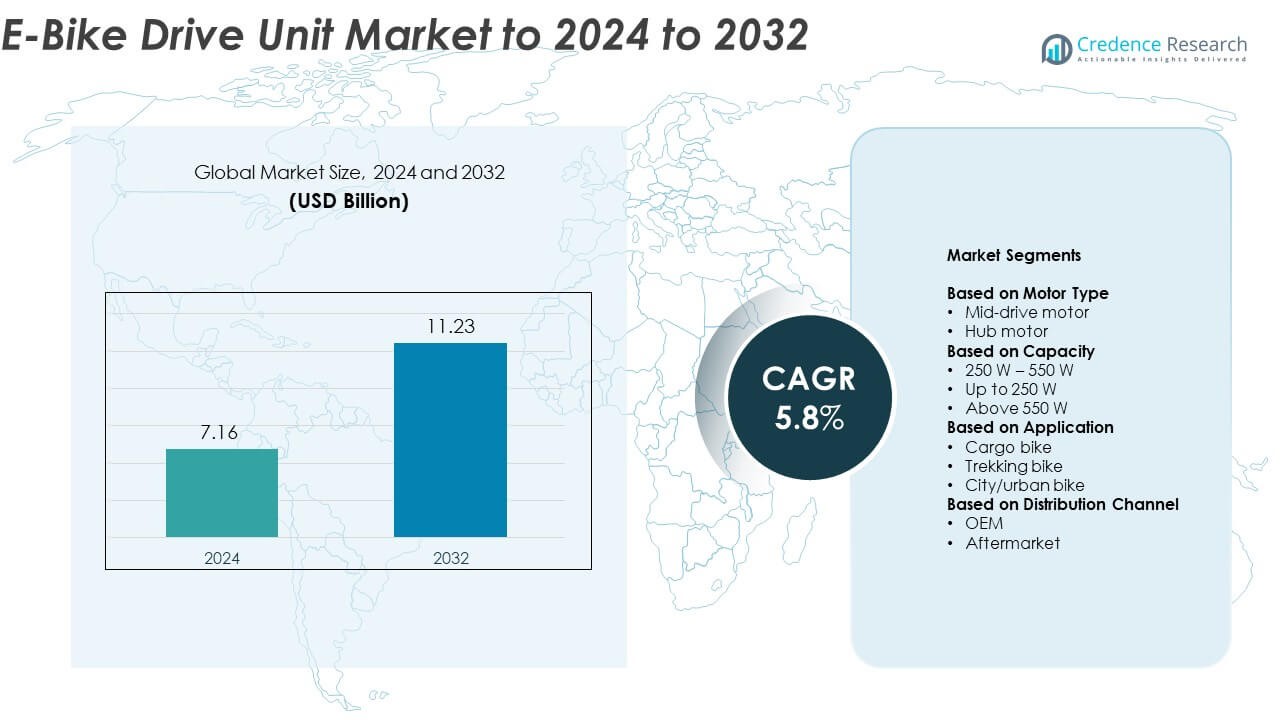
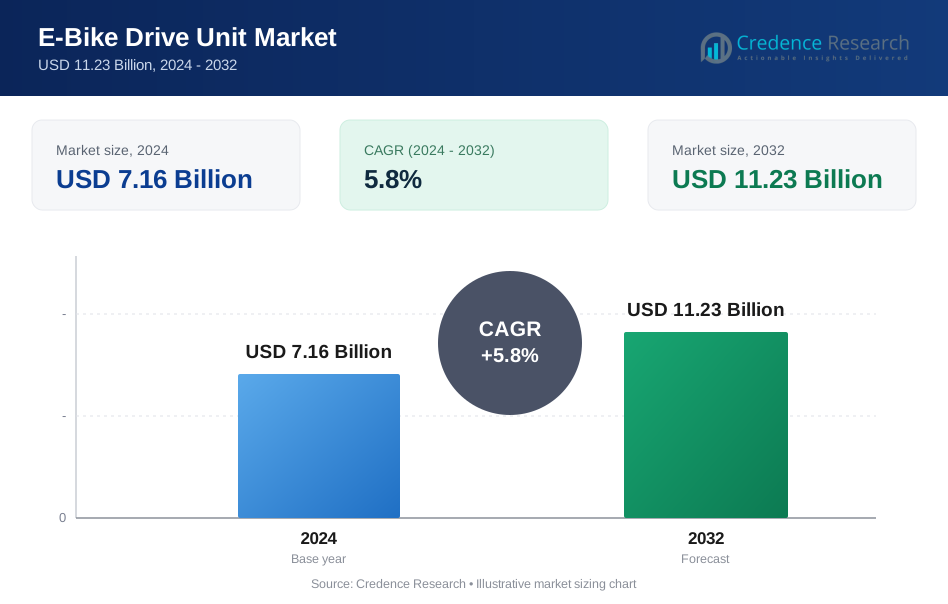
The E-Bike Drive Unit market size was valued at USD 7.16 Billion in 2024 and is anticipated to reach USD 11.23 Billion by 2032, at a CAGR of 5.8% during the forecast period.
| REPORT ATTRIBUTE | DETAILS |
|---|---|
| Historical Period | 2020-2023 |
| Base Year | 2024 |
| Forecast Period | 2025-2032 |
| E-Bike Drive Unit Market Size 2024 | USD 7.16 Billion |
| E-Bike Drive Unit Market, CAGR | 5.8% |
| E-Bike Drive Unit Market Size 2032 | USD 11.23 Billion |
The E-Bike Drive Unit market is led by major players including Robert Bosch, Shimano Inc., Yamaha, Panasonic, Bafang, Mahle GmbH, Bros, Dapu Motors, Suzhou Xiongda, and TDCM. These companies dominate through advanced motor technologies, extensive OEM collaborations, and strong product reliability. Europe remains the leading region, accounting for approximately 39.7% share in 2024, driven by widespread adoption of sustainable mobility and strong cycling infrastructure. Asia-Pacific follows with 31.4% share, supported by large-scale manufacturing and rising urban e-bike use. North America holds 21.6% share, driven by growing interest in eco-friendly transportation and premium electric bike models.
Market Insights
- The E-Bike Drive Unit market was valued at USD 7.16 Billion in 2024 and is projected to reach USD 11.23 Billion by 2032, growing at a CAGR of 5.8%.
- Growing demand for eco-friendly and cost-efficient transportation is driving market growth, supported by government incentives promoting electric mobility.
- Advancements in mid-drive motor technology and integration of smart connectivity features are shaping future trends in the market.
- The market is competitive with leading manufacturers focusing on innovation, torque optimization, and partnerships with OEMs to enhance product offerings.
- Europe leads with a 39.7% share in 2024, followed by Asia-Pacific with 31.4% and North America with 21.6%, while the mid-drive motor segment holds the dominant 61.3% share.
Market Segmentation Analysis:
By Motor Type
The mid-drive motor segment dominates the E-Bike Drive Unit market, accounting for nearly 61.3% share in 2024. This dominance is driven by its superior weight distribution, higher torque output, and improved energy efficiency compared to hub motors. Mid-drive systems enhance climbing performance and ride stability, making them ideal for trekking and performance-oriented e-bikes. Growing adoption among premium e-bike manufacturers and increasing consumer preference for smooth power delivery further reinforce the leadership of mid-drive motors in both developed and emerging markets.
- For instance, Bosch Performance Line CX (current generation) delivers 85 Nm of torque at approximately 2.8 kg of weight.
By Capacity
The 250 W – 550 W segment leads the market with approximately 47.5% share in 2024. This range offers a balanced blend of power and efficiency suitable for urban commuting and moderate off-road rides. Manufacturers prefer this category due to compliance with global e-bike regulations and optimized energy consumption. Rising demand for versatile models capable of handling varied terrains without compromising battery life supports the dominance of this capacity range. Technological upgrades in mid-range motors continue to boost their efficiency and popularity.
- For instance, Shimano EP8 is rated 250 W and outputs 85 Nm.
By Application
City or urban bikes hold the largest share of about 52.8% in 2024, reflecting the growing use of e-bikes for daily commuting and short-distance travel. Rising urban congestion and the push for eco-friendly mobility solutions have accelerated adoption in metropolitan areas. These bikes offer compact designs, efficient motors, and cost-effective operation, aligning with sustainability initiatives. Governments across Europe and Asia are supporting urban e-bike use through subsidies and infrastructure improvements, further driving demand in this segment.
Key Growth Drivers
Rising Demand for Sustainable Urban Mobility
The global shift toward eco-friendly transportation is a primary growth driver for the E-Bike Drive Unit market. Increasing environmental awareness, coupled with government incentives for electric mobility, has accelerated e-bike adoption in urban areas. Cities worldwide are expanding cycling infrastructure, making e-bikes a preferred choice for short-distance commuting. The surge in fuel prices and carbon emission concerns further strengthen the demand for efficient and clean mobility solutions, positioning e-bike drive units as a vital component of the green transport transition.
- For instance, the TQ-HPR50 system weighs 3,900 g in total (motor at approximately 1,850 g and 360 Wh battery at approximately 1,830 g) and delivers 50 Nm of torque.
Technological Advancements in Motor Efficiency
Ongoing innovation in motor design, such as torque sensors and integrated smart control systems, is boosting market growth. Modern drive units now offer enhanced torque output, longer battery life, and improved connectivity features for riders. Lightweight materials and advanced cooling mechanisms are improving performance and durability. These innovations enable smoother power delivery and better riding experience, encouraging adoption across both premium and mid-range e-bike categories. Manufacturers continue to focus on intelligent drive units for adaptive riding conditions.
- For instance, Brose Drive S Mag produces 90 Nm of torque and has a unit weight of approximately 2,900 g (2.9 kg) due to its innovative magnesium casing.
Expansion of E-Bike Infrastructure and OEM Collaborations
The rapid development of e-bike infrastructure and collaborations between motor manufacturers and OEMs are accelerating market expansion. Governments are investing in dedicated bike lanes, charging points, and urban mobility programs that support e-bike usage. OEM partnerships help integrate customized drive units into specific e-bike models, ensuring superior performance and standardization. The availability of extensive dealer networks and after-sales services also enhances consumer confidence, leading to sustained market growth across Asia-Pacific and Europe.
Key Trends & Opportunities
Integration of Smart and Connected Technologies
Smart e-bike systems equipped with GPS tracking, mobile connectivity, and IoT-based analytics are emerging as a major trend. Integration of drive units with digital platforms allows performance monitoring, predictive maintenance, and real-time diagnostics. These advancements enhance user experience and safety while supporting fleet operators in managing electric bike-sharing systems efficiently. Growing adoption of app-connected e-bikes is expected to create new opportunities for drive unit manufacturers focusing on data-driven, intelligent mobility solutions.
- For instance, the updated MAHLE X20 system features a motor that delivers a comparable performance to a mid-drive system with 65 Nm of equivalent torque, while its actual torque output at the wheel is approximately 27 Nm.
Rising Popularity of High-Torque Mid-Drive Systems
High-torque mid-drive units are gaining popularity among performance and cargo bike users. Their ability to deliver superior climbing power and balanced weight distribution enhances stability and efficiency. Manufacturers are leveraging this trend to introduce compact yet powerful mid-drive motors catering to diverse applications, from trekking to logistics. As consumer preference shifts toward premium riding experiences, this trend presents strong opportunities for drive unit producers focusing on precision engineering and adaptive torque control systems.
- For instance, The Bafang M620 (G510) is a high-power mid-drive motor that typically reaches a maximum torque of 160 Nm (some official documentation specifies up to 170 Nm), offers continuous rated power outputs of 750 W or 1000 W, and the bare motor unit weighs approximately 6.7 kg.
Key Challenges
High Cost of Advanced Drive Systems
The premium pricing of high-performance drive units remains a key challenge for widespread market penetration. Advanced systems featuring integrated sensors, smart controls, and lightweight materials increase overall e-bike costs, limiting adoption in developing economies. Cost-sensitive markets often prefer low-end hub motors, reducing revenue potential for high-end manufacturers. Balancing affordability with innovation remains a major concern, pushing producers to optimize production and supply chain efficiency while maintaining competitive quality standards.
Limited Battery Range and Power Management Issues
Battery capacity constraints and energy efficiency challenges affect the performance of e-bike drive units. High torque demand in uphill or cargo applications can drain batteries faster, leading to shorter travel ranges. Despite improvements in lithium-ion technology, range anxiety remains prevalent among users. Manufacturers are focusing on energy optimization algorithms and regenerative braking systems to overcome these limitations. However, ensuring consistent performance across varying terrains and weather conditions continues to be a major technical hurdle.
Regional Analysis
North America
North America accounts for around 21.6% share of the E-Bike Drive Unit market in 2024. The region benefits from rising health awareness, sustainable commuting preferences, and increasing adoption of electric mobility solutions. The United States leads due to strong demand for high-performance and cargo e-bikes, supported by favorable city-level electrification initiatives. Canada is also witnessing notable growth with expanding e-bike infrastructure and incentive programs. Continuous investment by OEMs in lightweight and efficient mid-drive motors supports regional expansion, while aftermarket upgrades further enhance market opportunities across metropolitan areas.
Europe
Europe dominates the E-Bike Drive Unit market with approximately 39.7% share in 2024, driven by strong environmental policies and advanced cycling infrastructure. Countries such as Germany, the Netherlands, and France lead due to widespread e-bike adoption for daily commuting. The region’s focus on sustainable mobility and emission reduction under EU Green Deal initiatives continues to support market expansion. European manufacturers are at the forefront of developing innovative mid-drive systems with enhanced torque and efficiency. Rising urban congestion and government-backed subsidy programs further stimulate sales of premium e-bikes across the continent.
Asia-Pacific
Asia-Pacific holds about 31.4% share of the global market, making it one of the fastest-growing regions. China dominates production and consumption due to strong local manufacturing capabilities and high population density in urban centers. Japan and South Korea are experiencing rapid adoption of compact and smart-connected e-bikes, supported by strong OEM networks. Government support for electric mobility and growing environmental awareness further boost demand. Continuous technological advancements and cost-effective motor designs strengthen the region’s position as a key manufacturing and export hub for e-bike drive units.
Latin America
Latin America represents nearly 4.3% share of the E-Bike Drive Unit market in 2024. The region is witnessing steady growth due to urbanization and increasing awareness of eco-friendly commuting solutions. Brazil, Mexico, and Chile are the leading markets, supported by improving cycling infrastructure and rising interest in electric two-wheelers. Limited purchasing power remains a challenge, yet affordable hub motor solutions are expanding accessibility. Market players are focusing on expanding distribution networks and introducing locally assembled models, which is expected to enhance regional adoption in the coming years.
Middle East & Africa
The Middle East & Africa accounts for around 3.0% share of the market in 2024. Growth is supported by increasing urbanization, rising fuel costs, and the gradual shift toward sustainable transport systems. Countries like the UAE and South Africa are leading adoption through smart city projects and green mobility initiatives. The market remains in a nascent stage but shows strong potential with expanding cycling infrastructure and tourism-related demand. Global manufacturers are exploring partnerships with local assemblers to establish a foothold and address rising interest in e-mobility solutions.
Market Segmentations:
By Motor Type
- Mid-drive motor
- Hub motor
By Capacity
- 250 W – 550 W
- Up to 250 W
- Above 550 W
By Application
- Cargo bike
- Trekking bike
- City/urban bike
By Distribution Channel
- OEM
- Aftermarket
By Geography
- North America
- U.S.
- Canada
- Mexico
- Europe
- Germany
- France
- U.K.
- Italy
- Spain
- Rest of Europe
- Asia Pacific
- China
- Japan
- India
- South Korea
- South-east Asia
- Rest of Asia Pacific
- Latin America
- Brazil
- Argentina
- Rest of Latin America
- Middle East & Africa
- GCC Countries
- South Africa
- Rest of the Middle East and Africa
Competitive Landscape
The competitive landscape of the E-Bike Drive Unit market features prominent players such as Robert Bosch, Shimano Inc., Yamaha, Panasonic, Bafang, Mahle GmbH, Bros, Dapu Motors, Suzhou Xiongda, and TDCM. The market is characterized by continuous innovation, strategic partnerships, and technological advancement in motor design, efficiency, and connectivity. Leading manufacturers are emphasizing smart systems integration, lightweight construction, and enhanced torque performance to cater to diverse e-bike categories. Increasing investment in research and development supports the creation of compact and energy-efficient drive units tailored to different applications such as city, trekking, and cargo e-bikes. Companies are also expanding their global presence through collaborations with OEMs to strengthen product customization and supply reliability. The growing demand for connected e-mobility solutions and regulatory support for sustainable transport are expected to intensify competition, encouraging firms to focus on performance optimization and digital features to maintain market leadership.
Key Player Analysis
- Robert Bosch
- Shimano Inc.
- Yamaha
- Panasonic
- Bafang
- Mahle GmbH
- Bros
- Dapu Motors
- Suzhou Xiongda
- TDCM
Recent Developments
- In 2025, Bafang launched the H730 hub motor featuring a 3-speed automatic gearbox that shifts gears based on riding speed without rider input.
- In 2024, Bosch eBike Systems unveiled new features, including AI-powered navigation and expanded eShift solutions for advanced gear-shifting, as part of their smart system updates for Model Year 2025.
- In 2024, Yamaha Motor's manufacturing subsidiary in France launched local production of the lightweight and powerful PW-S2 drive units for the European market to streamline logistics and reduce lead times.
Report Coverage
The research report offers an in-depth analysis based on Motor Type, Capacity, Application, Distribution Channel and Geography. It details leading market players, providing an overview of their business, product offerings, investments, revenue streams, and key applications. Additionally, the report includes insights into the competitive environment, SWOT analysis, current market trends, as well as the primary drivers and constraints. Furthermore, it discusses various factors that have driven market expansion in recent years. The report also explores market dynamics, regulatory scenarios, and technological advancements that are shaping the industry. It assesses the impact of external factors and global economic changes on market growth. Lastly, it provides strategic recommendations for new entrants and established companies to navigate the complexities of the market.
Future Outlook
- Demand for mid-drive motors will continue to grow due to superior efficiency and control.
- Smart connectivity and IoT integration will enhance performance monitoring and maintenance.
- Lightweight and compact motor designs will gain popularity among urban commuters.
- OEM collaborations will increase to deliver customized and integrated drive unit solutions.
- Battery efficiency improvements will extend riding range and reduce charging frequency.
- Government incentives will support e-bike adoption across major urban centers worldwide.
- Advancements in torque sensor technology will improve riding comfort and safety.
- Asia-Pacific will remain a major manufacturing and export hub for drive units.
- The aftermarket segment will expand with growing demand for motor upgrades and replacements.
- Sustainability and emission reduction goals will continue to drive innovation in electric mobility.
Request a Free Sample
Fill in your details and we'll send you a free sample report.
- Sample data tables & charts
- Research methodology
Need a Custom Version of This Report?
Tailor the scope, geography, or segments to your exact requirements.
- Custom geography or segment scope
- Direct access to our analyst team
Frequently Asked Questions
What is the current market size for E-Bike Drive Unit Market, and what is its projected size in 2032?
At what Compound Annual Growth Rate is the E-Bike Drive Unit Market projected to grow between 2025 and 2032?
Which E-Bike Drive Unit Market segment held the largest share in 2024?
What are the primary factors fueling the growth of the E-Bike Drive Unit Market?
Who are the leading companies in the E-Bike Drive Unit Market?
Which region commanded the largest share of the E-Bike Drive Unit Market in 2024?
Table of Content
Chapter 1. Report Introduction
- 1.1 Report Description & Purpose
- 1.1.1 Report Title & Market Definition
- 1.1.2 Unique Selling Propositions (USP) & Key Differentiators
- 1.1.3 Value Proposition for Stakeholders
- 1.2 Research Objectives
- 1.2.1 Market Sizing Objectives (Volume & Revenue)
- 1.2.2 Segmentation Objectives
- 1.2.3 Competitive Intelligence Objectives
- 1.2.4 Forecast & Scenario Objectives
- 1.3 Report Scope
- 1.3.1 E-Bike Drive Unit Scope – Types & Subtypes Covered
- 1.3.2 Geographic Scope – Regions & Countries Covered
- 1.3.3 Historical Period, Base Year & Forecast Period (2024; forecast to 2032)
- 1.3.4 Inclusions & Exclusions
- 1.4 HS Code & Classification Framework
- 1.5 Currency, Units & Pricing Basis
- 1.6 Target Stakeholders
- 1.7 Limitations & Assumptions
Chapter 2. Executive Summary
- 2.1 Global E-Bike Drive Unit Market Snapshot
- 2.1.1 Market Size – Historical (2024) & Forecast (2024-2032) (2024: USD 7.16 Billion → 2032: USD 11.23 Billion)
- 2.1.2 Volume & Revenue – Global Totals
- 2.1.3 Key Market Highlights – Top Five Facts
- 2.2 E-Bike Drive Unit Market Segmentation Snapshot
- 2.2.1 Market Split by Region – 2024 vs. 2032
- 2.3 Competitive Snapshot
- 2.3.1 Top 10 Players by Revenue Share – 2024
- 2.3.2 Top 10 Players by Volume Share – 2024
- 2.3.3 Recent Strategic Developments (18-Month Summary)
- 2.4 Key Investment Highlights & Strategic Conclusions
Chapter 3. E-Bike Drive Unit Market Dynamics & Industry Analysis
- 3.1 Market Overview & Context
- 3.1.1 E-Bike Drive Unit Market Position in the Broader Automotive Value Chain
- 3.1.2 OEM vs. Replacement Market Dynamics
- 3.1.3 Market Maturity & Development Stage by Region
- 3.2 E-Bike Drive Unit Market Drivers
- 3.3 E-Bike Drive Unit Market Restraints & Challenges
- 3.4 E-Bike Drive Unit Market Opportunities
- 3.5 Porter's Five Forces Analysis
- 3.5.1 Threat of New Entrants
- 3.5.2 Bargaining Power of Suppliers
- 3.5.3 Bargaining Power of Buyers
- 3.5.4 Threat of Substitutes
- 3.5.5 Competitive Rivalry – Intensity Assessment
- 3.6 E-Bike Drive Unit Value Chain Analysis
- 3.6.1 Upstream – Raw Material/Input Suppliers
- 3.6.1.1 Raw Material/Input 1
- 3.6.1.2 Raw Material/Input 2
- 3.6.1.3 Raw Material/Input 3
- 3.6.2 Midstream – Production/Manufacturing/Service Delivery
- 3.6.2.1 Production/Process Overview
- 3.6.2.2 Key Facility Locations & Capacity by Manufacturer
- 3.6.3 Downstream – Distribution & End Consumer
- 3.6.3.1 Primary Channel – B2B/OEM
- 3.6.3.2 Secondary Channels – Dealer, Retail, Online, Direct
- 3.6.4 Value Chain Profitability Analysis
- 3.6.1 Upstream – Raw Material/Input Suppliers
- 3.7 PESTEL Analysis
- 3.7.1 Political Factors
- 3.7.2 Economic Factors
- 3.7.3 Social Factors
- 3.7.4 Technological Factors
- 3.7.5 Environmental Factors
- 3.7.6 Legal Factors
- 3.8 E-Bike Drive Unit Supply Chain Analysis
- 3.8.1 Raw Material/Input Supply Risk Assessment
- 3.8.2 Manufacturing Concentration Risk (Geographic Exposure)
- 3.8.3 Trade Disruption Impact Analysis
- 3.9 Regulatory & Policy Landscape
Note: The regulatory and policy landscape section covers regulations based on their applicability to the market, E-Bike Drive Unit category, geography, and scope of the study. Only regulatory frameworks with a material impact on operations, compliance, trade, sustainability, or market access are analyzed in detail.
Chapter 4. Key Investment Pockets & Opportunity Analysis
- 4.1 E-Bike Drive Unit Market Attractiveness Analysis
- 4.1.1 By Region – Investment Attractiveness Matrix (Volume × CAGR)
- 4.2 Absolute Revenue Growth Opportunity
- 4.2.1 By Region – Absolute USD Growth Through 2032
- 4.3 Incremental Volume Opportunity
- 4.3.1 By Region – Incremental Volume Through 2032
- 4.3.2 Segment – Incremental Volume
- 4.4 Emerging Submarket Opportunity Deep Dive (Subject to Applicability)
- 4.5 Emerging Market Opportunity Scorecards
- 4.5.1 United States
- 4.5.2 Europe
- 4.5.3 Asia
- 4.5.4 Middle East & Africa
Note: Emerging Market Opportunity Scorecards will be included based on relevance and strategic importance. Regions listed are indicative and may vary depending on data availability and market dynamics.
Chapter 5. E-Bike Drive Unit Import-Export Analysis & Trade Flows
- 5.1 Global Trade Overview
- 5.1.1 Global Export Value by Country (2024)
- 5.1.2 Global Export Volume by Country (2024)
- 5.1.3 Global Import Value by Country (2024)
- 5.1.4 Global Import Volume by Country (2024)
- 5.1.5 Net Trade Balance by Country (2024)
- 5.2 Export Analysis – Segment
- 5.2.1 Type 1 (HS Code)
- 5.2.2 Type 2 (HS Code)
- 5.2.3 Type 3 (HS Code)
- 5.2.4 Type 4 (HS Code)
- 5.2.5 Type 5 (HS Code)
- 5.3 Import Analysis – Segment
- 5.3.1 Type 1 (HS Code)
- 5.3.2 Type 2 (HS Code)
- 5.3.3 Type 3 (HS Code)
- 5.3.4 Type 4 (HS Code)
- 5.3.5 Type 5 (HS Code)
- 5.4 Average Unit Trade Prices
- 5.4.1 Average Export Price – Segment & Country
- 5.4.2 Average Import Price – Segment & Source Country
- 5.4.3 Price Trends (2024)
- 5.5 Key Trade Route Analysis
- 5.5.1 Trade Route 1
- 5.5.2 Trade Route 2
- 5.5.3 Trade Route 3
- 5.5.4 Trade Route 4
- 5.5.5 Trade Route 5
- 5.6 Trade Policy Impact Assessment
- 5.6.1 US Anti-Dumping & Section 301 Tariffs
- 5.6.2 EU Customs Union Impact
- 5.6.3 Major Free Trade Agreements
- 5.6.4 USMCA Rules of Origin
Note: Trade policy analysis will be included only where relevant to the E-Bike Drive Unit market.
Chapter 6. Competitive Landscape & Company Benchmarking
- 6.1 E-Bike Drive Unit Market Concentration & Structure
- 6.1.1 Herfindahl-Hirschman Index (HHI) – vs. 2024
- 6.1.2 Tier 1, Tier 2 & Tier 3 Market Structure
- 6.1.3 Global, Regional & Local Player Dynamics
- 6.2 E-Bike Drive Unit Market Share Analysis – 2024
- 6.2.1 Global Revenue Share by Company
- 6.2.2 Global Volume Share by Company
- 6.2.3 Regional Revenue Share
- 6.2.4 Market Share Evolution ( vs. 2024)
- 6.2.5 OEM Segment Share by Company
- 6.2.6 Replacement Segment Share by Company
- 6.3 Production/Delivery Capacity & Facility Analysis
- 6.3.1 Global Installed Capacity
- 6.3.2 Capacity Utilization Rates
- 6.3.3 Production/Output Volume
- 6.3.4 Facility Locations & Capacity Map
- 6.3.5 Planned Capacity Additions
- 6.4 E-Bike Drive Unit Competitive Benchmarking Matrix
- 6.4.1 Revenue, Volume, CAGR & Profitability Comparison
- 6.4.2 Channel Revenue Mix
- 6.4.3 Geographic Revenue Exposure
- 6.4.4 R&D Intensity
- 6.4.5 Sustainability Maturity
- 6.5 Strategic Developments in E-Bike Drive Unit (Last 24 Months)
- 6.5.1 Mergers, Acquisitions & Divestments
- 6.5.2 New E-Bike Drive Unit Launches
- 6.5.3 Facility Expansions
- 6.5.4 Strategic Alliances, Joint Ventures & Partnerships
- 6.5.5 Distribution Expansion & Market Entry
- 6.5.6 Sustainability & ESG Initiatives
- 6.6 Competitive Strategy Mapping
- 6.6.1 Leader, Challenger, Follower & Niche Classification
- 6.6.2 Pricing Strategy Comparison
- 6.6.3 Channel Strategy Matrix
Note: Strategic developments are included based on their materiality and the availability of reliable information.
Chapter 7. Global E-Bike Drive Unit Market – By Distribution Channel
- 7.1 Segment Overview
- 7.1.1 Volume & Revenue Split by Channel (2024 & 2032)
- 7.1.2 Channel Mix Evolution (2024-2032)
Chapter 8. Regional Market Analysis – Global Overview
- 8.1 Global Regional Overview
- 8.1.1 Regional Volume Share
- 8.1.2 Regional Revenue Share
- 8.1.3 Regional Volume by Region
- 8.1.4 Regional Revenue by Region
- 8.1.5 Regional Forecast Through 2032
- 8.2 Cross-Regional Segment Analysis
- 8.2.1 By Distribution Channel
- 8.2.2 By Brand/Price Tier
Chapter 9. North America E-Bike Drive Unit Market
- 9.1 United States
- 9.2 Canada
- 9.3 Mexico
Chapter 10. Europe E-Bike Drive Unit Market
- 10.1 Germany
- 10.2 France
- 10.3 Italy
- 10.4 United Kingdom
- 10.5 Spain
- 10.6 Poland
- 10.7 Russia
- 10.8 Netherlands
- 10.9 Belgium
- 10.10 Sweden
- 10.11 Denmark
- 10.12 Norway
- 10.13 Rest of Europe
Chapter 11. Asia Pacific E-Bike Drive Unit Market
- 11.1 China
- 11.2 India
- 11.3 Japan
- 11.4 South Korea
- 11.5 Thailand
- 11.6 Indonesia
- 11.7 Vietnam
- 11.8 Malaysia
- 11.9 Australia
- 11.10 Rest of Asia Pacific
Chapter 12. Latin America E-Bike Drive Unit Market
- 12.1 Brazil
- 12.2 Argentina
- 12.3 Colombia
- 12.4 Chile
- 12.5 Rest of Latin America
Chapter 13. Middle East E-Bike Drive Unit Market
- 13.1 Saudi Arabia
- 13.2 United Arab Emirates
- 13.3 Turkey
- 13.4 Israel
- 13.5 Iran
- 13.6 Rest of the Middle East
Chapter 14. Africa E-Bike Drive Unit Market
- 14.1 South Africa
- 14.2 Egypt
- 14.3 Nigeria
- 14.4 Morocco
- 14.5 Rest of Africa
Chapter 15. E-Bike Drive Unit Company Profiles
- 15.1 [Company 01]
- 15.1.1 Company Overview
- 15.1.2 Key Management Personnel
- 15.1.3 Products & Services Portfolio
- 15.1.4 Financial Performance
- 15.1.5 Key Market Focus & Geographic Presence
- 15.1.6 Recent Developments & Strategic Initiatives
Note: The company profile list is preliminary and may change based on research findings, market developments, data availability, and client requirements.
Chapter 16. Appendices
- Appendix A – List of Abbreviations & Acronyms
- Appendix B – Industry Classification Code Reference – Full Series
- Appendix C – Production & Capacity Data Tables
- Appendix D – End-Use & Demand Base Tables
- Appendix E – Consumption & Replacement Rate Assumptions
- Appendix F – ASP Reference Tables
- Appendix G – Manufacturing & Facility Database
- Appendix H – Import-Export Data Tables
- Appendix I – Regulatory Summary Tables
- Appendix J – Primary Research Participant List (Anonymized)
- Appendix K – Primary Research Questionnaire Framework
- Appendix L – Data Sources & Bibliography
- Appendix M – Market Size Divergence & Source Comparison
Chapter 17. Research Methodology
- 17.1 Research Framework & Philosophy
- 17.2 Secondary Research – Sources, Hierarchy & Data Extraction
- 17.3 Data Modeling – Bottom-Up & Top-Down Market Sizing
- 17.4 Primary Research – Stakeholder Framework, LOI & Sample Sizes
- 17.5 Forecast Methodology – Regression, Scenario & Sensitivity Analysis
- 17.6 Quality Control – Four-Layer Validation Framework
- 17.7 Limitations & Standard Assumptions
- 17.8 Disclaimer
