
Per-kilometer contracts turn city fleets into a service
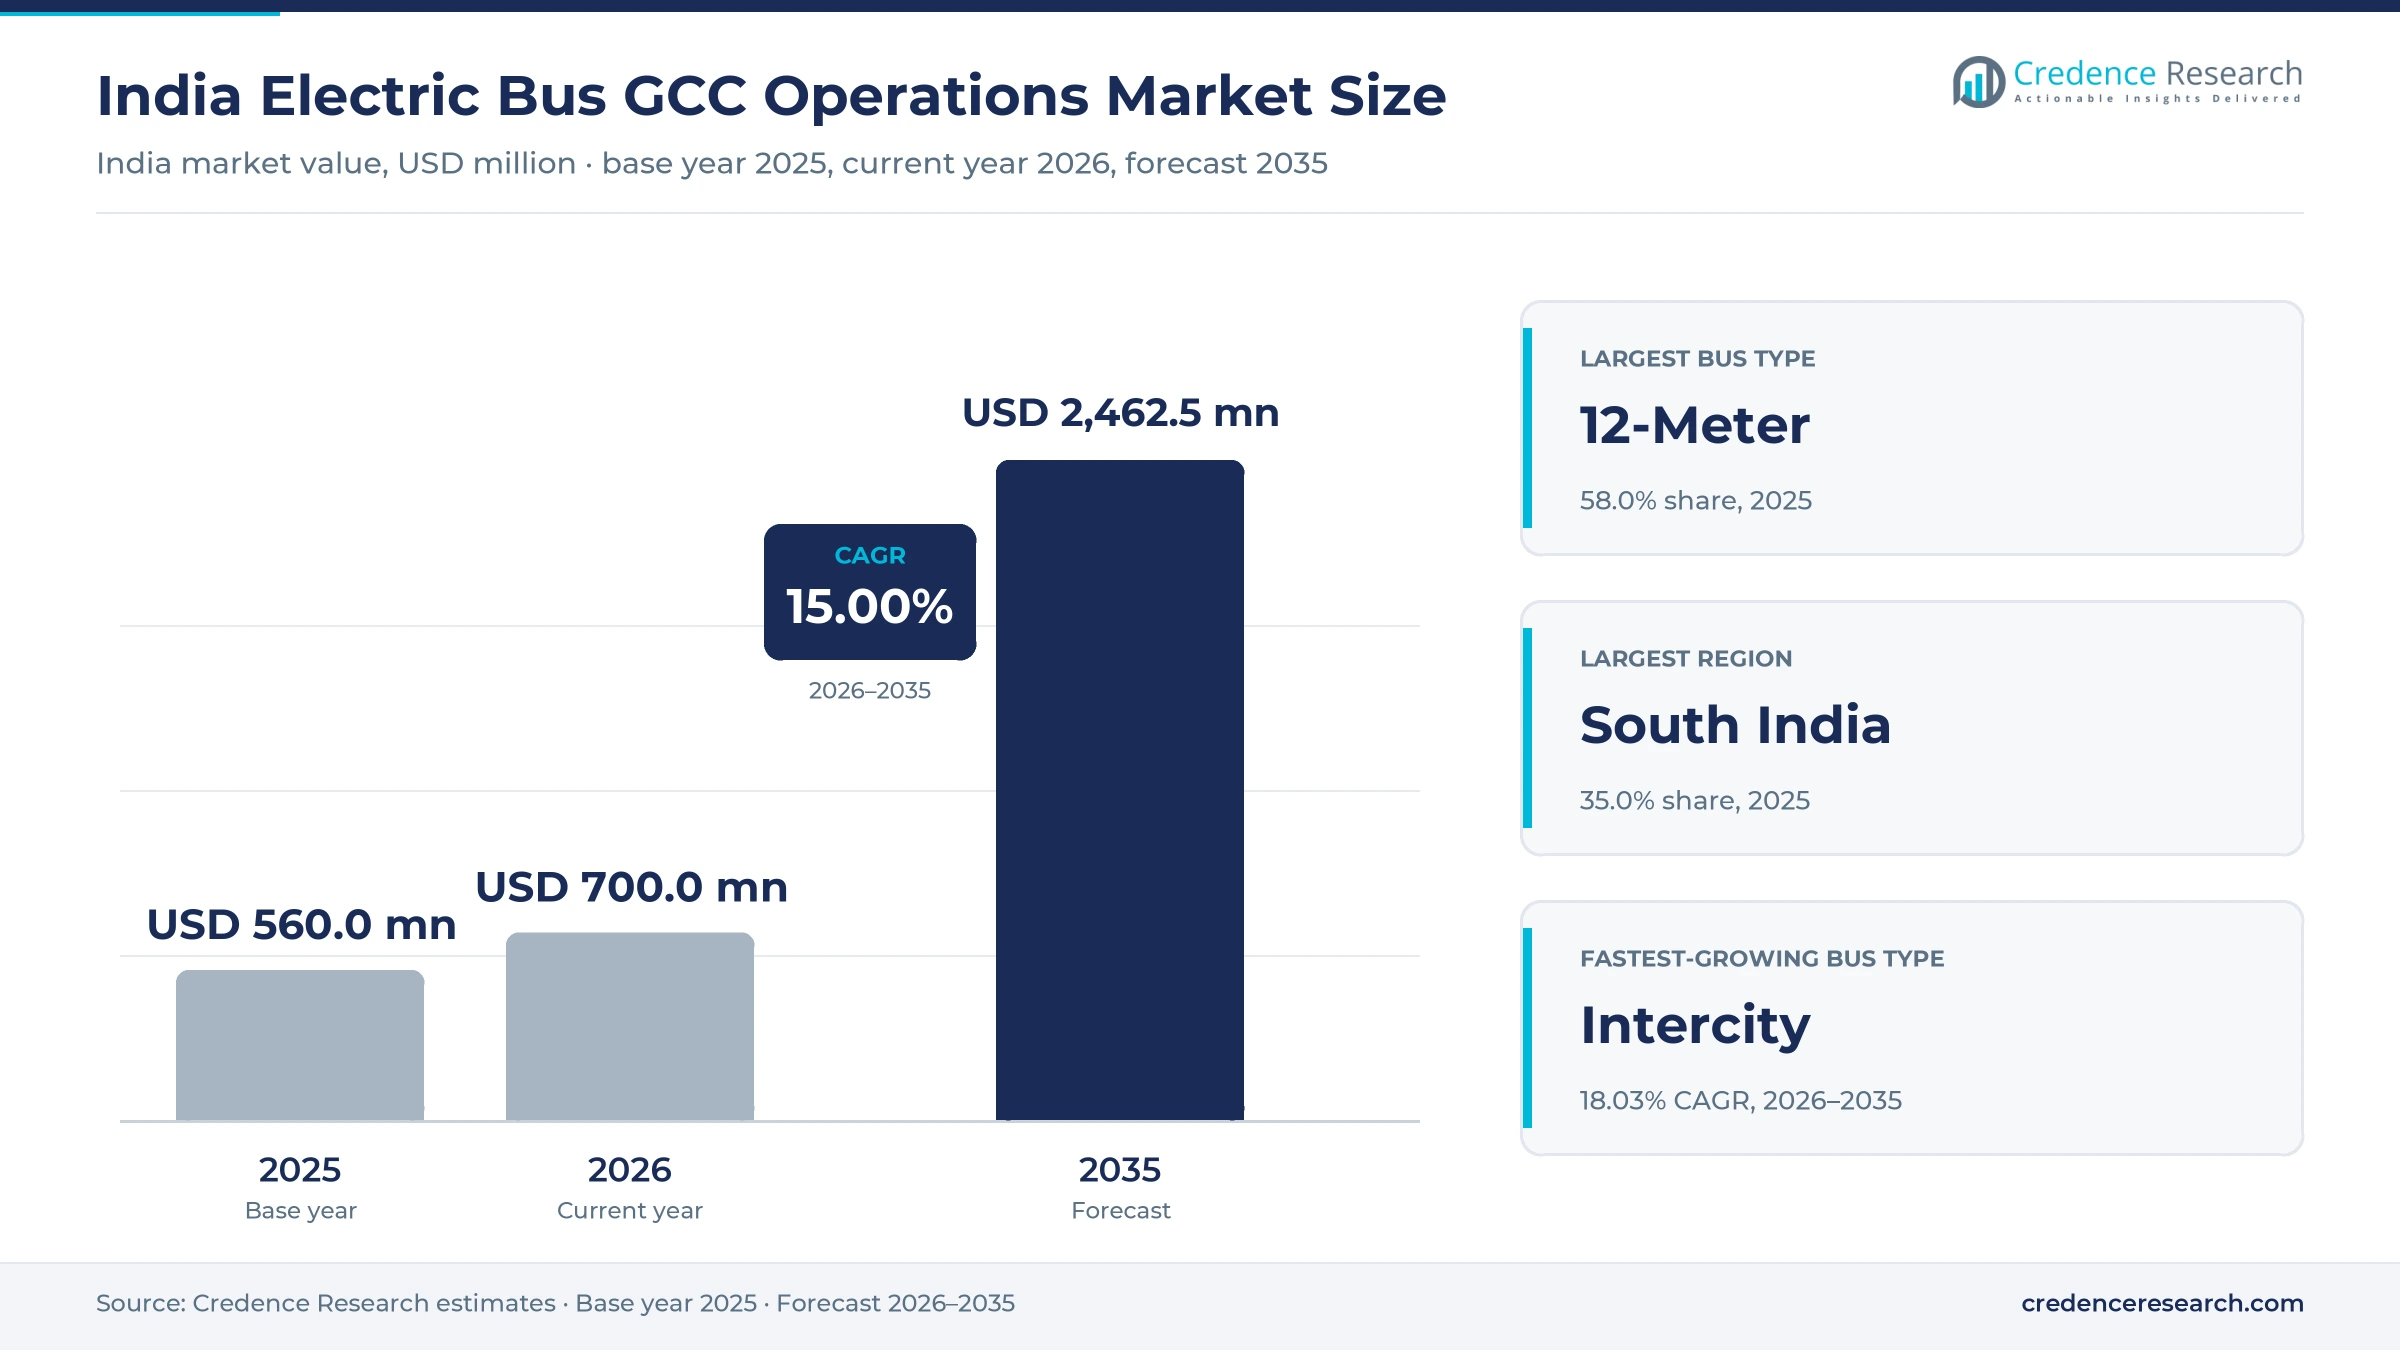
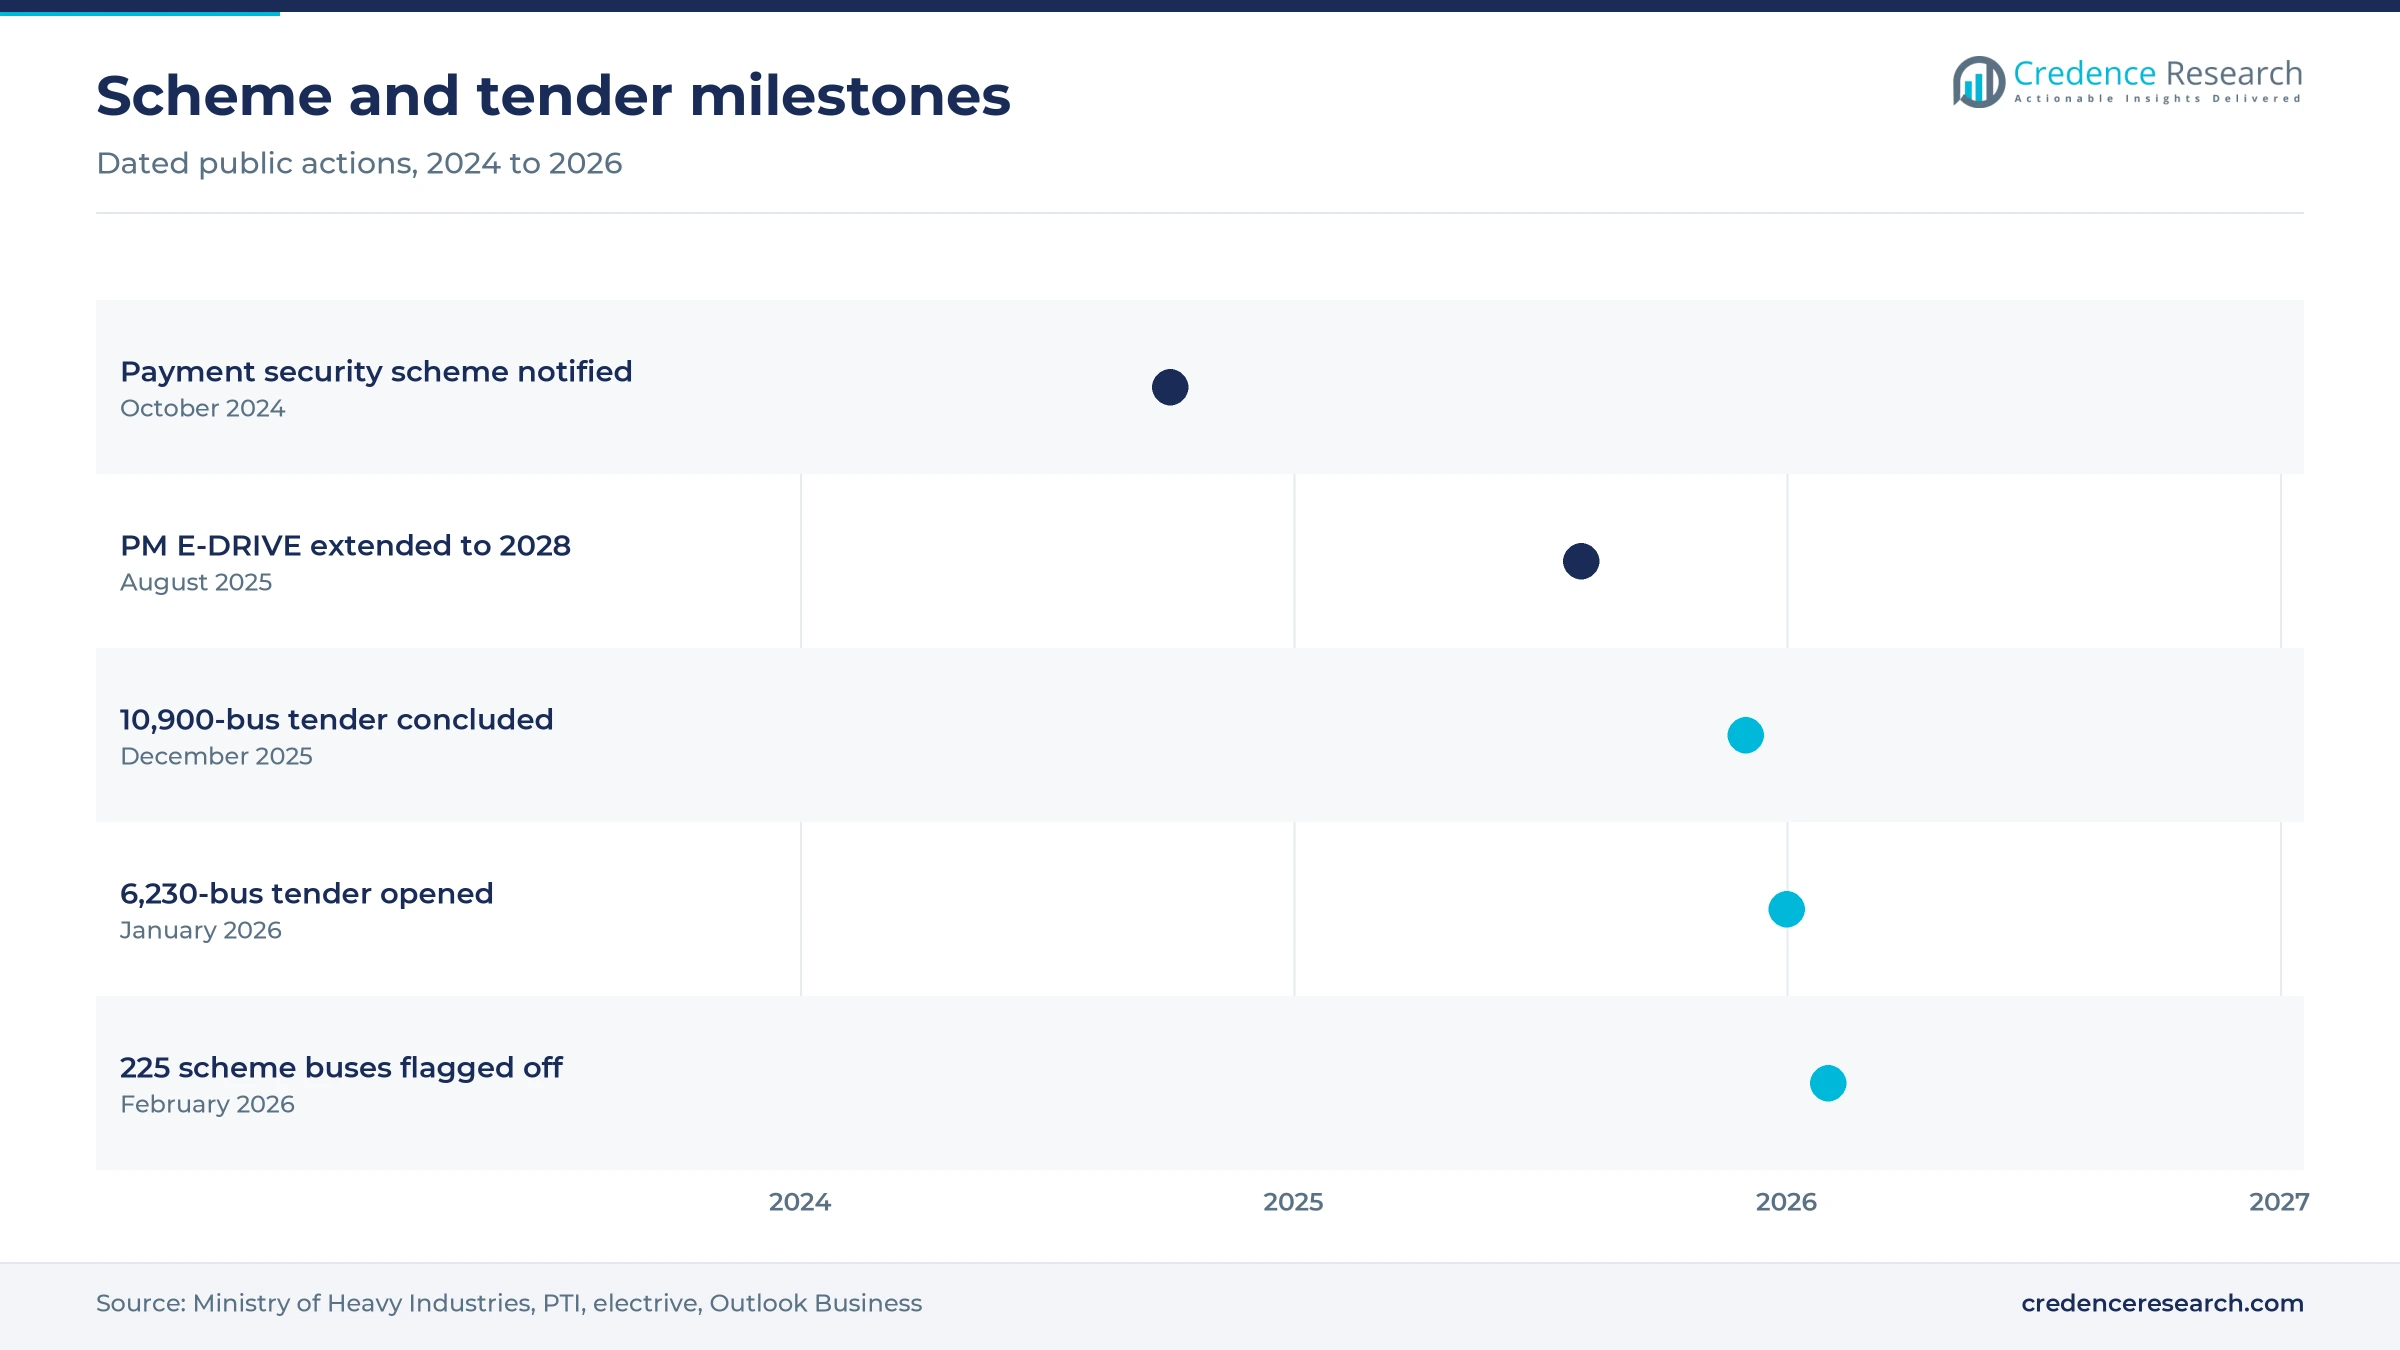
The India electric bus GCC operations market was valued at USD 560.0 million in 2025 and is projected to increase from USD 700.0 million in 2026 to USD 2.46 billion by 2035, registering a CAGR of 15.00% during 2026–2035. Demand comes from state and city transport agencies that pay private operators a fixed fee per kilometer instead of buying vehicles, leaving the operator to own, run and maintain each bus. South India held the largest regional share, 35.0% in 2025, because Bengaluru and Hyderabad hold big scheme allocations and Chennai pays among the highest published per-kilometer rates. Central India is the fastest-growing region at 15.94% a year as Madhya Pradesh cities start their scheme services. The commercial structure is also changing, since the central payment security scheme notified on Oct. 28, 2024, now backs each deployed bus for up to 12 years.
What does the GCC operating market count in India?
The market counts per-kilometer fees that public transport authorities pay private operators for electric buses under gross cost contracts, including 9-meter, 12-meter and intercity vehicles. Fees cover the bus, the driver, maintenance, charging equipment and energy management, while the agency usually supplies the depot and the conductor and keeps the fare revenue.
Outright vehicle sales, fare income, depot civil works paid for by government and diesel or CNG contracts are excluded from the count. The value chain runs from bus makers and financiers through operating companies and depot charging suppliers to the transport corporations that schedule routes and pay monthly invoices.
India Electric Bus GCC Operations Market Insights
- The market grows from USD 560.0 million in 2025 to USD 2.46 billion by 2035, a 15.00% CAGR over 2026–2035, as scheme tenders convert public bus fleets to contracted operation.
- South India led with 35.0% of 2025 value, close to its 37.9% portion of the 23,800 buses sanctioned under the two central schemes.
- 12-Meter buses led with 58.0% of 2025 value, supported by awards such as 815 such buses for Hyderabad in March 2026.
- Convergence Energy Services Limited closed its largest electric bus tender on Dec. 24, 2025, and opened another for 6,230 buses in January 2026.
- PMI Electro Mobility won 5,210 buses and EKA Mobility won 3,485 in that first PM E-DRIVE round, a concentrated start for the next contract cycle.
Standard buses lead as central schemes start from a low base
Why do 12-meter buses still earn the largest fee share?
Based on bus type, the market is categorized into 12-Meter, 9-Meter and Intercity vehicles. 12-Meter buses led with 58.0% of 2025 value because large corridors still favor standard vehicles, and the Telangana award to Evey Trans covered 1,085 12-meter buses, according to Autocar Professional in February 2026. Intercity coaches grow fastest at 18.03% a year as private networks electrify, with Switch Mobility supplying 25 EiV12 coaches to Purple Bus for the Mumbai–Pune route, according to Pulse in April 2026. Shorter buses are also gaining, since the January 2026 tender listed 2,330 nine-meter buses for Delhi.
Why do state contracts lead while central schemes ramp up?
Based on program, the market is categorized into State, PM e-Bus Sewa and PM E-DRIVE contracts. State contracts led with 92.0% of 2025 value because agreements signed by state and city agencies, many with earlier central subsidy, formed the operating fleet while the new schemes were only starting. The housing minister told the Rajya Sabha in March 2026 that just 225 PM e-Bus Sewa buses had been delivered a month earlier, according to Outlook Business. PM E-DRIVE grows fastest at 40.12% a year from that low base, as the Ministry of Heavy Industries reported concluded tenders for 10,900 buses by Feb. 28, 2026.
How do assured kilometers shape operator income?
Based on revenue, the market is categorized into Assured-Kilometer Fees and Excess-Kilometer Fees, both paid per kilometer under gross cost contracts. Assured-Kilometer Fees led with 93.0% of 2025 value because agencies commit to a minimum run, such as the 200 kilometers a day per bus that Chennai assures OHM Global Mobility, according to DT Next. Excess-Kilometer Fees grow fastest at 17.59% a year as operators schedule charging to stretch daily runs. Chartered Speed director Sanyam Gandhi told EVreporter in April 2025 that buses reach cost parity with diesel at around 200 kilometers a day, which strengthens this incentive.
| Segment Group | Leading Sub-segment | Share, 2025 | Fastest-growing Sub-segment | CAGR, 2026–2035 |
|---|---|---|---|---|
| By Bus Type | 12-Meter | 58.0% | Intercity | 18.03% |
| By Program | State | 92.0% | PM E-DRIVE | 40.12% |
| By Revenue | Assured-Kilometer Fees | 93.0% | Excess-Kilometer Fees | 17.59% |
Request a Free Sample
Fill in your details and we'll send you a free sample report.
- Sample data tables & charts
- Research methodology
Tenders, 12-year terms and payment cover pull in operators
City tenders expand gross-cost-contract operating fleets
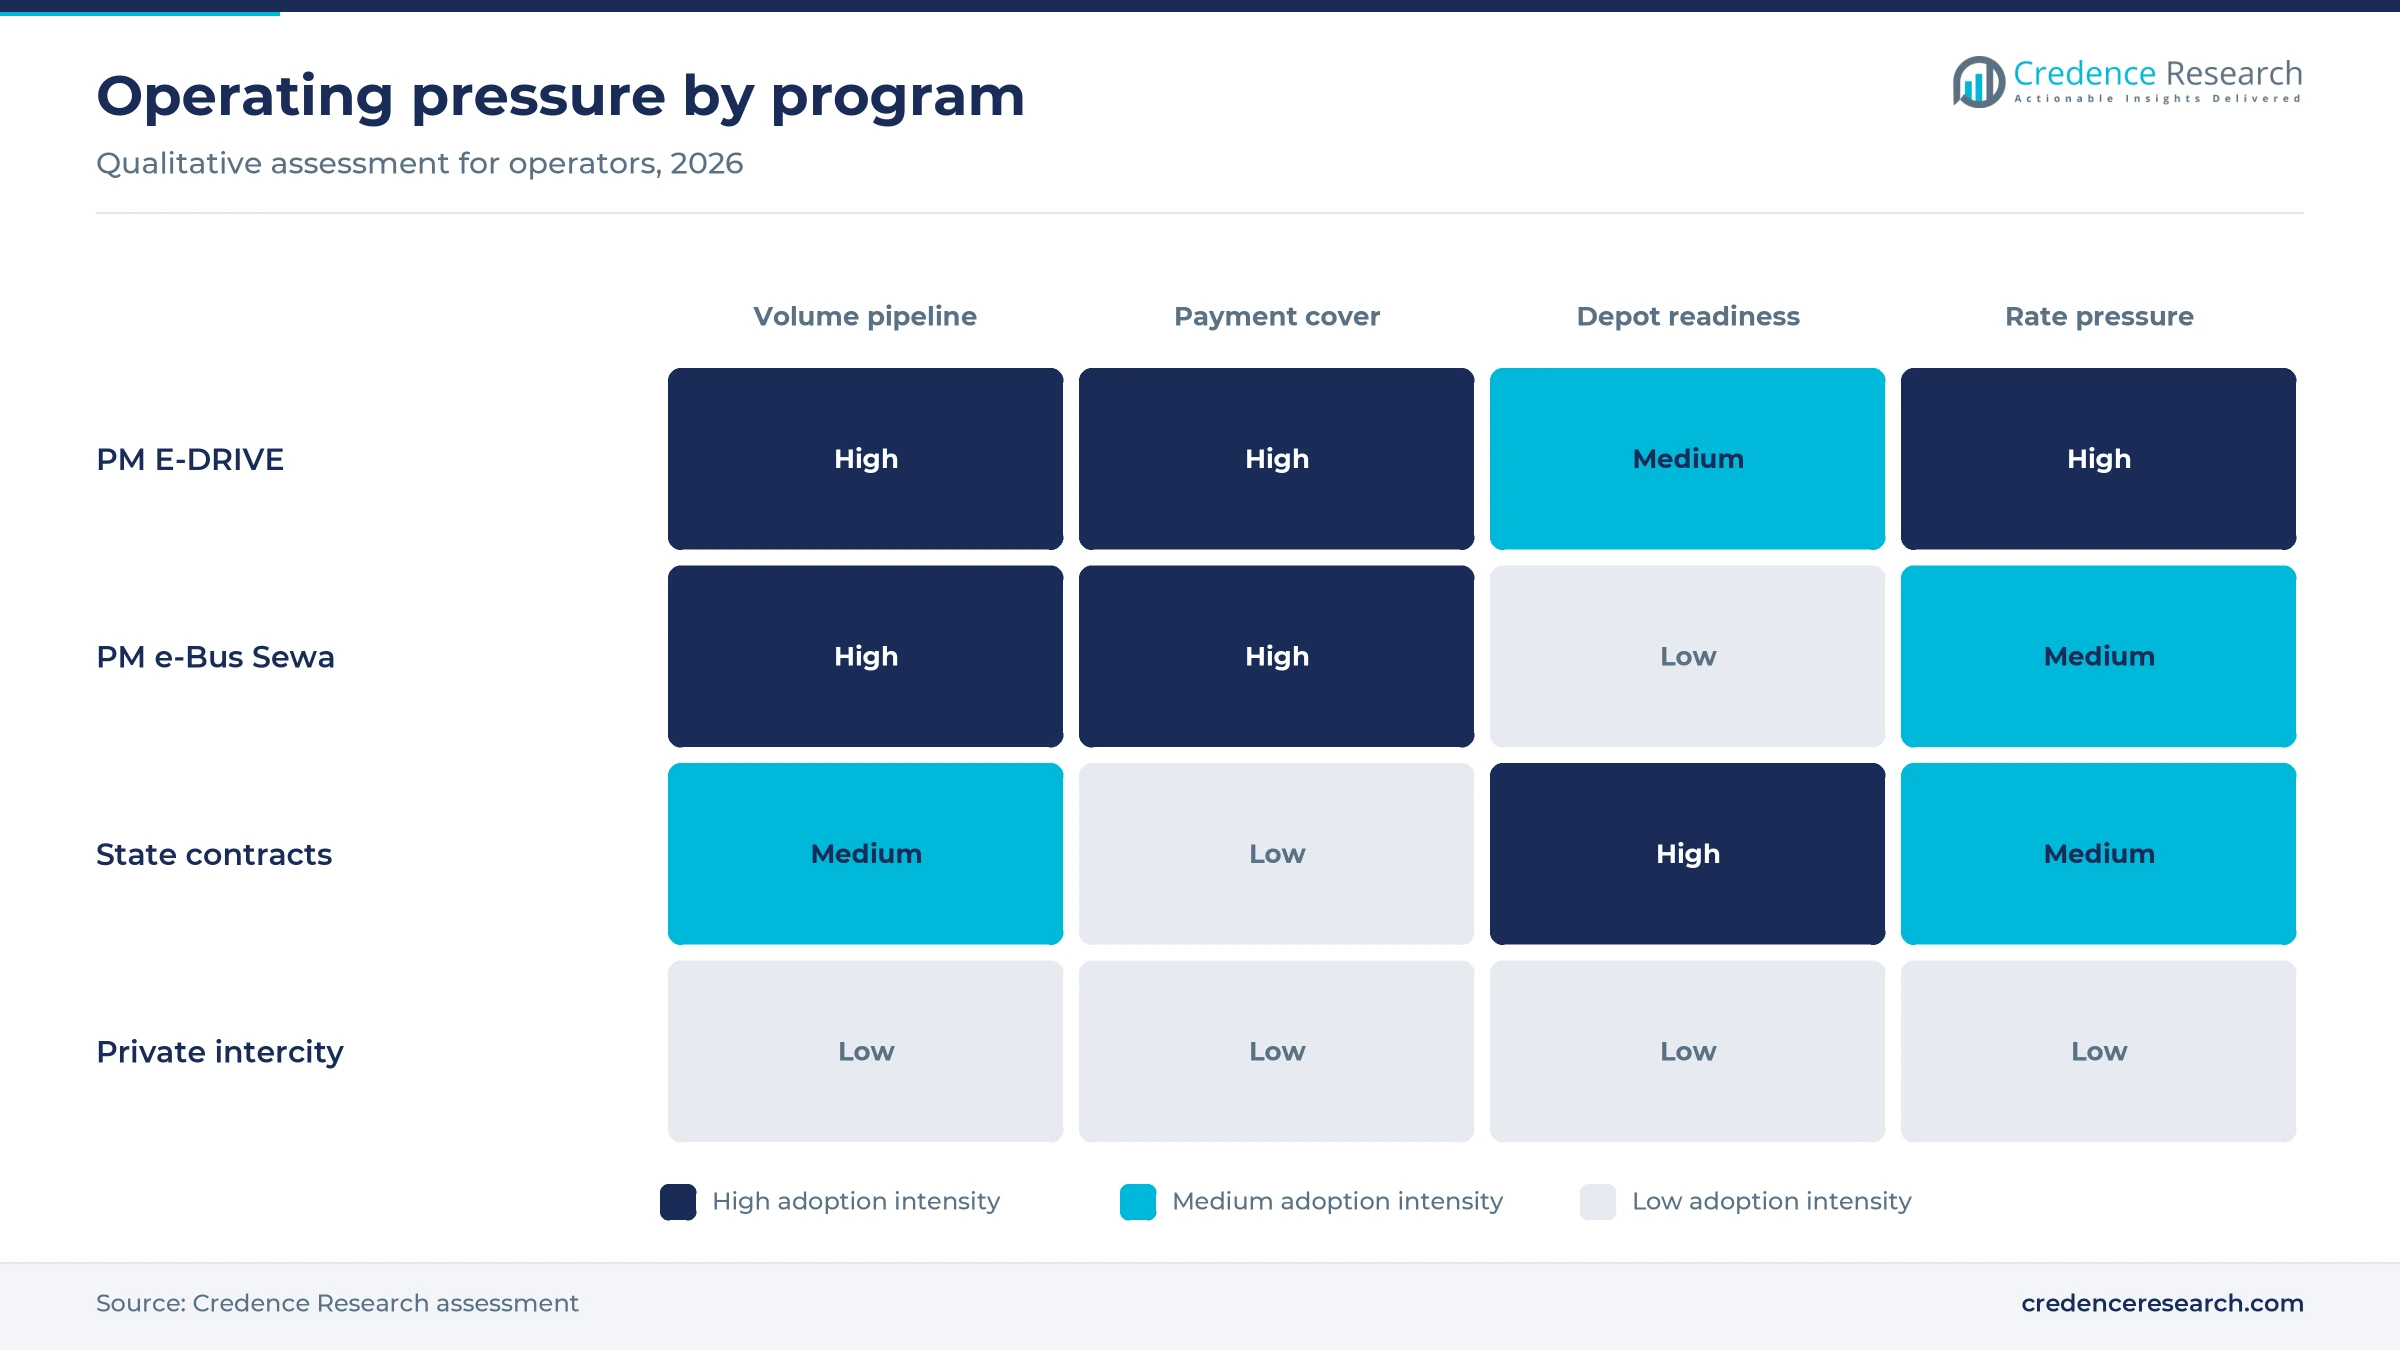
Aggregated city tenders are the largest source of new contracted kilometers because each award adds a 12-year payment stream. Convergence Energy Services Limited concluded its PM E-DRIVE round for 10,900 buses on Dec. 24, 2025, with about 4,500 for Bengaluru, 2,800 for Delhi and 2,000 for Hyderabad, according to PTI. It then opened a tender for 6,230 more buses on Jan. 15, 2026, covering Delhi, Mumbai, Pune, Ahmedabad and Hyderabad. The Ministry of Heavy Industries has allocated Rs 4,391 crore for 14,028 buses and extended the scheme to March 31, 2028. As a result, operators can plan multi-year depot rollouts instead of single-city bids. In the Credence Research model this adds about 6.75 percentage points to annual growth to 2035.
Availability-based contracts attract specialist operators
Long contracts draw companies that want steady, infrastructure-like income rather than one-time vehicle sales. JBM Ecolife Mobility won an order worth about Rs 5,500 crore for 1,021 buses in 19 cities in February 2025, lifting its order book above 11,000 buses, according to Autocar Professional. New tender rules also allowed three-member consortiums, and 91Trucks reported in November 2025 that the Adani Group and a Canadian pension fund vehicle were among bidders. In Bengaluru, EKA Mobility makes the buses while Chartered Speed runs drivers, maintenance and charging, according to Deccan Herald. Separately, the International Energy Agency has suggested splitting fees into availability and per-kilometer parts because makers bear underutilization risk. In the Credence Research model this adds about 3.75 percentage points to annual growth.
Charging and fleet software lift daily utilization
Fee income depends on kilometers, so charging plans and duty software translate directly into revenue for each bus. Deccan Herald reported that Bengaluru contracts assure 190 kilometers a day while actual runs reach only 130 to 140, leaving a wide recoverable gap. The same report says about 45 minutes of opportunity charging adds around 60 kilometers, against up to two hours for a full charge. Electric Miles entered India in February 2026 with depot software for duty-based charging and cost per kilometer, according to Humans of EV, while TML Smart City Mobility reported over 95% uptime across 3,100 buses in January 2025. In turn, closing the gap lifts the income earned per bus. In the Credence Research model this adds about 2.40 percentage points to annual growth to 2035.
Payment security lowers operator credit risk
Weak transport agency finances long kept lenders and operators cautious, so a central backstop changes the economics of new bids. The Rs 3,435.33 crore PM-eBus Sewa payment security scheme approved by the Union Cabinet was notified on Oct. 28, 2024, and covers each deployed bus for up to 12 years. According to a March 2026 Lok Sabha reply, Rs 500 crore has already reached the fund and 19 states and territories have filed direct debit mandates with the Reserve Bank of India. If an agency fails to repay within 90 days, the ministry can ask the central bank to invoke that mandate. The same reply stated that no default or claim had yet arisen. This cover matters most for new PM e-Bus Sewa contracts in smaller cities.
Shorter buses, new consortiums and coach routes open up
A shift toward 9-meter buses in congested cities
Agencies are ordering shorter buses because they turn faster on narrow roads and can be fielded at lower cost per vehicle. Construction World reported on Dec. 2, 2025, that Delhi would buy more nine-meter units after 12-meter buses struggled on most corridors other than the Outer Ring Road. The January 2026 tender then listed 2,330 nine-meter buses for Delhi and 1,500 for Mumbai. On Feb. 14, 2026, a PM e-Bus Sewa flag-off included 200 nine-meter low-floor buses for Guwahati, Nagpur and Bhavnagar, according to electrive. PM E-DRIVE support of Rs 25 lakh for midi buses against Rs 35 lakh for standard buses, reported by Deccan Herald, shows the smaller subsidy these buses need.
The rise of new operating consortiums
Leadership is moving away from legacy bus makers toward groups built around operating contracts. Vahan data published by Sustainable Bus in July 2026 shows 2,944 registrations in the first half of 2026, up 40%, led by Switch Mobility at 28.2% and JBM Auto at 21.6%, while Tata Motors held only 2.4%. ASL India reported in December 2025 that PMI Electro won 5,210 buses in the PM E-DRIVE round, EKA Mobility 3,485, Olectra 1,785 and an Anthony Travels consortium 420. EKA Mobility and GreenCell Mobility then received 915 Hyderabad buses as a consortium in March 2026, according to Autocar Professional. As a result, financing partners now weigh as heavily as vehicle engineering in many bids, and this also separates the contract business from vehicle procurement volumes.
Opportunity in private intercity coach corridors
Intercity routes offer an opening outside public tenders because private operators dominate the fleet and buy on total cost. The International Council on Clean Transportation reported in 2025 that private operators run 94% of about 2.5 million registered buses, while CESL’s aggregated tenders, which pooled city demand, brought electric operating costs to about Rs 41 to Rs 47 per kilometer, roughly 31% below diesel. NueGo, run by GreenCell Mobility, said in August 2026 that its network reaches more than 150 cities after seven new routes, according to Autocar Professional. Zingbus plans 50 leased buses in 2026 and up to 1,000 by 2030 with its partner Drivn, according to 91Trucks. These leasing structures can extend per-kilometer pricing to smaller coach owners, and they also widen demand for highway charging infrastructure along these corridors.
Opportunity in smaller cities under a second scheme
Smaller cities are the next volume pool, and operators that build depot skills there can bid early for a larger round. The housing minister told the Rajya Sabha in March 2026 that 116 of 178 eligible cities in 26 states and territories joined PM e-Bus Sewa, with agreements signed for 6,500 buses, according to Outlook Business. He also said a second scheme for 35,000 more buses is planned, although its guidelines are not yet written. In Odisha, the transport agency CRUT announced in June 2026 that 400 scheme buses will serve five cities, according to Odisha Bytes. Because many of these networks are new, they could also adopt lessons from school transport services, where small contracted fleets already run on fixed daily schedules.
Breakdowns, unpaid dues and rate disputes test the model
Why are breakdown penalties rising on Chennai contracts?
Reliability is the main contract risk because penalties come straight out of operator income. Monthly breakdowns on the Chennai fleet of 625 buses rose from 97 in July 2025 to 372 in March 2026, and the city agency recovered Rs 9.51 crore in penalties against Rs 80.60 crore paid during 2025-26, both unaudited. Bengaluru also levied Rs 25 crore on four suppliers, according to Deccan Herald. Operators can reduce this exposure through longer validation before deployment and stronger spare-parts stocks at depots.
What happens when agency payments and power bills slip?
Cash-flow gaps can stop service quickly since charging depends on a paid electricity account. The Free Press Journal reported on July 31, 2026, that 22 of 63 buses at Mumbai’s Majiwada depot could not enter service when charging was disrupted. The operator said about 30% of its monthly payments had been pending since April 2026, while a BEST committee member blamed unpaid power bills instead. Passengers bear the cost first, and lenders then reprice the risk, so the payment security scheme should extend to older contracts.
How wide is the per-kilometer rate gap between cities?
Rate differences invite political and labor pressure because unions can compare contracts directly. DT Next reported in October 2026 that the union CITU sought cancellation of Chennai contracts, citing Rs 77 to Rs 80 per kilometer against Rs 36 in Telangana and Rs 37 to Rs 40 in Karnataka. BEST also raised its double-decker rate by Rs 3.65 to Rs 60.25 on Aug. 19, 2026, after a dispute with Switch Mobility, according to Swarajya. Operators face repricing risk, and agencies need clearer indexation terms to contain it.
Why do deliveries and chargers lag behind awards?
Awards turn into fee income only when buses and depots are ready, so delays defer revenue for years. Punekar News reported in April 2025 that the state carrier MSRTC fined Evey Trans Rs 4 crore after only 220 of 5,150 ordered buses arrived. Electrive reported that none of 6,562 public charging points approved under PM E-DRIVE had been deployed by July 22, 2026. Operators therefore depend on their own depot chargers, and agencies can help by handing over powered sites before bus delivery begins.
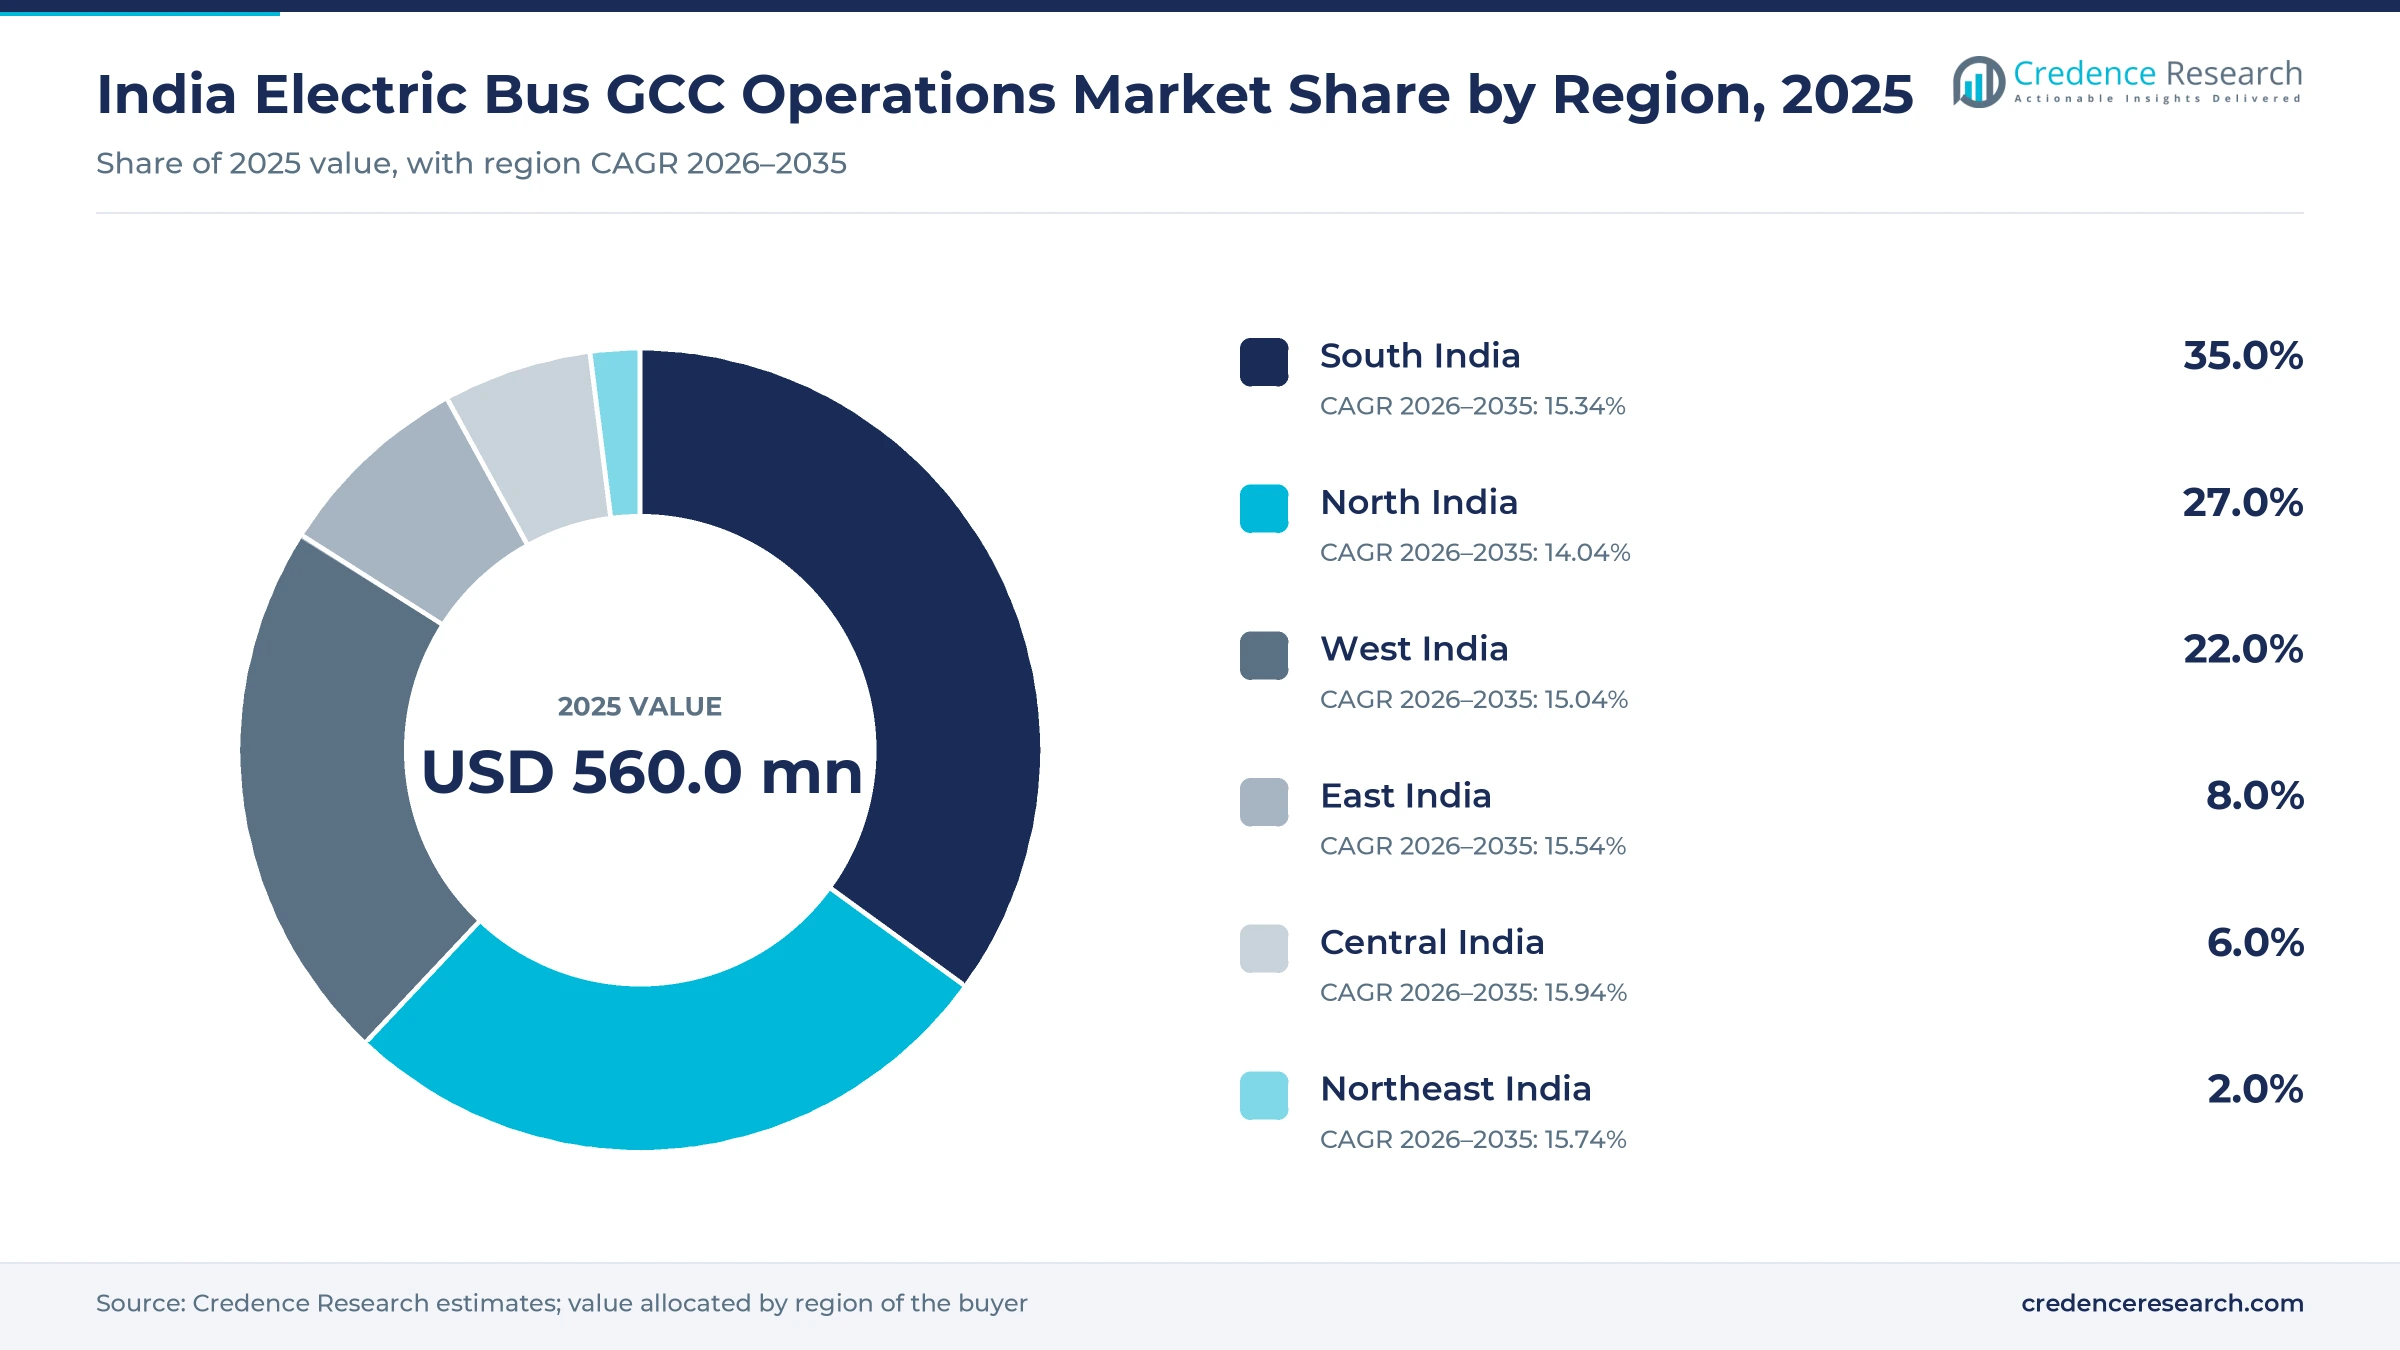
South India leads as Bengaluru tops national allocations
| Region | Value, 2025 (USD million) | Share, 2025 | CAGR, 2026–2035 |
|---|---|---|---|
| South India | 196.0 | 35.0% | 15.34% |
| North India | 151.2 | 27.0% | 14.04% |
| West India | 123.2 | 22.0% | 15.04% |
| East India | 44.8 | 8.0% | 15.54% |
| Central India | 33.6 | 6.0% | 15.94% |
| Northeast India | 11.2 | 2.0% | 15.74% |
South India holds the largest scheme allocation
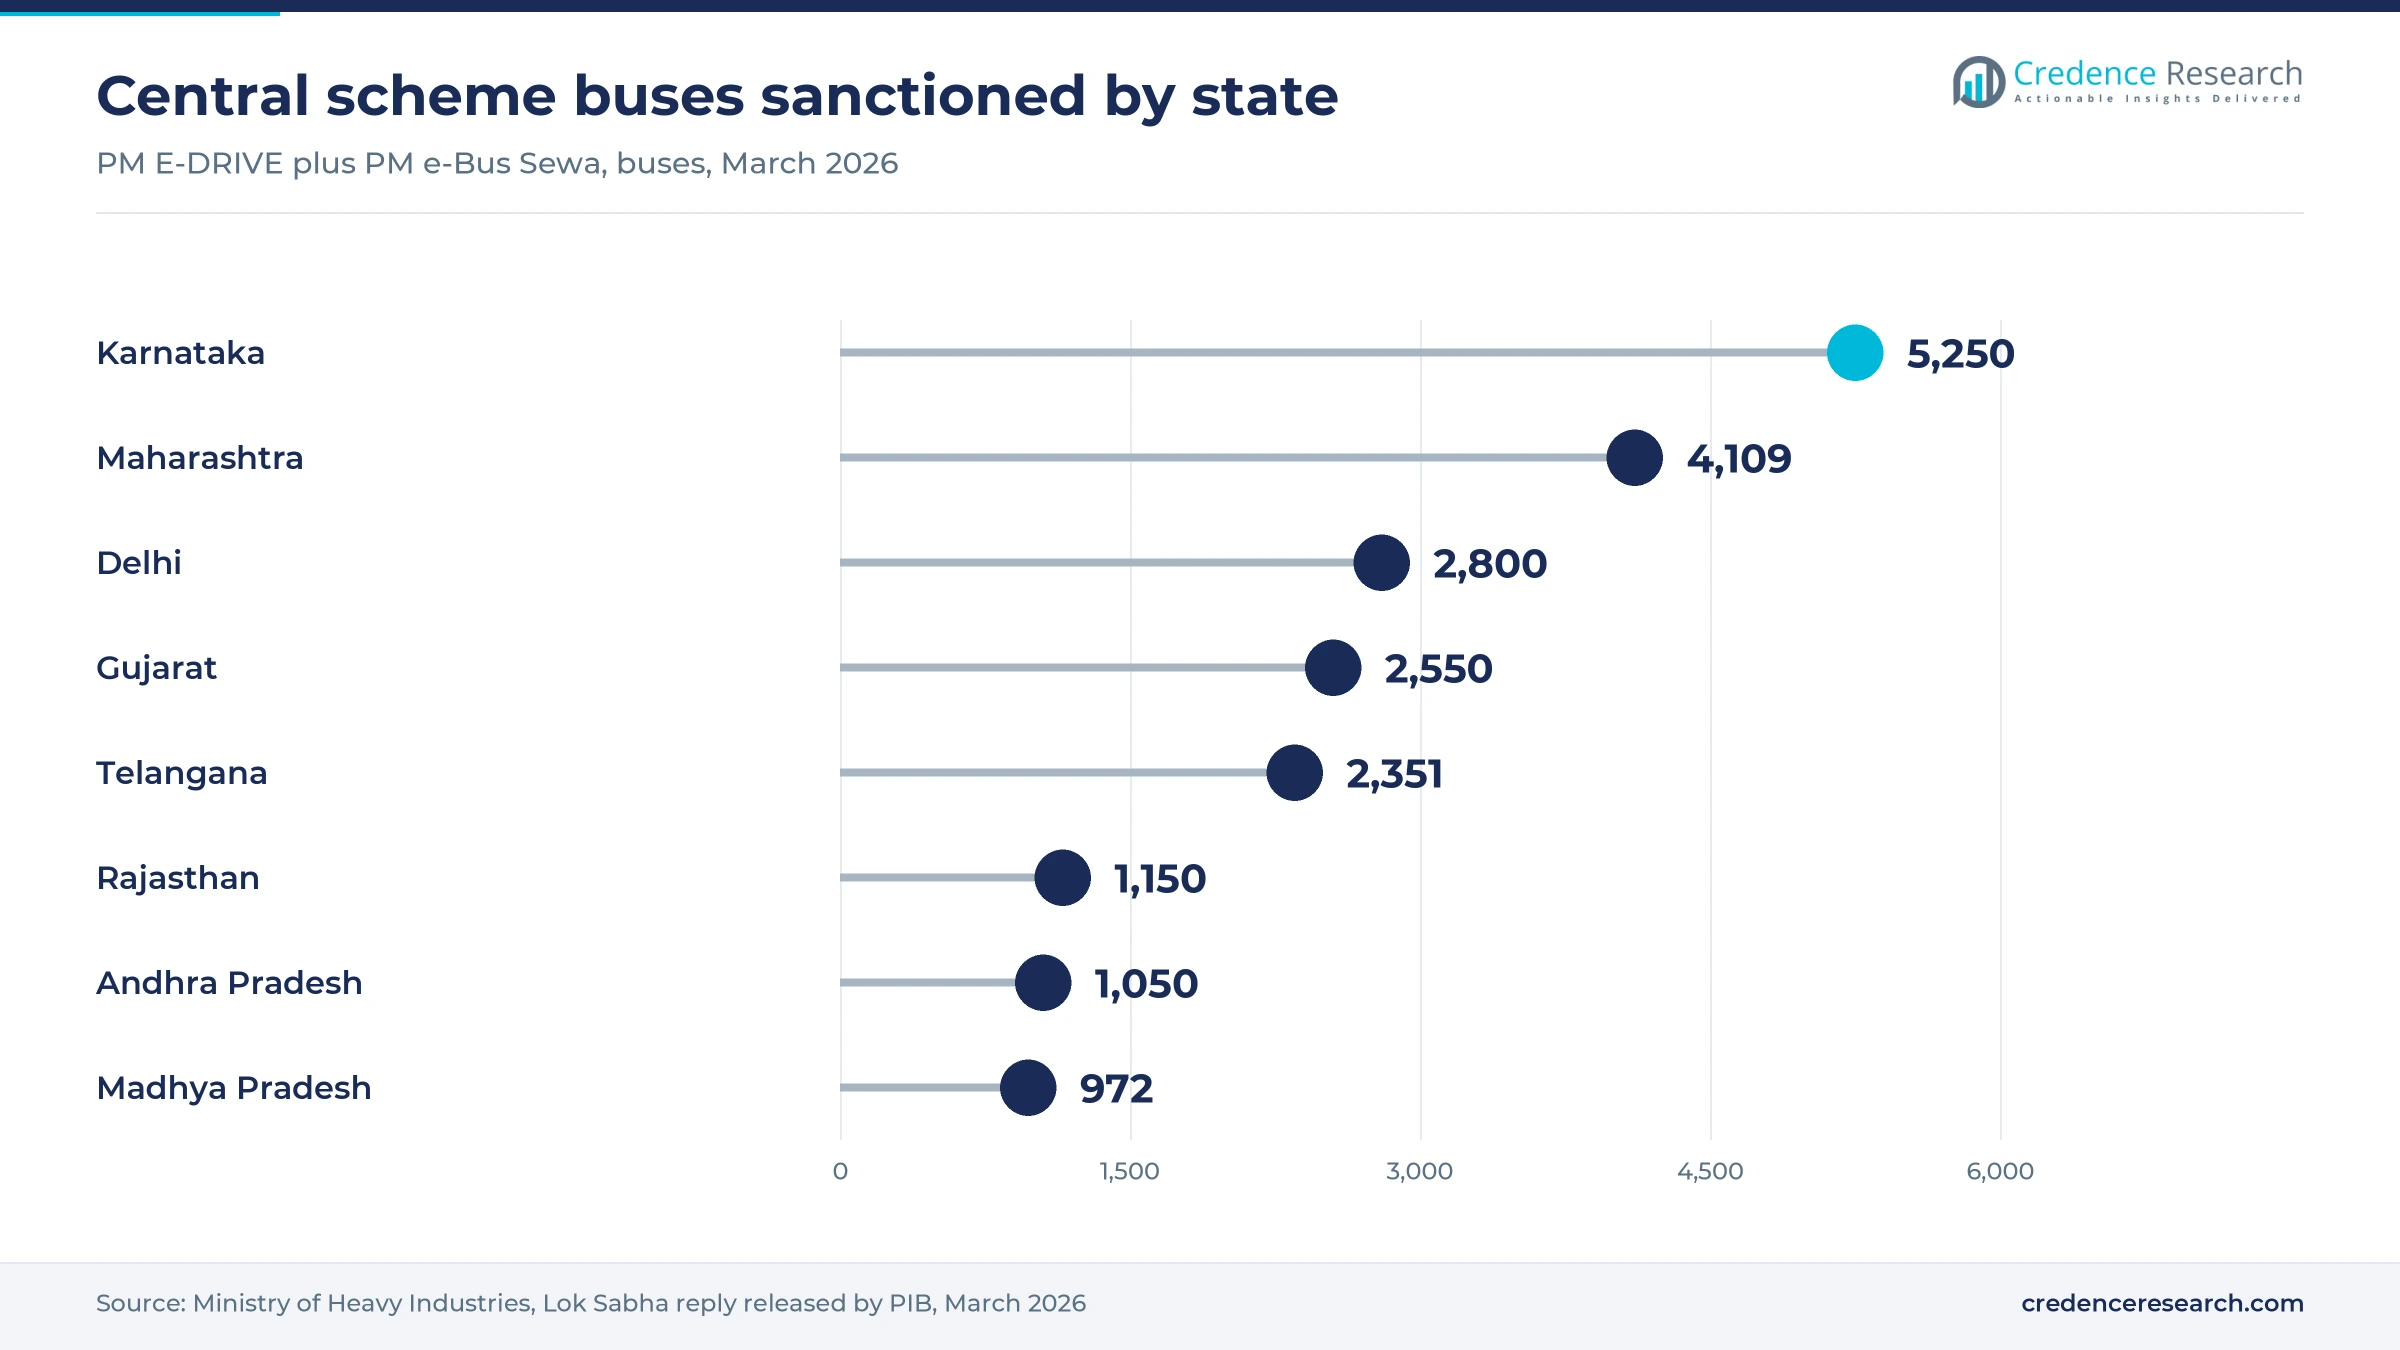
South India’s share of 2025 value was 35.0%, and the zone grows at 15.34% a year. The zone received 9,019 of the 23,800 buses in the state allocation table of March 2026, or 37.9%, led by Karnataka with 5,250 and Telangana with 2,351. Bengaluru’s transport agency runs 1,730 electric buses within a fleet of 7,152, according to Deccan Herald, and Chennai pays some of the highest published rates in the country. Together these contracts keep fee income in the south high relative to its current bus count.
North India is anchored by Delhi’s large fleet
North India’s share of 2025 value was 27.0%, and the zone grows at 14.04% a year, the slowest pace because Delhi has already electrified much of its fleet. Electrive reported in August 2026 that Delhi’s electric fleet exceeds 5,000 buses and targets 5,800 by March 2027. New volume then shifts to Rajasthan with 1,150 sanctioned buses and to Haryana, Punjab and Chandigarh, where scheme tenders are still moving toward deployment.
West India combines registrations with city tenders
West India’s share of 2025 value was 22.0%, and the zone grows at 15.04% a year. Maharashtra led national registrations with 1,442 buses in 2025, according to Vahan data published by Zee Business, and holds 4,109 scheme allocations, while Gujarat holds 2,550. The Mumbai and Pune portions of the January 2026 tender cover 2,500 of those buses, including 800 12-meter BRT units for Pune, which should keep the zone’s operating income growing near the national rate through the decade.
East India grows from Odisha and Bihar programs
East India’s share of 2025 value was 8.0%, and the zone grows at 15.54% a year. Odisha’s agency CRUT expanded its fleet to 760 buses by April 2026, according to Odisha Bytes, and Odisha and Bihar each hold 400 scheme buses. However, Bihar’s rollout has been delayed by coordination committees the state has not formed, according to Outlook Business, and West Bengal does not appear in the March 2026 central allocation table.
Central India starts from a small operating base
Central India’s share of 2025 value was 6.0%, and the zone grows at 15.94% a year, the fastest of the six zones. Madhya Pradesh holds 972 sanctioned buses and Chhattisgarh 240, both mostly scheme-led contracted networks. GreenCell Mobility received a letter of award for 472 buses in six Madhya Pradesh cities in May 2025 with VE Commercial Vehicles as its bus partner, according to Outlook Business, which gives the zone a named operator ahead of wider services.
Assam anchors the contracted fleet in Northeast India
Northeast India’s share of 2025 value was 2.0%, and the zone grows at 15.74% a year. Assam dominates the zone, since The Sentinel reported in July 2026 that 371 electric buses serve the state, with contracted agencies running 300 of them and the state carrier running 71. Guwahati received 100 nine-meter scheme buses in February 2026, while Meghalaya, Manipur and Arunachal Pradesh hold 55, 50 and 50 sanctioned buses for their first services.
Mega tenders and awards reshaped the field in 2025 and 2026
| Development | Status and market relevance |
|---|---|
| In February 2025, JBM Ecolife Mobility won an order for 1,021 buses across 19 cities in Gujarat, Maharashtra and Haryana under PM e-Bus Sewa. | Awarded, raises its order book above 11,000 buses |
| In December 2025, Convergence Energy Services Limited concluded the PM E-DRIVE round for 10,900 buses in five cities. | Concluded, with Letters of Award issued by each city |
| In January 2026, EKA Mobility and Chartered Speed won the first Bengaluru contract for 1,750 of the city’s 4,500 buses, according to Deccan Herald. | Awarded, with the operator building charging at city depots |
| In February 2026, Evey Trans received Letters of Award from the Telangana carrier for 1,085 12-meter buses on a 12-year contract worth about Rs 1,800 crore. | Delivery due over 20 months |
| In August 2026, the BEST committee in Mumbai approved a higher double-decker rate for Switch Mobility, clearing 150 pending buses. | Approved, rate dispute resolved |
Depot charging and duty software decide daily kilometers
- Depot charging sets the first departure, and Deccan Herald found a Bengaluru depot with 66 buses and 23 ports, which contributes to late starts.
- Opportunity charging adds range between duties and helps close the gap between assured and actual kilometers on long urban routes.
- Duty-based scheduling software matches charging to timetables and tracks energy cost per kilometer, the service Electric Miles began offering in India during 2026.
- Battery validation reduces later breakdowns, and analysts quoted by Deccan Herald put reliable validation at 300,000 to 500,000 kilometers before wide release.
Need a Custom Version of This Report?
Tailor the scope, geography, or segments to your exact requirements.
- Custom geography or segment scope
- Direct access to our analyst team
Bus makers and financed consortiums compete on the fee
Competition in GCC operations turns on the quoted per-kilometer fee, access to long-term finance and the ability to keep buses on the road for 12 years. PMI Electro Mobility and EKA hold the largest PM E-DRIVE awards, which gives them the broadest pipeline among the winning bidders. JBM relies on PM e-Bus Sewa work across smaller cities and on its own manufacturing. Olectra operates through Evey Trans, with large contracts in Telangana and Maharashtra, and it has also faced public disputes over deliveries and depot power. Switch Mobility leads recent registrations and runs double-decker contracts with BEST in Mumbai. TML Smart City Mobility has the longest operating record, with 3,100 buses across 10 cities, although Tata Motors held only 2.4% of first-half 2026 registrations. A separate legal risk remains because Ashok Leyland’s unit OHM Global Mobility challenged its non-award in the Delhi High Court, according to ASL India.
Companies profiled and their roles in this market
| Company | Type | Role in the market |
|---|---|---|
| PMI Electro Mobility | Maker and operator | Won 5,210 PM E-DRIVE buses in December 2025 and supplied 25 Chandigarh buses in February 2026 |
| Olectra/Evey Trans | Maker and operator | Holds 1,085 Telangana buses and a delayed 5,150-bus Maharashtra contract, with deliveries past deadline in December 2025 |
| JBM | Maker and operator | JBM Ecolife Mobility holds 1,021 PM e-Bus Sewa buses in 19 cities |
| TML Smart City Mobility | Operator | Tata Motors unit with 3,100 buses in 10 cities in January 2025 |
| Switch Mobility | Maker and operator | Largest maker by first-half 2026 registrations, with a BEST double-decker contract |
| EKA | Maker and consortium partner | Won 3,485 PM E-DRIVE buses, working with Chartered Speed and GreenCell Mobility |
Reliable kilometers will matter more than the lowest bid
Credence Research’s view is that the next phase of GCC operations will reward operators that deliver contracted kilometers rather than those that bid the lowest fee. Rates cited by the union CITU run from Rs 36 to Rs 80 per kilometer, and even Chennai’s high-rate contract has recorded rising breakdowns, so a low fee leaves little room for repair. Payment cover reduces credit risk for new contracts, yet it does not fix older agency arrears or depot power disputes. Buyers should therefore test each bidder’s validation record, charging plan and financing before award, because a failed contract costs a city more than a slightly higher fee would.
How the per-kilometer fee estimates were built
The report uses 2025 as the base year and forecasts to 2035. Market values come from the Credence Research model, which multiplies contracted buses by daily kilometers, operating days and per-kilometer fees, and segment and regional splits are Credence Research estimates. The fleet, contract and rate evidence comes from Ministry of Heavy Industries and Housing and Urban Affairs parliamentary replies, Vahan registration data, International Energy Agency and International Council on Clean Transportation publications, and company and trade press reports. No interviews or surveys were conducted for this edition of the report. Excess-kilometer fee shares are the most assumption-based split because few contracts publish them.
Smaller cities and coach corridors shape growth to 2035
GCC operations should reach USD 2.46 billion by 2035 as the 23,800 sanctioned buses enter service and a second scheme widens the base. Deployment usually follows within two years of a concession agreement, so PM E-DRIVE fees should appear in volume from 2027. Growth after 2030 depends on the planned 35,000-bus round, on battery replacement within long contracts and on broader national EV adoption that strengthens charging supply. Private coach corridors could add a second income stream if leasing partners keep financing smaller owners.
Frequently Asked Questions
How big is the India electric bus GCC operations market?
What is a gross cost contract for electric buses?
Which region leads the market in India?
Which bus type earns the most operating fees?
How many buses do PM e-Bus Sewa and PM E-DRIVE cover?
What protects operators against late agency payments?
Who are the main companies in this market?
What are the main risks for operators?
Table of Content
Chapter 1 Market Segmentation
- 1.1 Segmentation Framework
- 1.1.1 Product and Service Classification
- 1.1.2 Application and End-Use Classification
- 1.1.3 Technology and Solution Classification
- 1.1.4 Customer and Distribution Channel Classification
- 1.1.5 Geographic Segmentation
- 1.1.6 Market Segment Definitions and Boundaries
- 1.2 By Bus Type
- 1.2.1 12-Meter
- 1.2.2 9-Meter
- 1.2.3 Intercity
- 1.3 By Program
- 1.3.1 State
- 1.3.2 PM e-Bus Sewa
- 1.3.3 PM E-DRIVE
- 1.4 By Revenue
- 1.4.1 Assured-Kilometer Fees
- 1.4.2 Excess-Kilometer Fees
Chapter 2 Introduction
- 2.1 Report Objectives and Scope
- 2.2 Product Definition and Industry Terminology
- 2.3 Market Inclusions and Exclusions
- 2.4 Research Process
- 2.4.1 Primary Research and Expert Interviews
- 2.4.2 Secondary Research and Source Review
- 2.4.3 Top-Down and Bottom-Up Estimation
- 2.4.4 Data Triangulation and Verification
- 2.5 Market Size Measurement Basis
- 2.5.1 2025: USD 560.0 million → 2035: USD 2.46 billion
- 2.6 Historical and Forecast Reference Periods
- 2.6.1 Historical Period: 2018-2025
- 2.6.2 Base Year: 2025
- 2.6.3 Forecast Period: 2025-2035
- 2.7 Research Assumptions and Limitations
Chapter 3 Executive Summary
- 3.1 Market Snapshot and Key Findings
- 3.2 Base-Year Market Size, 2025
- 3.3 Forecast Market Size, 2035
- 3.4 Revenue and Volume Growth Outlook
- 3.5 Key Demand and Supply Indicators
- 3.6 Leading Market Segments
- 3.7 Fastest-Growing Market Opportunities
- 3.8 Regional Performance Highlights
- 3.9 Technology and Industry Transformation
- 3.10 Competitive Landscape Summary
- 3.11 Analyst View and Strategic Implications
Chapter 4 India Electric Bus GCC Operations Market Trends and Developments
- 4.1 Historical Industry Development, 2018-2025
- 4.2 Recent Market Trends and Developments
- 4.3 Demand and Customer Behavior Trends
- 4.4 Technology and Product Innovation
- 4.5 Artificial Intelligence, Automation and Digitalization
- 4.6 Local Manufacturing and Supply Chain Realignment
- 4.7 Industry Partnerships, Mergers and Acquisitions
- 4.8 Sustainability and Circular Economy Developments
- 4.9 Government and Private Sector Investment Trends
- 4.10 Emerging Business Models and Commercialization
- 4.11 Industry Developments and Announcements
Chapter 5 India Electric Bus GCC Operations Market Production, Supply and Demand Analysis
- 5.1 Demand Trend and Consumption Analysis, 2018-2025
- 5.2 Demand Forecast, 2025-2035
- 5.3 Production and Output Trend, 2018-2025
- 5.4 Production and Output Forecast, 2025-2035
- 5.5 Installed Capacity and Capacity Utilization
- 5.6 Company-Wise Production Plants and Statistics
- 5.6.1 Installed Production Capacity
- 5.6.2 Actual Production
- 5.6.3 Planned Capacity and Expansion Targets
- 5.7 Supply Chain Structure and Procurement Trends
- 5.8 Supply-Demand Gap and Bottlenecks
- 5.9 Import Dependence and Sourcing Structure
- 5.10 Contract Manufacturing and Outsourcing
- 5.11 Regional Supply and Demand Concentration
Chapter 6 India Electric Bus GCC Operations Market Pricing Analysis
- 6.1 Pricing Structure and Measurement
- 6.2 Historical Pricing Trends, 2018-2025
- 6.3 Pricing Outlook, 2025-2035
- 6.4 Average Selling Price and Unit Economics
- 6.5 Pricing by Product and Market Segment
- 6.6 Geographic Pricing Differences
- 6.7 Key Input, Energy, Labor and Logistics Costs
- 6.8 Contract Pricing and Purchasing Models
- 6.9 Pricing Sensitivity and Competitive Positioning
- 6.10 Price, Margin and Profitability Implications
Chapter 7 India Electric Bus GCC Operations Market Dynamics
- 7.1 Market Growth Drivers
- 7.1.1 Demand-Side Drivers
- 7.1.2 Technology and Innovation Drivers
- 7.1.3 Infrastructure and Investment Drivers
- 7.1.4 Regulatory and Policy Drivers
- 7.2 Market Restraints
- 7.2.1 Cost and Affordability Constraints
- 7.2.2 Technology and Adoption Barriers
- 7.2.3 Supply Chain and Operational Constraints
- 7.3 Market Challenges
- 7.3.1 Competitive Pressure and Margin Erosion
- 7.3.2 Skills, Infrastructure and Implementation Gaps
- 7.4 Emerging Market Opportunities
- 7.5 Market Dynamics Impact and Time-Horizon Assessment
Chapter 8 India Electric Bus GCC Operations Value Chain Analysis
- 8.1 Industry Value Chain Overview
- 8.2 Upstream Suppliers and Critical Inputs
- 8.3 Technology and Component Providers
- 8.4 Manufacturing or Service Delivery
- 8.5 Distribution, Channel Partners and Integrators
- 8.6 Downstream Applications and End Users
- 8.7 Value Addition and Profit Pools
- 8.8 Vertical Integration and Outsourcing
- 8.9 Supplier Concentration and Risk
- 8.10 Supply Chain Localization and Resilience
Chapter 9 India Electric Bus GCC Operations Market Regulations and Policies
- 9.1 Relevant Laws, Standards and Compliance Frameworks
- 9.2 Product, Service, Safety and Quality Requirements
- 9.3 Government Policies, Incentives and Subsidies
- 9.4 Imports, Exports and Trade Barriers
- 9.5 Public Procurement and Local Content Requirements
- 9.6 Environmental and Sustainability Compliance
- 9.7 Upcoming Policy Changes and Market Implications
Chapter 10 India Electric Bus GCC Operations Market Hotspots and Opportunities
- 10.1 Market Opportunity Mapping and Growth Hotspots
- 10.2 High-Growth Applications and Customer Groups
- 10.3 Underserved Markets and White-Space Opportunities
- 10.4 Emerging Technology and Product Opportunities
- 10.5 New Capacity and Investment Hotspots
- 10.6 Market Entry and Expansion Opportunities
- 10.7 Distribution and Partnership Opportunities
- 10.8 Near-Term and Long-Term Commercial Potential
- 10.9 Opportunity Attractiveness and Execution Risks
Chapter 11 India Electric Bus GCC Operations Market Outlook, 2025-2035
- 11.1 Market Size and Analysis
- 11.1.1 Revenue (Market Measurement: 2025: USD 560.0 million → 2035: USD 2.46 billion)
- 11.1.2 Market Volume and Quantity Sold
- 11.1.3 Historical Market Size, 2018-2025
- 11.1.4 Base-Year Market Size, 2025
- 11.2 Market Forecast, 2025-2035
- 11.2.1 Revenue Forecast to 2035
- 11.2.2 Volume Forecast to 2035
- 11.2.3 CAGR and Year-on-Year Growth
- 11.2.4 Incremental Revenue Opportunity
- 11.3 Forecast Assumptions and Scenario Analysis
- 11.3.1 Base-Case Forecast
- 11.3.2 Optimistic and Conservative Scenarios
- 11.3.3 Technology, Pricing and Policy Sensitivities
- 11.4 Market Attractiveness and Growth Outlook
Chapter 12 India Electric Bus GCC Operations Market Segmentation and Outlook
- 12.1 Segmentation Summary and Market Shares, 2025
- 12.2 Largest and Fastest-Growing Segments
- 12.3 By Bus Type - Market Size and Forecast, 2025-2035
- 12.3.1 Segment Definition and Scope
- 12.3.2 Historical Market Size, 2018-2025
- 12.3.3 Revenue Forecast, 2025-2035
- 12.3.4 Volume Forecast, 2025-2035
- 12.3.5 Base-Year Market Share, 2025
- 12.3.6 Segment CAGR and Growth Drivers
- 12.3.7 Subsegment Market Size and Forecast
- 12.3.7.1 12-Meter
- 12.3.7.2 9-Meter
- 12.3.7.3 Intercity
- 12.3.8 Subsegment Pricing and Adoption Trends
- 12.3.9 Leading Suppliers and Competition
- 12.3.10 Regional Demand and Opportunities
- 12.4 By Program - Market Size and Forecast, 2025-2035
- 12.4.1 Segment Definition and Scope
- 12.4.2 Historical Market Size, 2018-2025
- 12.4.3 Revenue Forecast, 2025-2035
- 12.4.4 Volume Forecast, 2025-2035
- 12.4.5 Base-Year Market Share, 2025
- 12.4.6 Segment CAGR and Growth Drivers
- 12.4.7 Subsegment Market Size and Forecast
- 12.4.7.1 State
- 12.4.7.2 PM e-Bus Sewa
- 12.4.7.3 PM E-DRIVE
- 12.4.8 Subsegment Pricing and Adoption Trends
- 12.4.9 Leading Suppliers and Competition
- 12.4.10 Regional Demand and Opportunities
- 12.5 By Revenue - Market Size and Forecast, 2025-2035
- 12.5.1 Segment Definition and Scope
- 12.5.2 Historical Market Size, 2018-2025
- 12.5.3 Revenue Forecast, 2025-2035
- 12.5.4 Volume Forecast, 2025-2035
- 12.5.5 Base-Year Market Share, 2025
- 12.5.6 Segment CAGR and Growth Drivers
- 12.5.7 Subsegment Market Size and Forecast
- 12.5.7.1 Assured-Kilometer Fees
- 12.5.7.2 Excess-Kilometer Fees
- 12.5.8 Subsegment Pricing and Adoption Trends
- 12.5.9 Leading Suppliers and Competition
- 12.5.10 Regional Demand and Opportunities
- 12.6 Segment Growth Comparison
- 12.7 Segment Attractiveness and Priority Matrix
Chapter 13 India Electric Bus GCC Operations Geographic Market Outlook, 2025-2035
- 13.1 Domestic Market Distribution and Demand Clusters
- 13.2 State- or Province-Wise Market Size and Forecast, 2025-2035
- 13.3 City and Metropolitan Market Outlook
- 13.4 Industrial, Manufacturing and Commercial Clusters
- 13.5 Geographic Concentration of Key End Users
- 13.6 Local Pricing and Purchasing Differences
- 13.7 Domestic Production Facilities and Capacity Map
- 13.8 Local Infrastructure and Project Pipeline
- 13.9 State-Level Policy and Incentive Differences
- 13.10 Subnational Investment Hotspots and Opportunities
- 13.11 Distribution and Logistics Networks
- 13.12 Domestic Competitive Footprint
Chapter 14 India Electric Bus GCC Operations Technology, Innovation and Sustainability Outlook
- 14.1 Technology Landscape and Maturity
- 14.2 Product, Process and Service Innovation
- 14.3 AI, Automation and Digital Tools in the Industry
- 14.4 Technology Adoption and Performance Benchmarking
- 14.5 Innovation Pipeline and R&D Investment
- 14.6 Patent and Intellectual Property Trends
- 14.7 Energy Efficiency and Resource Management
- 14.8 Sustainability, Recycling and Circularity
- 14.9 Technology Roadmap, 2025-2035
- 14.10 Risks of Obsolescence and Technology Substitution
Chapter 15 India Electric Bus GCC Operations Market Key Strategic Imperatives
- 15.1 Growth and Market Entry Priorities
- 15.2 High-Return Products and Segments
- 15.3 Pricing, Profitability and Cost Optimization
- 15.4 Technology Investment and Product Differentiation
- 15.5 Supply Chain Localization and Resilience
- 15.6 Distribution and Customer Acquisition
- 15.7 Partnership, Acquisition and Capacity Strategy
- 15.8 Regional Expansion Priorities
- 15.9 Short-, Medium- and Long-Term Actions
Chapter 16 Competition Outlook
- 16.1 Industry Competition Characteristics
- 16.2 Market Structure and Concentration
- 16.3 Market Share and Competitive Positioning, 2025
- 16.4 Company-Wise Revenue and Product Benchmarking
- 16.5 Production and Service Capacity Benchmarking
- 16.6 Technology, Pricing and Differentiation
- 16.7 Regional Footprint and Distribution Strength
- 16.8 Mergers, Acquisitions and Strategic Alliances
- 16.9 New Entrants and Competitive Threats
- 16.10 Porter's Five Forces and Industry Attractiveness
- 16.11 Competitive Outlook, 2025-2035
Chapter 17 Company Profiles
- 17.1 Company Coverage and Selection Criteria
- 17.2 PMI Electro Mobility
- 17.2.1 Business Description
- 17.2.2 Company Ownership and Geographic Presence
- 17.2.3 Product and Service Portfolio
- 17.2.4 Manufacturing and Operating Footprint
- 17.2.5 Production Capacity and Expansion Plans
- 17.2.6 Financial Performance and Investment
- 17.2.7 Market Share and Competitive Position
- 17.2.8 Technology and Innovation Capabilities
- 17.2.9 Strategic Alliances or Partnerships
- 17.2.10 Recent Developments
- 17.2.11 Growth Strategy and Outlook
- 17.3 Olectra/Evey Trans
- 17.4 JBM
- 17.5 TML Smart City Mobility
- 17.6 Switch Mobility
- 17.7 EKA
- 17.8 Other Relevant Market Participants
Note: Every listed company is profiled on the structure shown under the first company. The company list is preliminary and may change based on research findings, market developments, data availability and client requirements.
Chapter 18 Disclaimer
- 18.1 Research and Forecast Disclaimer
- 18.2 Data Source and Estimation Limitations
Note: The depth of individual sections depends on data availability for this market. Volume, capacity, trade and other unit-based metrics are included where applicable.

