Market Overview:
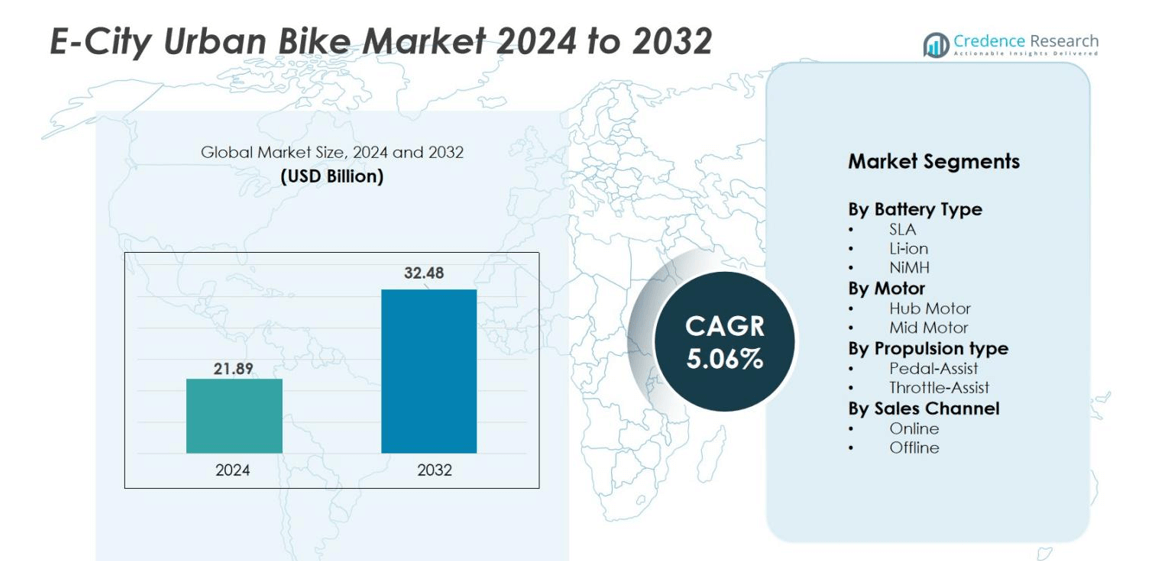
E-City Urban Bike market size was valued USD 21.89 billion in 2024 and is anticipated to reach USD 32.48 billion by 2032, at a CAGR of 5.06% during the forecast period.
| REPORT ATTRIBUTE | DETAILS |
|---|---|
| Historical Period | 2020-2023 |
| Base Year | 2024 |
| Forecast Period | 2025-2032 |
| E-City Urban Bike Market Size 2024 | USD 21.89 billion |
| E-City Urban Bike Market, CAGR | 5.06% |
| E-City Urban Bike Market Size 2032 | USD 32.48 billion |
E-City Urban Bike Market features key players such as Accell Group, Giant Bicycles, Merida, Brompton Bicycle Ltd., Trek Bicycles, Scott Sports SA, Specialized Bicycle Components, Tern, Polygon Bikes, and Rad Power Bikes. These companies compete through lightweight frames, Li-ion batteries, smart dashboards, and commuter-friendly designs. Europe remains the leading region with 39% market share, supported by strong cycling infrastructure, emission-free mobility policies, and high consumer spending power. North America follows with 31% share, driven by growing adoption among commuters and delivery fleets, while Asia Pacific expands rapidly due to large manufacturing bases and rising urban congestion.
Market Insights
- The market reached USD 21.89 billion in 2024 and will grow at 5.06% CAGR to hit USD 32.48 billion by 2032.
- Rising cycling lanes, fuel cost reduction, and eco-friendly commuting push demand, with pedal-assist bikes holding 71% share as the leading propulsion mode.
- Smart dashboards, GPS tracking, removable batteries, and lightweight frames shape new product trends while rental platforms and delivery fleets increase bulk adoption.
- Key players include Accell Group, Trek, Specialized, and Giant, focusing on Li-ion batteries, which dominate with 78% market share, while hub motors lead the motor segment with 63% share.
- Europe leads the global market with 39% share, followed by North America at 31%, Asia Pacific at 22%, Latin America at 5%, and Middle East & Africa at 3%, supported by urban mobility policies and clean transport initiatives.
Market Segmentation Analysis
By Battery Type
Li-ion batteries hold the dominant position with nearly 78% market share due to high energy density, longer lifecycle, and lightweight design. These packs support longer range per charge, which suits daily city commuting and rental fleets. Leading manufacturers continue shifting from SLA and NiMH to Li-ion to improve efficiency and cut maintenance. SLA batteries account for about 14% because of heavy weight and short life, while NiMH holds close to 8% in a few mid-range models. Strong demand for long-range, fast-charging bikes keeps Li-ion in the lead.
- For instance, Exide Industries offers VRLA/SLA batteries with capacities up to 20,600 Ah for industrial applications.
By Motor Type
The hub-motor segment maintains roughly 63% share in the e-city urban bike market, driven by simple construction, reduced servicing needs, and lower upfront cost. These motors work well for short-distance commuting and city rentals, making them ideal for budget-friendly models. Mid-motor systems represent around 37%, gaining traction in premium categories due to stronger torque and better weight balance. However, higher pricing limits wider adoption. Hub motors stay dominant because commuters and fleet buyers prioritize reliability and cost efficiency.
- For instance, Bafang’s mid-drive M620 motor delivers a maximum torque of 170 Nm along with a rated power output of 750 W, underlining why mid-motors appeal for more demanding applications.
By Propulsion Type
Pedal-assist bikes dominate with about 71% market share, supported by longer riding range, smoother power delivery, and compliance with urban mobility regulations. These models are widely used by students, office commuters, and shared mobility platforms. Throttle-assist bikes hold close to 29% and attract users who prefer full-electric convenience, but stricter rules in many cities slow expansion. Delivery services and rental operators prefer pedal-assist for better battery performance and speed control, keeping this segment in the leading position.
Key Growth Drivers
Rising Urban Congestion and Shift Toward Sustainable Transport
Growing traffic congestion and fuel costs push commuters toward cleaner and compact mobility solutions. E-city bikes allow faster movement through crowded areas, affordable transportation, and easy parking compared to cars and two-wheelers. Many cities promote cycling lanes and low-emission mobility zones, encouraging electric bike adoption. Government subsidies, tax credits, and scrappage incentives also lower upfront purchase cost and make premium models more accessible. Delivery and courier services prefer e-bikes for last-mile logistics because they reduce fuel spending and maintenance. The combination of environmental goals, cost savings, and improved cycling infrastructure continues to accelerate the demand for urban e-bikes.
- For instance, in San Francisco, DoorDash reported that 76% of its deliveries were made using bikes, e-bikes and scooters in the city.
Advancement in Lithium-Ion Batteries and Motor Efficiency
Better battery chemistry, lightweight frames, and efficient motors help riders travel longer distances on a single charge. Li-ion and smart battery management systems extend battery life and support fast charging. Hub motors and mid-drive systems now deliver smoother torque and silent operation, making rides more comfortable in city traffic. Integration of regenerative braking adds more range, reducing charging frequency for daily commuters. Technology improvements make e-bikes suitable for wider rider age groups, including seniors and office workers. As performance improves and charging technology expands in public places, consumer acceptance continues to rise, helping the market grow at a steady pace.
- For instance, modern lithium-ion battery systems are reported to achieve cycle lives exceeding 1,000 cycles. Hub motors and mid-drive systems now deliver smoother torque and silent operation, making rides more comfortable in city traffic.
Growth of Online Sales and E-Bike Rental Platforms
E-commerce platforms expand buyer reach with home delivery, digital financing, and easy comparison of specifications. Online channels help new brands enter the market and offer competitive pricing. Subscription-based rental and shared mobility services increase awareness and allow riders to test products before buying. Delivery fleets and food-service companies adopt e-bikes to cut fuel usage and move quickly within urban centers. Many operators deploy large connected fleets with GPS tracking, remote battery monitoring, and maintenance alerts. The combined rise of online retail and shared mobility solutions creates a strong demand pipeline for smart and reliable city e-bikes.
Key Trends & Opportunities
Expansion of Connected and App-Enabled Bikes
Smart dashboards, GPS navigation, remote locking, and theft tracking now come standard in many models. App integration lets riders check distance, battery status, and service schedules from a smartphone. Fleet operators and rental platforms use analytics to track battery health and optimize routes. Manufacturers introduce IoT-based solutions to improve commuter safety through geofencing, fall detection, and emergency alerts. Growing demand for smart urban mobility presents opportunities for tech-focused brands, component suppliers, and service providers. As connectivity becomes a key buying factor, companies investing in intelligent features gain a competitive edge.
- For instance, Bosch’ SmartphoneHub and COBI.Bike app give e-bike riders real-time route data and display battery-capacity on the handlebar screen.
Rise of Lightweight Frames and Modular Design
Manufacturers shift to aluminum, magnesium alloys, and carbon fiber to reduce weight and improve handling. Foldable and modular bikes attract office workers, apartment residents, and public transport users who need compact vehicles for short travel. Swappable battery packs help riders extend travel distance without long charging breaks, making the product ideal for busy commuters and delivery services. Brands offering ergonomic seats, shock-absorbing forks, and cargo attachments capture demand from family riders and utility users. Lightweight and modular design opens strong growth opportunities for premium bike makers and aftermarket accessories.
- For instance, Gogoro introduced swappable traction-battery packs that increased storage capacity from 1,374 Wh in their first generation to 1,742 Wh in the third generation.
Key Challenges
High Purchase Cost and Limited Charging Access
E-city bikes cost more than regular bicycles because of batteries, motors, controllers, and smart systems. Entry-level pricing still restricts adoption among students and low-income commuters. Although charging at home is common, many urban areas lack public e-bike charging points, especially in developing regions. Rental and fleet operators need centralized charging hubs, which involve high setup costs. Without wider charging access, long-distance commuters hesitate to buy. Reducing battery cost, improving charging infrastructure, and offering financial subsidies are essential to overcome this barrier.
Maintenance Complexity and Component Availability
Unlike regular bicycles, e-city models require skilled technicians for battery checks, motor servicing, and electronics repairs. In many regions, service shops lack trained staff or diagnostic tools, causing delays and higher repair costs. Imported batteries and electronic parts create long wait times when replacements are needed. Weather factors like rain and heat also affect battery performance and require protective design. Limited aftermarket availability and service networks discourage some buyers. Expanding authorized service centers, localizing battery production, and offering longer warranties can help solve this challenge.
Regional Analysis
North America
North America holds around 31% market share, driven by rising adoption of eco-friendly commuting and strong cycling infrastructure in the U.S. and Canada. Cities promote bike lanes and emission-free travel, encouraging commuters to switch from fuel vehicles to e-city bikes. Delivery and courier services also use e-bikes for last-mile transport. Government incentives, tax credits, and fleet electrification programs support market growth. Key brands expand sales through online retail, rental platforms, and subscription services. Increasing demand for lightweight, connected models with smart tracking features continues to push product upgrades across major cities.
Europe
Europe leads the market with nearly 39% market share, supported by high environmental awareness, strict emission norms, and strong cycling culture. Countries such as Germany, the Netherlands, Denmark, and France invest heavily in bike-friendly infrastructure, charging points, and smart mobility programs. Subsidies, public leasing schemes, and scrappage incentives boost e-bike sales, especially among daily commuters. Shared mobility fleets also drive adoption in urban centers. Lightweight, pedal-assist bikes dominate due to favorable regulations and long-distance utility. The region remains the strongest revenue contributor because of established brands and high consumer spending power.
Asia Pacific
Asia Pacific accounts for around 22% market share, with rapid growth in China, Japan, South Korea, and India. Rising urban congestion and fuel prices encourage citizens to adopt electric mobility solutions. China leads production and exports due to large manufacturing bases and cost-efficient components. Delivery and e-commerce companies use e-bikes for city logistics, increasing bulk demand. Governments promote EV adoption with charging subsidies and cycling infrastructure. Affordable pricing helps mass-market penetration, while connected and foldable models gain popularity among younger commuters. Expanding retail networks and digital financing support steady growth across key economies.
Latin America
Latin America holds close to 5% market share, driven by growing interest in cost-effective commuting and fuel savings. Brazil, Mexico, and Chile show rising adoption as cities introduce low-emission transport policies. Delivery platforms and courier services are major buyers, using e-bikes for short-distance logistics in crowded streets. Limited charging networks and higher product cost remain restraints, but online retail and financing options improve accessibility. Import-driven supply chains still dominate the region, though local assembly is slowly expanding. Increasing awareness of environmental benefits supports future market potential.
Middle East & Africa
Middle East & Africa represent nearly 3% market share, with emerging adoption in the UAE, Saudi Arabia, and South Africa. Smart city development, e-mobility initiatives, and bike-sharing pilots encourage early growth. Hot climate and limited cycling infrastructure restrict widespread usage, but recreational and tourist zones show rising demand. Delivery companies in dense urban areas also test e-bike usage to reduce fuel costs. Import dependency results in higher pricing, slowing mass adoption. However, rising sustainability goals and government mobility reforms create long-term opportunities for urban electric bike manufacturers and rental operators.
Market Segmentations:
By Battery Type
- SLA
- Li-ion
- NiMH
By Motor
- Hub Motor
- Mid Motor
By Propulsion type
- Pedal-Assist
- Throttle-Assist
By Sales Channel
- Online
- Offline
By Geography
- North America
- U.S.
- Canada
- Mexico
- Europe
- Germany
- France
- U.K.
- Italy
- Spain
- Rest of Europe
- Asia Pacific
- China
- Japan
- India
- South Korea
- South-east Asia
- Rest of Asia Pacific
- Latin America
- Brazil
- Argentina
- Rest of Latin America
- Middle East & Africa
- GCC Countries
- South Africa
- Rest of the Middle East and Africa
Competitive Landscape
The competitive landscape of the E-City Urban Bike market includes established manufacturers such as Trek Bicycles, Scott Sports SA, Accell Group, Brompton Bicycle Ltd, Tern, Polygon Bikes, and Rad Power Bikes, LLC, along with emerging technology-driven startups. These companies compete based on design innovation, smart connectivity, and pricing efficiency. Leading brands expand product portfolios with lightweight aluminum or carbon frames, removable high-capacity lithium-ion batteries, and GPS-enabled anti-theft systems to appeal to urban commuters and fleet operators.Partnerships with logistics providers and shared-mobility platforms help manufacturers increase deployment in dense urban areas. Many companies, including Trek and Rad Power Bikes, focus on integrating regenerative braking, IoT-enabled dashboards, and smartphone app control to improve the riding experience. Online channels boost direct-to-consumer reach, while subscription and financing options introduced by Accell Group and Tern enhance affordability. Overall, government incentives for eco-friendly mobility continue to attract new entrants and intensify competition across the e-city urban bike sector.
Key Player Analysis
- Tern
- Scott Sports SA
- Polygon Bikes
- Rad Power Bikes, LLC
- Trek Bicycles
- Accell Group
- Brompton Bicycle Ltd
- Specialized Bicycle Components
- Merida Bikes
- Giant Bicycles
Recent Developments
- In August 2023, Trek’s e-bike brand Electra introduced the Ponto Go!, featuring a long cargo rack and an extended bench saddle for improved passenger comfort and load capacity.
- In November 2022, Giant Bicycles launched the Stormguard E+, a full-suspension urban e-bike built for daily commutes, shopping trips, and light off-road use, offering enhanced comfort and durability.
- In January 2022, a consortium led by KKR acquired Accell Group in a $1.8 billion (€1.56 billion) deal aimed at capitalizing on the growing global e-bike demand.
Report Coverage
The research report offers an in-depth analysis based on Battery Type, Motor, Propulsion Type, Sales Channel and Geography. It details leading market players, providing an overview of their business, product offerings, investments, revenue streams, and key applications. Additionally, the report includes insights into the competitive environment, SWOT analysis, current market trends, as well as the primary drivers and constraints. Furthermore, it discusses various factors that have driven market expansion in recent years. The report also explores market dynamics, regulatory scenarios, and technological advancements that are shaping the industry. It assesses the impact of external factors and global economic changes on market growth. Lastly, it provides strategic recommendations for new entrants and established companies to navigate the complexities of the market.
Future Outlook
- Battery technology will improve range, charging speed, and overall riding efficiency.
- Foldable and lightweight models will attract apartment residents and office commuters.
- Connected bikes with GPS, anti-theft locks, and app control will gain popularity.
- Rental platforms and subscription services will expand in major cities.
- Delivery companies will increase e-bike fleets for low-cost last-mile logistics.
- Public charging stations and swapping networks will support long-distance use.
- Government subsidies and cycling infrastructure will boost adoption in developing regions.
- More brands will offer modular designs with swappable battery packs.
- Premium models will feature advanced suspension, ergonomic seats, and smart displays.
- Local assembly and component production will reduce costs and strengthen supply chains.

Request a Free Sample
Fill in your details and we'll send you a free sample report.
- Sample data tables & charts
- Research methodology
Need a Custom Version of This Report?
Tailor the scope, geography, or segments to your exact requirements.
- Custom geography or segment scope
- Direct access to our analyst team
Frequently Asked Questions
What is the current market size for the E-City Urban Bike market, and what is its projected size in 2032?
At what Compound Annual Growth Rate is the E-City Urban Bike market projected to grow between 2025 and 2032?
Which E-City Urban Bike market segment held the largest share in 2024?
What are the primary factors fueling the growth of the E-City Urban Bike market?
Who are the leading companies in the E-City Urban Bike market?
Table of Content
Chapter 1. Report Introduction
- 1.1 Report Description & Purpose
- 1.1.1 Report Title & Market Definition
- 1.1.2 Unique Selling Propositions (USP) & Key Differentiators
- 1.1.3 Value Proposition for Stakeholders
- 1.2 Research Objectives
- 1.2.1 Market Sizing Objectives (Volume & Revenue) (Volume Where Applicable)
- 1.2.2 Segmentation Objectives
- 1.2.3 Competitive Intelligence Objectives
- 1.2.4 Forecast & Scenario Objectives
- 1.3 Report Scope
- 1.3.1 E-City Urban Bike Scope – Segments & Subsegments Covered
- 1.3.2 Geographic Scope – Regions & Countries Covered
- 1.3.3 Historical Period, Base Year & Forecast Period (2024; forecast to 2032)
- 1.3.4 Inclusions & Exclusions
- 1.4 Industry Classification & Applicable Codes
- 1.5 Currency, Measurement Units & Valuation Basis
- 1.6 Target Stakeholders
- 1.7 Limitations & Assumptions
Chapter 2. Executive Summary
- 2.1 Global E-City Urban Bike Market Snapshot
- 2.1.1 Market Size – Historical (2024) & Forecast (2024-2032) (2024: USD 21.89 billion → 2032: USD 32.48 billion)
- 2.1.2 Volume & Revenue – Global Totals (Volume Where Applicable)
- 2.1.3 Key Market Highlights – Top Five Facts
- 2.2 E-City Urban Bike Market Segmentation Snapshot
- 2.2.1 Market Split by Region – 2024 vs. 2032
- 2.3 Competitive Snapshot
- 2.3.1 Top 10 Players by Revenue Share – 2024
- 2.3.2 Top 10 Players by Volume Share – 2024 (Volume Where Applicable)
- 2.3.3 Recent Strategic Developments (18-Month Summary)
- 2.4 Key Investment Highlights & Strategic Conclusions
Chapter 3. E-City Urban Bike Market Dynamics & Industry Analysis
- 3.1 Market Overview & Context
- 3.1.1 E-City Urban Bike Market Position in the Broader Industry Value Chain
- 3.1.2 Demand Structure & Purchasing Dynamics
- 3.1.3 Market Maturity & Development Stage by Region
- 3.2 E-City Urban Bike Market Drivers
- 3.3 E-City Urban Bike Market Restraints & Challenges
- 3.4 E-City Urban Bike Market Opportunities
- 3.5 Porter's Five Forces Analysis
- 3.5.1 Threat of New Entrants
- 3.5.2 Bargaining Power of Suppliers
- 3.5.3 Bargaining Power of Buyers
- 3.5.4 Threat of Substitutes
- 3.5.5 Competitive Rivalry – Intensity Assessment
- 3.6 E-City Urban Bike Value Chain Analysis
- 3.6.1 Upstream – Key Inputs, Resources & Suppliers
- 3.6.1.1 Key Input/Resource 1
- 3.6.1.2 Key Input/Resource 2
- 3.6.1.3 Key Input/Resource 3
- 3.6.2 Midstream – Core Operations & Value Creation
- 3.6.2.1 Operating Model & Process Overview
- 3.6.2.2 Key Operating Locations & Capabilities by Company
- 3.6.3 Downstream – Market Channels & End Users
- 3.6.3.1 Direct Sales & Customer Engagement Channels
- 3.6.3.2 Indirect Sales, Intermediaries & Partner Channels
- 3.6.4 Value Chain Profitability Analysis
- 3.6.1 Upstream – Key Inputs, Resources & Suppliers
- 3.7 PESTEL Analysis
- 3.7.1 Political Factors
- 3.7.2 Economic Factors
- 3.7.3 Social Factors
- 3.7.4 Technological Factors
- 3.7.5 Environmental Factors
- 3.7.6 Legal Factors
- 3.8 E-City Urban Bike Supply Chain Analysis
- 3.8.1 Critical Input & Resource Availability Risk Assessment
- 3.8.2 Supplier & Operational Concentration Risk (Geographic Exposure)
- 3.8.3 Supply & Service Disruption Impact Analysis
- 3.9 Regulatory & Policy Landscape
Note: The regulatory and policy landscape section covers regulations based on their applicability to the market, E-City Urban Bike category, geography, and scope of the study. Only regulatory frameworks with a material impact on operations, compliance, trade, sustainability, or market access are analyzed in detail.
Chapter 4. Key Investment Pockets & Opportunity Analysis
- 4.1 E-City Urban Bike Market Attractiveness Analysis
- 4.1.1 By Region – Investment Attractiveness Matrix (Market Size × CAGR)
- 4.2 Absolute Revenue Growth Opportunity
- 4.2.1 By Region – Absolute Revenue Growth Through 2032
- 4.3 Incremental Demand Opportunity
- 4.3.1 By Region – Incremental Demand Through 2032
- 4.3.2 Segment – Incremental Demand
- 4.4 Emerging Submarket Opportunity Deep Dive (Subject to Applicability)
- 4.5 Priority Market Opportunity Scorecards
- 4.5.1 United States
- 4.5.2 Europe
- 4.5.3 Asia
- 4.5.4 Middle East & Africa
Note: Priority market opportunity scorecards reflect the geographic scope and strategic relevance of the study. Listed markets are indicative and may be adapted to the industry.
Chapter 5. E-City Urban Bike Cross-Border Trade & Market Access Analysis
- 5.1 International Trade & Cross-Border Activity Overview
- 5.1.1 Global Export Value by Country (2024)
- 5.1.2 Global Export Volume by Country (2024) (Volume Where Applicable)
- 5.1.3 Global Import Value by Country (2024)
- 5.1.4 Global Import Volume by Country (2024) (Volume Where Applicable)
- 5.1.5 Net Trade Balance by Country (2024)
- 5.2 Export Analysis – Segment
- 5.2.1 Category 1 (Applicable Classification Code)
- 5.2.2 Category 2 (Applicable Classification Code)
- 5.2.3 Category 3 (Applicable Classification Code)
- 5.2.4 Category 4 (Applicable Classification Code)
- 5.2.5 Category 5 (Applicable Classification Code)
- 5.3 Import Analysis – Segment
- 5.3.1 Category 1 (Applicable Classification Code)
- 5.3.2 Category 2 (Applicable Classification Code)
- 5.3.3 Category 3 (Applicable Classification Code)
- 5.3.4 Category 4 (Applicable Classification Code)
- 5.3.5 Category 5 (Applicable Classification Code)
- 5.4 Cross-Border Pricing & Transaction Benchmarks
- 5.4.1 Export Pricing – Segment & Country
- 5.4.2 Import Pricing – Segment & Source Country
- 5.4.3 Price Trends (2024)
- 5.5 Key Cross-Border Trade & Delivery Routes
- 5.5.1 Cross-Border Trade/Delivery Route 1
- 5.5.2 Cross-Border Trade/Delivery Route 2
- 5.5.3 Cross-Border Trade/Delivery Route 3
- 5.5.4 Cross-Border Trade/Delivery Route 4
- 5.5.5 Cross-Border Trade/Delivery Route 5
- 5.6 Trade Policy & Market Access Impact Assessment
- 5.6.1 Tariff & Non-Tariff Barriers
- 5.6.2 Regional Trade & Economic Integration Frameworks
- 5.6.3 Bilateral & Multilateral Trade Agreements
- 5.6.4 Cross-Border Operating, Licensing & Localization Requirements
Note: This chapter applies where cross-border trade or delivery is relevant to E-City Urban Bike. Goods, services, and digital offerings are assessed using applicable classifications and transaction measures. Import-export volumes, trade balances, and route analyses are included only where meaningful to the market.
Chapter 6. Competitive Landscape & Company Benchmarking
- 6.1 E-City Urban Bike Market Concentration & Structure
- 6.1.1 Herfindahl-Hirschman Index (HHI) – the historical period vs. 2024
- 6.1.2 Leading, Mid-Sized & Emerging Player Structure
- 6.1.3 Global, Regional & Local Player Dynamics
- 6.2 E-City Urban Bike Market Share Analysis – 2024
- 6.2.1 Global Revenue Share by Company
- 6.2.2 Global Volume Share by Company (Volume Where Applicable)
- 6.2.3 Regional Revenue Share
- 6.2.4 Market Share Evolution (the historical period vs. 2024)
- 6.2.5 Company Market Share by Key Segment
- 6.2.6 Company Market Share by Customer Group
- 6.3 Operating Scale, Capacity & Infrastructure Analysis
- 6.3.1 Global Operating Scale & Supply Capacity
- 6.3.2 Resource Utilization & Operating Efficiency
- 6.3.3 Output, Service Delivery & Activity Metrics
- 6.3.4 Operating Footprint & Infrastructure Map
- 6.3.5 Planned Operational & Capacity Expansion
- 6.4 E-City Urban Bike Competitive Benchmarking Matrix
- 6.4.1 Revenue, Growth, Profitability & Operating Metric Comparison
- 6.4.2 Channel Revenue Mix
- 6.4.3 Geographic Revenue Exposure
- 6.4.4 R&D Intensity
- 6.4.5 Sustainability Maturity
- 6.5 Strategic Developments in E-City Urban Bike (Last 24 Months)
- 6.5.1 Mergers, Acquisitions & Divestments
- 6.5.2 New Products, Services & Solutions in E-City Urban Bike
- 6.5.3 Operational & Infrastructure Expansions
- 6.5.4 Strategic Alliances, Joint Ventures & Partnerships
- 6.5.5 Distribution Expansion & Market Entry
- 6.5.6 Sustainability & ESG Initiatives
- 6.6 Competitive Strategy Mapping
- 6.6.1 Leader, Challenger, Follower & Niche Classification
- 6.6.2 Pricing Strategy Comparison
- 6.6.3 Channel Strategy Matrix
Note: Strategic developments are included based on their materiality and the availability of reliable information.
Chapter 7. Global E-City Urban Bike Market – By Sales & Delivery Channel
- 7.1 Segment Overview
- 7.1.1 Volume & Revenue Split by Channel (2024 & 2032) (Volume Where Applicable)
- 7.1.2 Channel Mix Evolution (2024-2032)
Chapter 8. Regional Market Analysis – Global Overview
- 8.1 Global Regional Overview
- 8.1.1 Regional Volume Share (Volume Where Applicable)
- 8.1.2 Regional Revenue Share
- 8.1.3 Regional Volume by Region (Volume Where Applicable)
- 8.1.4 Regional Revenue by Region
- 8.1.5 Regional Forecast Through 2032
- 8.2 Cross-Regional Segment Analysis
- 8.2.1 By Sales & Delivery Channel
- 8.2.2 By Competitive Positioning & Price Tier
Chapter 9. North America E-City Urban Bike Market
- 9.1 United States
- 9.2 Canada
- 9.3 Mexico
Chapter 10. Europe E-City Urban Bike Market
- 10.1 Germany
- 10.2 France
- 10.3 Italy
- 10.4 United Kingdom
- 10.5 Spain
- 10.6 Poland
- 10.7 Russia
- 10.8 Netherlands
- 10.9 Belgium
- 10.10 Sweden
- 10.11 Denmark
- 10.12 Norway
- 10.13 Rest of Europe
Chapter 11. Asia Pacific E-City Urban Bike Market
- 11.1 China
- 11.2 India
- 11.3 Japan
- 11.4 South Korea
- 11.5 Thailand
- 11.6 Indonesia
- 11.7 Vietnam
- 11.8 Malaysia
- 11.9 Australia
- 11.10 Rest of Asia Pacific
Chapter 12. Latin America E-City Urban Bike Market
- 12.1 Brazil
- 12.2 Argentina
- 12.3 Colombia
- 12.4 Chile
- 12.5 Rest of Latin America
Chapter 13. Middle East E-City Urban Bike Market
- 13.1 Saudi Arabia
- 13.2 United Arab Emirates
- 13.3 Turkey
- 13.4 Israel
- 13.5 Iran
- 13.6 Rest of the Middle East
Chapter 14. Africa E-City Urban Bike Market
- 14.1 South Africa
- 14.2 Egypt
- 14.3 Nigeria
- 14.4 Morocco
- 14.5 Rest of Africa
Chapter 15. E-City Urban Bike Company Profiles
- 15.1 [Company 01]
- 15.1.1 Company Overview
- 15.1.2 Key Management Personnel
- 15.1.3 Products & Services Portfolio
- 15.1.4 Financial Performance
- 15.1.5 Key Market Focus & Geographic Presence
- 15.1.6 Recent Developments & Strategic Initiatives
Note: The company profile list is preliminary and may change based on research findings, market developments, data availability, and client requirements.
Chapter 16. Appendices
- Appendix A – List of Abbreviations & Acronyms
- Appendix B – Industry Classification Code Reference – Full Series
- Appendix C – Supply, Output & Operating Capacity Data Tables
- Appendix D – End-Use & Demand Base Tables
- Appendix E – Demand, Adoption & Usage Assumptions
- Appendix F – Pricing & Revenue Metric Reference Tables
- Appendix G – Company Operations & Infrastructure Database
- Appendix H – Cross-Border Trade & Activity Data Tables (Where Applicable)
- Appendix I – Regulatory Summary Tables
- Appendix J – Primary Research Participant List (Anonymized)
- Appendix K – Primary Research Questionnaire Framework
- Appendix L – Data Sources & Bibliography
- Appendix M – Market Size Divergence & Source Comparison
Chapter 17. Research Methodology
- 17.1 Research Framework & Philosophy
- 17.2 Secondary Research – Sources, Hierarchy & Data Extraction
- 17.3 Data Modeling – Bottom-Up & Top-Down Market Sizing
- 17.4 Primary Research – Stakeholder Framework, LOI & Sample Sizes
- 17.5 Forecast Methodology – Regression, Scenario & Sensitivity Analysis
- 17.6 Quality Control – Four-Layer Validation Framework
- 17.7 Limitations & Standard Assumptions
- 17.8 Disclaimer