Insured care and image archives pull AI into reading rooms
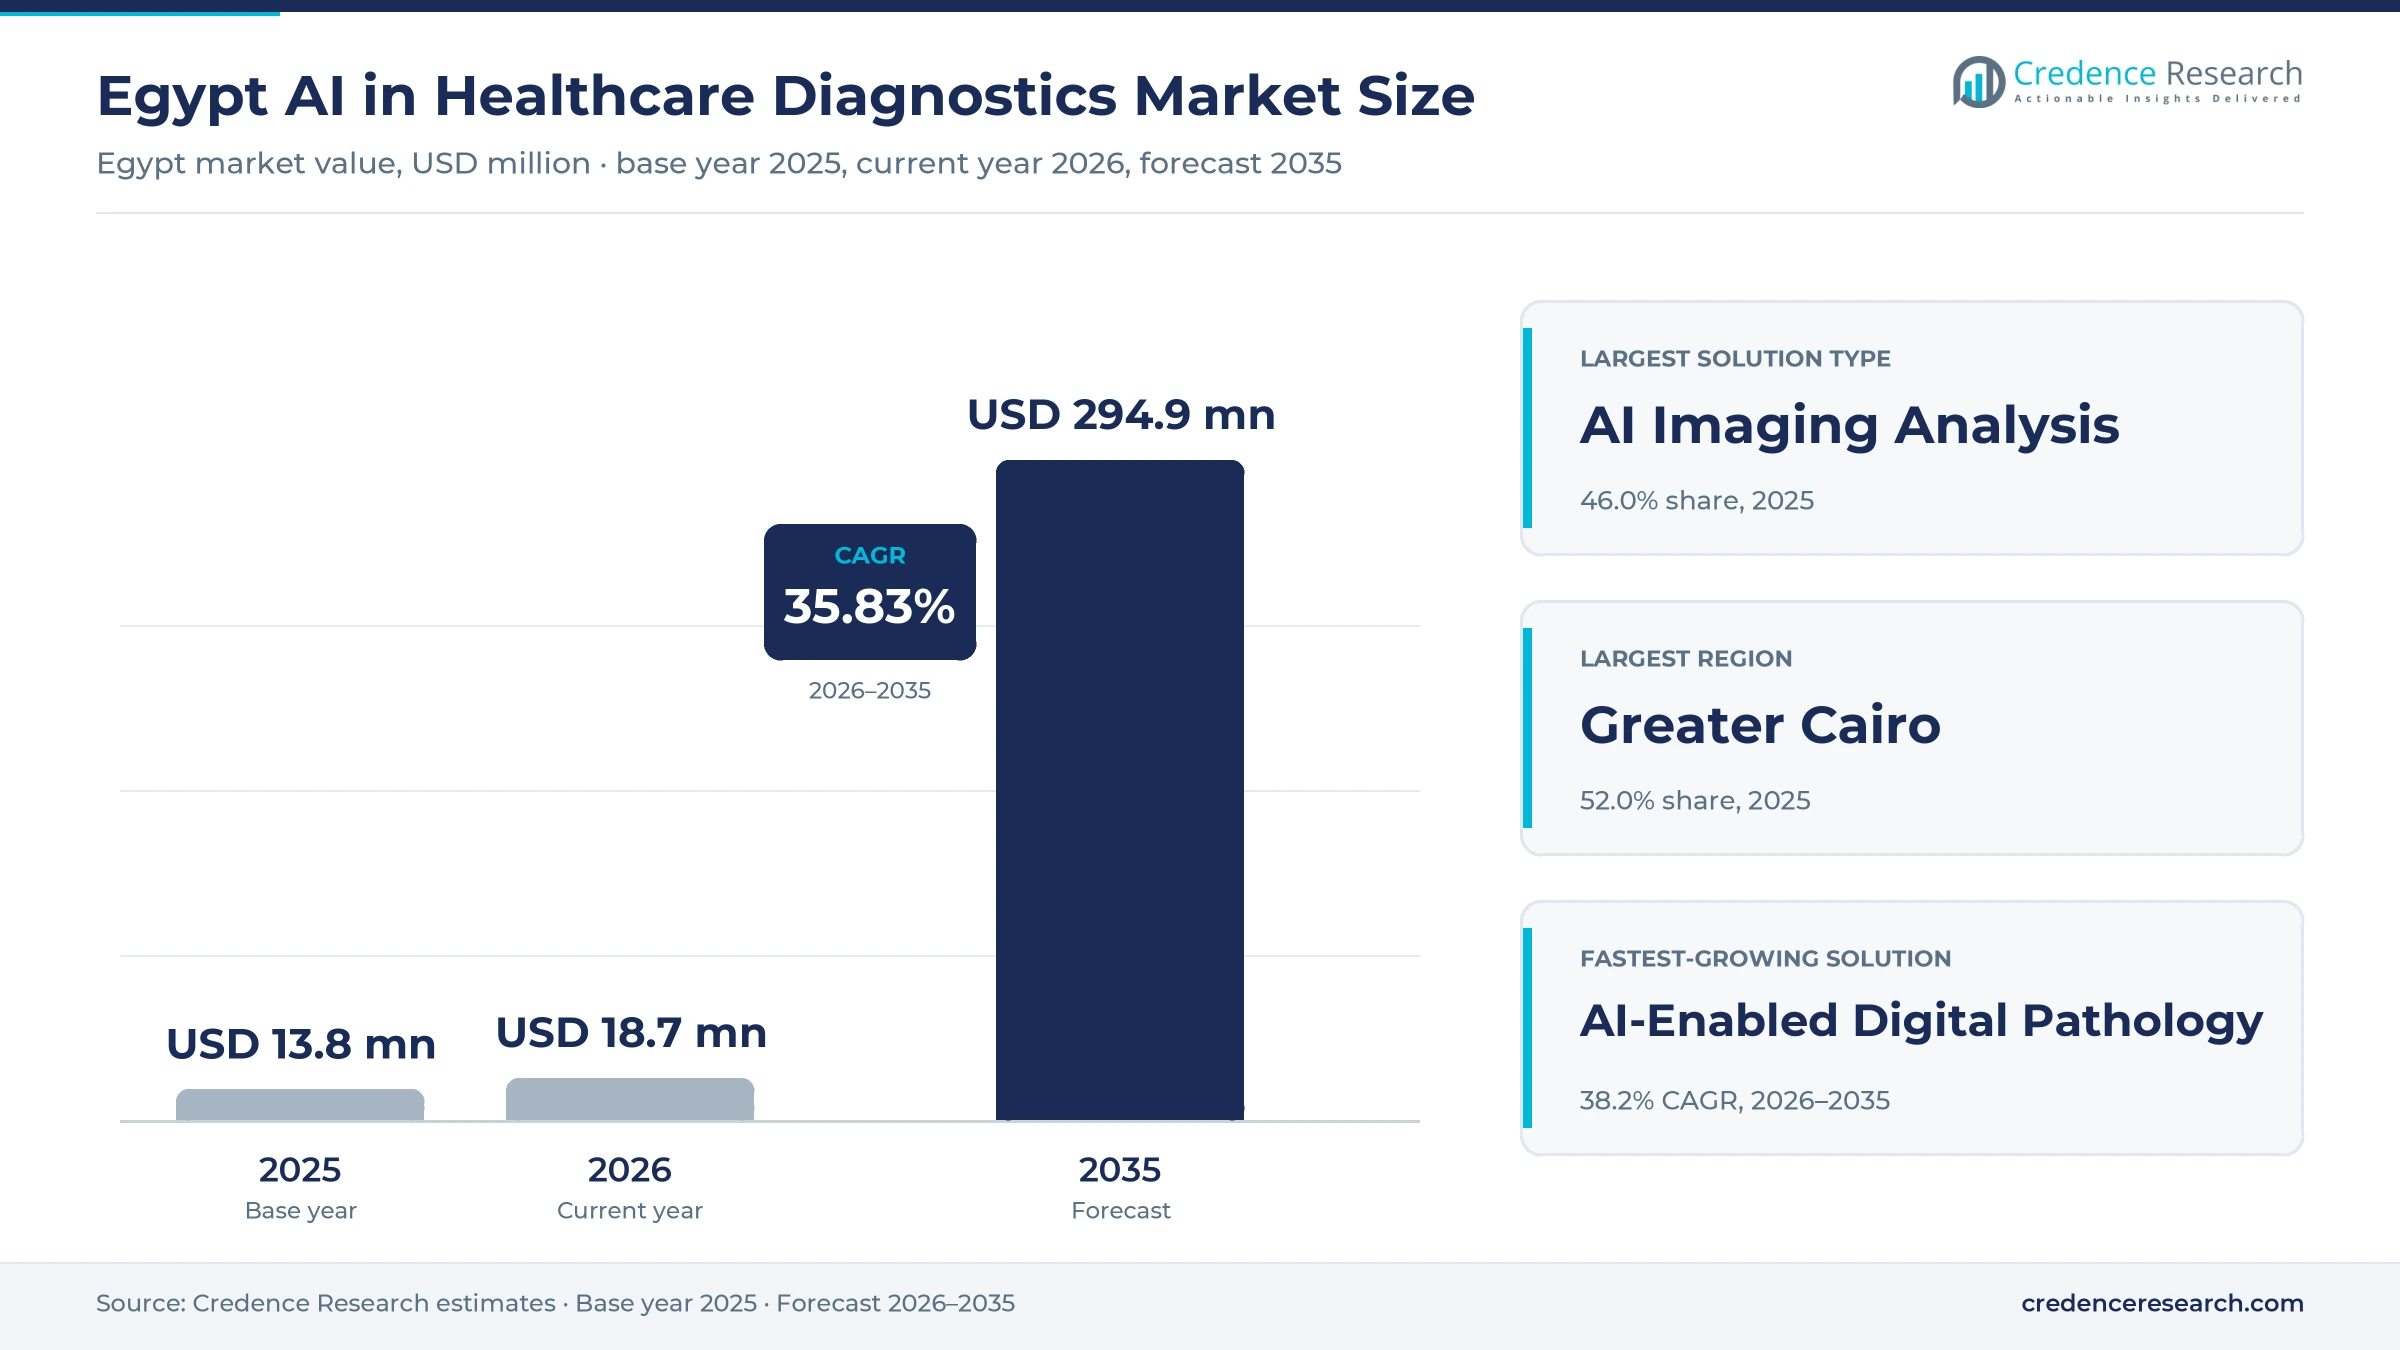
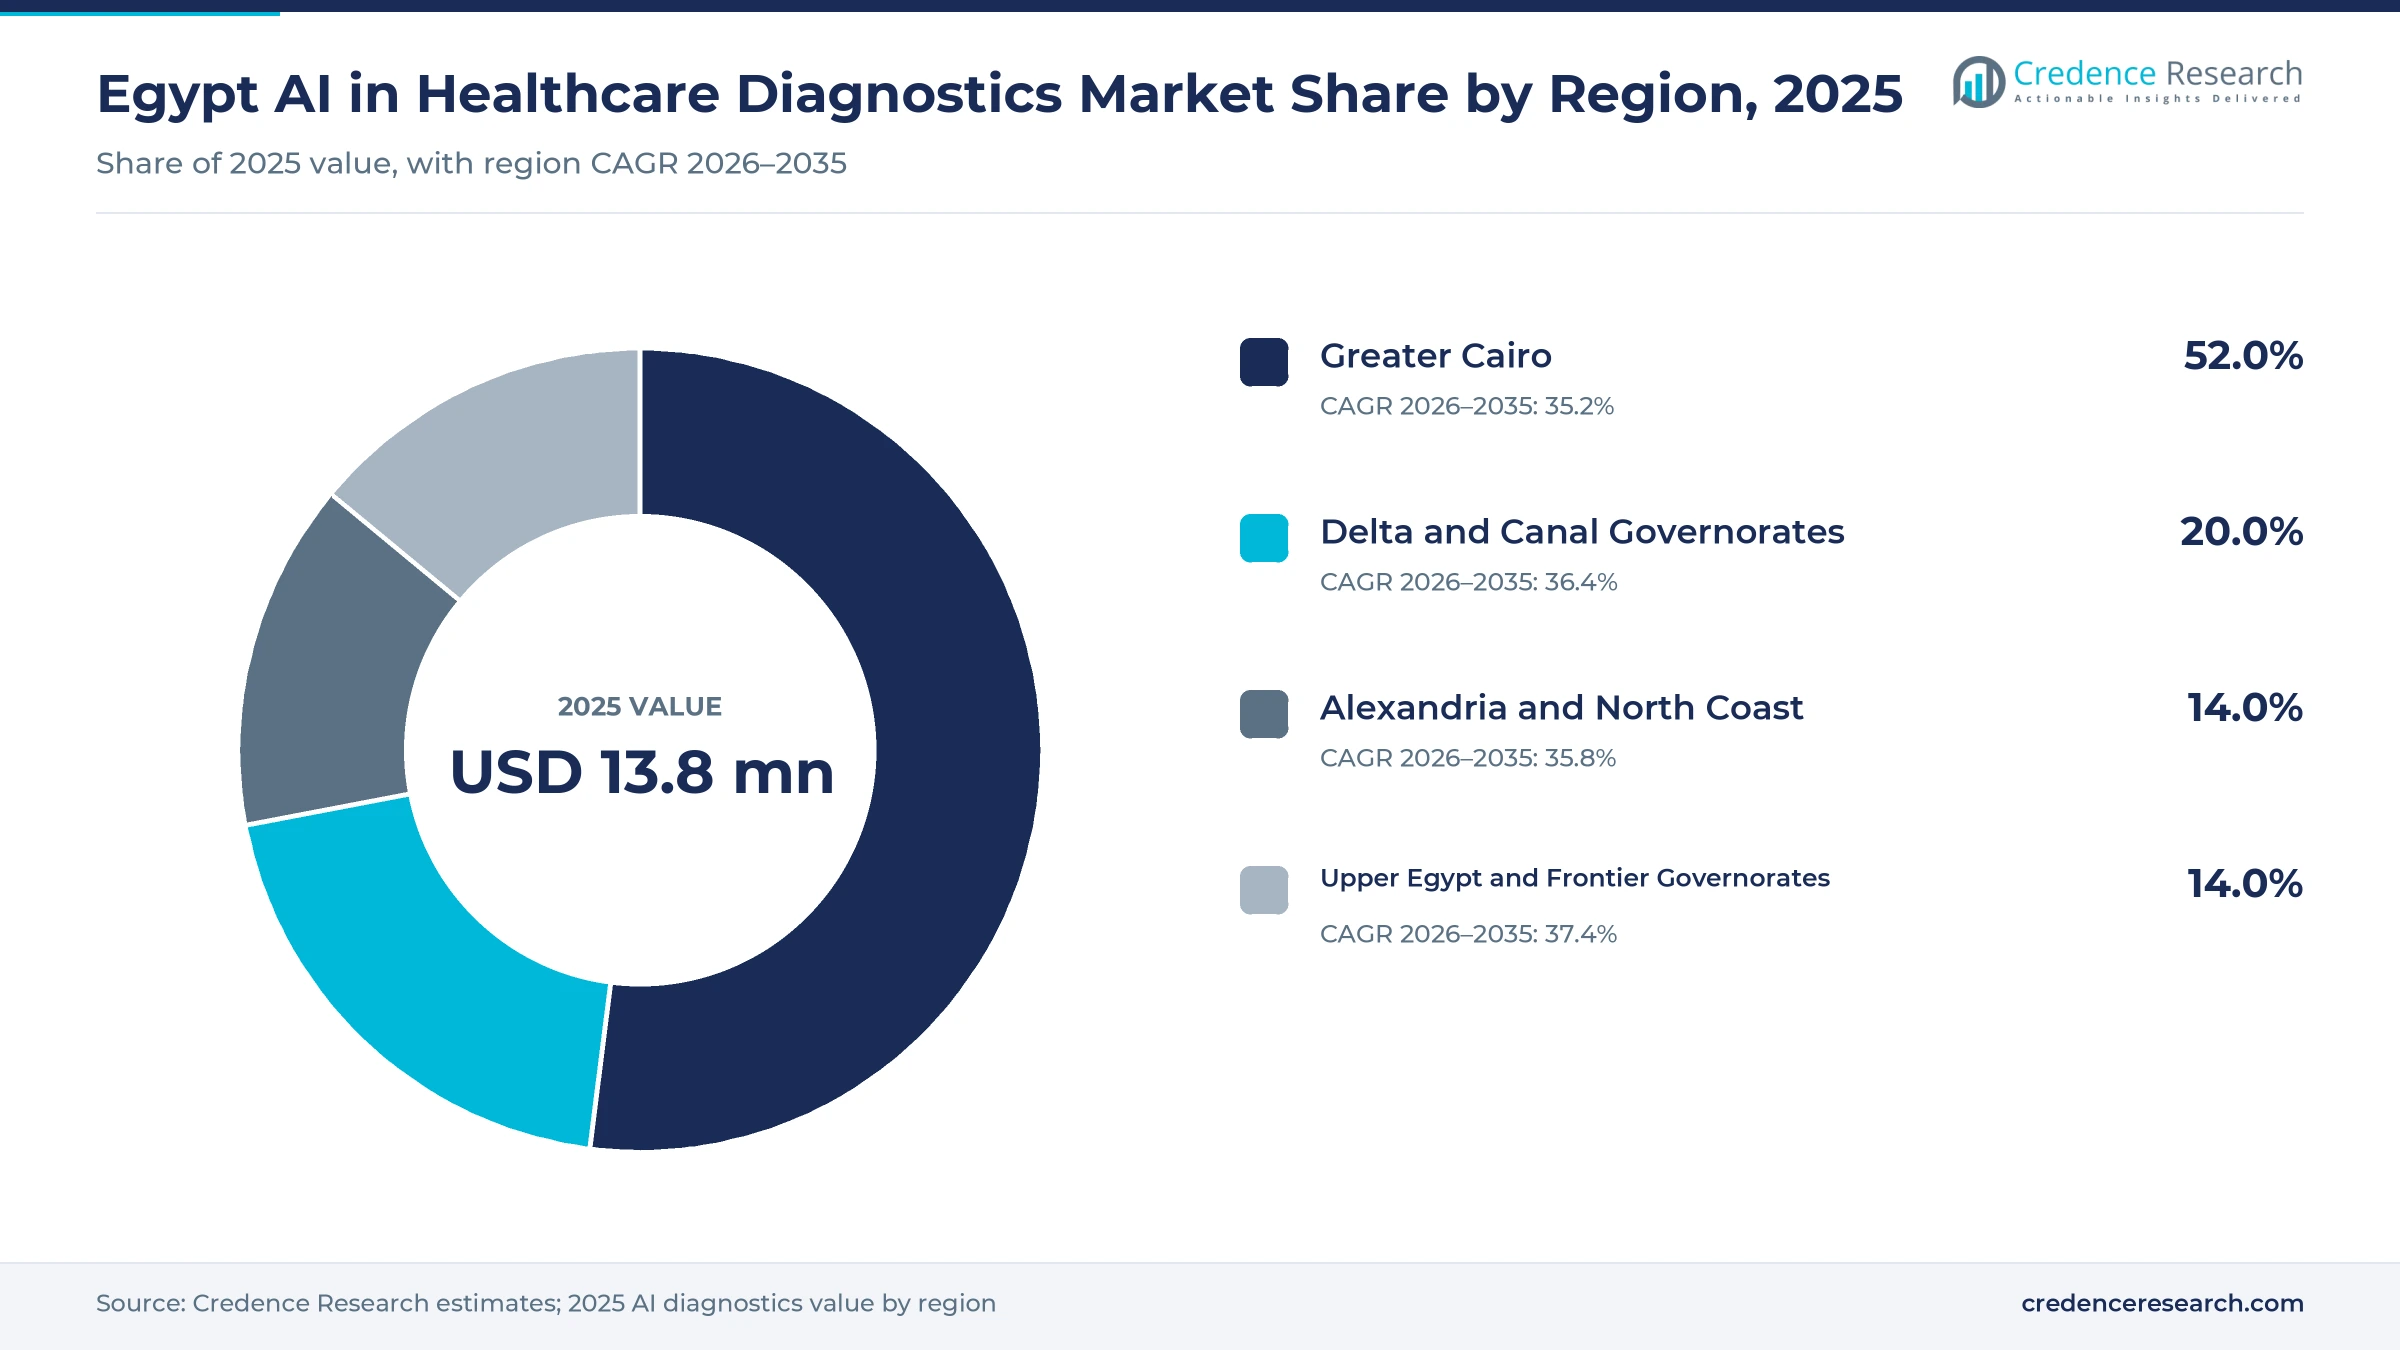
The Egypt AI in healthcare diagnostics market was valued at USD 13.8 million in 2025 and is projected to increase from USD 18.7 million in 2026 to USD 294.9 million by 2035, registering a CAGR of 35.83% during 2026–2035. Demand comes from hospitals and imaging centers that must read more scans with fewer specialists, from the Universal Health Insurance System as it adds governorates, and from national cancer screening that sends women and patients for imaging and biopsy. Greater Cairo held the largest regional share, 52.0% in 2025, because the capital concentrates teaching hospitals, the national disease control laboratories and the largest private radiology chains. Upper Egypt and Frontier Governorates is the fastest-growing region at 37.4% a year, as insured care and remote reading reach provinces with few resident radiologists. Commercially, scanner makers now ship deep learning reconstruction and triage inside new CT and MR systems, while local platforms sell AI-supported reports per scan.
Software that reads, ranks or flags clinical images and data counts
The estimate covers paid software and services that apply machine learning to diagnosis in Egypt, including AI image analysis for CT, MR, X-ray, ultrasound and mammography, AI tools for digitized pathology slides, clinical decision support that scores risk from records and results, and teleradiology services that use AI triage or drafting. It counts licences, subscriptions, per-study fees and the AI share of bundled scanner contracts.
The estimate excludes the scanners, microscopes and slide scanners themselves, general hospital information systems and AI used for drug discovery or administration, which belong to other markets. The value chain runs from global and local software developers through scanner makers, distributors and cloud providers to public authorities, university hospitals, private imaging chains and laboratories.
Egypt AI in Healthcare Diagnostics Market Insights
- The market was valued at USD 13.8 million in 2025 and is projected to reach USD 294.9 million by 2035, registering a CAGR of 35.83% during 2026–2035.
- Greater Cairo held 52.0% of 2025 value, because the capital hosts the teaching hospitals, the national disease control laboratories and most private radiology chains.
- AI imaging analysis led solution types with 46.0% of 2025 value, as vendors ship detection and reconstruction software inside new CT, MR and mammography systems.
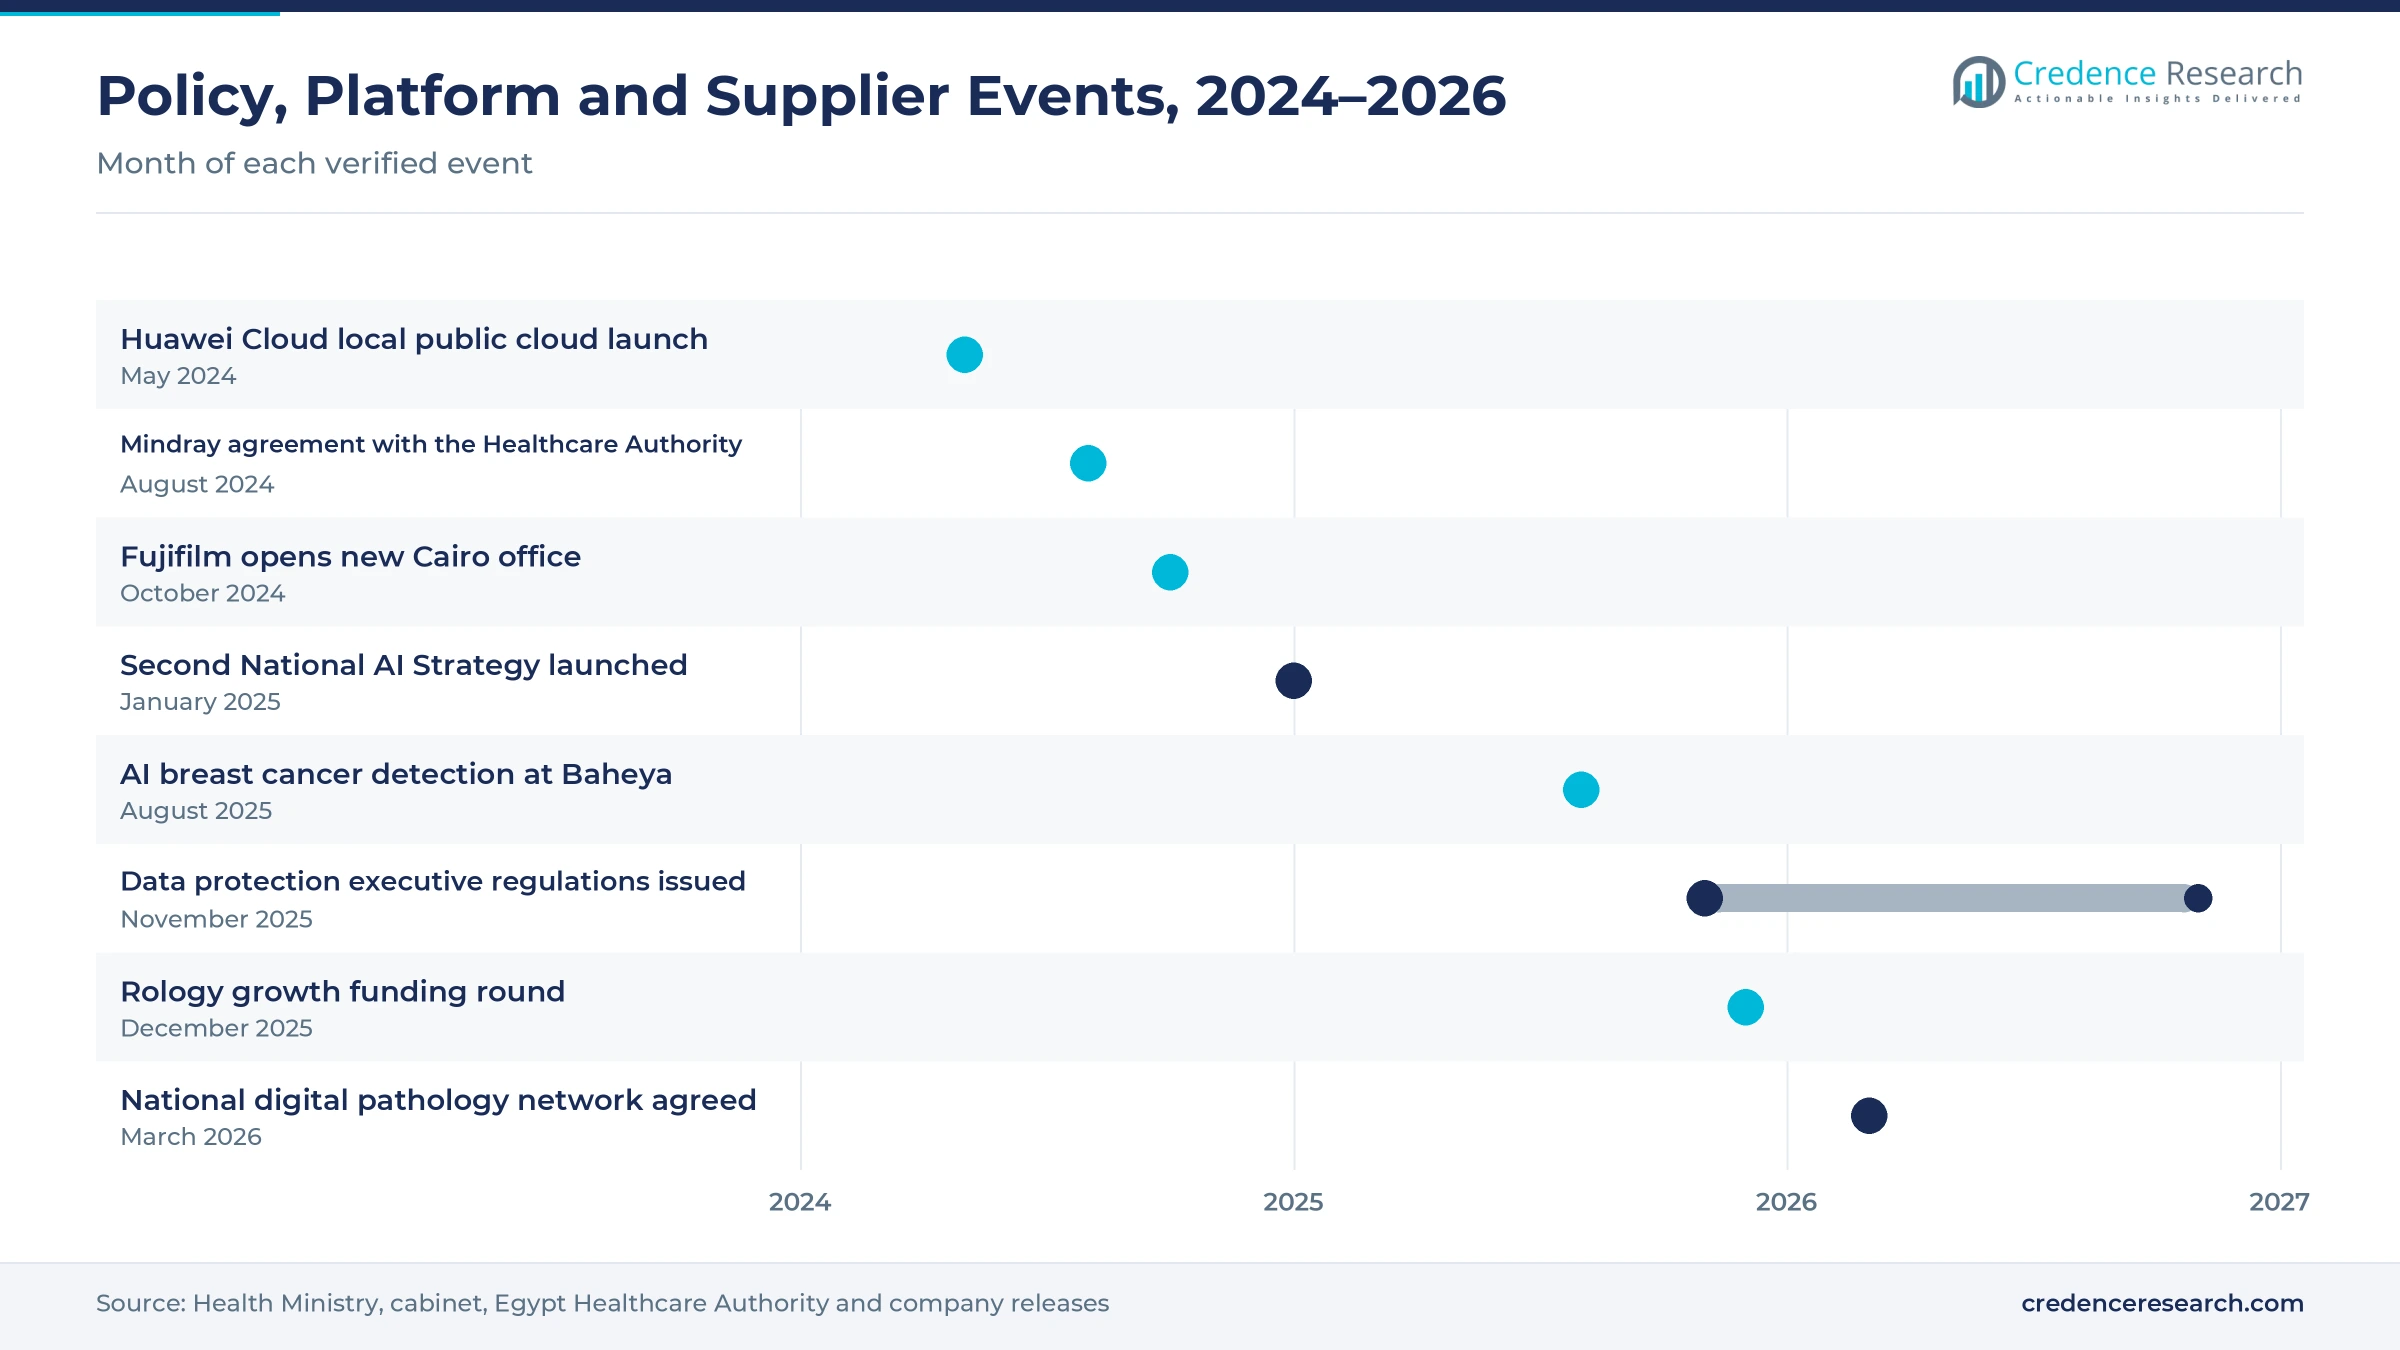
- The Ministry of Health and Population and Roche Diagnostics agreed on March 8, 2026, to build a national digital pathology network that applies AI to cancer slides.
- Rology, a Cairo teleradiology platform, has delivered more than 1.5 million radiology reports across 369 hospitals in 12 countries, SceneNow reported.
Imaging AI leads while digital pathology grows fastest
Why does imaging AI take the largest share?
Based on solution type, the market is categorized into AI imaging analysis, AI-enabled digital pathology, clinical decision support and AI-assisted teleradiology. AI Imaging Analysis led with a 46.0% share of 2025 value, because AI now arrives inside the scanners hospitals buy, and Philips told Daily News Egypt in July 2026 that its SmartSpeed Precise MR engine scans up to three times faster. AI-Enabled Digital Pathology grows fastest at 38.2% a year, as the national network agreed with Roche Diagnostics starts at seven sites, including oncology centers in Sohag, Kafr El-Sheikh and Beheira, where slides were previously read by hand.
Where are diagnostic AI tools first deployed?
Based on care setting, the market is categorized into tertiary and teaching hospitals, diagnostic imaging centers, clinical laboratories and pathology centers, and ambulatory and specialty clinics. Tertiary and Teaching Hospitals led with a 44.0% share of 2025 value, because flagship sites take the first systems, with Siemens Healthineers citing an Artis Icono suite at the Ain Shams University Stroke Center in June 2025. Ambulatory and Specialty Clinics grow fastest at 37.3% a year, as the Egypt Healthcare Authority plans 6,000 family medicine units and centers by 2030, Egyptian Streets reported, which will need decision support near patients.
Which conditions generate the most AI reads?
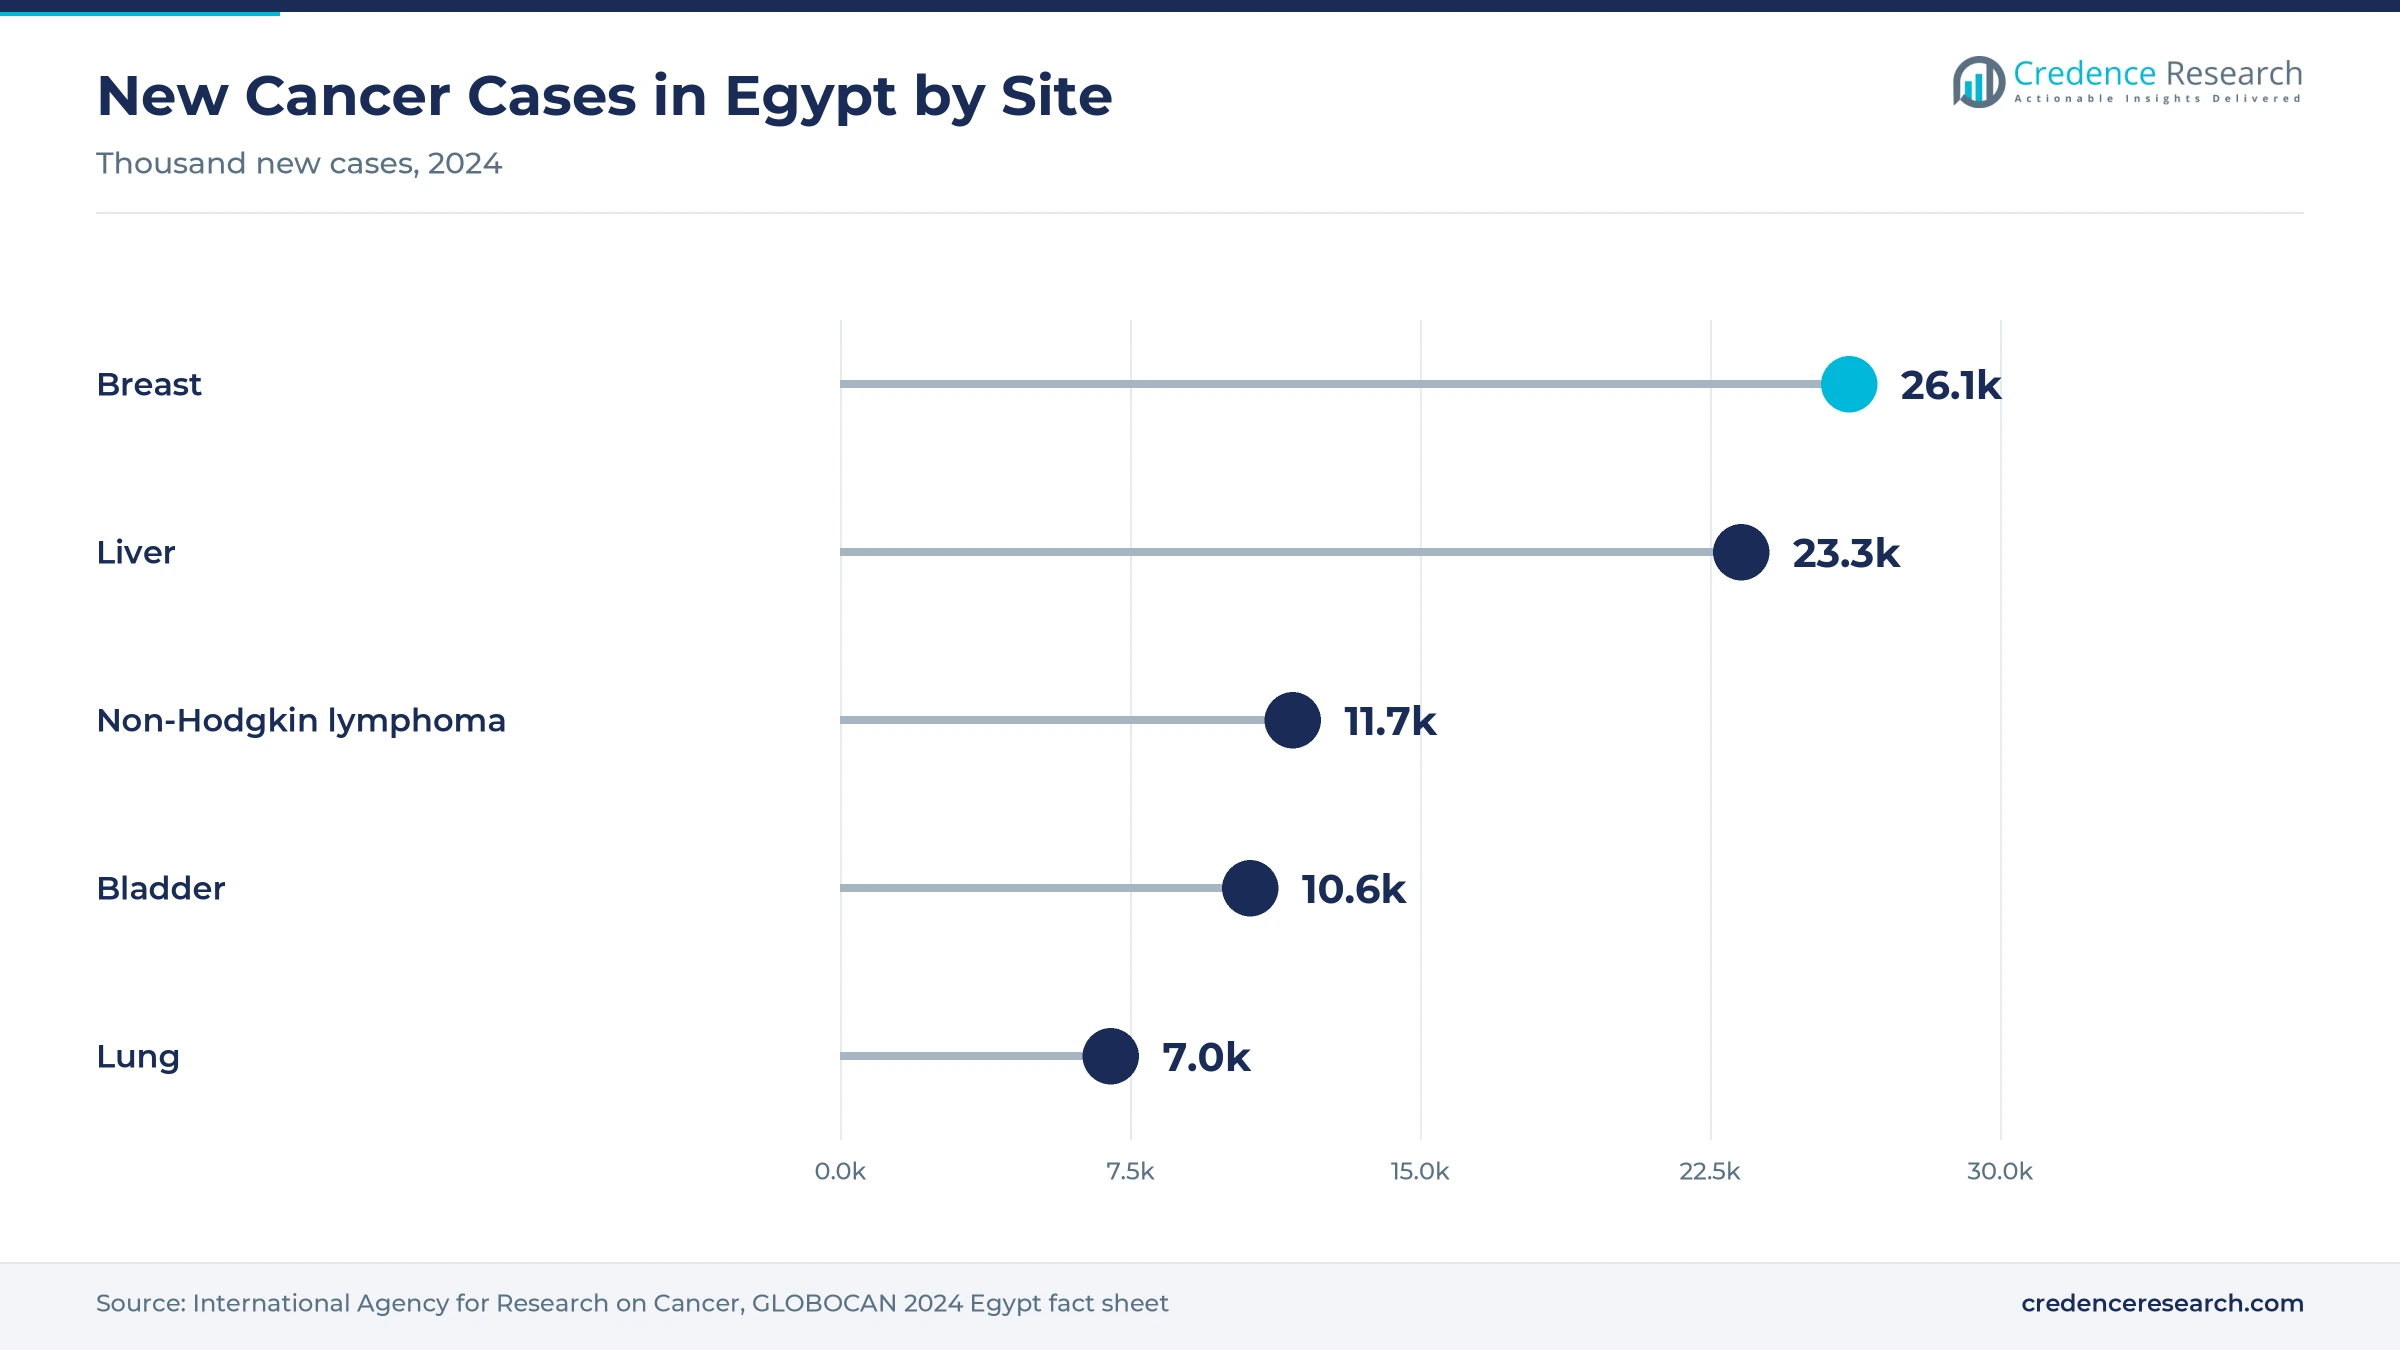
Based on disease area, the market is categorized into oncology, cardiovascular and neurovascular, pulmonary and infectious disease, and women's health. Oncology led with a 41.0% share of 2025 value, because Egypt had about 319,400 people living with a cancer diagnosed in the previous five years in 2024, and liver and bladder tumors need repeated CT, MR and biopsy review, GLOBOCAN data show. Women's Health grows fastest at 37.1% a year, as the presidential Women's Health Initiative had performed 525,126 mammograms and found 39,488 breast cancers by August 2026, Daily News Egypt reported.
How do providers buy diagnostic AI?
Based on channel, the market is categorized into direct enterprise sales, public tenders and UHI procurement, medtech distributor channels and cloud marketplace and SaaS. Direct Enterprise Sales led with a 40.0% share of 2025 value, because scanner makers sell AI with equipment and service contracts, and Philips Capital offers usage-based payments tied to patient volumes, the company said in July 2026. Cloud Marketplace and SaaS grows fastest at 38.1% a year, as Huawei Cloud began serving customers from a Telecom Egypt Tier III data center in May 2024, which lets providers keep imaging data inside the country.
| Segment Group | Leading Sub-segment | Share, 2025 | Fastest-growing Sub-segment | CAGR, 2026–2035 |
|---|---|---|---|---|
| By Solution Type | AI Imaging Analysis | 46.0% | AI-Enabled Digital Pathology | 38.2% |
| By Care Setting | Tertiary and Teaching Hospitals | 44.0% | Ambulatory and Specialty Clinics | 37.3% |
| By Disease Area | Oncology | 41.0% | Women's Health | 37.1% |
| By Channel | Direct Enterprise Sales | 40.0% | Cloud Marketplace and SaaS | 38.1% |
Per-scan fees and bundled licences set AI prices
Diagnostic AI is priced in three ways in Egypt, and the choice shapes who can afford it. Scanner makers fold AI into equipment and service contracts, so the software price is hidden in a capital tender and moves with the exchange rate. Teleradiology platforms charge per scan, which converts AI into an operating cost that rises with volume. Standalone software is sold as an annual licence per site or modality. Public tenders and vendor financing, such as the stepped, deferred or volume-linked payments Philips Capital offers, favor the bundled route, while provincial hospitals with uneven volumes prefer per-scan fees, which keeps margins highest for vendors that control both the scanner and the software.
| Offer | Typical price or fee | Basis |
|---|---|---|
| AI-assisted teleradiology | Per-scan fee, no hardware outlay, up to 25% lower reporting cost | Rology via SceneNow and MEA Tech Watch, 2025–2026 |
| Standalone imaging AI licence | About USD 12,000 to USD 20,000 a year per site or modality | Credence Research estimate from vendor subscription models |
| AI-assisted report, teleradiology | About USD 6 to USD 10 per study | Credence Research estimate from per-scan pricing |
| AI slide scoring, digital pathology | About USD 2 to USD 5 per scored slide | Credence Research estimate from per-slide software pricing |
Request a Free Sample
Fill in your details and we'll send you a free sample report.
- Sample data tables & charts
- Research methodology
Digital records, cancer volumes and policy lift demand
How does the national digital health build-out create AI demand?
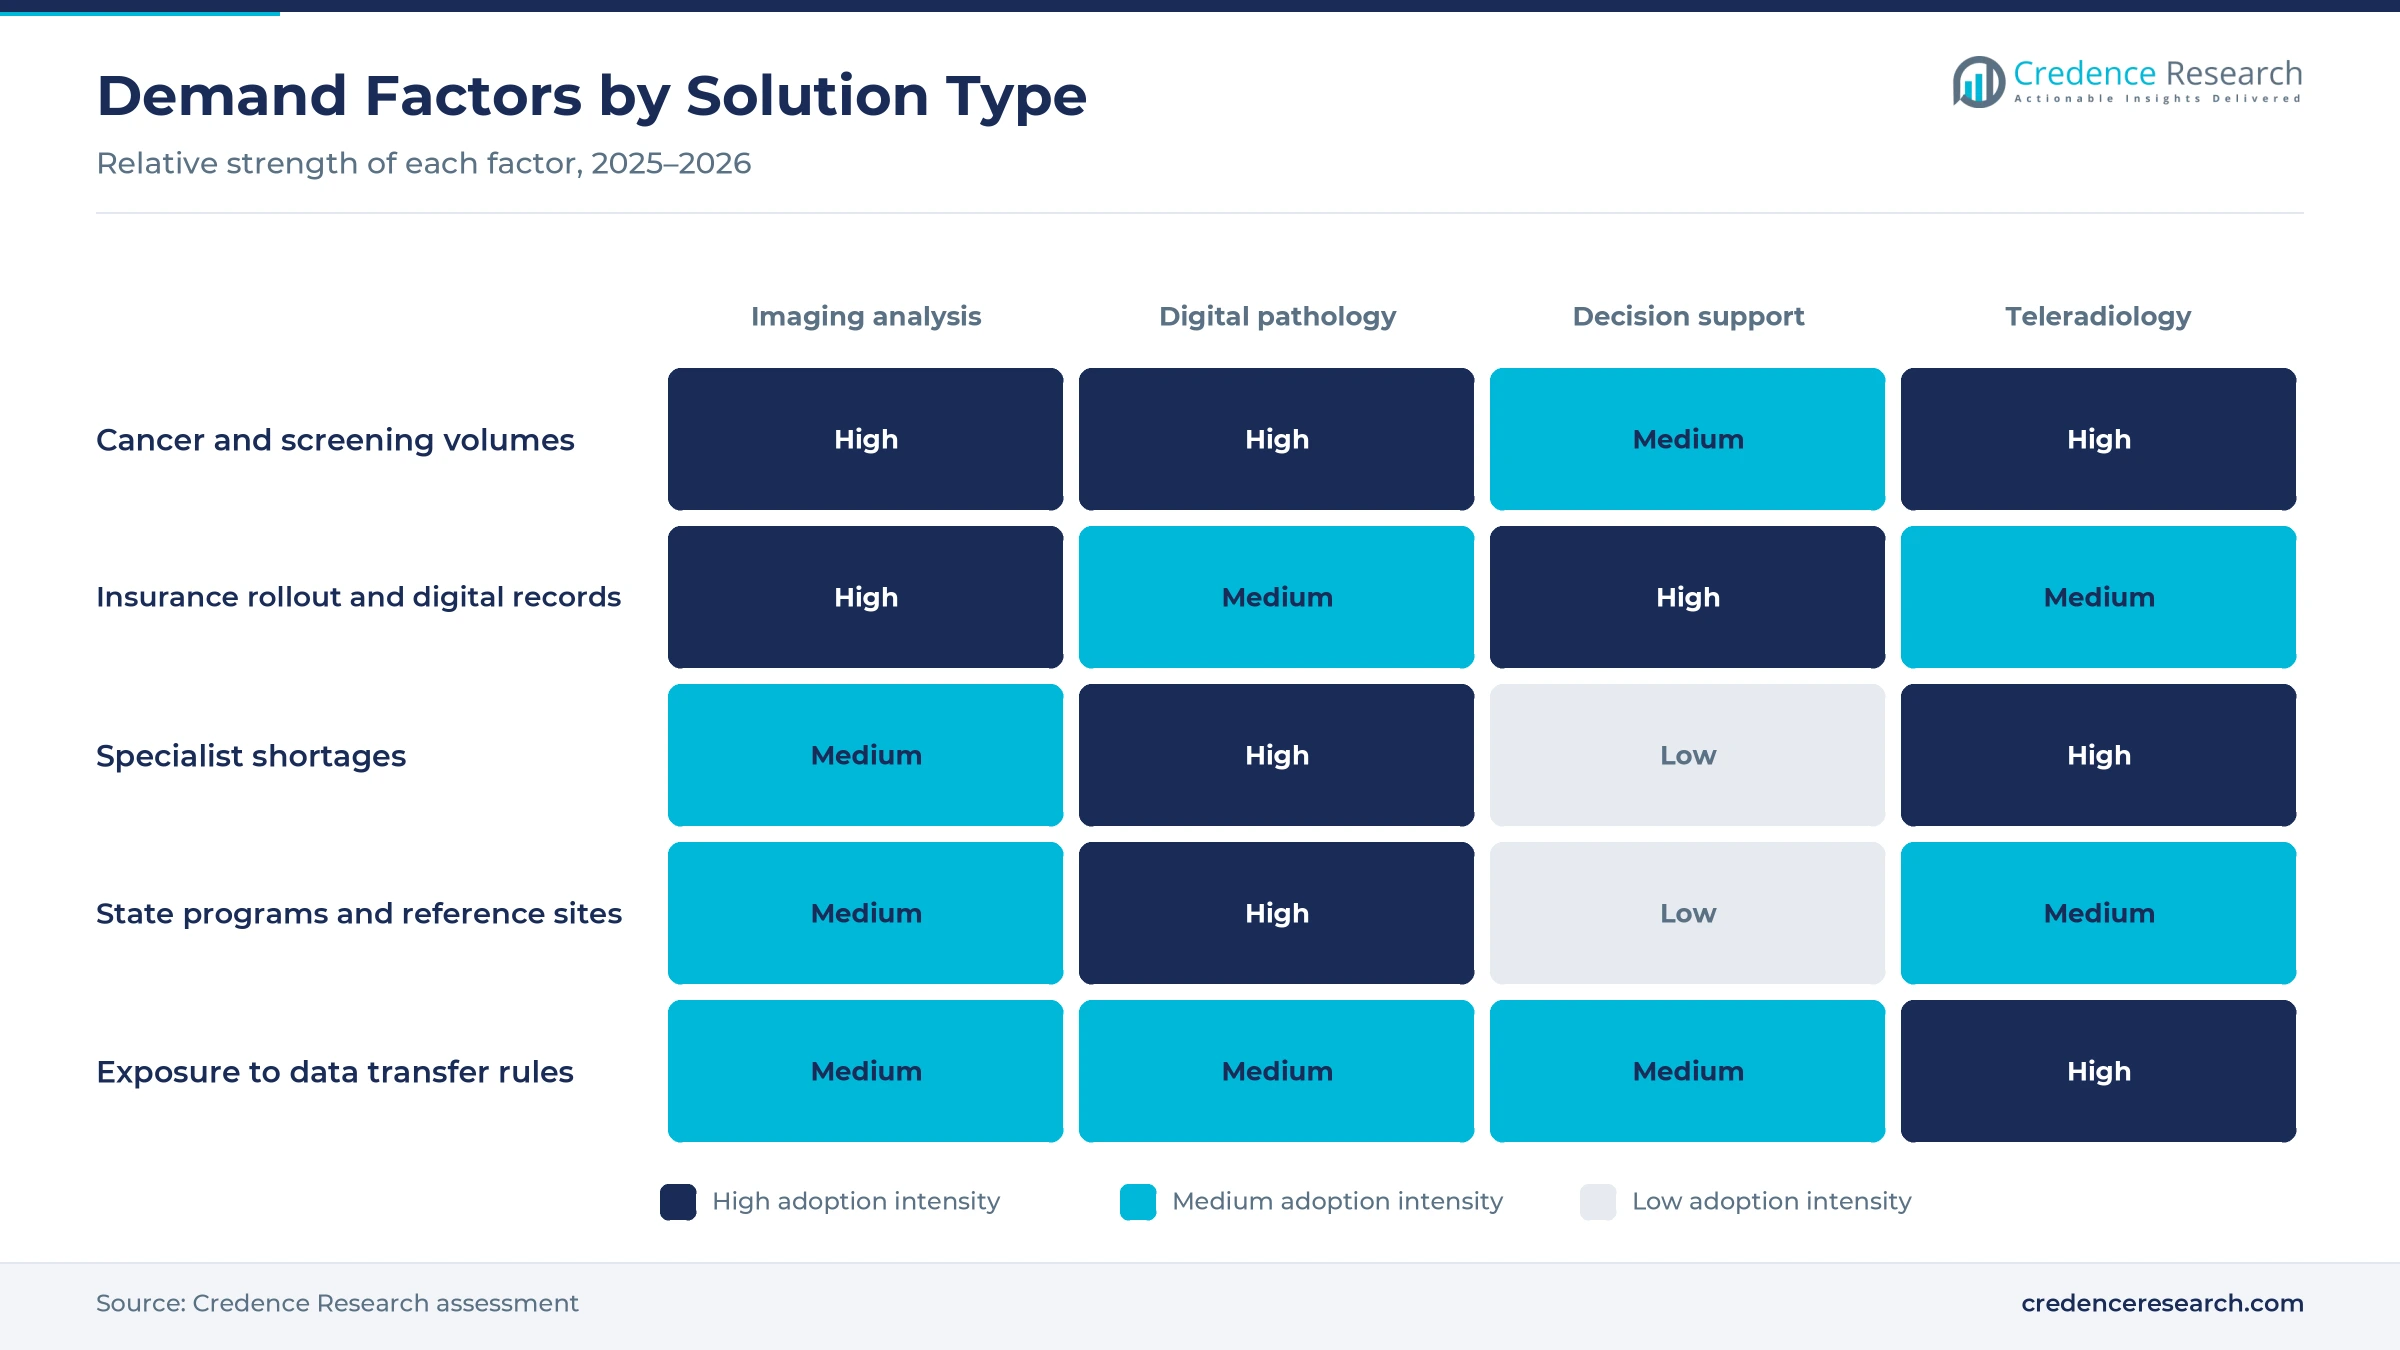
Insured care is producing the digital records and image archives that diagnostic AI needs. The Egypt Healthcare Authority holds more than 6 million electronic medical files and 500 million archived radiology images, according to Egyptian Streets in January 2025, and it named radiology management and early disease detection as AI priorities. The Universal Health Insurance System had registered 5.2 million beneficiaries in its six first-phase governorates by Nov. 30, 2025, the cabinet said. Its second phase targets about 13 million people in five more governorates, backed by 69 hospitals and 669 primary care units. Every new governorate adds PACS archives and coded results, which lowers the cost of training, validating and running AI tools.
Why does the scale of cancer and screening favor AI reading?
Cancer volumes give Egypt a large and growing base of scans and slides to read. Egypt recorded 137,390 new cancer cases in 2024, according to GLOBOCAN estimates from the International Agency for Research on Cancer, and breast, liver and bladder tumors lead the caseload. Screening has widened the funnel, as the Women's Health Initiative referred 936,669 women for advanced examinations between July 2019 and August 2026. The Health Ministry also said the initiative cut the time from suspected diagnosis to treatment from 270 days to 49 days. Holding that speed as referrals grow requires triage software that ranks urgent studies before a specialist opens them.
What do the AI strategy and state programs change for buyers?
Government policy is turning diagnostic AI from pilots into funded programs. President Abdel Fattah El-Sisi launched the second National AI Strategy for 2025 to 2030 in January 2025, targeting 30,000 AI professionals and more than 250 AI companies, Middle East AI News reported. The Applied Innovation Center of the communications ministry then deployed a breast cancer detection system with about 90% accuracy at Baheya Hospital in Sheikh Zayed in August 2025, Amwal Al Ghad reported. The Egypt Healthcare Authority signed a memorandum with Huawei in April 2025 that includes a national center for health data science and AI. State sponsorship gives vendors reference sites and public buyers, which shortens the sales cycle for later tenders.
Will specialist shortages push remote and assisted reading?
A thin specialist workforce makes AI-assisted and remote reading a practical necessity rather than a premium. Egypt had about 6.7 doctors per 10,000 people in 2020, against a global average of 17, and nearly 7,000 doctors left to work abroad in 2023, the head of the Egyptian Medical Syndicate said, as reported by Egyptian Streets. Pathology faces a sharper gap, which is why the national network routes provincial slides to a central hub for primary diagnosis and second opinions. Rology's pool of 341 radiologists across its markets shows how a small specialist base can be stretched with triage software. Each lost specialist raises the value of tools that let fewer readers cover more hospitals.
Pathology networks and pay-per-scan reading reshape supply
Shift from glass slides to networked digital pathology
Pathology is moving from microscopes in each hospital to scanned slides read across a network. The network announced on March 8, 2026, could raise diagnostic accuracy to about 92% from about 85% with traditional methods, the Health Minister said, according to Daily News Egypt. Roche says its Ventana scanner can digitize up to 480 slides a day, MEA Tech Watch reported. The ministry also explored online training and a pilot digital pathology service with China's Ningbo Clinical Pathology Diagnostic Center in September 2025, and it reviewed digital pathology and PACS projects with Huawei in August 2026. Once slides are digital, AI scoring of tumors and lymph nodes can be sold as an add-on to every new site.
Rise of pay-per-scan teleradiology with AI triage
Teleradiology priced per scan is replacing in-house reporting for many smaller hospitals. Rology, founded in Cairo in 2017, says hospitals pay per scan and need no capital spending on hardware, and that about 34.7% of patients it served in December 2025 came from rural areas, according to SceneNow. Its network includes 619 radiographers who acquire images locally while remote radiologists report them. The company also raised a growth round in December 2025 backed by the Philips Foundation, Johnson & Johnson Impact Ventures and the Sanofi Global Health Unit's Impact Fund, allAfrica reported. This model turns AI into an operating cost, which suits provincial hospitals that cannot hire full-time radiologists.
Can the second insurance phase open public tenders for AI?
The next stage of universal insurance is a clear opening for suppliers that can bid into public procurement. The second phase in Damietta, Matrouh, Kafr El-Sheikh, North Sinai and Minya will cost about EGP 115 billion, Prime Minister Mostafa Madbouly said in February 2025, Ahram Online reported. Its 69 hospitals plan 11,427 beds, and private providers are expected to supply 30% to 40% of them, the cabinet said in December 2025. A EUR 150 million loan from the French development agency signed in June 2026 adds to a USD 400 million World Bank loan for the system, Enterprise reported. Vendors that bundle AI into imaging and laboratory tenders for these hospitals can win multi-year volumes.
Will refurbished and local equipment widen the AI-ready base?
Cheaper and locally made equipment could extend AI features to hospitals that cannot buy new premium scanners. Siemens Healthineers opened an Advanced Imaging Renewal and Enhancement Center with the Health Ministry and the Unified Procurement Authority, announced at Africa Health ExCon in June 2025. Philips says its Circular Edition refurbished systems cost about 25% less than comparable new ones. Tatweer Medical, an El Ezaby company working with Mindray, began making ultrasound and X-ray systems in Badr City with capacity of about 2,000 and 1,500 units a year, ME Observer reported in July 2026. A wider installed base of digital, connected systems raises the number of sites that can add AI software later.
Data rules, registration and weak evidence slow buyers
Data transfer licensing raises the cost of cloud AI
Data protection rules add cost and delay for vendors that process scans abroad. The executive regulations of the personal data law, Ministerial Decision No. 816/2025, were issued on Nov. 1, 2025, and require a license for transfers outside Egypt, including to cloud environments, according to law firm CMS. Licence reviews take 90 working days after a complete application. Global vendors that host models outside the country must either localize processing or wait for approval, which favors local cloud and on-premises options.
Device registration timelines slow new software launches
Medical device registration slows the arrival of new AI products in Egypt. The Egyptian Drug Authority review takes about four to nine months depending on class and file quality, and foreign makers need a local registration holder, the U.S. International Trade Administration said in July 2025. Software updates that change intended use can need a new review. Smaller foreign AI developers therefore enter through distributors or scanner partners, which adds margin layers and delays access for public hospitals that buy only registered products.
Lack of published outcome evidence weakens budget cases
Public buyers still lack local evidence on what insured, digitized care achieves, which makes AI budgets harder to defend. A WHO-led impact evaluation of the first insurance phase was still being designed with the World Bank, JICA and the French development agency in August 2026, and no independent evaluation had been published, Enterprise reported. Without such data, finance officials weigh AI against beds and drugs on cost alone. Vendors that fund local validation studies and publish results can shorten that debate.
An imported scanner fleet ties AI to slow replacement cycles
Most advanced AI features reach Egyptian hospitals only when scanners are replaced, and replacement depends on scarce foreign currency. Local manufacturing is only starting, as public contracts for 100 ultrasound and 150 X-ray units from the Badr City plant were valued at EGP 300 million to EGP 400 million, ME Observer reported in July 2026. CT and MR systems, which carry most AI features, still come from abroad. Older fleets limit which AI tools can run, so many sites wait years before they can add detection or reconstruction software.
Cairo teaching hospitals anchor AI diagnostics demand
| Region | Value, 2025 (USD million) | Share, 2025 | CAGR, 2026–2035 |
|---|---|---|---|
| Greater Cairo | 7.2 | 52.0% | 35.2% |
| Delta and Canal Governorates | 2.8 | 20.0% | 36.4% |
| Alexandria and North Coast | 1.9 | 14.0% | 35.8% |
| Upper Egypt and Frontier Governorates | 1.9 | 14.0% | 37.4% |
Greater Cairo concentrates teaching hospitals and labs
Greater Cairo held 52.0% of 2025 value and grows at 35.2% a year, the largest regional market. The Egyptian Center for Disease Control in Imbaba anchors the national pathology network, and Nasser Institute Hospital and the Ain Shams research center are among its first sites. Private demand is also strongest here, as Fujifilm opened a new Cairo office in October 2024 after more than 30 years in Egypt. Growth is slower because Cairo, Giza and Qalyubia come last in the original insurance rollout plan.
The Delta and Canal governorates gain from early insurance
The Delta and Canal Governorates held 20.0% of 2025 value and grow at 36.4% a year. Port Said, Ismailia and Suez were in the first insurance phase, so their hospitals already run digital records and PACS under the Egypt Healthcare Authority. Damietta and Kafr El-Sheikh are in the second phase, and Kafr El-Sheikh and Beheira host oncology centers in the first wave of the pathology network. These governorates offer buyers that are both insured and densely populated.
Alexandria and the North Coast wait on insurance coverage
Alexandria and North Coast held 14.0% of 2025 value and grow at 35.8% a year. Alexandria has university hospitals and private imaging centers, and Fujifilm says its modality, IT and endoscopy systems are used in hospitals from Cairo to Alexandria. The city was still under consideration for the second insurance phase in December 2025, while Matrouh is already included. Public demand here therefore depends on when Alexandria joins the insured system.
Upper Egypt and frontier areas rely on remote reading
Upper Egypt and Frontier Governorates held 14.0% of 2025 value and grow fastest at 37.4% a year. Luxor, Aswan and South Sinai joined the first insurance phase, and Minya and North Sinai are in the second. Sohag hosts one of the first oncology centers in the pathology network. Long distances and few resident specialists make remote reading the default model, so teleradiology and central pathology hubs capture most new spending in these governorates.
Pathology, screening and funding moves from 2024 to 2026
| Development | Status and market relevance |
|---|---|
| In August 2024, Mindray signed a strategic cooperation agreement with the Egypt Healthcare Authority covering technology transfer, training and telemedicine. | Signed; supports insured hospitals |
| In August 2025, the Applied Innovation Center deployed an AI breast cancer detection system at Baheya Hospital in Sheikh Zayed. | Operating; extension to Haram planned |
| In December 2025, Rology raised a growth round backed by the Philips Foundation, Johnson & Johnson Impact Ventures and Sanofi. | Closed; funds regional expansion |
| In January 2026, the Health Minister met Mindray on local production of smart imaging systems and wider use of AI in radiology. | Under discussion; no figures announced |
| In March 2026, the Health Ministry and Roche Diagnostics signed a memorandum for a national AI-supported digital pathology network. | First phase at seven sites |
Vision models carry most clinical use, language tools follow
- Computer vision and deep learning detect nodules, bleeds and tumors on CT, MR, mammography and slides, and reconstruct images faster, which makes them the core of most current products.
- Predictive machine learning scores patient risk from laboratory results and records, the basis of clinical decision support for chronic disease in primary care.
- Natural language processing and large language models draft radiology reports and structure free text, and the national strategy plans an Arabic language model that could support medical uses.
- Multimodal AI combines images, pathology and records in one model, which will matter as digital pathology and PACS archives are linked.
Need a Custom Version of This Report?
Tailor the scope, geography, or segments to your exact requirements.
- Custom geography or segment scope
- Direct access to our analyst team
Scanner makers bundle AI as local platforms sell reads
Competition in the Egypt AI in healthcare diagnostics market is led by scanner and laboratory groups that sell AI with equipment, ahead of software specialists. Siemens Healthineers, GE HealthCare and Philips compete for CT, MR and X-ray tenders with AI reconstruction and triage, and Siemens Healthineers and GE HealthCare have engaged the Health Ministry on refurbishment and local production. Fujifilm and Canon Medical Systems compete in imaging and endoscopy, while Mindray works with the Egypt Healthcare Authority and a local partner on smart imaging. Roche Diagnostics holds the strongest position in pathology through the national network. Rology competes on per-scan reading for hospitals without radiologists, and Lunit supplies its INSIGHT MMG mammography software to the Baheya Foundation for breast cancer screening, according to a Lunit release on PR Newswire. Price, local registration, data handling and links to insurance tenders decide most contracts, because public buyers dominate volume.
How concentrated is the supply of diagnostic AI?
Supply is concentrated among a handful of scanner and laboratory groups that embed AI in equipment they already sell, with a small layer of software specialists. Siemens Healthineers, GE HealthCare, Philips, Canon Medical Systems, Fujifilm and Mindray control access to imaging departments through installed bases and service contracts. Pathology has one anchor supplier for now, which leaves later entrants a narrow opening in slide scoring software. Rology is the main local platform, reading studies for hospitals with remote radiologists and teleradiology tools. Barriers are high, because buyers need registration, local data handling and integration with PACS, so margins sit with vendors that own the installed base.
Key imaging, pathology and teleradiology suppliers
| Company | Type | Role in the market |
|---|---|---|
| Siemens Healthineers | Full-line imaging supplier | CT, MR and X-ray with AI reconstruction; imaging renewal center with the ministry |
| GE HealthCare | Full-line imaging supplier | CT, MR, ultrasound and X-ray with AI imaging tools and local production plans |
| Philips | Full-line imaging supplier | AI-enabled CT and MR, informatics and refurbished systems with flexible financing |
| Roche Diagnostics | Diagnostics and pathology specialist | Slide scanners and AI pathology software for the national digital network |
| Rology | Local teleradiology platform | AI-assisted remote radiology reporting for hospitals, priced per scan |
| FUJIFILM Middle East and Africa (FUJIFILM Holdings) | Imaging and endoscopy supplier | Modalities, healthcare IT, ultrasound and endoscopy with AI features |
| Mindray | Imaging and monitoring supplier | Ultrasound and imaging systems with AI functions; partner of the Healthcare Authority |
| Canon Medical Systems | Imaging supplier | CT and MR systems with deep learning image reconstruction |
| Lunit | AI software specialist | Lunit INSIGHT mammography and chest X-ray analysis software |
Credence Research view on public buying of diagnostic AI
Credence Research's view is that the Egypt AI in healthcare diagnostics market will be shaped by public buyers more than by private demand. The insurance authority, the Health Ministry and state cancer programs own the largest image archives and screening volumes, and their procurement choices will decide which vendors scale. Bundled AI in scanner tenders favors the global imaging groups, while per-scan reading and pathology networks open room for specialists. With 5.2 million insured beneficiaries registered and about 13 million more targeted, public demand for diagnostic AI will widen well beyond the capital. Buyers should insist on local validation and in-country data processing, and suppliers should price for provincial volumes rather than Cairo flagship sites.
Cancer, insurance and vendor data anchor the estimate
The report uses 2025 as the base year and 2026 to 2035 as the forecast period. Market values come from the Credence Research model, checked against GLOBOCAN cancer data, insurance rollout statistics, screening volumes and published vendor pricing models. Solution type, care setting, disease area, channel and regional splits are Credence Research estimates. Inputs include government and cabinet statements, regulator guidance, company announcements and press reports that name their sources. No interviews or surveys were used in preparing these estimates.
Pathology AI and provincial sites gain share to 2035
The Egypt AI in healthcare diagnostics market is expected to reach USD 294.9 million by 2035, growing at 35.83% a year during 2026–2035. Greater Cairo stays the largest region, while Upper Egypt and the frontier governorates grow fastest as insured care and remote reading spread. AI imaging analysis keeps the largest share, while AI-enabled digital pathology grows fastest at 38.2% a year as the national network adds oncology centers. Women's health becomes the fastest-growing disease area as breast screening volumes rise. Faster insurance rollout and in-country cloud capacity would lift this outlook, while currency shortages and slow registration would hold it back.
Public procurement decides the range of outcomes
The outcome depends mainly on how fast the insurance system adds governorates and whether public buyers fund AI as a line item rather than a scanner extra. A downside follows if the second phase slips, foreign currency stays scarce and data transfer licences slow cloud tools. An upside needs AI written into insurance tenders, the pathology network scaling beyond its first wave of sites and Alexandria joining the insured system. The base case assumes steady rollout and gradual budget support.
| Scenario | CAGR, 2026–2035 | Value, 2035 | What has to hold |
|---|---|---|---|
| Downside | 31.8% | USD 225.4 million | The second insurance phase slips and data transfer licences slow cloud deployments |
| Base | 35.83% | USD 294.9 million | Steady insurance rollout, gradual pathology scaling and bundled AI in scanner tenders |
| Upside | 38.8% | USD 359.0 million | AI enters insurance tenders and the pathology network reaches most oncology centers |
Frequently Asked Questions
How big is the Egypt AI in healthcare diagnostics market?
Which solution type leads diagnostic AI spending in Egypt?
Which region accounts for the most spending?
What is the national digital pathology network?
How does universal health insurance affect diagnostic AI?
Which disease area grows fastest?
What rules apply to diagnostic AI in Egypt?
Who are the main companies in the market?
Table of Content
Chapter 1 Market Segmentation
- 1.1 Segmentation Framework
- 1.1.1 Product and Service Classification
- 1.1.2 Application and End-Use Classification
- 1.1.3 Technology and Solution Classification
- 1.1.4 Customer and Distribution Channel Classification
- 1.1.5 Geographic Segmentation
- 1.1.6 Market Segment Definitions and Boundaries
- 1.2 By Solution Type
- 1.2.1 AI Imaging Analysis
- 1.2.2 AI-Assisted Teleradiology
- 1.2.3 Clinical Decision Support
- 1.2.4 AI-Enabled Digital Pathology
- 1.3 By Care Setting
- 1.3.1 Tertiary and Teaching Hospitals
- 1.3.2 Diagnostic Imaging Centers
- 1.3.3 Clinical Laboratories and Pathology Centers
- 1.3.4 Ambulatory and Specialty Clinics
- 1.4 By Disease Area
- 1.4.1 Oncology
- 1.4.2 Cardiovascular and Neurovascular
- 1.4.3 Pulmonary and Infectious Disease
- 1.4.4 Women's Health
- 1.5 By Channel
- 1.5.1 Direct Enterprise Sales
- 1.5.2 Public Tenders and UHI Procurement
- 1.5.3 MedTech Distributor Channels
- 1.5.4 Cloud Marketplace and SaaS
Chapter 2 Introduction
- 2.1 Report Objectives and Scope
- 2.2 Product Definition and Industry Terminology
- 2.3 Market Inclusions and Exclusions
- 2.4 Research Process
- 2.4.1 Primary Research and Expert Interviews
- 2.4.2 Secondary Research and Source Review
- 2.4.3 Top-Down and Bottom-Up Estimation
- 2.4.4 Data Triangulation and Verification
- 2.5 Market Size Measurement Basis
- 2.5.1 2025: USD 13.8 million → 2035: USD 294.9 million
- 2.6 Historical and Forecast Reference Periods
- 2.6.1 Historical Period: 2018-2025
- 2.6.2 Base Year: 2025
- 2.6.3 Forecast Period: 2025-2035
- 2.7 Research Assumptions and Limitations
Chapter 3 Executive Summary
- 3.1 Market Snapshot and Key Findings
- 3.2 Base-Year Market Size, 2025
- 3.3 Forecast Market Size, 2035
- 3.4 Revenue and Volume Growth Outlook
- 3.5 Key Demand and Supply Indicators
- 3.6 Leading Market Segments
- 3.7 Fastest-Growing Market Opportunities
- 3.8 Regional Performance Highlights
- 3.9 Technology and Industry Transformation
- 3.10 Competitive Landscape Summary
- 3.11 Analyst View and Strategic Implications
Chapter 4 Egypt AI in Healthcare Diagnostics Market Trends and Developments
- 4.1 Historical Industry Development, 2018-2025
- 4.2 Recent Market Trends and Developments
- 4.3 Demand and Customer Behavior Trends
- 4.4 Technology and Product Innovation
- 4.5 Artificial Intelligence, Automation and Digitalization
- 4.6 Local Manufacturing and Supply Chain Realignment
- 4.7 Industry Partnerships, Mergers and Acquisitions
- 4.8 Sustainability and Circular Economy Developments
- 4.9 Government and Private Sector Investment Trends
- 4.10 Emerging Business Models and Commercialization
- 4.11 Industry Developments and Announcements
Chapter 5 Egypt AI in Healthcare Diagnostics Market Production, Supply and Demand Analysis
- 5.1 Demand Trend and Consumption Analysis, 2018-2025
- 5.2 Demand Forecast, 2025-2035
- 5.3 Production and Output Trend, 2018-2025
- 5.4 Production and Output Forecast, 2025-2035
- 5.5 Installed Capacity and Capacity Utilization
- 5.6 Company-Wise Production Plants and Statistics
- 5.6.1 Installed Production Capacity
- 5.6.2 Actual Production
- 5.6.3 Planned Capacity and Expansion Targets
- 5.7 Supply Chain Structure and Procurement Trends
- 5.8 Supply-Demand Gap and Bottlenecks
- 5.9 Import Dependence and Sourcing Structure
- 5.10 Contract Manufacturing and Outsourcing
- 5.11 Regional Supply and Demand Concentration
Chapter 6 Egypt AI in Healthcare Diagnostics Market Pricing Analysis
- 6.1 Pricing Structure and Measurement
- 6.2 Historical Pricing Trends, 2018-2025
- 6.3 Pricing Outlook, 2025-2035
- 6.4 Average Selling Price and Unit Economics
- 6.5 Pricing by Product and Market Segment
- 6.6 Geographic Pricing Differences
- 6.7 Key Input, Energy, Labor and Logistics Costs
- 6.8 Contract Pricing and Purchasing Models
- 6.9 Pricing Sensitivity and Competitive Positioning
- 6.10 Price, Margin and Profitability Implications
Chapter 7 Egypt AI in Healthcare Diagnostics Market Dynamics
- 7.1 Market Growth Drivers
- 7.1.1 Demand-Side Drivers
- 7.1.2 Technology and Innovation Drivers
- 7.1.3 Infrastructure and Investment Drivers
- 7.1.4 Regulatory and Policy Drivers
- 7.2 Market Restraints
- 7.2.1 Cost and Affordability Constraints
- 7.2.2 Technology and Adoption Barriers
- 7.2.3 Supply Chain and Operational Constraints
- 7.3 Market Challenges
- 7.3.1 Competitive Pressure and Margin Erosion
- 7.3.2 Skills, Infrastructure and Implementation Gaps
- 7.4 Emerging Market Opportunities
- 7.5 Market Dynamics Impact and Time-Horizon Assessment
Chapter 8 Egypt AI in Healthcare Diagnostics Value Chain Analysis
- 8.1 Industry Value Chain Overview
- 8.2 Upstream Suppliers and Critical Inputs
- 8.3 Technology and Component Providers
- 8.4 Manufacturing or Service Delivery
- 8.5 Distribution, Channel Partners and Integrators
- 8.6 Downstream Applications and End Users
- 8.7 Value Addition and Profit Pools
- 8.8 Vertical Integration and Outsourcing
- 8.9 Supplier Concentration and Risk
- 8.10 Supply Chain Localization and Resilience
Chapter 9 Egypt AI in Healthcare Diagnostics Market Regulations and Policies
- 9.1 Relevant Laws, Standards and Compliance Frameworks
- 9.2 Product, Service, Safety and Quality Requirements
- 9.3 Government Policies, Incentives and Subsidies
- 9.4 Imports, Exports and Trade Barriers
- 9.5 Public Procurement and Local Content Requirements
- 9.6 Environmental and Sustainability Compliance
- 9.7 Upcoming Policy Changes and Market Implications
Chapter 10 Egypt AI in Healthcare Diagnostics Market Hotspots and Opportunities
- 10.1 Market Opportunity Mapping and Growth Hotspots
- 10.2 High-Growth Applications and Customer Groups
- 10.3 Underserved Markets and White-Space Opportunities
- 10.4 Emerging Technology and Product Opportunities
- 10.5 New Capacity and Investment Hotspots
- 10.6 Market Entry and Expansion Opportunities
- 10.7 Distribution and Partnership Opportunities
- 10.8 Near-Term and Long-Term Commercial Potential
- 10.9 Opportunity Attractiveness and Execution Risks
Chapter 11 Egypt AI in Healthcare Diagnostics Market Outlook, 2025-2035
- 11.1 Market Size and Analysis
- 11.1.1 Revenue (Market Measurement: 2025: USD 13.8 million → 2035: USD 294.9 million)
- 11.1.2 Market Volume and Quantity Sold
- 11.1.3 Historical Market Size, 2018-2025
- 11.1.4 Base-Year Market Size, 2025
- 11.2 Market Forecast, 2025-2035
- 11.2.1 Revenue Forecast to 2035
- 11.2.2 Volume Forecast to 2035
- 11.2.3 CAGR and Year-on-Year Growth
- 11.2.4 Incremental Revenue Opportunity
- 11.3 Forecast Assumptions and Scenario Analysis
- 11.3.1 Base-Case Forecast
- 11.3.2 Optimistic and Conservative Scenarios
- 11.3.3 Technology, Pricing and Policy Sensitivities
- 11.4 Market Attractiveness and Growth Outlook
Chapter 12 Egypt AI in Healthcare Diagnostics Market Segmentation and Outlook
- 12.1 Segmentation Summary and Market Shares, 2025
- 12.2 Largest and Fastest-Growing Segments
- 12.3 By Solution Type - Market Size and Forecast, 2025-2035
- 12.3.1 Segment Definition and Scope
- 12.3.2 Historical Market Size, 2018-2025
- 12.3.3 Revenue Forecast, 2025-2035
- 12.3.4 Volume Forecast, 2025-2035
- 12.3.5 Base-Year Market Share, 2025
- 12.3.6 Segment CAGR and Growth Drivers
- 12.3.7 Subsegment Market Size and Forecast
- 12.3.7.1 AI Imaging Analysis
- 12.3.7.2 AI-Assisted Teleradiology
- 12.3.7.3 Clinical Decision Support
- 12.3.7.4 AI-Enabled Digital Pathology
- 12.3.8 Subsegment Pricing and Adoption Trends
- 12.3.9 Leading Suppliers and Competition
- 12.3.10 Regional Demand and Opportunities
- 12.4 By Care Setting - Market Size and Forecast, 2025-2035
- 12.4.1 Segment Definition and Scope
- 12.4.2 Historical Market Size, 2018-2025
- 12.4.3 Revenue Forecast, 2025-2035
- 12.4.4 Volume Forecast, 2025-2035
- 12.4.5 Base-Year Market Share, 2025
- 12.4.6 Segment CAGR and Growth Drivers
- 12.4.7 Subsegment Market Size and Forecast
- 12.4.7.1 Tertiary and Teaching Hospitals
- 12.4.7.2 Diagnostic Imaging Centers
- 12.4.7.3 Clinical Laboratories and Pathology Centers
- 12.4.7.4 Ambulatory and Specialty Clinics
- 12.4.8 Subsegment Pricing and Adoption Trends
- 12.4.9 Leading Suppliers and Competition
- 12.4.10 Regional Demand and Opportunities
- 12.5 By Disease Area - Market Size and Forecast, 2025-2035
- 12.5.1 Segment Definition and Scope
- 12.5.2 Historical Market Size, 2018-2025
- 12.5.3 Revenue Forecast, 2025-2035
- 12.5.4 Volume Forecast, 2025-2035
- 12.5.5 Base-Year Market Share, 2025
- 12.5.6 Segment CAGR and Growth Drivers
- 12.5.7 Subsegment Market Size and Forecast
- 12.5.7.1 Oncology
- 12.5.7.2 Cardiovascular and Neurovascular
- 12.5.7.3 Pulmonary and Infectious Disease
- 12.5.7.4 Women's Health
- 12.5.8 Subsegment Pricing and Adoption Trends
- 12.5.9 Leading Suppliers and Competition
- 12.5.10 Regional Demand and Opportunities
- 12.6 By Channel - Market Size and Forecast, 2025-2035
- 12.6.1 Segment Definition and Scope
- 12.6.2 Historical Market Size, 2018-2025
- 12.6.3 Revenue Forecast, 2025-2035
- 12.6.4 Volume Forecast, 2025-2035
- 12.6.5 Base-Year Market Share, 2025
- 12.6.6 Segment CAGR and Growth Drivers
- 12.6.7 Subsegment Market Size and Forecast
- 12.6.7.1 Direct Enterprise Sales
- 12.6.7.2 Public Tenders and UHI Procurement
- 12.6.7.3 MedTech Distributor Channels
- 12.6.7.4 Cloud Marketplace and SaaS
- 12.6.8 Subsegment Pricing and Adoption Trends
- 12.6.9 Leading Suppliers and Competition
- 12.6.10 Regional Demand and Opportunities
- 12.7 Segment Growth Comparison
- 12.8 Segment Attractiveness and Priority Matrix
Chapter 13 Egypt AI in Healthcare Diagnostics Geographic Market Outlook, 2025-2035
- 13.1 Domestic Market Distribution and Demand Clusters
- 13.2 State- or Province-Wise Market Size and Forecast, 2025-2035
- 13.3 City and Metropolitan Market Outlook
- 13.4 Industrial, Manufacturing and Commercial Clusters
- 13.5 Geographic Concentration of Key End Users
- 13.6 Local Pricing and Purchasing Differences
- 13.7 Domestic Production Facilities and Capacity Map
- 13.8 Local Infrastructure and Project Pipeline
- 13.9 State-Level Policy and Incentive Differences
- 13.10 Subnational Investment Hotspots and Opportunities
- 13.11 Distribution and Logistics Networks
- 13.12 Domestic Competitive Footprint
Chapter 14 Egypt AI in Healthcare Diagnostics Technology, Innovation and Sustainability Outlook
- 14.1 Technology Landscape and Maturity
- 14.2 Product, Process and Service Innovation
- 14.3 AI, Automation and Digital Tools in the Industry
- 14.4 Technology Adoption and Performance Benchmarking
- 14.5 Innovation Pipeline and R&D Investment
- 14.6 Patent and Intellectual Property Trends
- 14.7 Energy Efficiency and Resource Management
- 14.8 Sustainability, Recycling and Circularity
- 14.9 Technology Roadmap, 2025-2035
- 14.10 Risks of Obsolescence and Technology Substitution
Chapter 15 Egypt AI in Healthcare Diagnostics Market Key Strategic Imperatives
- 15.1 Growth and Market Entry Priorities
- 15.2 High-Return Products and Segments
- 15.3 Pricing, Profitability and Cost Optimization
- 15.4 Technology Investment and Product Differentiation
- 15.5 Supply Chain Localization and Resilience
- 15.6 Distribution and Customer Acquisition
- 15.7 Partnership, Acquisition and Capacity Strategy
- 15.8 Regional Expansion Priorities
- 15.9 Short-, Medium- and Long-Term Actions
Chapter 16 Competition Outlook
- 16.1 Industry Competition Characteristics
- 16.2 Market Structure and Concentration
- 16.3 Market Share and Competitive Positioning, 2025
- 16.4 Company-Wise Revenue and Product Benchmarking
- 16.5 Production and Service Capacity Benchmarking
- 16.6 Technology, Pricing and Differentiation
- 16.7 Regional Footprint and Distribution Strength
- 16.8 Mergers, Acquisitions and Strategic Alliances
- 16.9 New Entrants and Competitive Threats
- 16.10 Porter's Five Forces and Industry Attractiveness
- 16.11 Competitive Outlook, 2025-2035
Chapter 17 Company Profiles
- 17.1 Company Coverage and Selection Criteria
- 17.2 Siemens Healthineers
- 17.2.1 Business Description
- 17.2.2 Company Ownership and Geographic Presence
- 17.2.3 Product and Service Portfolio
- 17.2.4 Manufacturing and Operating Footprint
- 17.2.5 Production Capacity and Expansion Plans
- 17.2.6 Financial Performance and Investment
- 17.2.7 Market Share and Competitive Position
- 17.2.8 Technology and Innovation Capabilities
- 17.2.9 Strategic Alliances or Partnerships
- 17.2.10 Recent Developments
- 17.2.11 Growth Strategy and Outlook
- 17.3 GE HealthCare
- 17.4 Philips
- 17.5 Roche Diagnostics
- 17.6 Rology
- 17.7 FUJIFILM Middle East and Africa (FUJIFILM Holdings)
- 17.8 Mindray
- 17.9 Canon Medical Systems
- 17.10 Lunit
- 17.11 Other Relevant Market Participants
Note: Every listed company is profiled on the structure shown under the first company. The company list is preliminary and may change based on research findings, market developments, data availability and client requirements.
Chapter 18 Disclaimer
- 18.1 Research and Forecast Disclaimer
- 18.2 Data Source and Estimation Limitations
Note: The depth of individual sections depends on data availability for this market. Volume, capacity, trade and other unit-based metrics are included where applicable.