Homegrown CAR-T turned gene therapy into a real market
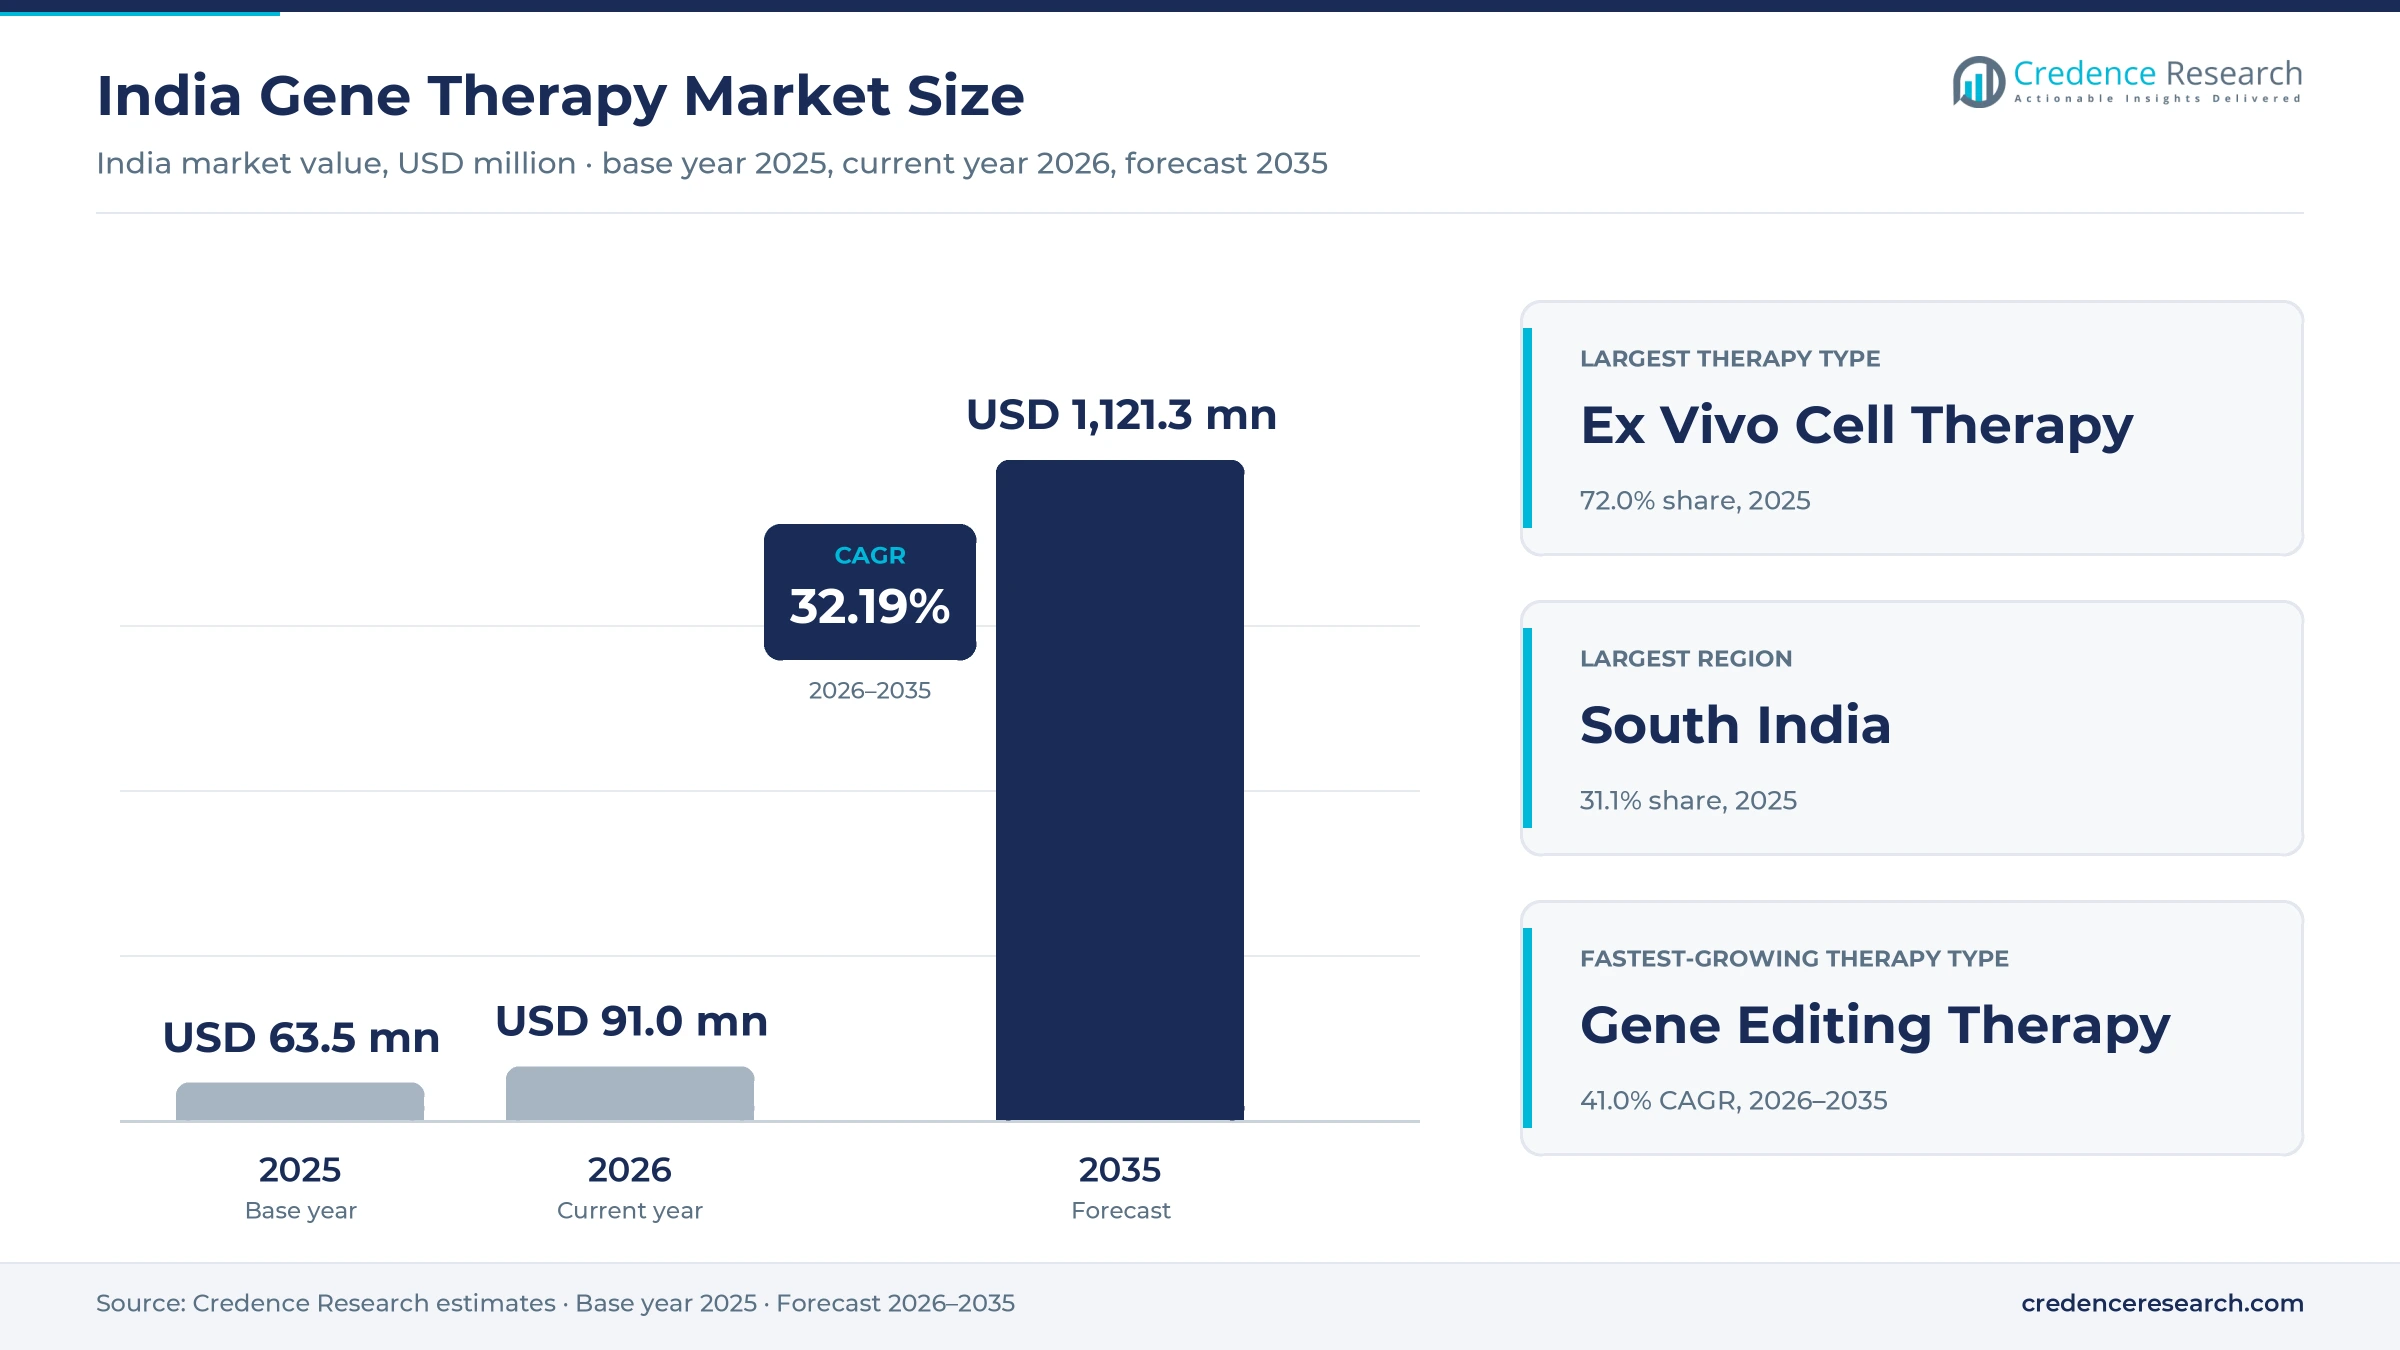
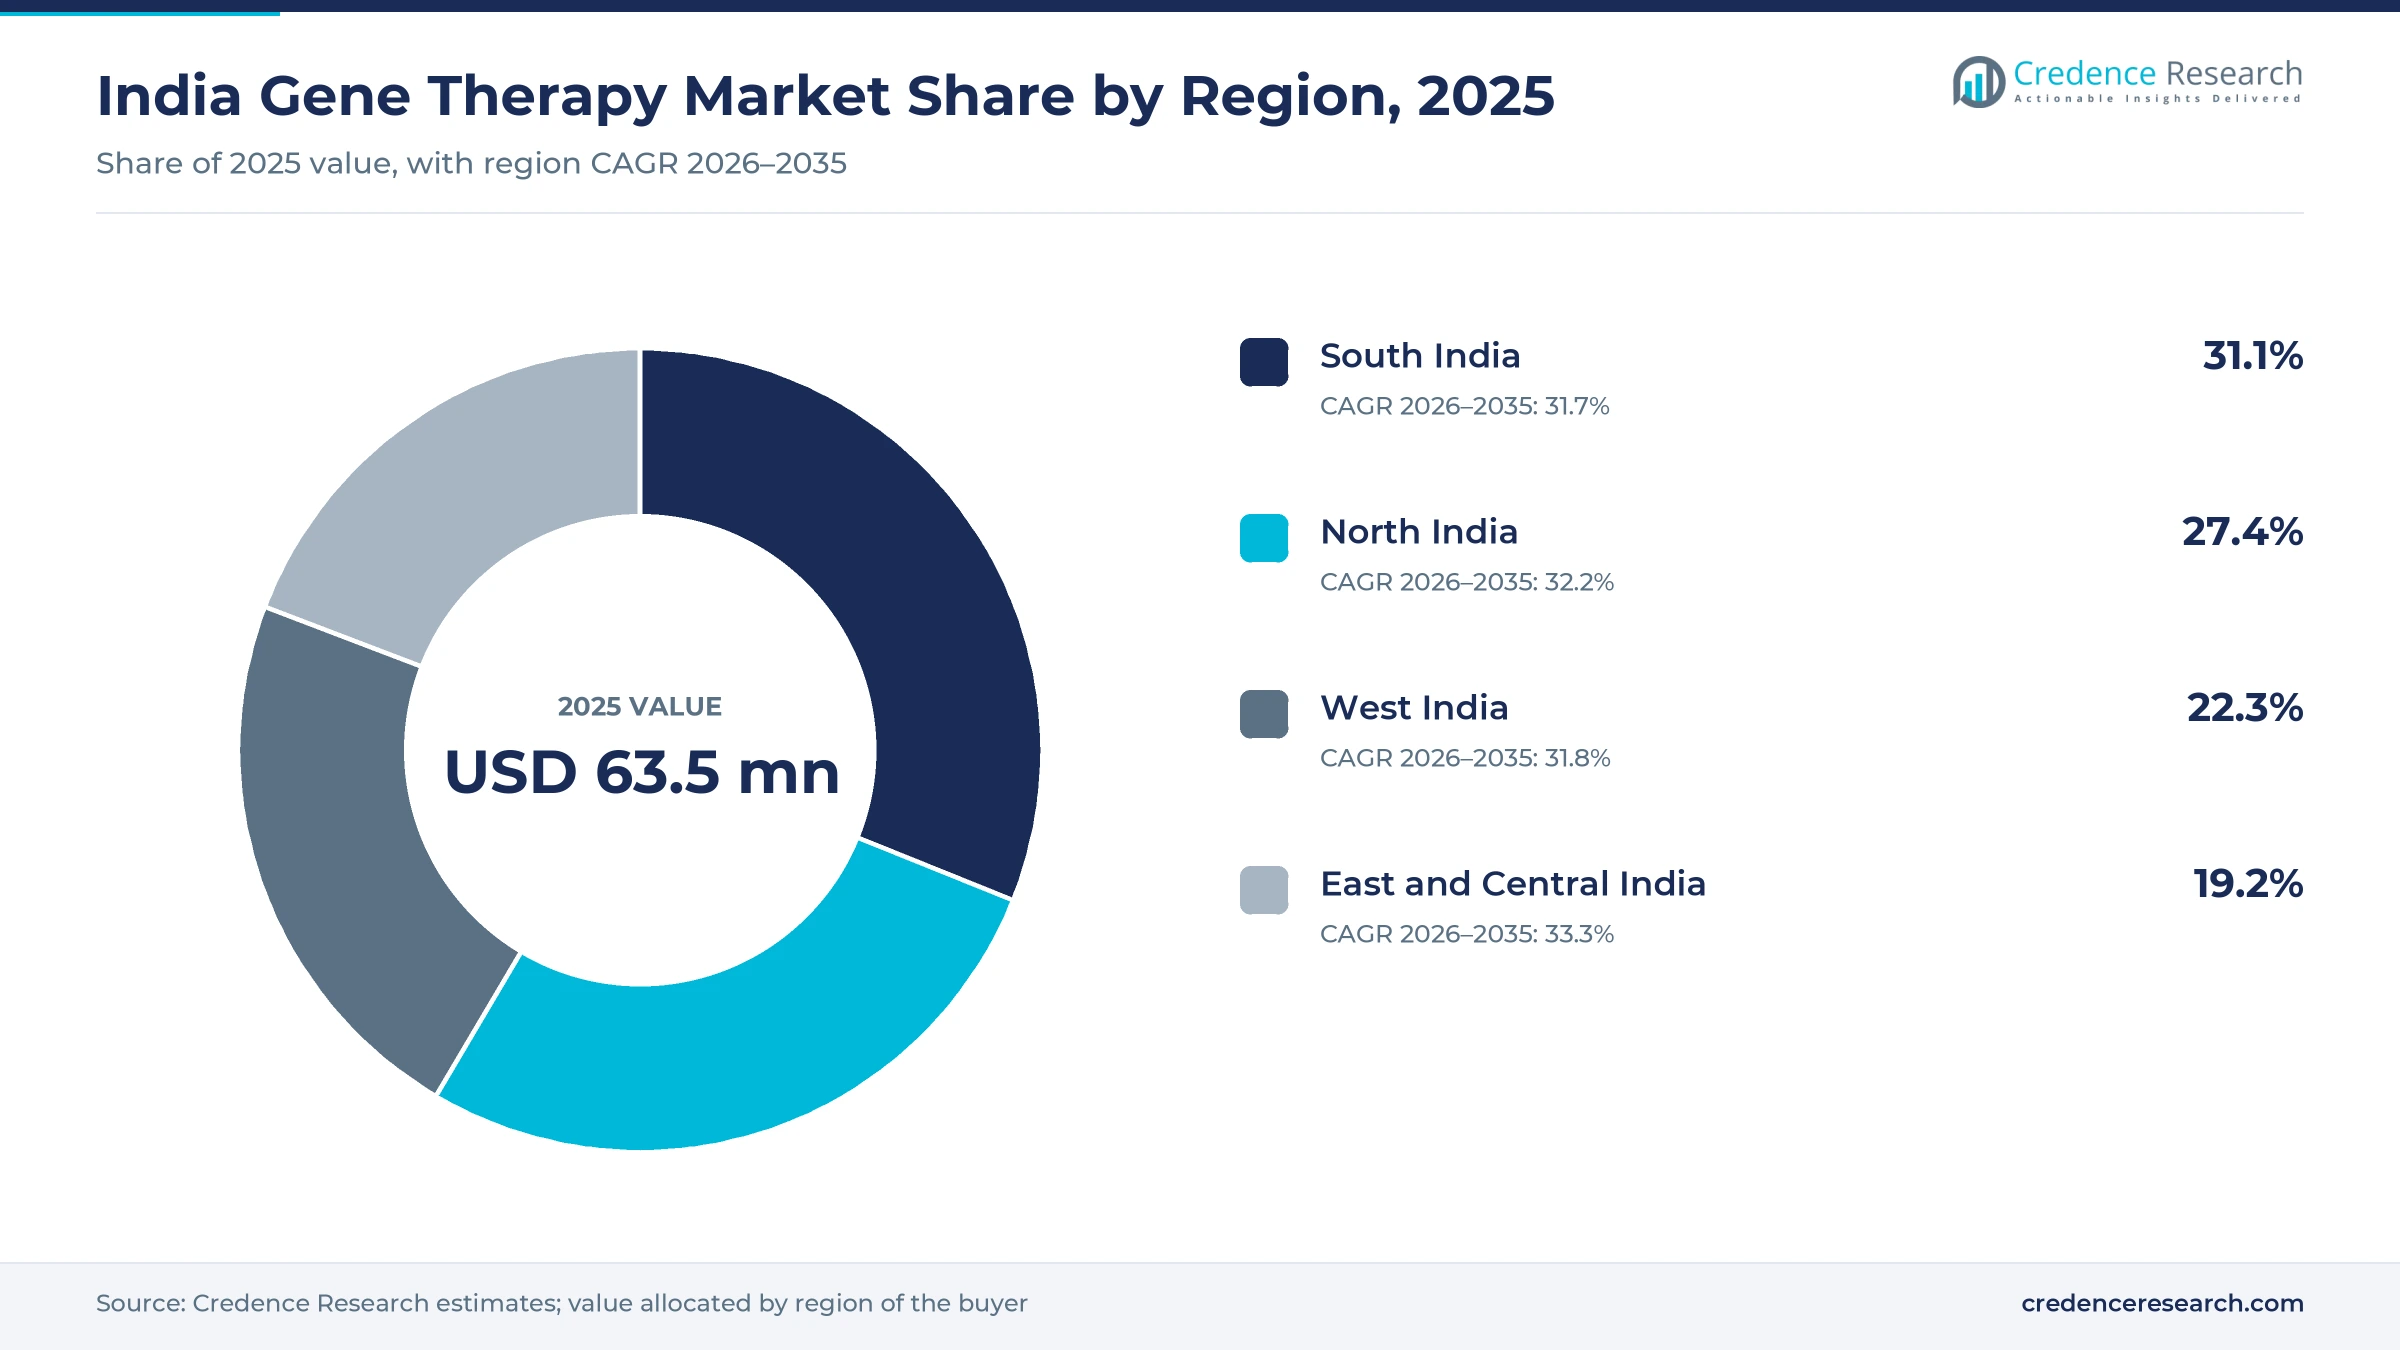
The India gene therapy market was valued at USD 63.5 million in 2025 and is projected to increase from USD 91.0 million in 2026 to USD 1.12 billion by 2035, registering a CAGR of 32.19% during 2026–2035. Demand comes from relapsed blood-cancer patients treated with domestically made CAR-T cells, families of children with spinal muscular atrophy, and patients enrolled in hemophilia, sickle cell and myeloma studies. South India held the largest regional share, 31.1% in 2025, because Bengaluru, Vellore and Hyderabad host most manufacturing sites and leading trial hospitals. East and Central India is the fastest-growing region at 33.3% a year, as sickle cell screening in Odisha, Madhya Pradesh and Chhattisgarh identifies patients for future one-time treatments. The main commercial change is price, since Indian CAR-T products sell for roughly one-tenth of Western list prices and have moved the therapy from charity-funded imports to regular hospital programs.
Engineered cells and one-time gene doses define the scope
The market counts the value of approved and trial-supplied products that alter a patient’s genes or cells to treat disease, including CAR-T cells modified outside the body, one-time gene replacement infusions, gene editing treatments and gene silencing medicines. Value is measured at the price paid by patients, hospitals, donors, government programs or trial sponsors for the product and its administration.
The estimate excludes conventional stem cell transplants, unmodified cell products, diagnostic genetic tests and the contract manufacturing fees that developers pay to service providers. Laboratory reagents and instruments sold to research groups are also excluded, although their makers shape cost and capacity across the supply chain.
India Gene Therapy Market Insights
- The market grows from USD 63.5 million in 2025 to USD 1.12 billion by 2035, a 32.19% pace driven by domestic CAR-T products and the first indigenous gene editing programs.
- South India led with 31.1% of 2025 value, while East and Central India grows fastest at 33.3% a year on the back of sickle cell screening.
- Ex Vivo Gene-Modified Cell Therapy led with 72.0% of 2025 value, because both commercial Indian products are CAR-T cells engineered outside the body.
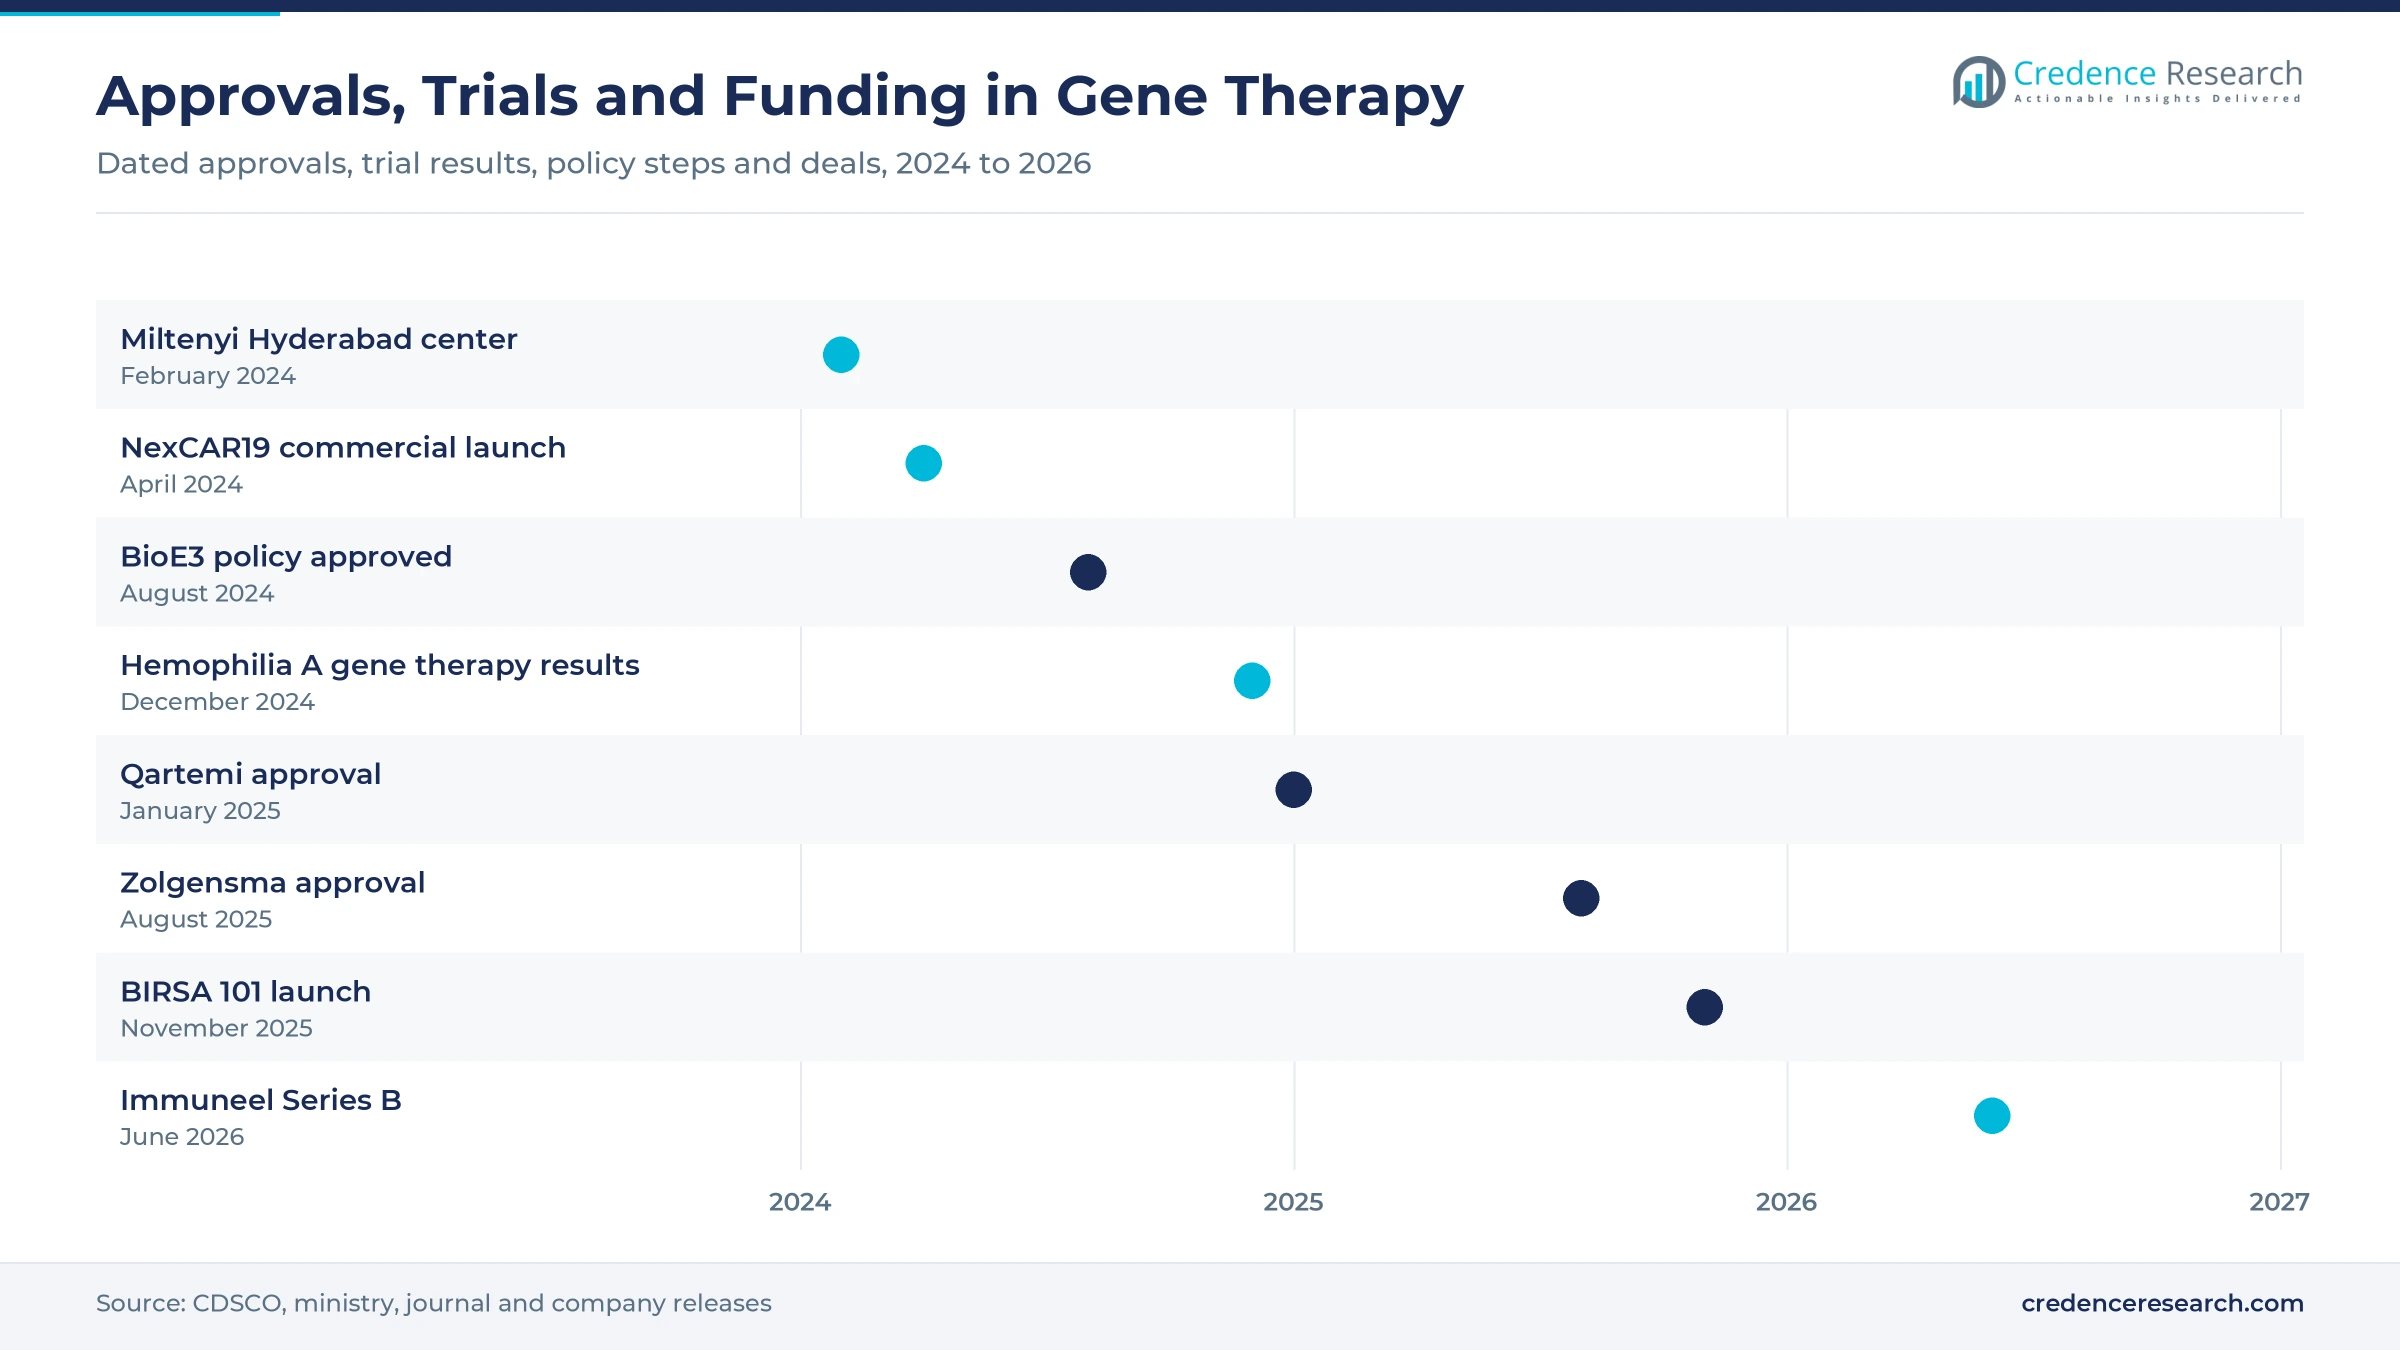
- CDSCO approved Novartis’s Zolgensma for spinal muscular atrophy in August 2025, opening a regular route for a one-time gene replacement treatment.
- No BCMA-targeted CAR-T was approved in India as of August 2026, leaving multiple myeloma as the largest open indication for domestic developers.
Engineered cell products lead as gene editing grows fastest
Why do engineered cell products dominate current spending?
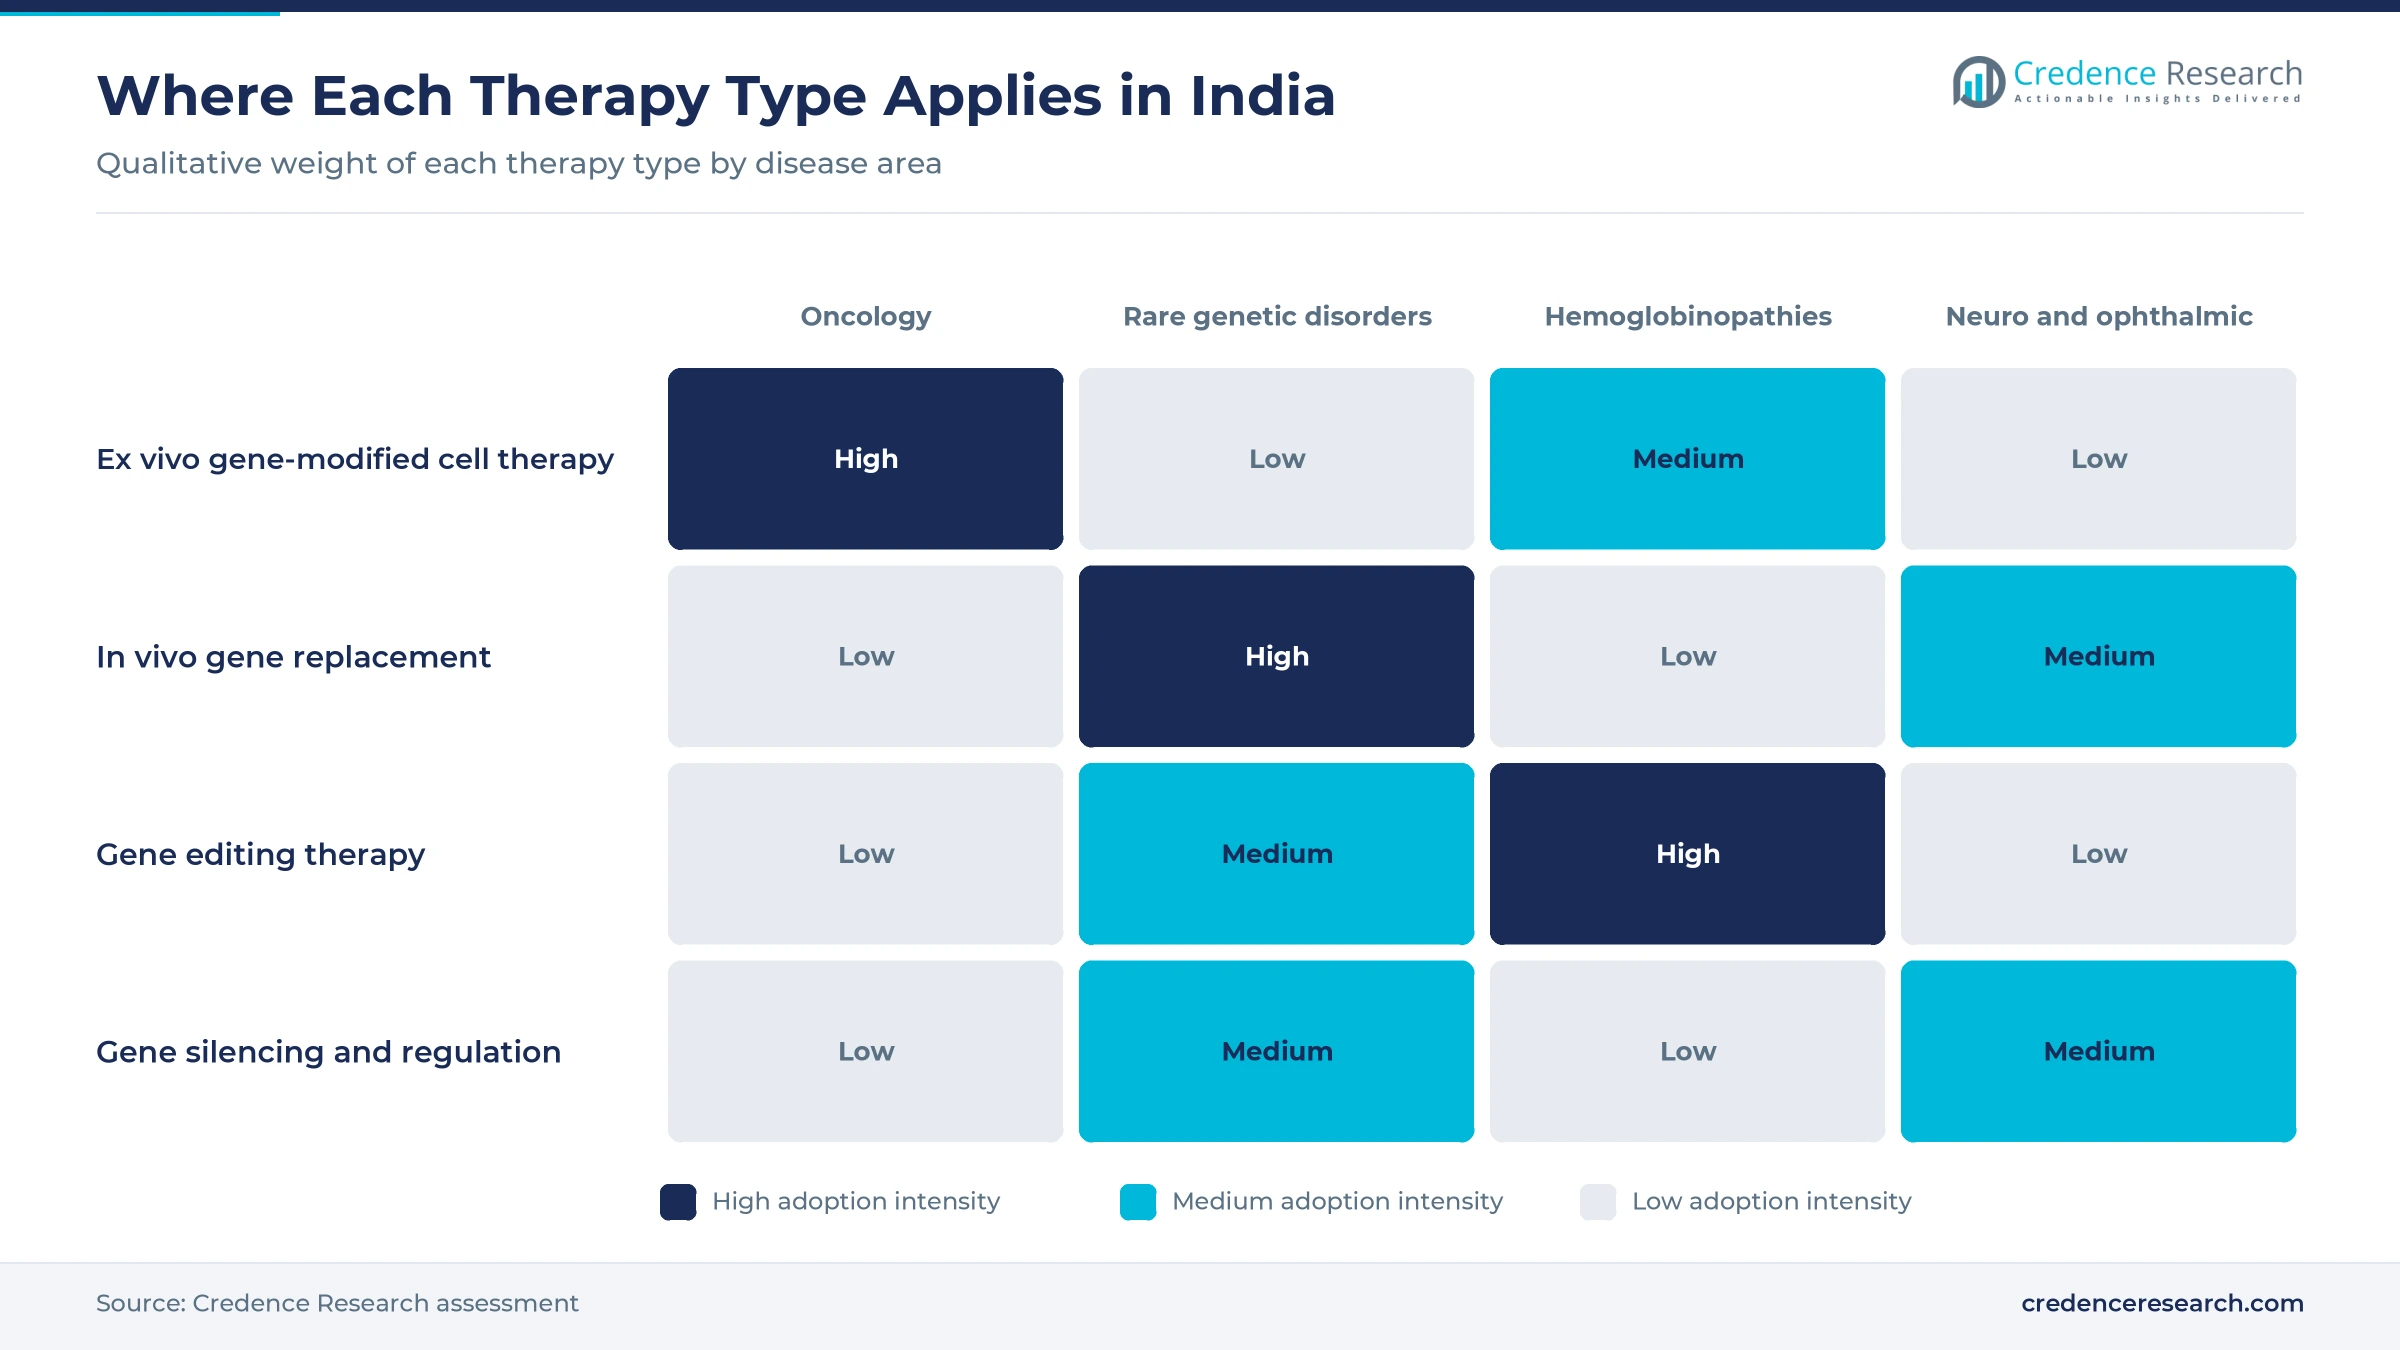
Based on therapy type, the market is categorized into ex vivo gene-modified cell therapy, in vivo gene replacement, gene editing therapy and gene silencing and regulation. Ex Vivo Gene-Modified Cell Therapy led with 72.0% of 2025 value because both commercial Indian products are CAR-T cells, with NexCAR19 approved in October 2023 and Qartemi cleared by CDSCO in January 2025, ThePrint reported. Gene Editing Therapy grows fastest at 41.0% a year from a tiny base, as BIRSA 101, the CRISPR treatment for sickle cell disease developed by CSIR-IGIB, was launched on Nov. 19, 2025. Editing programs that reach patients would add the first one-time treatments for inherited blood disorders.
Why does lentiviral delivery carry most of the value?
Based on vector technology, the market is categorized into lentiviral vectors, adeno-associated viral vectors, adenoviral and retroviral vectors, and non-viral delivery. Lentiviral Vectors led with 68.0% of 2025 value because Indian cell programs rely on lentiviral transduction, from Aurigene Oncology’s BCMA candidate made in Bangalore to the hemophilia A program at Christian Medical College Vellore. Adeno-Associated Viral Vectors grow fastest at 33.8% a year as CDSCO approved Zolgensma in August 2025 and Intas Pharmaceuticals runs six recombinant AAV programs, according to its website. Suppliers of adeno-associated viral vectors gain as in vivo products follow.
Why does oncology account for most treated patients?
Based on disease area, the market is categorized into oncology, rare genetic disorders, hemoglobinopathies and neurological and ophthalmic disorders. Oncology led with 70.0% of 2025 value because both approved CAR-T products treat B-cell cancers, and B-cell non-Hodgkin lymphoma makes up 80% to 85% of non-Hodgkin lymphoma cases in India, THIP Media reported. Hemoglobinopathies grow fastest at 39.0% a year as the patient pool is large and newly identified, since National Health Mission guidance cited by BioSpectrum puts children with thalassemia major at 1 lakh to 1.5 lakh. Developers of curative blood-disorder treatments face a far larger addressable base than in oncology.
Why do manufacturer-authorized hospitals handle most cases?
Based on access channel, the market is categorized into direct hospital procurement, manufacturer treatment networks, named-patient and managed access, and clinical-trial access. Manufacturer Treatment Networks led with 50.0% of 2025 value because CAR-T developers train and authorize each treating center, and ImmunoACT’s network grew from 70 hospitals by mid-2025 to more than 80. Clinical-Trial Access grows fastest at 33.6% a year as trial activity widens, with the DCGI clearing Phase 2 of Aurigene’s SWASTH myeloma study and the Technology Development Board backing a Helix Cell Therapeutics Phase 1 program in May 2026. Trial sites become the first prescribers once products are approved.
| Segment Group | Leading Sub-segment | Share, 2025 | Fastest-growing Sub-segment | CAGR, 2026–2035 |
|---|---|---|---|---|
| By Therapy Type | Ex Vivo Gene-Modified Cell Therapy | 72.0% | Gene Editing Therapy | 41.0% |
| By Vector Technology | Lentiviral Vectors | 68.0% | Adeno-Associated Viral Vectors | 33.8% |
| By Disease Area | Oncology | 70.0% | Hemoglobinopathies | 39.0% |
| By Access Channel | Manufacturer Treatment Networks | 50.0% | Clinical-Trial Access | 33.6% |
Indian CAR-T sells at a fraction of Western list prices
Pricing is set per treated patient, and the product fee is only part of the bill, because apheresis, conditioning, infusion and toxicity care add hospital costs. Domestic developers have priced CD19 CAR-T at roughly one-tenth of Western list prices, and ImmunoACT has cut its price by more than a quarter since launch. Hospital-made cells cost less again, as the VELCART study put the cost per patient at USD 47,831, excluding the lentiviral vector. One-time gene replacement sits at the other extreme, since Zolgensma’s U.S. price equals about Rs 17.7 crore. Volume, not margin per dose, now decides which CAR-T supplier earns more.
| Product or route | Typical price or fee | Basis |
|---|---|---|
| NexCAR19, CD19 CAR-T | About Rs 30 lakh per patient, down from about Rs 42 lakh at launch | BioSpectrum, October 2026 |
| Qartemi, CD19 CAR-T | Rs 35 lakh to Rs 50 lakh per patient | Immuneel, via ThePrint, January 2025 |
| Hospital-made CD19 CAR-T | USD 47,831 per patient, including USD 35,107 manufacturing, both excluding the lentiviral vector | VELCART trial, Molecular Therapy Oncology, 2025 |
| Imported CD19 CAR-T, U.S. list | USD 373,000 to USD 475,000 per patient | Cion Cancer Clinics price summary, August 2026 |
| Zolgensma, one-time infusion | About Rs 17.7 crore at the U.S. list price; Indian price not set at approval | ThePrint, August 2025 |
Request a Free Sample
Fill in your details and we'll send you a free sample report.
- Sample data tables & charts
- Research methodology
Indian CAR-T, screening and new capacity widen access
Domestic CAR-T commercialization brings prices within reach
Locally developed CAR-T products have turned an imported, donor-funded therapy into a routine hospital service. ImmunoACT launched NexCAR19 commercially in April 2024 and had treated more than 350 patients by mid-2025, BioSpectrum reported in October 2026. A second product followed, as Immuneel’s Qartemi posted an 83.3% overall response rate in its Phase 2 study and opened with more than 25 partner hospitals, including Narayana Health, Apollo Hospitals and Manipal Hospitals, according to ThePrint. Immuneel then raised more than Rs 100 crore in a Series B round announced on June 8, 2026, to add manufacturing capacity and commercialize Qartemi, BioSpectrum reported. Two competing domestic suppliers give hospitals pricing leverage and lift volumes in Ex Vivo Gene-Modified Cell Therapy.
Screening programs enlarge the genetically characterized patient pool
National screening is building a register of patients with diagnosed inherited disease, which creates the demand base for one-time treatments. The National Sickle Cell Anaemia Elimination Mission had completed 6.04 crore screenings and diagnosed 2,16,118 people by July 28, 2025, the health ministry told the Lok Sabha. Hemophilia adds a second pool, as India carries about 136,000 cases, the second-largest burden worldwide, Health Dialogues reported. Spinal muscular atrophy affects an estimated 4,000 babies born each year, according to the ThePrint report on Zolgensma. Each confirmed diagnosis becomes a candidate for gene replacement or editing, so developers can size trials and launches against named patient groups rather than estimates.
Biotechnology ecosystem scaling adds local capacity and tools
New manufacturing capacity and policy support are lowering the cost of building gene and cell products in India. The Union Cabinet approved the BioE3 policy in August 2024, and it lists precision biotherapeutics among its thematic sectors, according to BioSpectrum. Miltenyi Biotec opened its first Indian office and a cell and gene therapy center of excellence in Hyderabad in February 2024, Business Today reported, and later signed a letter of intent with BIRAC in June 2025. Tata Sons-funded MedTherapy runs a commercial-scale GMP plant in New Delhi built for viral vectors and CAR-T products, IndiaMedToday reported in May 2026. Local vectors and biopharmaceutical contract manufacturing shorten the path from trial to launch.
Regulatory approval and rare-disease funding open in vivo access
Regulatory approval and public funding have given rare-disease gene therapy a formal route in place of charity programs. CDSCO approved Novartis’s Zolgensma for spinal muscular atrophy in August 2025, ThePrint reported in August 2025, after Novartis closed the global access program that had treated many Indian children free of charge. Centers of excellence under the National Policy for Rare Diseases rose from eight to 15, with support of up to Rs 50 lakh per patient, PTI reported in February 2026. The government had already granted full basic customs duty exemption for rare-disease therapies imported for personal use in March 2023. These steps widen paid access for rare genetic disorders, the second-largest disease area by value.
Hospital-made CAR-T and CRISPR reshape the pipeline
Shift toward hospital-made CAR-T at the point of care
Manufacturing is moving closer to the patient, as academic hospitals show that CAR-T cells can be made safely on site. The ICMR-funded VELCART study at Christian Medical College Vellore treated 10 patients with cells produced in nine days, and eight remained free of disease progression at a median follow-up of 15 months, according to the VELCART trial report. Centralized supply takes about twice as long, since ImmunoACT states a turnaround of about 18 days from cell collection to release at its Navi Mumbai plant. Miltenyi Biotec has said it will pursue public-private partnerships for point-of-care CAR-T in Indian hospitals. Faster, fresh products lower the risk of progression while patients wait, so large cancer centers may build their own cell units.
Rise of indigenous gene editing for inherited blood disorders
Gene editing is emerging as India’s answer to imported curative treatments for blood disorders. BIRSA 101 uses the engineered enFnCas9 platform of CSIR-IGIB, and the institute signed a technology transfer and collaboration agreement with Serum Institute of India to scale it, BioSpectrum reported in November 2025. The program aims to replace overseas therapies priced at Rs 20 crore to Rs 25 crore. Its genetic base is growing, as the GenomeIndia project has sequenced 10,000 genomes held at the Indian Biological Data Centre. A low-cost edited product would compete directly with chronic sickle cell disease treatment such as lifelong transfusions.
Opening for BCMA-targeted CAR-T in multiple myeloma
Multiple myeloma is a clear opening, because no BCMA-targeted CAR-T had Indian approval as of August 2026 and Carvykti is not supplied in the country, Cion Cancer Clinics noted. Aurigene Oncology, a Dr. Reddy’s Laboratories subsidiary, reported that all eight early patients in its SWASTH study responded and five reached stringent complete response, Indian Pharma Post reported in October 2024. ImmunoACT has also named a BCMA CAR-T as its next product. Demand for BCMA treatment already exists, since the bispecific antibody teclistamab received CDSCO permission on Sept. 11, 2023. The first domestic approval would capture patients whose multiple myeloma treatment now relies on antibodies, other drugs and transplants.
Opening for licensing low-cost Indian CAR-T abroad
Low Indian prices create an export opening, since the same products undercut Western CAR-T in other price-sensitive markets. ImmunoACT licensed its CD19 CAR-T to Cipla for South Africa, Algeria and Morocco, IndiaMedToday reported in January 2026, and it has a clinical trial approved in Mexico. Immuneel is pursuing clinical co-development partnerships in Australia and Southeast Asia, and its June 2026 Series B round also funds entry into Asia Pacific and the Middle East. India also offers a 30% to 40% manufacturing cost advantage, a May 2026 BioSpectrum analysis said. MedTherapy also plans to lift its patient capacity from 5,000 a year to between 50,000 and 100,000, NewsBytes reported in May 2026. Export volumes would spread fixed plant costs and help domestic prices fall further.
Price, validation time and metro bias limit uptake
Can patients pay without insurance or public cover?
Affordability remains the main limit, since even the reduced CAR-T price of about Rs 30 lakh exceeds what most families can pay at once. ImmunoACT now offers zero-interest EMI plans and an outcome-linked offer of up to Rs 10 lakh to eligible patients, according to the BioSpectrum profile noted above. Rare-disease support of up to Rs 50 lakh per patient covers only a small part of the Zolgensma list price in the price table. Financing partners therefore matter as much as further price cuts for CAR-T suppliers.
How long does manufacturing validation take for new entrants?
New developers face long validation and qualification work before they can supply patients. Preparing for process validation takes about 18 to 24 months even for well-resourced organizations, a May 2026 BioSpectrum analysis said, and CDSCO only issued draft CAR-T guidelines in 2024. Domestic input supply is only beginning, as Cellogen Biotech has started making plasmids and lentiviruses in India. Slow validation favors the two approved suppliers and delays price competition from new entrants.
Will treatment stay concentrated in the largest cities?
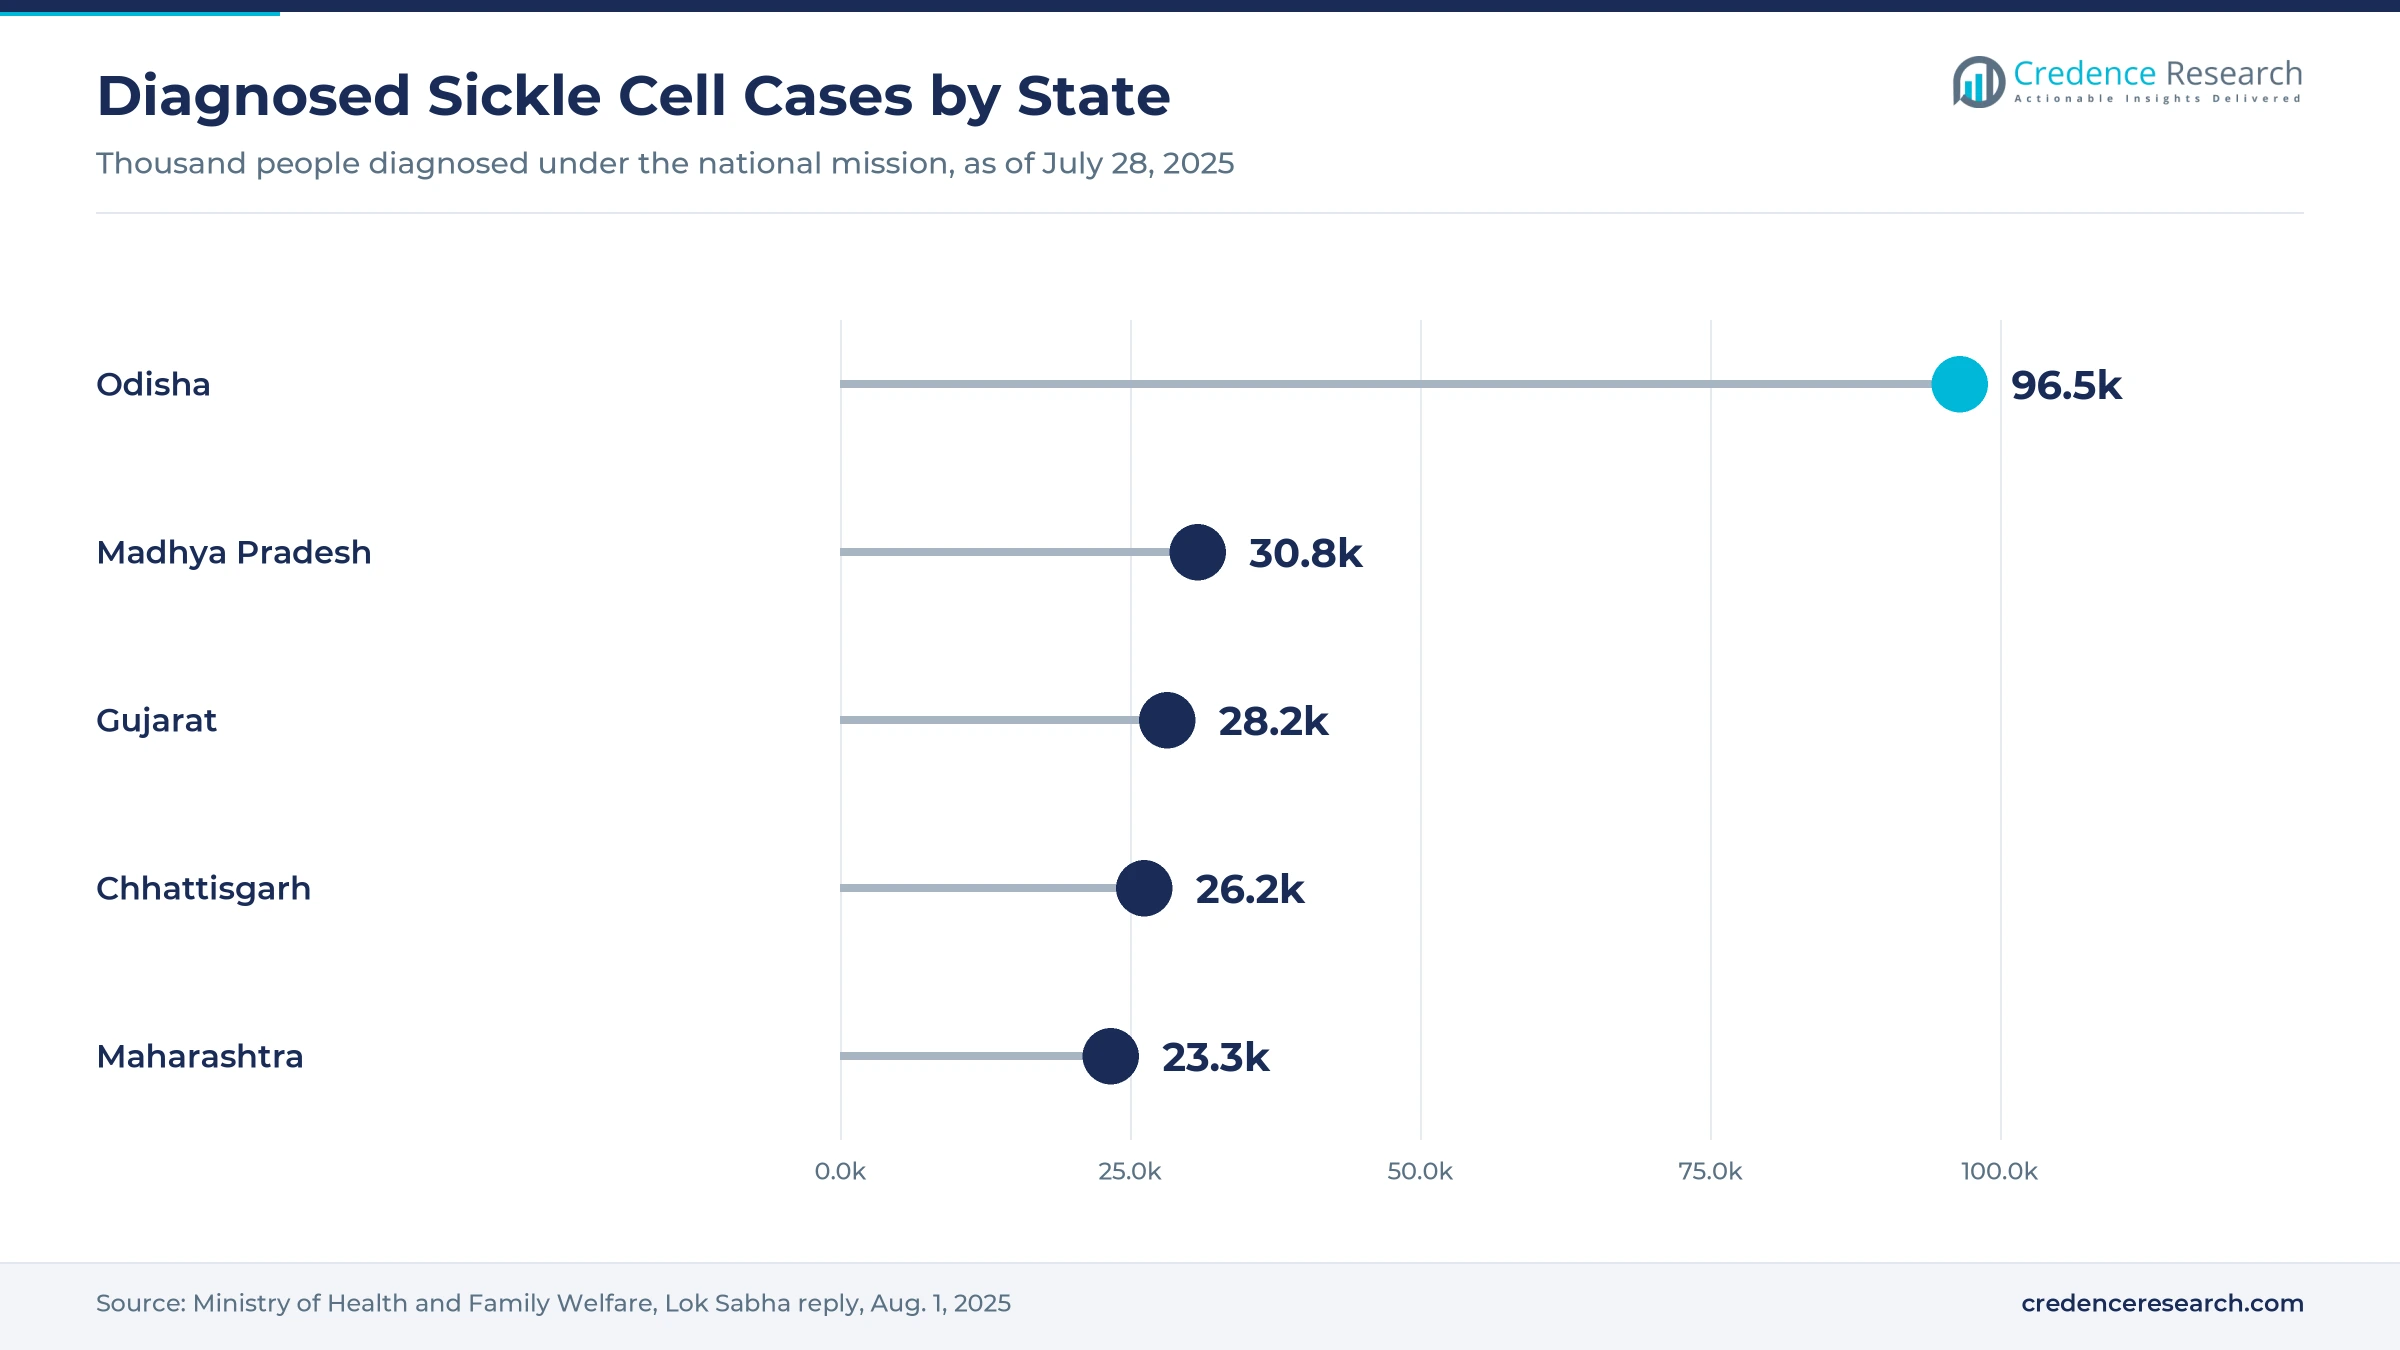
Treatment capacity is concentrated in metro hospitals, which limits access for patients in the regions with the largest inherited disease burden. CRISPR editing, cell processing and infusion infrastructure exists almost exclusively in metro cities, the Takshashila Institution noted in July 2026. Odisha alone recorded 96,484 diagnosed sickle cell cases by July 2025, yet the main manufacturing and trial sites sit in the south and west. Travel and relocation costs add to the bill, so regional treating centers will be needed for curative programs to scale.
Will central licensing slow small developers?
New regulation adds compliance work that weighs most on small developers. A July 2026 amendment to the Drugs Rules, 1945, brought gene therapeutic and stem cell-derived products under central licensing, with central and state authorities regulating them jointly, Business Today reported. The same framework already covered vaccines and large-volume parenterals, so gene therapy plants now face comparable inspection standards. Developers must budget for dual oversight, GMP documentation and patient follow-up. Firms with an approved plant therefore gain an edge over newcomers that are still validating their processes.
South India leads as East and Central India grows fastest
| Region | Value, 2025 (USD million) | Share, 2025 | CAGR, 2026–2035 |
|---|---|---|---|
| South India | 19.7 | 31.1% | 31.7% |
| North India | 17.4 | 27.4% | 32.2% |
| West India | 14.2 | 22.3% | 31.8% |
| East and Central India | 12.2 | 19.2% | 33.3% |
South India leads on manufacturing sites and trial hospitals
South India held a 31.1% share of 2025 value and grows at 31.7% a year. The zone hosts many of the main producers and trial centers for gene and cell products. Immuneel develops and makes Qartemi in Bengaluru, and Aurigene Oncology manufactures its BCMA candidate at a Bangalore GMP facility. Christian Medical College Vellore runs both the VELCART study and the hemophilia A gene therapy program, while Helix Cell Therapeutics and Miltenyi Biotec India are based in Hyderabad. Dense specialist capacity keeps South India the first stop for new products and referrals.
North India gains from public institutes and new capacity
North India held a 27.4% share of 2025 value and grows at 32.2% a year. PGIMER in Chandigarh served as a Qartemi trial site, and Amrita Hospital in Faridabad is among Immuneel’s partner hospitals, according to ThePrint. Delhi has become a supply base, as Cellogen Therapeutics develops bi-specific CAR-T cells there and MedTherapy runs its viral vector and CAR-T plant in New Delhi. Large public hospitals and new local capacity should keep the zone close to the leader.
West India relies on Mumbai cancer care and CAR-T production
West India held a 22.3% share of 2025 value and grows at 31.8% a year. NexCAR19 was developed by ImmunoACT with Tata Memorial Centre, and ImmunoACT manufactures it at its Navi Mumbai GMP facility. Gujarat and Maharashtra also recorded 28,178 and 23,258 diagnosed sickle cell cases by July 2025, according to the Lok Sabha reply noted above. Strong cancer referral flows into Mumbai support CAR-T volumes, while sickle cell numbers give the zone a future gene editing pool.
East and Central India grows fastest on sickle cell need
East and Central India held a 19.2% share of 2025 value and grows fastest at 33.3% a year. The zone holds the largest pool of diagnosed inherited blood disorders, which drives future demand for one-time treatments. Odisha, Madhya Pradesh and Chhattisgarh lead national sickle cell diagnoses, and the burden is highest among tribal communities in central and eastern India, BioSpectrum noted at the launch of the CRISPR program described above. Treating capacity remains thin, so growth depends on regional centers that can collect cells and give follow-up care.
Approvals and funding rounds mark 2025 and 2026
| Development | Status and market relevance |
|---|---|
| In January 2025, CDSCO approved Immuneel Therapeutics’ Qartemi for adults with relapsed or refractory B-cell non-Hodgkin lymphoma. | Approved; India’s second domestic CAR-T, launched commercially |
| In August 2025, CDSCO approved Novartis’s Zolgensma for spinal muscular atrophy. | Approved; Indian price not set at approval |
| In November 2025, the science ministry launched CSIR-IGIB’s BIRSA 101 CRISPR program for sickle cell disease. | Technology transfer to Serum Institute of India for scale-up |
| In January 2026, ImmunoACT licensed its CD19 CAR-T to Cipla for South Africa, Algeria and Morocco. | Signed; first export route for an Indian CAR-T |
| In June 2026, Immuneel Therapeutics raised more than Rs 100 crore in a Series B round. | Closed; funds capacity, Qartemi sales and entry into Asia Pacific |
Indian CAR designs and closed systems cut costs
- Domestically designed CD19 CAR constructs have kept side effects manageable, as NexCAR19 reported severe cytokine release syndrome in about 5% of trial patients.
- Closed automated cell processing such as the CliniMACS Prodigy platform runs cell selection, gene transfer and expansion inside one closed device for centralized or hospital production.
- Lentiviral transduction of blood stem cells allows a single treatment to add a working factor VIII gene, the approach used in the Vellore hemophilia A program.
- High-fidelity CRISPR editing built on the enFnCas9 enzyme lets Indian researchers correct blood-disorder mutations without licensing foreign editing platforms.
Need a Custom Version of This Report?
Tailor the scope, geography, or segments to your exact requirements.
- Custom geography or segment scope
- Direct access to our analyst team
Two domestic developers set prices for the field
Competition in the India gene therapy market is led by two domestic CAR-T developers whose pricing sets the benchmark for every new entrant. ImmunoACT, backed by Laurus Labs, and Immuneel Therapeutics compete on response rates, turnaround time, hospital coverage and financing offers for CD19 lymphoma and leukemia patients. Novartis competes on a different axis, since Zolgensma is a single dose priced far above any CAR-T course. Dr. Reddy’s Laboratories, through Aurigene Oncology, is the most advanced challenger in myeloma, while Cellogen Therapeutics prepares dual-target CAR-T trials and supplies plasmids and lentiviruses. Intas Pharmaceuticals, with six AAV-based programs, and Serum Institute of India, which took on CSIR-IGIB’s CRISPR platform for scale-up, are the pipeline entrants for one-time treatments. Hospitals choose suppliers on outcomes data, turnaround time and referral support, and the next round of competition will be decided by who wins the first BCMA approval.
Who controls supply, and where are the barriers highest?
Supply is concentrated in two domestic CAR-T developers and one multinational with an approved in vivo product, surrounded by a group of trial-stage developers and tool suppliers. ImmunoACT, in which Laurus Labs holds about 34%, and Immuneel each run their own plants and authorized hospital networks, so they keep the manufacturing margin. Novartis supplies the only approved one-time gene replacement product for spinal muscular atrophy in India. Entry barriers are GMP validation, trained apheresis and infusion centers, and long follow-up duties, which favor developers backed by large drugmakers such as Dr. Reddy’s Laboratories.
Which suppliers do Indian hospitals and patients shortlist?
| Company | Type | Role in the market |
|---|---|---|
| ImmunoACT (Laurus Labs) | Domestic CAR-T developer | Makes NexCAR19 CD19 CAR-T in Navi Mumbai for more than 80 hospitals |
| Immuneel Therapeutics | Domestic CAR-T developer | Makes and sells Qartemi CD19 CAR-T from Bengaluru through partner hospitals |
| Novartis | Multinational gene therapy supplier | Supplies Zolgensma one-time gene replacement for spinal muscular atrophy, approved August 2025 |
| Dr. Reddy's Laboratories (Aurigene Oncology) | Trial-stage developer | Supplies BCMA CAR-T ribrecabtagene autoleucel to myeloma patients through the SWASTH trial |
| Intas Pharmaceuticals | Pipeline gene therapy developer | Runs six AAV-based gene therapy programs at its Centre of Cell and Gene Therapy |
| Cellogen Therapeutics | Developer and vector maker | Develops dual-target CAR-T and makes plasmids and lentiviruses in India |
| Serum Institute of India | Gene editing scale-up partner | Holds CSIR-IGIB technology transfer to scale enFnCas9 CRISPR sickle cell therapy |
Price discipline will decide how far access spreads
Credence Research’s view is that India will remain the lowest-cost large market for gene and cell products through 2035, because domestic developers run their own plants and hospital networks. Gene Editing Therapy grows fastest, at 41.0% a year, since an approved sickle cell editing product would open the largest untreated patient pool. The main risk is financing rather than science, as current payment support comes mostly from EMI plans, outcome-linked offers and rare-disease grants. Suppliers that pair price cuts with payment plans and regional treating centers will gain share, while trial-stage firms without large partners face long, costly validation before first sales.
Treated patient counts anchor the estimate
The India gene therapy estimate uses 2025 as the base year and forecasts values to 2035. Market values come from the Credence Research model, and therapy type, vector, disease area, access channel and regional splits are Credence Research estimates. The size was cross-checked against treated patient counts for domestic CAR-T, product and hospital cost data, approvals of one-time gene replacement products and active trial programs. Evidence comes from Lok Sabha replies, peer-reviewed trial reports, CDSCO and ministry announcements, company statements and national press. No interviews or surveys were conducted for this estimate or its splits.
Myeloma approvals and blood-disorder cures carry growth
India gene therapy value should reach USD 1.12 billion by 2035, as domestic CAR-T reaches more hospitals and the first myeloma and blood-disorder products win approval. East and Central India should grow fastest because sickle cell screening has identified a large patient pool where treating capacity is still thin. Hospital-made cells and local vector supply should keep prices falling, which widens the paying patient base. Demand from about 4,000 babies born with spinal muscular atrophy each year will keep in vivo gene replacement growing. The main risks are slow approvals and self-funded treatment, although public or insurer cover for CAR-T could lift growth above the base case.
What decides whether growth lands low, mid or high?
The range of outcomes depends on new approvals and financing more than on patient need, which is large in every case. A downside path follows if BCMA and blood-disorder programs slip past 2030 and patients keep paying from savings. The base case assumes one or two myeloma approvals before 2030 and steady expansion of authorized hospitals. An upside path needs insurer or public cover for CAR-T and an approved Indian gene editing treatment for sickle cell disease.
| Scenario | CAGR, 2026–2035 | Value, 2035 | What has to hold |
|---|---|---|---|
| Downside | 28.2% | USD 850.6 million | Myeloma and blood-disorder approvals slip past 2030 and treatment stays self-funded |
| Base | 32.19% | USD 1.12 billion | One or two BCMA approvals arrive before 2030 and hospital networks keep expanding |
| Upside | 34.7% | USD 1.33 billion | Insurers or public schemes cover CAR-T and an Indian sickle cell editing product is approved |
Frequently Asked Questions
How big is the India gene therapy market?
Which region leads the market?
Which region grows fastest?
Which therapy type holds the largest share?
How much does CAR-T cost in India?
Is Zolgensma approved in India?
What is BIRSA 101?
Which companies lead the market?
Table of Content
Chapter 1 Market Segmentation
- 1.1 Segmentation Framework
- 1.1.1 Product and Service Classification
- 1.1.2 Application and End-Use Classification
- 1.1.3 Technology and Solution Classification
- 1.1.4 Customer and Distribution Channel Classification
- 1.1.5 Geographic Segmentation
- 1.1.6 Market Segment Definitions and Boundaries
- 1.2 By Therapy Type
- 1.2.1 Ex Vivo Gene-Modified Cell Therapy
- 1.2.2 In Vivo Gene Replacement
- 1.2.3 Gene Editing Therapy
- 1.2.4 Gene Silencing and Regulation
- 1.3 By Vector Technology
- 1.3.1 Lentiviral Vectors
- 1.3.2 Adeno-Associated Viral Vectors
- 1.3.3 Adenoviral and Retroviral Vectors
- 1.3.4 Non-Viral Delivery
- 1.4 By Disease Area
- 1.4.1 Oncology
- 1.4.2 Rare Genetic Disorders
- 1.4.3 Hemoglobinopathies
- 1.4.4 Neurological and Ophthalmic Disorders
- 1.5 By Access Channel
- 1.5.1 Manufacturer Treatment Networks
- 1.5.2 Direct Hospital Procurement
- 1.5.3 Named-Patient and Managed Access
- 1.5.4 Clinical-Trial Access
Chapter 2 Introduction
- 2.1 Report Objectives and Scope
- 2.2 Product Definition and Industry Terminology
- 2.3 Market Inclusions and Exclusions
- 2.4 Research Process
- 2.4.1 Primary Research and Expert Interviews
- 2.4.2 Secondary Research and Source Review
- 2.4.3 Top-Down and Bottom-Up Estimation
- 2.4.4 Data Triangulation and Verification
- 2.5 Market Size Measurement Basis
- 2.5.1 2025: USD 63.5 million → 2035: USD 1.12 billion
- 2.6 Historical and Forecast Reference Periods
- 2.6.1 Historical Period: 2018-2025
- 2.6.2 Base Year: 2025
- 2.6.3 Forecast Period: 2025-2035
- 2.7 Research Assumptions and Limitations
Chapter 3 Executive Summary
- 3.1 Market Snapshot and Key Findings
- 3.2 Base-Year Market Size, 2025
- 3.3 Forecast Market Size, 2035
- 3.4 Revenue and Volume Growth Outlook
- 3.5 Key Demand and Supply Indicators
- 3.6 Leading Market Segments
- 3.7 Fastest-Growing Market Opportunities
- 3.8 Regional Performance Highlights
- 3.9 Technology and Industry Transformation
- 3.10 Competitive Landscape Summary
- 3.11 Analyst View and Strategic Implications
Chapter 4 India Gene Therapy Market Trends and Developments
- 4.1 Historical Industry Development, 2018-2025
- 4.2 Recent Market Trends and Developments
- 4.3 Demand and Customer Behavior Trends
- 4.4 Technology and Product Innovation
- 4.5 Artificial Intelligence, Automation and Digitalization
- 4.6 Local Manufacturing and Supply Chain Realignment
- 4.7 Industry Partnerships, Mergers and Acquisitions
- 4.8 Sustainability and Circular Economy Developments
- 4.9 Government and Private Sector Investment Trends
- 4.10 Emerging Business Models and Commercialization
- 4.11 Industry Developments and Announcements
Chapter 5 India Gene Therapy Market Production, Supply and Demand Analysis
- 5.1 Demand Trend and Consumption Analysis, 2018-2025
- 5.2 Demand Forecast, 2025-2035
- 5.3 Production and Output Trend, 2018-2025
- 5.4 Production and Output Forecast, 2025-2035
- 5.5 Installed Capacity and Capacity Utilization
- 5.6 Company-Wise Production Plants and Statistics
- 5.6.1 Installed Production Capacity
- 5.6.2 Actual Production
- 5.6.3 Planned Capacity and Expansion Targets
- 5.7 Supply Chain Structure and Procurement Trends
- 5.8 Supply-Demand Gap and Bottlenecks
- 5.9 Import Dependence and Sourcing Structure
- 5.10 Contract Manufacturing and Outsourcing
- 5.11 Regional Supply and Demand Concentration
Chapter 6 India Gene Therapy Market Pricing Analysis
- 6.1 Pricing Structure and Measurement
- 6.2 Historical Pricing Trends, 2018-2025
- 6.3 Pricing Outlook, 2025-2035
- 6.4 Average Selling Price and Unit Economics
- 6.5 Pricing by Product and Market Segment
- 6.6 Geographic Pricing Differences
- 6.7 Key Input, Energy, Labor and Logistics Costs
- 6.8 Contract Pricing and Purchasing Models
- 6.9 Pricing Sensitivity and Competitive Positioning
- 6.10 Price, Margin and Profitability Implications
Chapter 7 India Gene Therapy Market Dynamics
- 7.1 Market Growth Drivers
- 7.1.1 Demand-Side Drivers
- 7.1.2 Technology and Innovation Drivers
- 7.1.3 Infrastructure and Investment Drivers
- 7.1.4 Regulatory and Policy Drivers
- 7.2 Market Restraints
- 7.2.1 Cost and Affordability Constraints
- 7.2.2 Technology and Adoption Barriers
- 7.2.3 Supply Chain and Operational Constraints
- 7.3 Market Challenges
- 7.3.1 Competitive Pressure and Margin Erosion
- 7.3.2 Skills, Infrastructure and Implementation Gaps
- 7.4 Emerging Market Opportunities
- 7.5 Market Dynamics Impact and Time-Horizon Assessment
Chapter 8 India Gene Therapy Value Chain Analysis
- 8.1 Industry Value Chain Overview
- 8.2 Upstream Suppliers and Critical Inputs
- 8.3 Technology and Component Providers
- 8.4 Manufacturing or Service Delivery
- 8.5 Distribution, Channel Partners and Integrators
- 8.6 Downstream Applications and End Users
- 8.7 Value Addition and Profit Pools
- 8.8 Vertical Integration and Outsourcing
- 8.9 Supplier Concentration and Risk
- 8.10 Supply Chain Localization and Resilience
Chapter 9 India Gene Therapy Market Regulations and Policies
- 9.1 Relevant Laws, Standards and Compliance Frameworks
- 9.2 Product, Service, Safety and Quality Requirements
- 9.3 Government Policies, Incentives and Subsidies
- 9.4 Imports, Exports and Trade Barriers
- 9.5 Public Procurement and Local Content Requirements
- 9.6 Environmental and Sustainability Compliance
- 9.7 Upcoming Policy Changes and Market Implications
Chapter 10 India Gene Therapy Market Hotspots and Opportunities
- 10.1 Market Opportunity Mapping and Growth Hotspots
- 10.2 High-Growth Applications and Customer Groups
- 10.3 Underserved Markets and White-Space Opportunities
- 10.4 Emerging Technology and Product Opportunities
- 10.5 New Capacity and Investment Hotspots
- 10.6 Market Entry and Expansion Opportunities
- 10.7 Distribution and Partnership Opportunities
- 10.8 Near-Term and Long-Term Commercial Potential
- 10.9 Opportunity Attractiveness and Execution Risks
Chapter 11 India Gene Therapy Market Outlook, 2025-2035
- 11.1 Market Size and Analysis
- 11.1.1 Revenue (Market Measurement: 2025: USD 63.5 million → 2035: USD 1.12 billion)
- 11.1.2 Market Volume and Quantity Sold
- 11.1.3 Historical Market Size, 2018-2025
- 11.1.4 Base-Year Market Size, 2025
- 11.2 Market Forecast, 2025-2035
- 11.2.1 Revenue Forecast to 2035
- 11.2.2 Volume Forecast to 2035
- 11.2.3 CAGR and Year-on-Year Growth
- 11.2.4 Incremental Revenue Opportunity
- 11.3 Forecast Assumptions and Scenario Analysis
- 11.3.1 Base-Case Forecast
- 11.3.2 Optimistic and Conservative Scenarios
- 11.3.3 Technology, Pricing and Policy Sensitivities
- 11.4 Market Attractiveness and Growth Outlook
Chapter 12 India Gene Therapy Market Segmentation and Outlook
- 12.1 Segmentation Summary and Market Shares, 2025
- 12.2 Largest and Fastest-Growing Segments
- 12.3 By Therapy Type - Market Size and Forecast, 2025-2035
- 12.3.1 Segment Definition and Scope
- 12.3.2 Historical Market Size, 2018-2025
- 12.3.3 Revenue Forecast, 2025-2035
- 12.3.4 Volume Forecast, 2025-2035
- 12.3.5 Base-Year Market Share, 2025
- 12.3.6 Segment CAGR and Growth Drivers
- 12.3.7 Subsegment Market Size and Forecast
- 12.3.7.1 Ex Vivo Gene-Modified Cell Therapy
- 12.3.7.2 In Vivo Gene Replacement
- 12.3.7.3 Gene Editing Therapy
- 12.3.7.4 Gene Silencing and Regulation
- 12.3.8 Subsegment Pricing and Adoption Trends
- 12.3.9 Leading Suppliers and Competition
- 12.3.10 Regional Demand and Opportunities
- 12.4 By Vector Technology - Market Size and Forecast, 2025-2035
- 12.4.1 Segment Definition and Scope
- 12.4.2 Historical Market Size, 2018-2025
- 12.4.3 Revenue Forecast, 2025-2035
- 12.4.4 Volume Forecast, 2025-2035
- 12.4.5 Base-Year Market Share, 2025
- 12.4.6 Segment CAGR and Growth Drivers
- 12.4.7 Subsegment Market Size and Forecast
- 12.4.7.1 Lentiviral Vectors
- 12.4.7.2 Adeno-Associated Viral Vectors
- 12.4.7.3 Adenoviral and Retroviral Vectors
- 12.4.7.4 Non-Viral Delivery
- 12.4.8 Subsegment Pricing and Adoption Trends
- 12.4.9 Leading Suppliers and Competition
- 12.4.10 Regional Demand and Opportunities
- 12.5 By Disease Area - Market Size and Forecast, 2025-2035
- 12.5.1 Segment Definition and Scope
- 12.5.2 Historical Market Size, 2018-2025
- 12.5.3 Revenue Forecast, 2025-2035
- 12.5.4 Volume Forecast, 2025-2035
- 12.5.5 Base-Year Market Share, 2025
- 12.5.6 Segment CAGR and Growth Drivers
- 12.5.7 Subsegment Market Size and Forecast
- 12.5.7.1 Oncology
- 12.5.7.2 Rare Genetic Disorders
- 12.5.7.3 Hemoglobinopathies
- 12.5.7.4 Neurological and Ophthalmic Disorders
- 12.5.8 Subsegment Pricing and Adoption Trends
- 12.5.9 Leading Suppliers and Competition
- 12.5.10 Regional Demand and Opportunities
- 12.6 By Access Channel - Market Size and Forecast, 2025-2035
- 12.6.1 Segment Definition and Scope
- 12.6.2 Historical Market Size, 2018-2025
- 12.6.3 Revenue Forecast, 2025-2035
- 12.6.4 Volume Forecast, 2025-2035
- 12.6.5 Base-Year Market Share, 2025
- 12.6.6 Segment CAGR and Growth Drivers
- 12.6.7 Subsegment Market Size and Forecast
- 12.6.7.1 Manufacturer Treatment Networks
- 12.6.7.2 Direct Hospital Procurement
- 12.6.7.3 Named-Patient and Managed Access
- 12.6.7.4 Clinical-Trial Access
- 12.6.8 Subsegment Pricing and Adoption Trends
- 12.6.9 Leading Suppliers and Competition
- 12.6.10 Regional Demand and Opportunities
- 12.7 Segment Growth Comparison
- 12.8 Segment Attractiveness and Priority Matrix
Chapter 13 India Gene Therapy Geographic Market Outlook, 2025-2035
- 13.1 Domestic Market Distribution and Demand Clusters
- 13.2 State- or Province-Wise Market Size and Forecast, 2025-2035
- 13.3 City and Metropolitan Market Outlook
- 13.4 Industrial, Manufacturing and Commercial Clusters
- 13.5 Geographic Concentration of Key End Users
- 13.6 Local Pricing and Purchasing Differences
- 13.7 Domestic Production Facilities and Capacity Map
- 13.8 Local Infrastructure and Project Pipeline
- 13.9 State-Level Policy and Incentive Differences
- 13.10 Subnational Investment Hotspots and Opportunities
- 13.11 Distribution and Logistics Networks
- 13.12 Domestic Competitive Footprint
Chapter 14 India Gene Therapy Technology, Innovation and Sustainability Outlook
- 14.1 Technology Landscape and Maturity
- 14.2 Product, Process and Service Innovation
- 14.3 AI, Automation and Digital Tools in the Industry
- 14.4 Technology Adoption and Performance Benchmarking
- 14.5 Innovation Pipeline and R&D Investment
- 14.6 Patent and Intellectual Property Trends
- 14.7 Energy Efficiency and Resource Management
- 14.8 Sustainability, Recycling and Circularity
- 14.9 Technology Roadmap, 2025-2035
- 14.10 Risks of Obsolescence and Technology Substitution
Chapter 15 India Gene Therapy Market Key Strategic Imperatives
- 15.1 Growth and Market Entry Priorities
- 15.2 High-Return Products and Segments
- 15.3 Pricing, Profitability and Cost Optimization
- 15.4 Technology Investment and Product Differentiation
- 15.5 Supply Chain Localization and Resilience
- 15.6 Distribution and Customer Acquisition
- 15.7 Partnership, Acquisition and Capacity Strategy
- 15.8 Regional Expansion Priorities
- 15.9 Short-, Medium- and Long-Term Actions
Chapter 16 Competition Outlook
- 16.1 Industry Competition Characteristics
- 16.2 Market Structure and Concentration
- 16.3 Market Share and Competitive Positioning, 2025
- 16.4 Company-Wise Revenue and Product Benchmarking
- 16.5 Production and Service Capacity Benchmarking
- 16.6 Technology, Pricing and Differentiation
- 16.7 Regional Footprint and Distribution Strength
- 16.8 Mergers, Acquisitions and Strategic Alliances
- 16.9 New Entrants and Competitive Threats
- 16.10 Porter's Five Forces and Industry Attractiveness
- 16.11 Competitive Outlook, 2025-2035
Chapter 17 Company Profiles
- 17.1 Company Coverage and Selection Criteria
- 17.2 ImmunoACT (Laurus Labs)
- 17.2.1 Business Description
- 17.2.2 Company Ownership and Geographic Presence
- 17.2.3 Product and Service Portfolio
- 17.2.4 Manufacturing and Operating Footprint
- 17.2.5 Production Capacity and Expansion Plans
- 17.2.6 Financial Performance and Investment
- 17.2.7 Market Share and Competitive Position
- 17.2.8 Technology and Innovation Capabilities
- 17.2.9 Strategic Alliances or Partnerships
- 17.2.10 Recent Developments
- 17.2.11 Growth Strategy and Outlook
- 17.3 Immuneel Therapeutics
- 17.4 Novartis
- 17.5 Dr. Reddy's Laboratories (Aurigene Oncology)
- 17.6 Intas Pharmaceuticals
- 17.7 Cellogen Therapeutics
- 17.8 Serum Institute of India
- 17.9 Other Relevant Market Participants
Note: Every listed company is profiled on the structure shown under the first company. The company list is preliminary and may change based on research findings, market developments, data availability and client requirements.
Chapter 18 Disclaimer
- 18.1 Research and Forecast Disclaimer
- 18.2 Data Source and Estimation Limitations
Note: The depth of individual sections depends on data availability for this market. Volume, capacity, trade and other unit-based metrics are included where applicable.