Local plants now supply most of the medicines Egyptians use
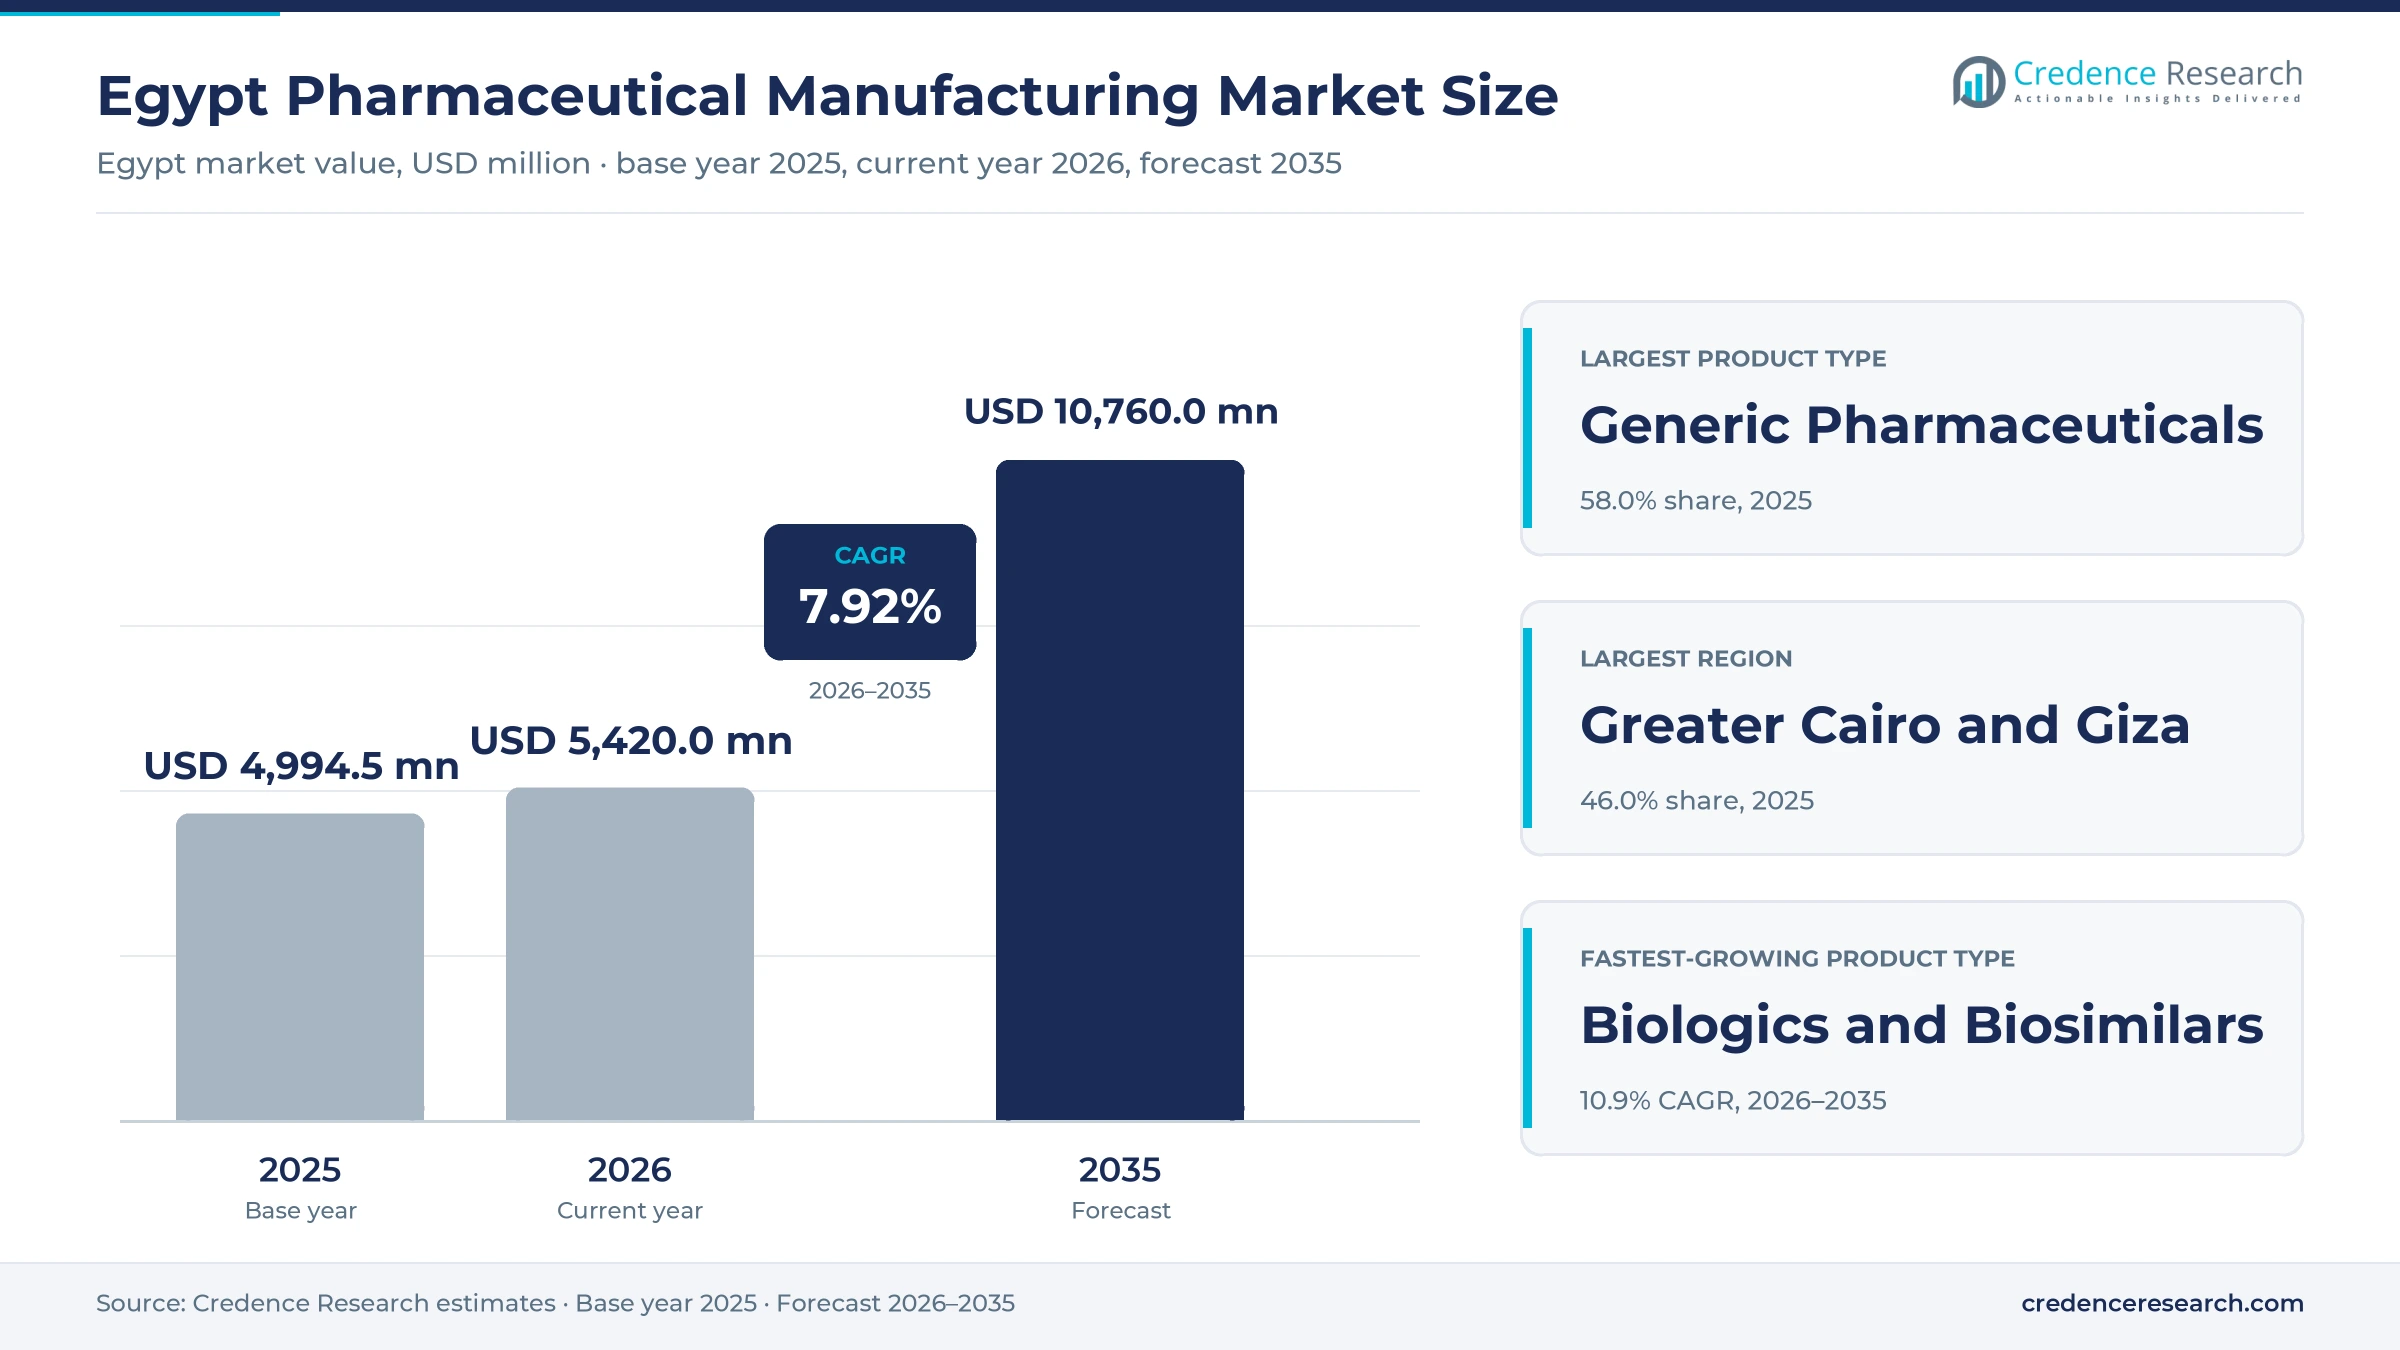
The Egypt pharmaceutical manufacturing market was valued at USD 4.99 billion in 2025 and is projected to increase from USD 5.42 billion in 2026 to USD 10.76 billion by 2035, registering a CAGR of 7.92% during 2026–2035. Output serves one of Africa's largest medicine markets, where generic tablets for diabetes, hypertension and infections dominate pharmacy shelves and state hospitals buy through central tenders. Greater Cairo and Giza held the largest regional share, 46.0% in 2025, because 6th of October City, Obour and the Giza plants of the leading generic makers sit close to the main wholesalers. Upper Egypt and other industrial zones form the fastest-growing region at 8.8% a year, as new active ingredient, vaccine and intravenous fluid plants open in the Suez Canal Economic Zone. Regulatory recognition has also changed the export case, since the national drug regulator now holds the World Health Organization's maturity level 3 for both medicines and vaccines.
Factory output for home and export markets is counted once
The estimate covers the value of finished human medicines made in Egypt, at ex-factory prices, whether sold to local wholesalers and pharmacies, supplied to public procurement bodies and hospitals or shipped abroad. It includes products of Egyptian private firms, state-owned producers and the local plants of multinational companies, as well as toll and contract production made for license holders.
The estimate excludes imported finished medicines, veterinary drugs, cosmetics and medical devices, and it counts active ingredients only when they are sold as part of a finished product. The value chain runs from imported and local raw materials through licensed factories and national distributors to pharmacies, hospitals and foreign buyers.
Egypt Pharmaceutical Manufacturing Market Insights
- The market was valued at USD 4.99 billion in 2025 and is projected to reach USD 10.76 billion by 2035, registering a CAGR of 7.92% during 2026–2035.
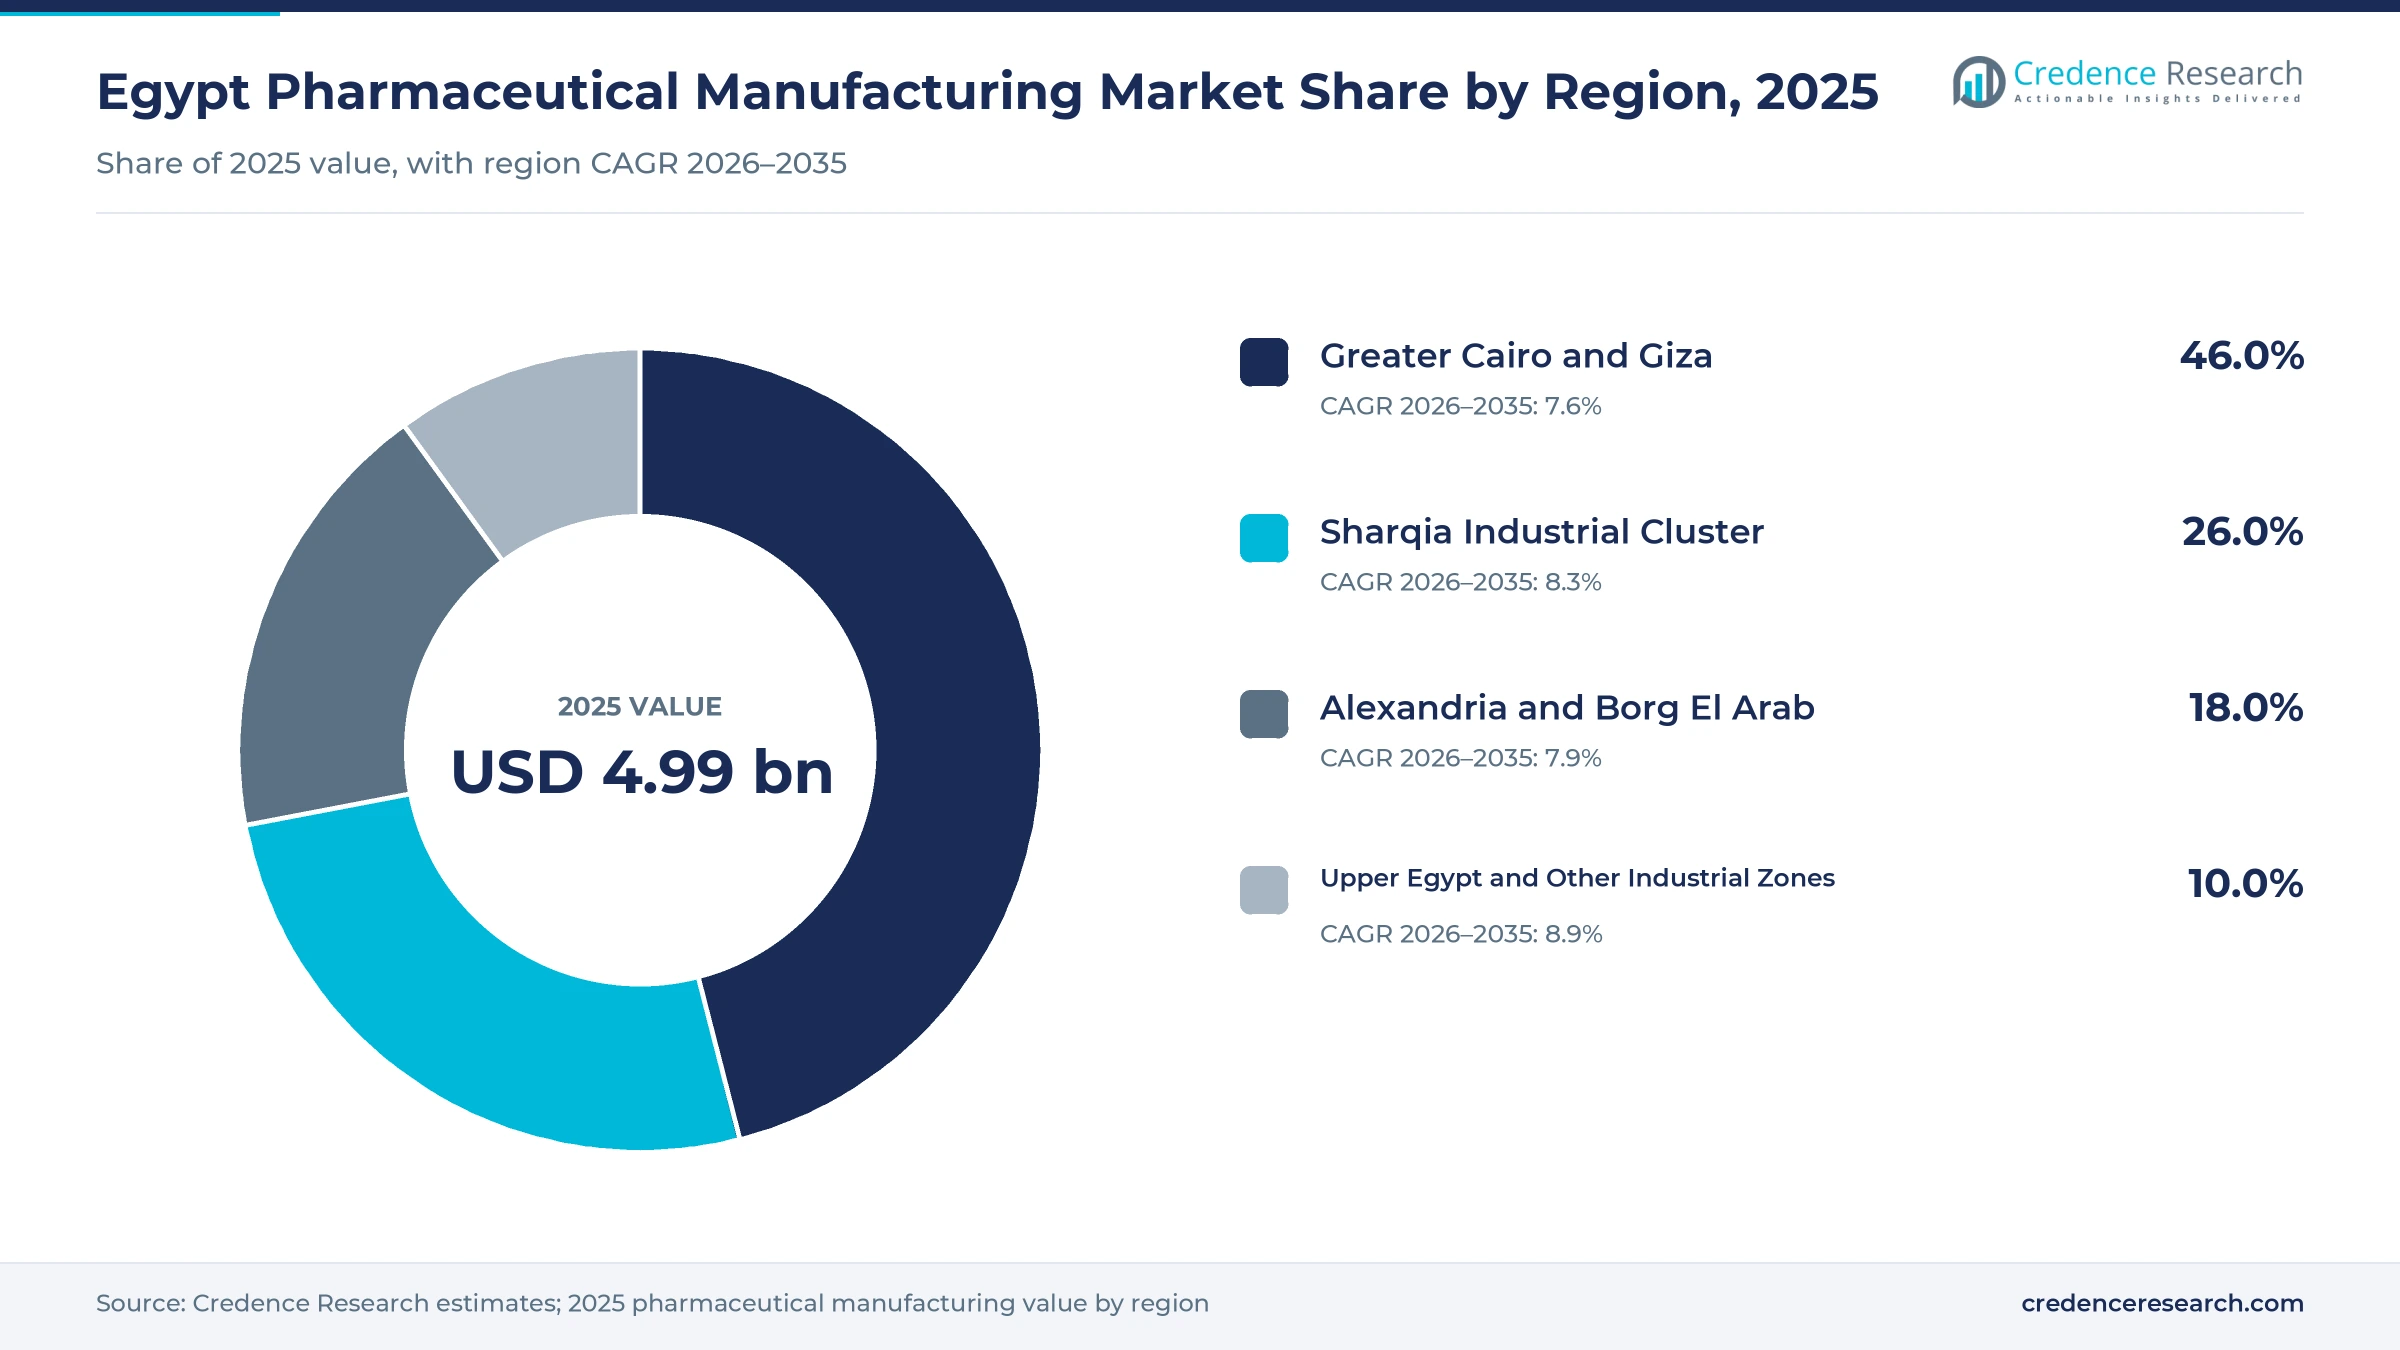
- Greater Cairo and Giza held 46.0% of 2025 value, because most of the largest generic and multinational plants operate in its industrial cities.
- Generic pharmaceuticals led product types with 58.0% of 2025 value, reflecting a market where local factories meet about 92% of demand by volume and 85% by value.
- Biologics and biosimilars are the fastest-growing product type at 10.9% a year during 2026–2035, as new plants in 10th of Ramadan City and the canal zone add sterile protein capacity.
- Egypt became the first African country with WHO maturity level 3 for both medicines and vaccines regulation in 2024, which strengthens the case for exports.
Generics lead while biologics and biosimilars grow fastest
Why do generic medicines carry most factory value?
Based on product type, the market is categorized into generic pharmaceuticals, originator and licensed brands, biologics and biosimilars, and OTC and consumer health pharmaceuticals. Generic Pharmaceuticals led with a 58.0% share of 2025 value, because the 179 licensed drug factories turn out about 3.7 billion to 4 billion dosage units a year, mostly copies of off-patent molecules, EnterpriseAM reported in November 2025. Biologics and Biosimilars grow fastest at 10.9% a year, as the African Development Bank approved a EUR 15 million loan in March 2025 to lift Minapharm's capacity from 3 million to 7.65 million doses by 2032. Locally made biosimilars can then replace costly imported antibodies in hospital tenders.
How much output still comes from tablets and capsules?
Based on dosage form, the market is categorized into solid oral dosage, parenteral products, liquid oral products and topical and inhalation products. Solid Oral Dosage led with a 62.0% share of 2025 value, because tablets and capsules are the cheapest form to make and ship, and the state-backed Gypto Pharma medicine city in Khanka built its first phase on 120,000 square meters around solid, semi-solid, liquid and sterile lines. Parenteral Products grow fastest at 9.1% a year, as Ateco Pharma's USD 10 million second phase in Ain Sokhna, opened in April 2026, raised its intravenous solution capacity to 50 million bottles a year.
Which treatment areas absorb the most factory capacity?
Based on therapeutic area, the market is categorized into cardiometabolic, anti-infectives, oncology and hematology, and CNS and respiratory. Cardiometabolic led with a 34.0% share of 2025 value, because about 13.2 million adults aged 20 to 79 lived with diabetes in 2024, an age-standardized prevalence of 22.4%, according to the IDF Diabetes Atlas, and most need lifelong daily tablets. Oncology and Hematology grows fastest at 9.8% a year, as Sandoz agreed in March 2025 to transfer full manufacturing technology for five cancer medicines to SEDICO, products with a USD 10.7 million import bill, the drug authority says.
Why do retail pharmacies take most factory shipments?
Based on customer type, the market is categorized into retail pharmacy supply, government procurement agencies, private hospitals and clinics, and export buyers. Retail Pharmacy Supply led with a 60.0% share of 2025 value, because most patients still pay out of pocket at private pharmacies, and the 57 million people covered by public insurance report shortages in state hospitals that send many of them to pharmacy counters, Al Majalla reported in December 2025. Export Buyers grow fastest at 9.6% a year, as first-quarter 2026 drug exports reached USD 280 million, up 7% on the year, Business Monthly reported.
| Segment Group | Leading Sub-segment | Share, 2025 | Fastest-growing Sub-segment | CAGR, 2026–2035 |
|---|---|---|---|---|
| By Product Type | Generic Pharmaceuticals | 58.0% | Biologics and Biosimilars | 10.9% |
| By Dosage Form | Solid Oral Dosage | 62.0% | Parenteral Products | 9.1% |
| By Therapeutic Area | Cardiometabolic | 34.0% | Oncology and Hematology | 9.8% |
| By Customer Type | Retail Pharmacy Supply | 60.0% | Export Buyers | 9.6% |
State pricing rules favor locally made medicines
Prices for registered medicines are set by the drug authority rather than by the market, so factory margins depend on how quickly approved prices follow costs. A new formula took effect on Sept. 24, 2026, weighting the exchange rate at 60%, urban inflation at 30% and the central bank deposit rate at 10%, according to EnterpriseAM. Drugmakers were reported in November 2026 to be seeking a 20% increase, while analysts estimated the formula supports about half of that. The rules also price local products well below imports, which gives Egyptian plants a lasting cost edge in pharmacies and tenders.
| Pricing rule or product | Typical price or fee | Basis |
|---|---|---|
| Locally made product versus imported equivalent | Priced at 50% to 60% of the imported product | EnterpriseAM, Sept. 2026 |
| Imported finished product | Lowest suitable reference price minus a further 10% | EnterpriseAM, Sept. 2026 |
| Repricing trigger | Formula change of at least 10% sustained for 45 days | EnterpriseAM, Nov. 2026 |
| Industry-proposed pricing basis | Production cost plus a 15% to 20% net margin | EnterpriseAM, Nov. 2025 |
| Aspirin Protect, Memphis Pharmaceuticals | EGP 25 to EGP 87 per pack within one year | Al Majalla, Dec. 2025 |
Request a Free Sample
Fill in your details and we'll send you a free sample report.
- Sample data tables & charts
- Research methodology
Localization, chronic care and WHO recognition drive output
How does deepening localization move value to local plants?
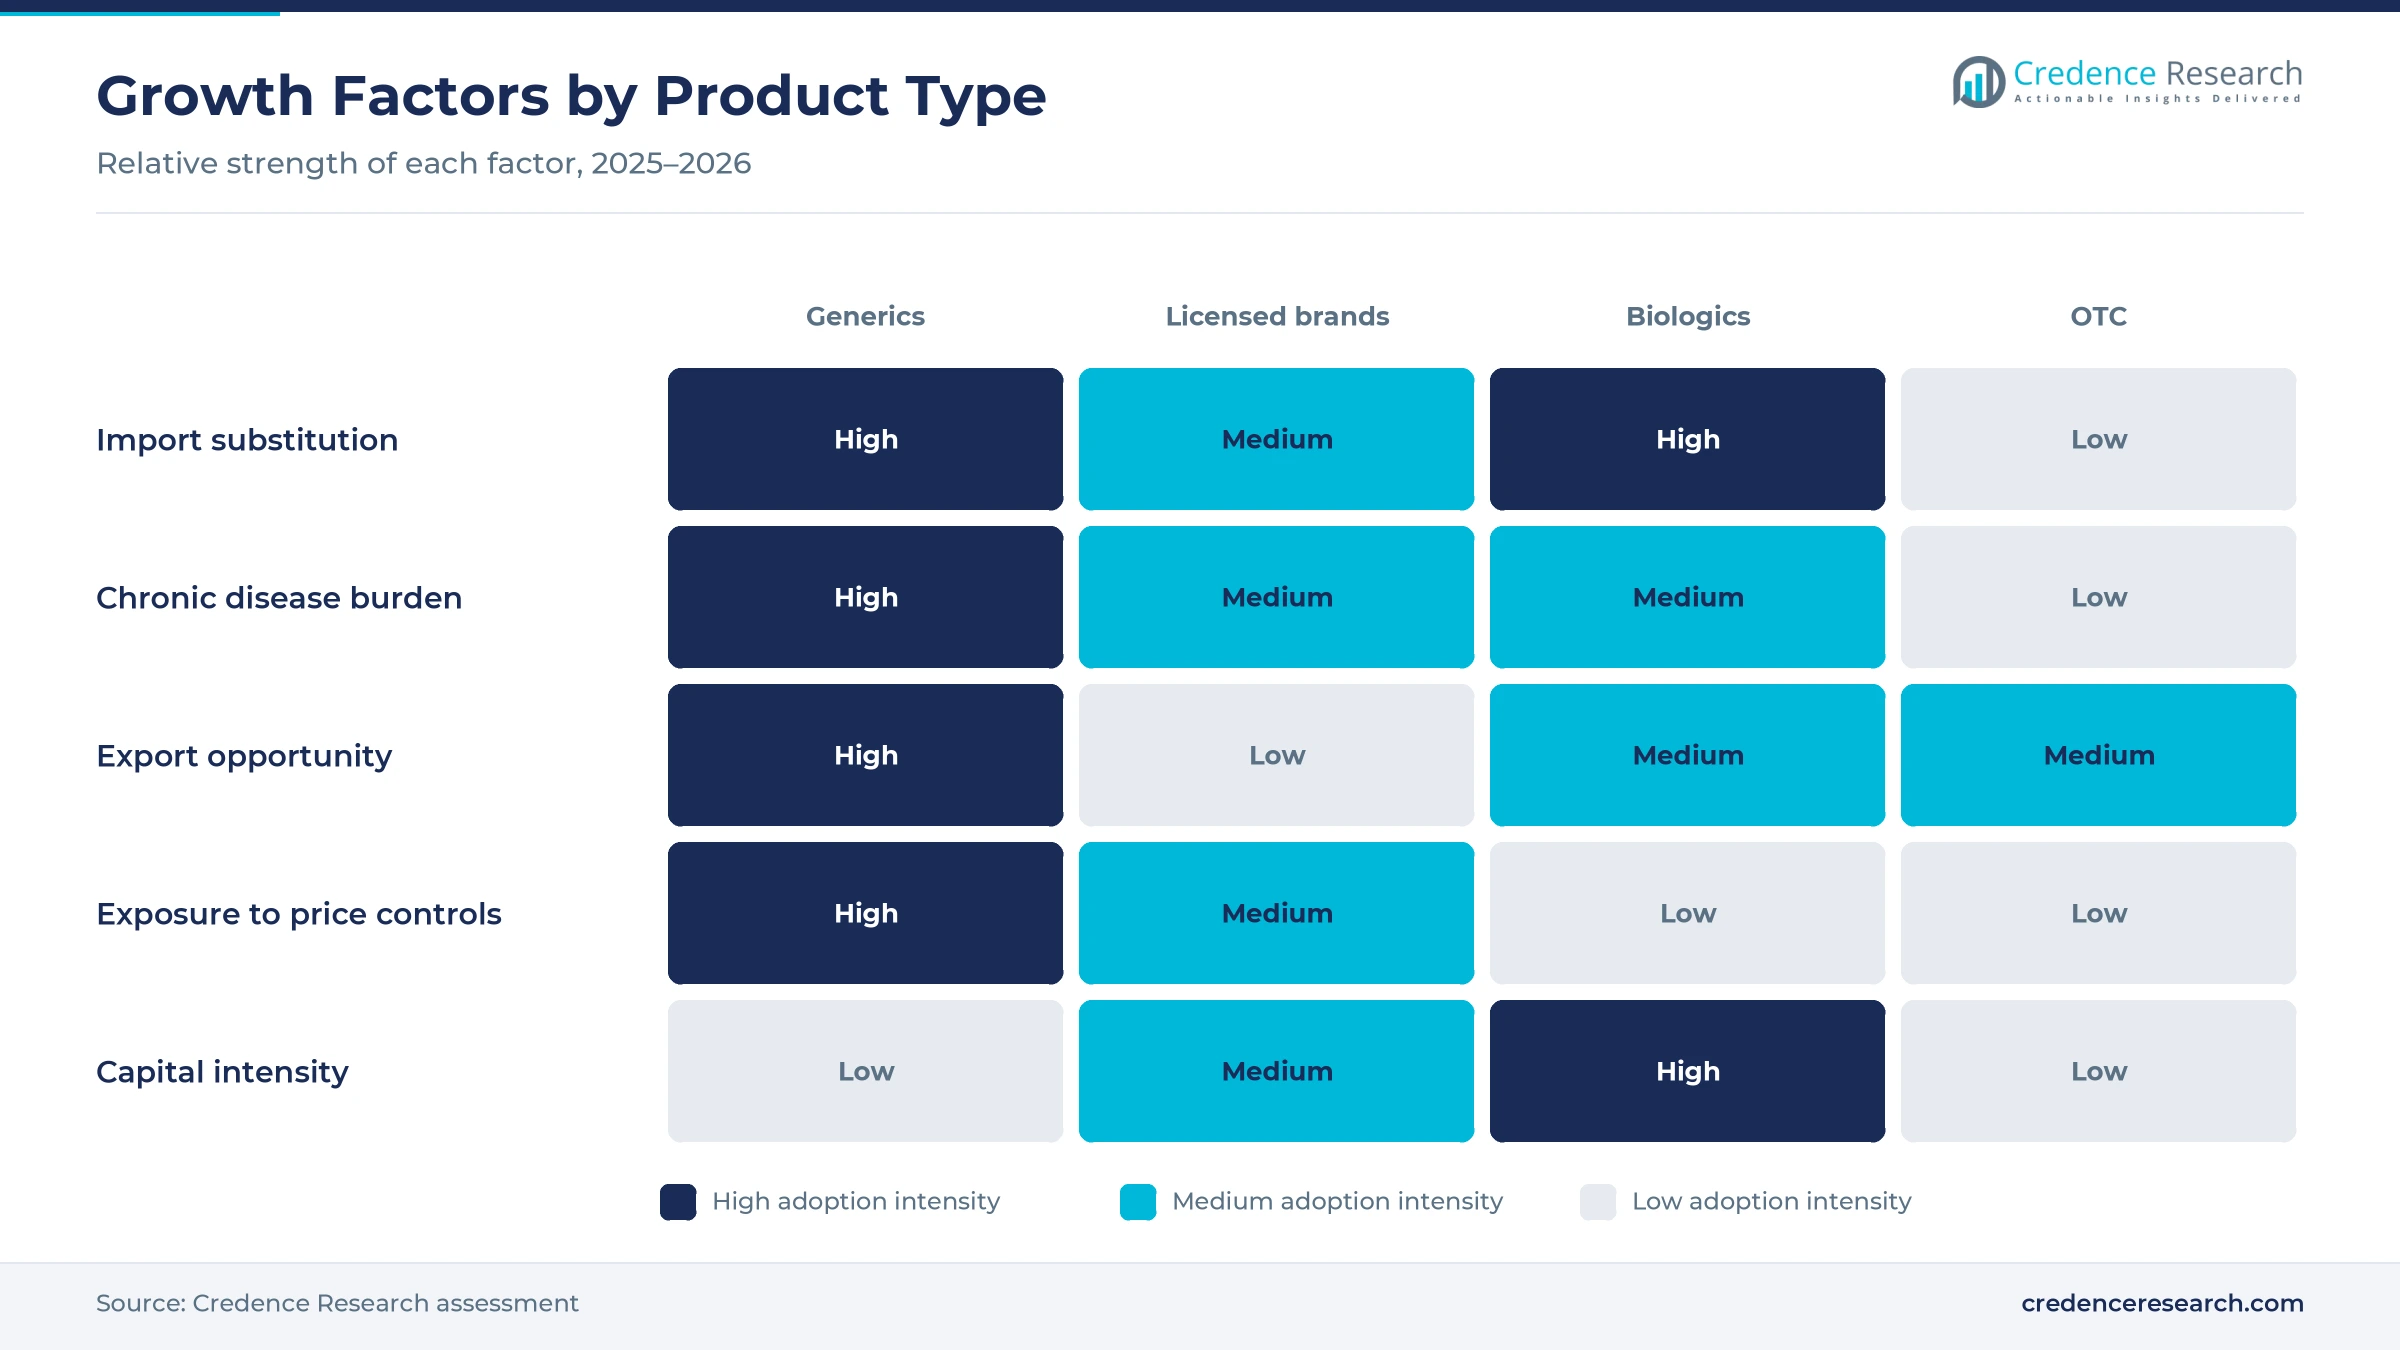
Import substitution is the largest single source of new factory volume, because every localized product moves value from foreign suppliers to Egyptian lines. The drug authority says 155 active ingredients were localized in 2023 to 2025 for use in 234 finished products, replacing imports worth about USD 691 million, Business Monthly reported in August 2026. EnterpriseAM counted 208 localized medicines whose import bill had exceeded USD 732 million a year. The Chamber of Pharmaceutical Industry also told Asharq Business in May 2025 that producers would invest about EGP 4 billion that year in 20 new production lines. For suppliers of equipment, excipients and packaging, this means a steady run of line tenders rather than a single wave of investment.
Why does the chronic-disease burden keep lines running?
Chronic conditions give factories long, predictable production runs, since patients refill the same molecules every month for years. Local manufacturing covers about 92% to 94% of demand for essential and chronic medicines, Business Monthly reported in August 2026, so most new chronic prescriptions become local output. Insulin shows how the gap is closing, as EVA Pharma launched the first locally made insulin glargine at its Giza factory in December 2024, Al-Ahram reported. Officials said insulin imports had cost USD 30 million by the end of September 2024, and the partners aim to reach more than one million people a year by 2030. Cardiometabolic lines keep the largest share of value, 34.0% in 2025, and give producers a stable base to finance newer sterile capacity.
What do WHO recognition and export targets change for makers?
International regulatory recognition turns Egyptian plants into credible suppliers for foreign tenders and registrations. Egypt's drug regulator reached maturity level 3 for medicines in November 2024, after reaching it for vaccines in 2022, making it the first African country with both, according to the World Health Organization. The Egyptian Drug Authority puts 2025 exports at about USD 1.3 billion and targets USD 3 billion by 2030, including USD 1.34 billion to Africa. Africa already took USD 216 million of Egyptian medical exports in 2024, about 26% of the total, the Export Council for Medical Industries says. Reliance on a recognized regulator shortens registration abroad, which favors firms with dossiers ready for African agencies.
Will universal health insurance add institutional demand?
The universal health insurance system widens the institutional market, because each new governorate adds a contracted network of hospitals and clinics that buy medicines centrally. The first phase in six governorates, from Port Said to Aswan, covered about 5.2 million people with an 81.7% registration rate by November 2025, EnterpriseAM reported in August 2026. The second phase in Minya, Matrouh, Damietta, Kafr El Sheikh and North Sinai targets about 12 million to 13 million more people, backed by 69 hospitals and 669 primary care units. France's development agency signed a EUR 150 million policy loan for the program in June 2026. Producers with tender pricing and reliable supply stand to gain volume as the scheme moves toward Cairo and Giza.
Biologics, Gulf plants and finance reshape the industry
Shift from imported biologics toward local sterile protein lines
Producers are moving up the value chain from tablets into sterile biologics, the segment with the highest prices per dose. Minapharm and Bayer signed a localization agreement on Nov. 15, 2025, in the presence of the drug authority chairman, Daily News Egypt reported, and the regulator links such deals to its WHO recognition. EnterpriseAM counted only four biological drug factories in November 2025, which shows how thin this capacity still is. The government also laid the foundation stone of the USD 220 million Genfex vaccine plant in the Suez Canal Economic Zone on Dec. 16, 2025, planned for 70 million to 80 million doses a year at first. Firms that master cell culture and fill-finish can win licensed products that generic rivals cannot copy.
Rise of Egyptian-owned plants in Saudi Arabia and the Gulf
Egyptian producers are building plants inside Gulf markets to meet local-content rules and protect export sales. APEX Pharma started operations at its first plant in King Abdullah Economic City in March 2025, Sharikat Mubasher reported, launching a hypertension medicine approved by the Saudi regulator. Pharco is moving ahead with a SAR 155 million plant in Medina that should start production in 2028, EnterpriseAM reported in May 2026. Marcyrl agreed in October 2026 to localize fertility and respiratory medicines in the UAE with Mubadala Bio, The Source reported. Demand in Saudi Arabia rewards local presence, so Egyptian factories may ship more technology and fewer finished packs to the Gulf over time.
Can licensed production for multinationals fill spare capacity?
Licensed and contract production for multinational brand owners is an opening for plants that run below capacity. EnterpriseAM reported in November 2025 that 7 international companies from the United States, China, India and Europe had asked to expand their local production in 2026. Sanofi granted Minapharm exclusive rights to make and supply its anticoagulant Clexane in Egypt, Fierce Pharma reported, while Sanofi's own Cairo plant, running since 1962, makes 120 million units a year. Eli Lilly supplies insulin ingredient at a reduced price and transfers formulation and fill-finish technology to EVA Pharma free of charge, Health Policy Watch reported in May 2023. Each license brings a known brand, a transfer of know-how and assured offtake, which lowers the risk of adding new lines.
Will subsidized credit fund the next round of upgrades?
Cheaper credit can help mid-sized producers upgrade plants that need new lines to stay competitive. An EGP 7 billion financing package offers subsidized interest of 5% to 7% to manufacturers, Al Majalla reported in December 2025. Daily News Egypt reported in May 2025 that only 11 of 170 factories held international accreditation from bodies such as WHO and EMA, which shows how much upgrade work remains. The DG Tresor of France counted 40 more drug factories under construction in August 2025. Suppliers of clean rooms, isolators, inspection systems and validation services stand to gain, because accreditation is the gate to regulated export markets and to multinational license work.
Imported inputs, fixed prices and accreditation gaps
Imported raw materials expose costs to the pound
Dependence on imported inputs leaves factory costs tied to the exchange rate. Egypt imports more than 90% of its pharmaceutical raw materials, the drug authority head said, as EnterpriseAM reported in May 2026, and the dollar passed EGP 56 on Oct. 26, 2026. Every currency move raises the cost of each batch before prices can change. Upstream active ingredient plants in the canal zone will ease this exposure only after they reach full output.
Fixed retail prices lag rising production costs
Mandatory pricing compresses margins whenever costs move faster than approved prices. The last broad repricing came in October 2024, at an exchange rate of EGP 50 to 51 per dollar, EnterpriseAM reported in November 2025. In 2025, hundreds of firms called for price increases across the market, and the drug authority resisted, citing a stronger pound. Producers respond by cutting low-margin presentations, which can cause gaps on pharmacy shelves until new prices are approved.
Smaller factories face a cash squeeze in 2026
Liquidity pressure threatens small and medium producers that depend on distributor credit. Ali Ouf of the federation's pharmaceutical division expects a difficult 2026 for such factories, some of which may exit, EnterpriseAM reported in November 2025. He also warned that the exit of small distributors could remove more than EGP 50 billion of liquidity from the drug circulation cycle. The government had settled 90% of arrears owed to drug companies by May 2026, which eases but does not end the squeeze on weaker firms.
High registration costs slow new product launches
Registration costs raise the bar for launching new generic products in Egypt. The drug authority fee rose to EGP 5 million per product, from EGP 1 million before 2018, EnterpriseAM reported in November 2025. For a mid-sized firm that files dozens of dossiers a year, the fee alone ties up significant capital before any sale. Larger producers absorb it more easily, so the rule favors consolidation and leaves fewer suppliers for low-price molecules that smaller firms used to cover.
Greater Cairo leads while the canal zones grow fastest
| Region | Value, 2025 (USD billion) | Share, 2025 | CAGR, 2026–2035 |
|---|---|---|---|
| Greater Cairo and Giza | 2.30 | 46.0% | 7.5% |
| Sharqia Industrial Cluster | 1.30 | 26.0% | 8.2% |
| Alexandria and Borg El Arab | 0.90 | 18.0% | 7.8% |
| Upper Egypt and Other Industrial Zones | 0.50 | 10.0% | 8.8% |
Greater Cairo and Giza hosts most large generic plants
Greater Cairo and Giza held 46.0% of 2025 value and grows at 7.5% a year. The region includes 6th of October City, Obour, Badr and the Khanka medicine city, and it hosts EVA Pharma's Giza factory, where the first local insulin was filled. SEDICO opened an EGP 1 billion oncology plant in 6th of October City in March 2023, designed for about 10 million units a year, Zawya reported. Proximity to national distributors and the largest pool of pharmacists keeps new capacity here.
The Sharqia cluster gains biologics capacity
The Sharqia Industrial Cluster held 26.0% of 2025 value and grows at 8.2% a year, centered on 10th of Ramadan City. EIPICO opened its EIPICO 3 plant there in July 2026, an investment of more than USD 100 million designed to make 14 biological products for cancer, blood disorders, infertility and kidney disease, The Middle East Observer reported. EIPICO's three plants together can make about 327 million packages a year. Biologics output makes this cluster the second engine of growth.
Alexandria and Borg El Arab specialize in export lines
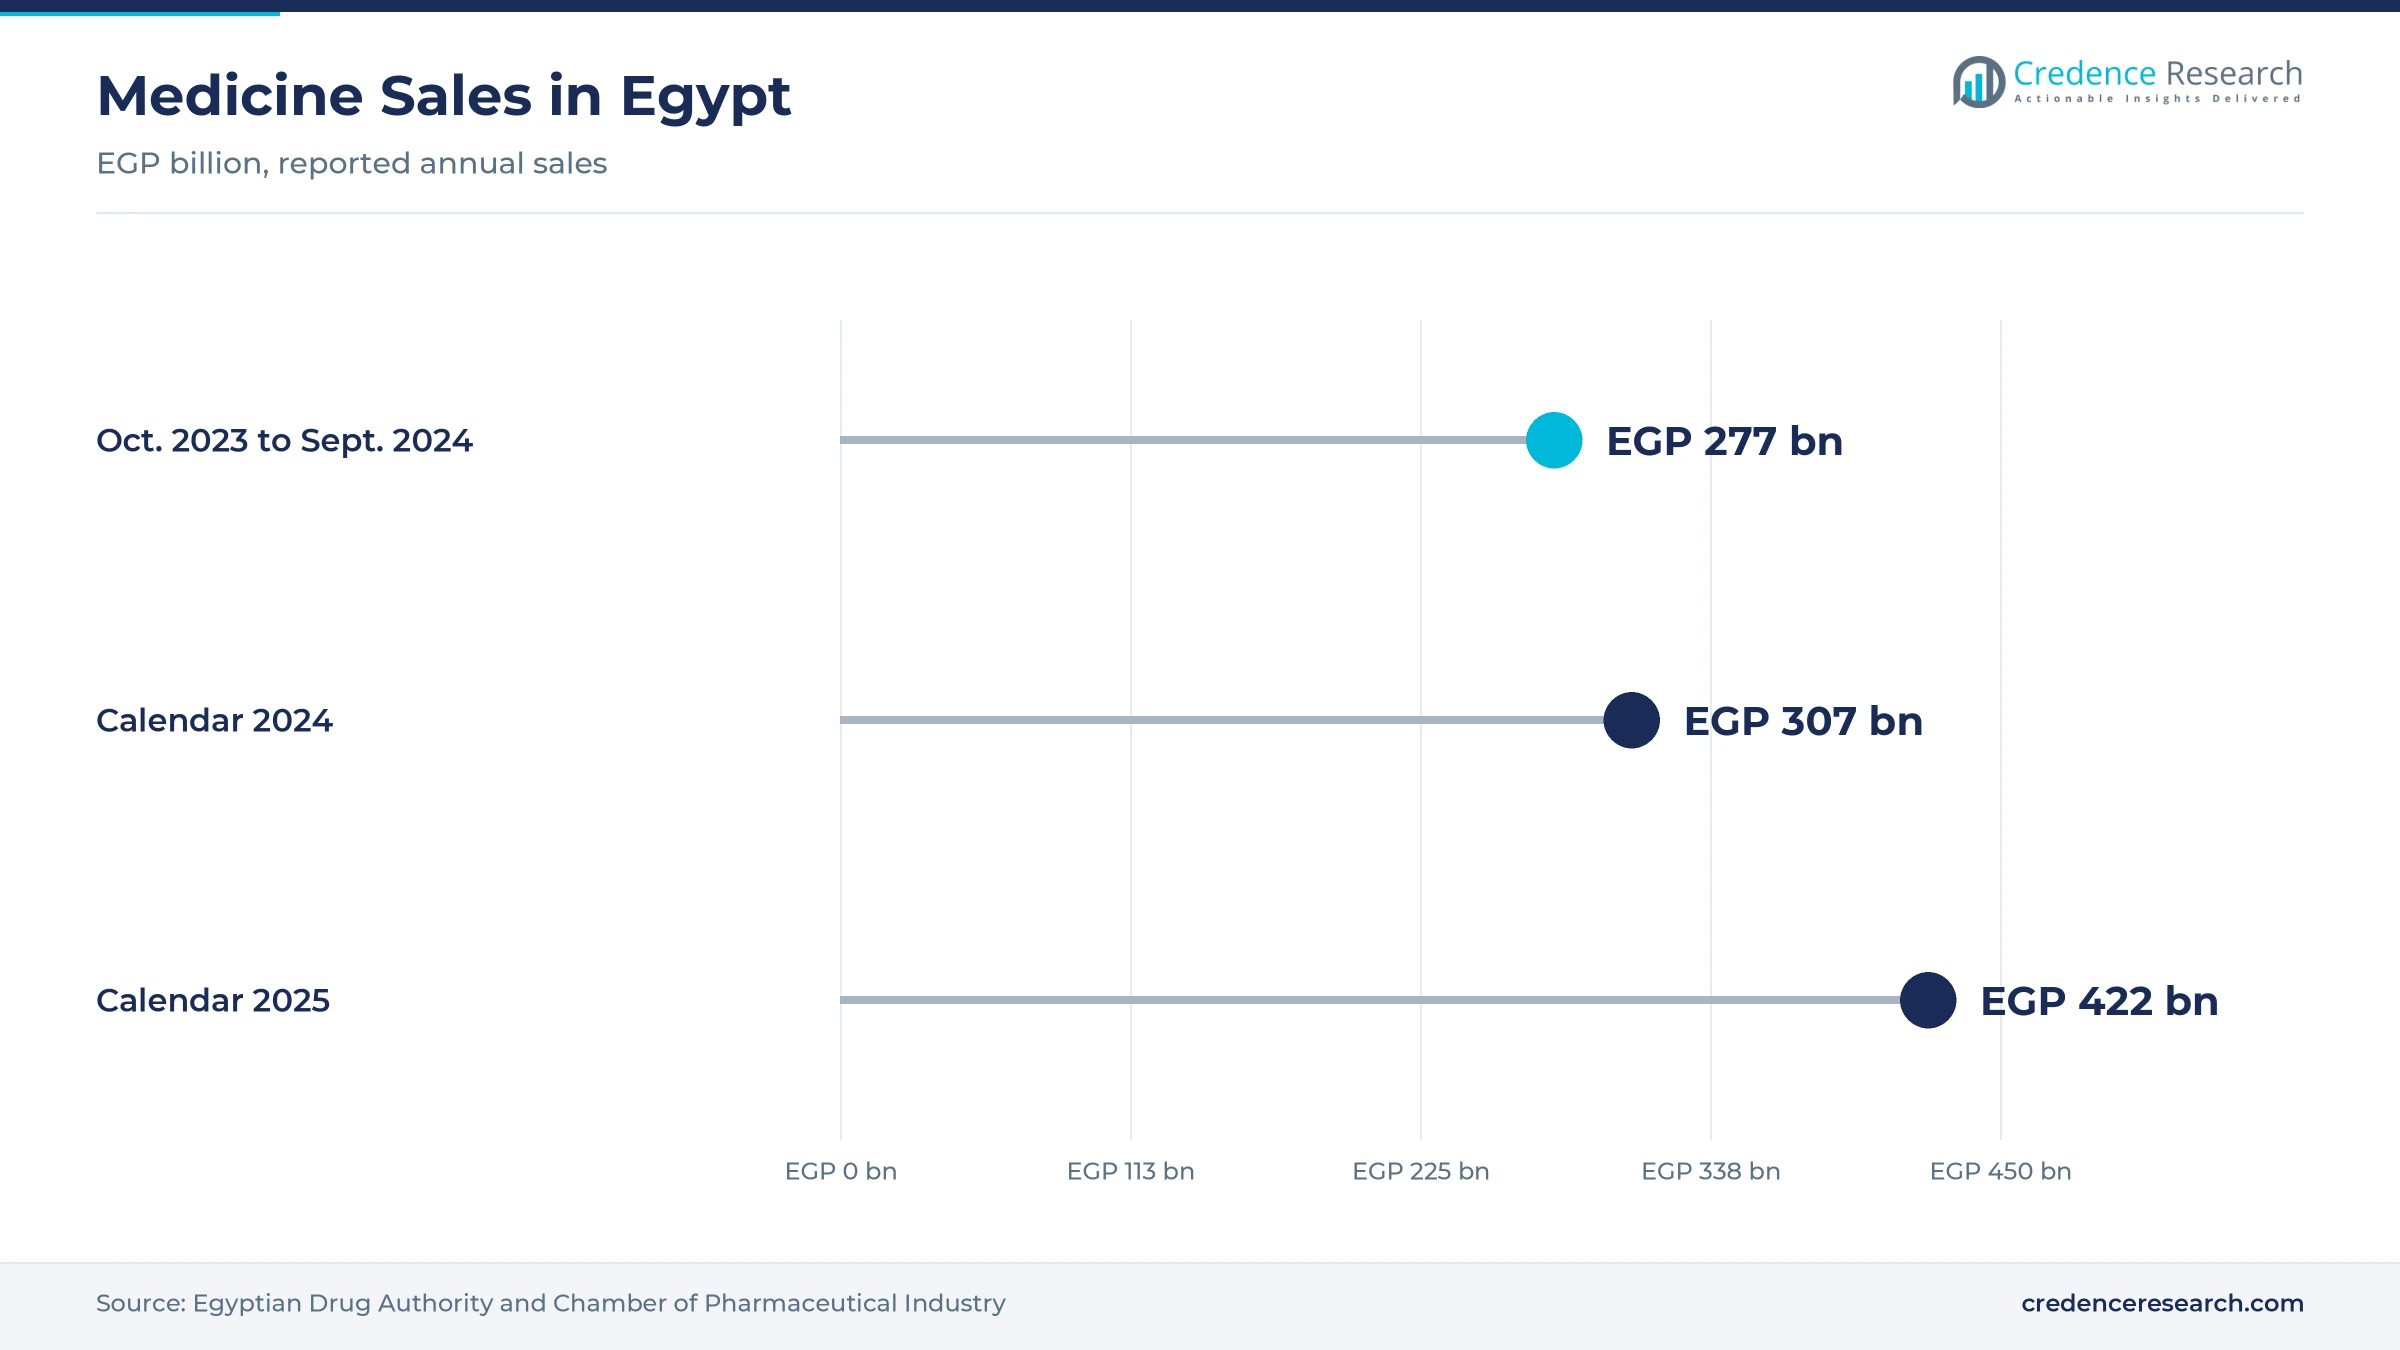
Alexandria and Borg El Arab held 18.0% of 2025 value and grow at 7.8% a year, anchored by Pharco and port access for exports. Pharco opened an eye drop line of up to 20 million packs a year at its Amreya facility in April 2026, about 19% of domestic demand of more than 100 million packs, according to Daily News Egypt. The port makes this zone a natural base for shipments to Africa and the Gulf.
Canal zones and Upper Egypt grow from a small base
Upper Egypt and other industrial zones held 10.0% of 2025 value and grow fastest at 8.8% a year. Growth comes mainly from Ain Sokhna in the Suez Canal Economic Zone, where ARAB API, an alliance of EIPICO, ACDIMA and the zone authority, plans a USD 120 million plant for 54 active ingredients and 700 to 750 tons a year, The Middle East Observer reported in September 2025. Upper Egypt governorates mostly receive goods from northern plants rather than making them.
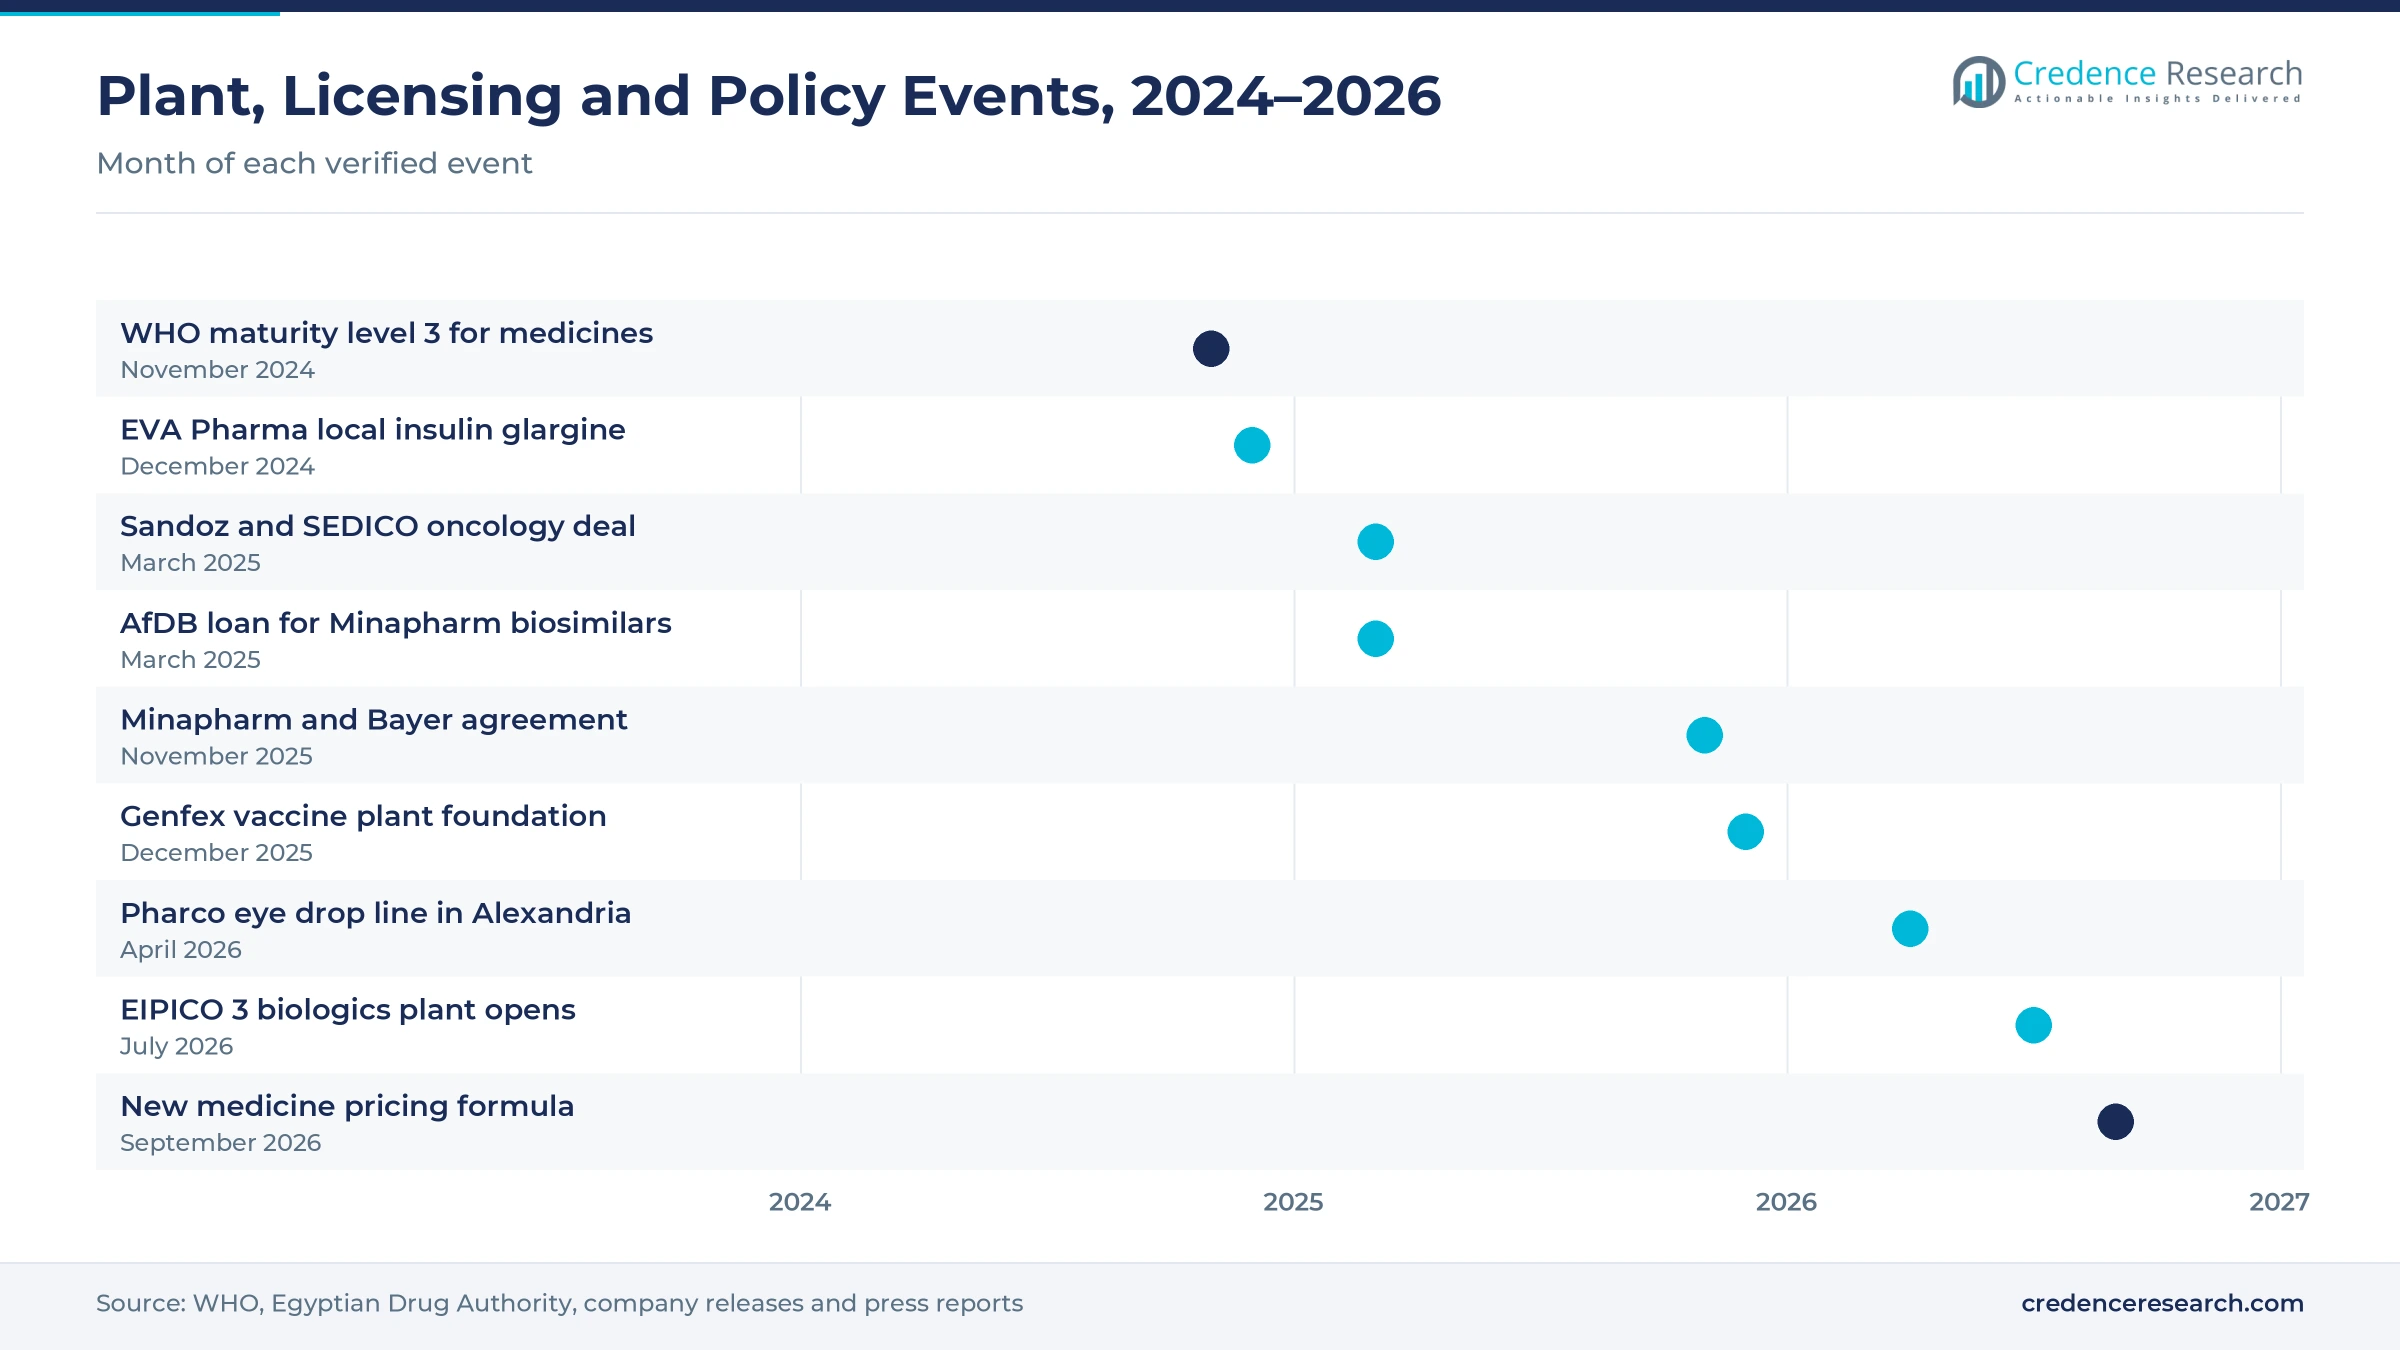
Plant openings and pricing reform from 2024 to 2026
| Development | Status and market relevance |
|---|---|
| In December 2024, EVA Pharma launched the first locally produced insulin glargine at its Giza factory with technology from Eli Lilly. | Marketed; first local long-acting insulin |
| In March 2025, Sandoz and SEDICO signed an agreement to localize the manufacture of five cancer medicines in Egypt. | Technology transfer under way |
| In April 2026, Pharco opened a new eye drop production line at its Amreya facility in Alexandria. | Operating; supports regional exports |
| In July 2026, EIPICO inaugurated its EIPICO 3 biologics plant in 10th of Ramadan City. | Commissioning; 14 biological products planned |
| In September 2026, the Egyptian Drug Authority introduced a new formula for adjusting medicine prices. | In force; first review under way |
Sterile, biologic and upstream capabilities set the pace
- Sterile and aseptic filling lets plants make injectables, eye drops and intravenous fluids, the forms where Egyptian capacity is now growing fastest.
- Cell culture and protein purification are the base of biosimilar and insulin production, and only a handful of local plants run them at commercial scale.
- High-containment suites protect workers and products when plants handle potent cancer drugs and hormones, which licensed oncology transfers require.
- Blow-fill-seal technology forms, fills and seals plastic containers in one step, which cuts contamination risk and cost for intravenous solutions.
- Serialization and track-and-trace systems give each pack a unique code that regulators and export buyers increasingly expect before they accept supply.
Need a Custom Version of This Report?
Tailor the scope, geography, or segments to your exact requirements.
- Custom geography or segment scope
- Direct access to our analyst team
Egyptian generic leaders compete with multinational plants
Competition in the Egypt pharmaceutical manufacturing market centers on a group of large local generic houses that compete with the Egyptian plants of multinational companies. EVA Pharma and Pharco lead on portfolio breadth and exports, with EVA adding insulin and cancer medicines and Pharco expanding sterile eye care lines in Alexandria. Amoun, owned by Abu Dhabi's ADQ, and EIPICO, half-owned by the Arab Company for Drug Industries and Medical Appliances (ACDIMA), rank among the largest volume producers. Minapharm leads local biologics, SEDICO focuses on oncology transfers, and Marcyrl specializes in hormonal and respiratory products. Rameda runs three factories in 6th of October City, Global Napi adds contract manufacturing of tablets, capsules and injectables, and APEX Pharma opened its first Saudi plant in March 2025. Firms compete on registration speed, tender pricing, multinational licenses and export accreditation rather than on list price, which the state sets.
How concentrated is Egyptian drug production?
Production is split between a group of large Egyptian generic houses, a few state-owned firms under ACDIMA and the holding company, and the local plants of multinationals such as Sanofi, Pfizer, Novartis and Servier. EVA Pharma, Pharco, Amoun, EIPICO and Minapharm compete on portfolio breadth, while toll makers fill spare lines through contract production for license holders, as Minapharm does for Sanofi's Clexane. Entry barriers are moderate for tablets but high for sterile and biologic products, which need costly clean rooms and inspections. Margins are thinnest on price-capped chronic generics and highest on biologics, oncology and export products.
Leading Egyptian drug producers and their roles
| Company | Type | Role in the market |
|---|---|---|
| EVA Pharma | Local manufacturer | Generics, insulin and oncology medicines from Giza plants for local and export markets |
| Pharco Pharmaceuticals | Local manufacturer | Broad generic portfolio and sterile eye drops from Alexandria facilities |
| Amoun Pharmaceutical Company | Local manufacturer | High-volume generics and consumer health products, owned by ADQ |
| EIPICO | Local manufacturer | Generics and new biologics plant in 10th of Ramadan City |
| Rameda | Local manufacturer | Branded generics from three factories with 20 lines in 6th of October City |
| SEDICO | Local manufacturer | Oncology injectables and licensed cancer medicines from 6th of October City |
| APEX Pharma | Local manufacturer | Generic medicines for Egypt with a new plant in Saudi Arabia |
| Minapharm Pharmaceuticals | Biologics specialist | Biosimilars and licensed biologics, including partnerships with Bayer and Sanofi |
| Global Napi Pharmaceuticals | Local manufacturer | Generic tablets, capsules and injectables plus contract manufacturing from 6th of October City |
| Marcyrl Pharmaceutical Industries | Specialty generics maker | Hormonal, fertility and respiratory medicines, some made under license |
| Sanofi (Sanofi Egypt) | Multinational manufacturer | Cairo plant making about 120 million units a year; Clexane licensed to Minapharm |
Credence Research view on value-added drug production
Credence Research's view is that the Egypt pharmaceutical manufacturing market has largely finished its first task of covering domestic volume, and it now competes on value. Local factories meet about 92% of demand by volume and 85% by value, so new growth must come from biologics, oncology, sterile products and exports. Pricing reform that ties approved prices to costs and favors local products improves the investment case, but only if repricing keeps pace with the currency. Buyers and investors should watch the first reviews under the new formula, the start-up of the canal zone ingredient plants and the pace of African registrations.
Sales, trade and plant data anchor the estimate
The report uses 2025 as the base year and 2026 to 2035 as the forecast period. Market values come from the Credence Research model, checked against Egyptian Drug Authority sales data, UN Comtrade trade data, export council statements and industry estimates of local production shares. Product type, dosage form, therapeutic area, customer type and regional splits are Credence Research estimates. Inputs include regulator and WHO releases, company announcements, development bank releases and press reports that name their sources. No interviews or surveys were used in preparing these estimates.
Biologics, oncology and exports gain share to 2035
The Egypt pharmaceutical manufacturing market is expected to reach USD 10.76 billion by 2035, growing at 7.92% a year during 2026–2035. Greater Cairo and Giza stays the largest production region, while the canal zones and Upper Egypt grow fastest as ingredient, vaccine and fluid plants open. Generics keep the largest share, but biologics and biosimilars gain, and oncology and hematology medicines grow at 9.8% a year as licensed transfers and new sterile lines come on stream. Export buyers become the fastest-growing customer group at 9.6% a year if African registrations speed up. A stable pound and timely repricing would lift this outlook, while renewed currency weakness would hold it back.
Currency stability and pricing decide the range of outcomes
The range of outcomes depends mainly on how stable the pound remains and whether the new pricing formula lets factories pass on cost increases on time. A downside follows if the currency weakens again, active ingredient imports stay at current levels and approved prices lag for another two years. An upside needs the canal zone ingredient and vaccine plants to reach full output, biologics licenses to multiply and African registrations to speed up under the WHO recognition. The base case assumes gradual repricing, steady localization and moderate growth in exports to Africa.
| Scenario | CAGR, 2026–2035 | Value, 2035 | What has to hold |
|---|---|---|---|
| Downside | 6.4% | USD 9.49 billion | The pound weakens again and approved prices lag costs for two more years |
| Base | 7.92% | USD 10.76 billion | Gradual repricing, steady localization and moderate export growth continue |
| Upside | 9.4% | USD 12.19 billion | Canal zone ingredient and vaccine plants reach full output and African registrations speed up |
Frequently Asked Questions
How big is the Egypt pharmaceutical manufacturing market?
Which product type leads Egyptian drug production?
Which region produces the most medicines in Egypt?
How self-sufficient is Egypt in medicines?
What does WHO maturity level 3 mean for Egyptian producers?
How are medicine prices set in Egypt?
Which segment grows fastest?
Who are the main companies in the market?
Table of Content
Chapter 1 Market Segmentation
- 1.1 Segmentation Framework
- 1.1.1 Product and Service Classification
- 1.1.2 Application and End-Use Classification
- 1.1.3 Technology and Solution Classification
- 1.1.4 Customer and Distribution Channel Classification
- 1.1.5 Geographic Segmentation
- 1.1.6 Market Segment Definitions and Boundaries
- 1.2 By Product Type
- 1.2.1 Generic Pharmaceuticals
- 1.2.2 Originator and Licensed Brands
- 1.2.3 Biologics and Biosimilars
- 1.2.4 OTC and Consumer Health Pharmaceuticals
- 1.3 By Dosage Form
- 1.3.1 Solid Oral Dosage
- 1.3.2 Parenteral Products
- 1.3.3 Liquid Oral Products
- 1.3.4 Topical and Inhalation Products
- 1.4 By Therapeutic Area
- 1.4.1 Cardiometabolic
- 1.4.2 Anti-Infectives
- 1.4.3 CNS and Respiratory
- 1.4.4 Oncology and Hematology
- 1.5 By Customer Type
- 1.5.1 Retail Pharmacy Supply
- 1.5.2 Government Procurement Agencies
- 1.5.3 Private Hospitals and Clinics
- 1.5.4 Export Buyers
Chapter 2 Introduction
- 2.1 Report Objectives and Scope
- 2.2 Product Definition and Industry Terminology
- 2.3 Market Inclusions and Exclusions
- 2.4 Research Process
- 2.4.1 Primary Research and Expert Interviews
- 2.4.2 Secondary Research and Source Review
- 2.4.3 Top-Down and Bottom-Up Estimation
- 2.4.4 Data Triangulation and Verification
- 2.5 Market Size Measurement Basis
- 2.5.1 2025: USD 4.99 billion → 2035: USD 10.76 billion
- 2.6 Historical and Forecast Reference Periods
- 2.6.1 Historical Period: 2018-2025
- 2.6.2 Base Year: 2025
- 2.6.3 Forecast Period: 2025-2035
- 2.7 Research Assumptions and Limitations
Chapter 3 Executive Summary
- 3.1 Market Snapshot and Key Findings
- 3.2 Base-Year Market Size, 2025
- 3.3 Forecast Market Size, 2035
- 3.4 Revenue and Volume Growth Outlook
- 3.5 Key Demand and Supply Indicators
- 3.6 Leading Market Segments
- 3.7 Fastest-Growing Market Opportunities
- 3.8 Regional Performance Highlights
- 3.9 Technology and Industry Transformation
- 3.10 Competitive Landscape Summary
- 3.11 Analyst View and Strategic Implications
Chapter 4 Egypt Pharmaceutical Manufacturing Market Trends and Developments
- 4.1 Historical Industry Development, 2018-2025
- 4.2 Recent Market Trends and Developments
- 4.3 Demand and Customer Behavior Trends
- 4.4 Technology and Product Innovation
- 4.5 Artificial Intelligence, Automation and Digitalization
- 4.6 Local Manufacturing and Supply Chain Realignment
- 4.7 Industry Partnerships, Mergers and Acquisitions
- 4.8 Sustainability and Circular Economy Developments
- 4.9 Government and Private Sector Investment Trends
- 4.10 Emerging Business Models and Commercialization
- 4.11 Industry Developments and Announcements
Chapter 5 Egypt Pharmaceutical Manufacturing Market Production, Supply and Demand Analysis
- 5.1 Demand Trend and Consumption Analysis, 2018-2025
- 5.2 Demand Forecast, 2025-2035
- 5.3 Production and Output Trend, 2018-2025
- 5.4 Production and Output Forecast, 2025-2035
- 5.5 Installed Capacity and Capacity Utilization
- 5.6 Company-Wise Production Plants and Statistics
- 5.6.1 Installed Production Capacity
- 5.6.2 Actual Production
- 5.6.3 Planned Capacity and Expansion Targets
- 5.7 Supply Chain Structure and Procurement Trends
- 5.8 Supply-Demand Gap and Bottlenecks
- 5.9 Import Dependence and Sourcing Structure
- 5.10 Contract Manufacturing and Outsourcing
- 5.11 Regional Supply and Demand Concentration
Chapter 6 Egypt Pharmaceutical Manufacturing Market Pricing Analysis
- 6.1 Pricing Structure and Measurement
- 6.2 Historical Pricing Trends, 2018-2025
- 6.3 Pricing Outlook, 2025-2035
- 6.4 Average Selling Price and Unit Economics
- 6.5 Pricing by Product and Market Segment
- 6.6 Geographic Pricing Differences
- 6.7 Key Input, Energy, Labor and Logistics Costs
- 6.8 Contract Pricing and Purchasing Models
- 6.9 Pricing Sensitivity and Competitive Positioning
- 6.10 Price, Margin and Profitability Implications
Chapter 7 Egypt Pharmaceutical Manufacturing Market Dynamics
- 7.1 Market Growth Drivers
- 7.1.1 Demand-Side Drivers
- 7.1.2 Technology and Innovation Drivers
- 7.1.3 Infrastructure and Investment Drivers
- 7.1.4 Regulatory and Policy Drivers
- 7.2 Market Restraints
- 7.2.1 Cost and Affordability Constraints
- 7.2.2 Technology and Adoption Barriers
- 7.2.3 Supply Chain and Operational Constraints
- 7.3 Market Challenges
- 7.3.1 Competitive Pressure and Margin Erosion
- 7.3.2 Skills, Infrastructure and Implementation Gaps
- 7.4 Emerging Market Opportunities
- 7.5 Market Dynamics Impact and Time-Horizon Assessment
Chapter 8 Egypt Pharmaceutical Manufacturing Value Chain Analysis
- 8.1 Industry Value Chain Overview
- 8.2 Upstream Suppliers and Critical Inputs
- 8.3 Technology and Component Providers
- 8.4 Manufacturing or Service Delivery
- 8.5 Distribution, Channel Partners and Integrators
- 8.6 Downstream Applications and End Users
- 8.7 Value Addition and Profit Pools
- 8.8 Vertical Integration and Outsourcing
- 8.9 Supplier Concentration and Risk
- 8.10 Supply Chain Localization and Resilience
Chapter 9 Egypt Pharmaceutical Manufacturing Market Regulations and Policies
- 9.1 Relevant Laws, Standards and Compliance Frameworks
- 9.2 Product, Service, Safety and Quality Requirements
- 9.3 Government Policies, Incentives and Subsidies
- 9.4 Imports, Exports and Trade Barriers
- 9.5 Public Procurement and Local Content Requirements
- 9.6 Environmental and Sustainability Compliance
- 9.7 Upcoming Policy Changes and Market Implications
Chapter 10 Egypt Pharmaceutical Manufacturing Market Hotspots and Opportunities
- 10.1 Market Opportunity Mapping and Growth Hotspots
- 10.2 High-Growth Applications and Customer Groups
- 10.3 Underserved Markets and White-Space Opportunities
- 10.4 Emerging Technology and Product Opportunities
- 10.5 New Capacity and Investment Hotspots
- 10.6 Market Entry and Expansion Opportunities
- 10.7 Distribution and Partnership Opportunities
- 10.8 Near-Term and Long-Term Commercial Potential
- 10.9 Opportunity Attractiveness and Execution Risks
Chapter 11 Egypt Pharmaceutical Manufacturing Market Outlook, 2025-2035
- 11.1 Market Size and Analysis
- 11.1.1 Revenue (Market Measurement: 2025: USD 4.99 billion → 2035: USD 10.76 billion)
- 11.1.2 Market Volume and Quantity Sold
- 11.1.3 Historical Market Size, 2018-2025
- 11.1.4 Base-Year Market Size, 2025
- 11.2 Market Forecast, 2025-2035
- 11.2.1 Revenue Forecast to 2035
- 11.2.2 Volume Forecast to 2035
- 11.2.3 CAGR and Year-on-Year Growth
- 11.2.4 Incremental Revenue Opportunity
- 11.3 Forecast Assumptions and Scenario Analysis
- 11.3.1 Base-Case Forecast
- 11.3.2 Optimistic and Conservative Scenarios
- 11.3.3 Technology, Pricing and Policy Sensitivities
- 11.4 Market Attractiveness and Growth Outlook
Chapter 12 Egypt Pharmaceutical Manufacturing Market Segmentation and Outlook
- 12.1 Segmentation Summary and Market Shares, 2025
- 12.2 Largest and Fastest-Growing Segments
- 12.3 By Product Type - Market Size and Forecast, 2025-2035
- 12.3.1 Segment Definition and Scope
- 12.3.2 Historical Market Size, 2018-2025
- 12.3.3 Revenue Forecast, 2025-2035
- 12.3.4 Volume Forecast, 2025-2035
- 12.3.5 Base-Year Market Share, 2025
- 12.3.6 Segment CAGR and Growth Drivers
- 12.3.7 Subsegment Market Size and Forecast
- 12.3.7.1 Generic Pharmaceuticals
- 12.3.7.2 Originator and Licensed Brands
- 12.3.7.3 Biologics and Biosimilars
- 12.3.7.4 OTC and Consumer Health Pharmaceuticals
- 12.3.8 Subsegment Pricing and Adoption Trends
- 12.3.9 Leading Suppliers and Competition
- 12.3.10 Regional Demand and Opportunities
- 12.4 By Dosage Form - Market Size and Forecast, 2025-2035
- 12.4.1 Segment Definition and Scope
- 12.4.2 Historical Market Size, 2018-2025
- 12.4.3 Revenue Forecast, 2025-2035
- 12.4.4 Volume Forecast, 2025-2035
- 12.4.5 Base-Year Market Share, 2025
- 12.4.6 Segment CAGR and Growth Drivers
- 12.4.7 Subsegment Market Size and Forecast
- 12.4.7.1 Solid Oral Dosage
- 12.4.7.2 Parenteral Products
- 12.4.7.3 Liquid Oral Products
- 12.4.7.4 Topical and Inhalation Products
- 12.4.8 Subsegment Pricing and Adoption Trends
- 12.4.9 Leading Suppliers and Competition
- 12.4.10 Regional Demand and Opportunities
- 12.5 By Therapeutic Area - Market Size and Forecast, 2025-2035
- 12.5.1 Segment Definition and Scope
- 12.5.2 Historical Market Size, 2018-2025
- 12.5.3 Revenue Forecast, 2025-2035
- 12.5.4 Volume Forecast, 2025-2035
- 12.5.5 Base-Year Market Share, 2025
- 12.5.6 Segment CAGR and Growth Drivers
- 12.5.7 Subsegment Market Size and Forecast
- 12.5.7.1 Cardiometabolic
- 12.5.7.2 Anti-Infectives
- 12.5.7.3 CNS and Respiratory
- 12.5.7.4 Oncology and Hematology
- 12.5.8 Subsegment Pricing and Adoption Trends
- 12.5.9 Leading Suppliers and Competition
- 12.5.10 Regional Demand and Opportunities
- 12.6 By Customer Type - Market Size and Forecast, 2025-2035
- 12.6.1 Segment Definition and Scope
- 12.6.2 Historical Market Size, 2018-2025
- 12.6.3 Revenue Forecast, 2025-2035
- 12.6.4 Volume Forecast, 2025-2035
- 12.6.5 Base-Year Market Share, 2025
- 12.6.6 Segment CAGR and Growth Drivers
- 12.6.7 Subsegment Market Size and Forecast
- 12.6.7.1 Retail Pharmacy Supply
- 12.6.7.2 Government Procurement Agencies
- 12.6.7.3 Private Hospitals and Clinics
- 12.6.7.4 Export Buyers
- 12.6.8 Subsegment Pricing and Adoption Trends
- 12.6.9 Leading Suppliers and Competition
- 12.6.10 Regional Demand and Opportunities
- 12.7 Segment Growth Comparison
- 12.8 Segment Attractiveness and Priority Matrix
Chapter 13 Egypt Pharmaceutical Manufacturing End-Use and Application Market Outlook
- 13.1 End-Use Industry and Customer Demand Structure
- 13.2 Leading Applications and Customer Groups
- 13.3 End-Use Market Size, Share and Forecast
- 13.4 Major End-Use Industry Deep Dives
- 13.4.1 Customer Requirements and Use Cases
- 13.4.2 Demand and Replacement Cycles
- 13.4.3 Technical and Regulatory Considerations
- 13.4.4 Purchasing and Procurement Models
- 13.4.5 Leading Vendors and Distribution Channels
- 13.4.6 Forecast and Commercial Opportunities
- 13.5 Emerging Applications and Cross-Segment Demand
- 13.6 End-Use Industry Investment Priorities
Chapter 14 Egypt Pharmaceutical Manufacturing Geographic Market Outlook, 2025-2035
- 14.1 Domestic Market Distribution and Demand Clusters
- 14.2 State- or Province-Wise Market Size and Forecast, 2025-2035
- 14.3 City and Metropolitan Market Outlook
- 14.4 Industrial, Manufacturing and Commercial Clusters
- 14.5 Geographic Concentration of Key End Users
- 14.6 Local Pricing and Purchasing Differences
- 14.7 Domestic Production Facilities and Capacity Map
- 14.8 Local Infrastructure and Project Pipeline
- 14.9 State-Level Policy and Incentive Differences
- 14.10 Subnational Investment Hotspots and Opportunities
- 14.11 Distribution and Logistics Networks
- 14.12 Domestic Competitive Footprint
Chapter 15 Egypt Pharmaceutical Manufacturing Technology, Innovation and Sustainability Outlook
- 15.1 Technology Landscape and Maturity
- 15.2 Product, Process and Service Innovation
- 15.3 AI, Automation and Digital Tools in the Industry
- 15.4 Technology Adoption and Performance Benchmarking
- 15.5 Innovation Pipeline and R&D Investment
- 15.6 Patent and Intellectual Property Trends
- 15.7 Energy Efficiency and Resource Management
- 15.8 Sustainability, Recycling and Circularity
- 15.9 Technology Roadmap, 2025-2035
- 15.10 Risks of Obsolescence and Technology Substitution
Chapter 16 Egypt Pharmaceutical Manufacturing Market Key Strategic Imperatives
- 16.1 Growth and Market Entry Priorities
- 16.2 High-Return Products and Segments
- 16.3 Pricing, Profitability and Cost Optimization
- 16.4 Technology Investment and Product Differentiation
- 16.5 Supply Chain Localization and Resilience
- 16.6 Distribution and Customer Acquisition
- 16.7 Partnership, Acquisition and Capacity Strategy
- 16.8 Regional Expansion Priorities
- 16.9 Short-, Medium- and Long-Term Actions
Chapter 17 Competition Outlook
- 17.1 Industry Competition Characteristics
- 17.2 Market Structure and Concentration
- 17.3 Market Share and Competitive Positioning, 2025
- 17.4 Company-Wise Revenue and Product Benchmarking
- 17.5 Production and Service Capacity Benchmarking
- 17.6 Technology, Pricing and Differentiation
- 17.7 Regional Footprint and Distribution Strength
- 17.8 Mergers, Acquisitions and Strategic Alliances
- 17.9 New Entrants and Competitive Threats
- 17.10 Porter's Five Forces and Industry Attractiveness
- 17.11 Competitive Outlook, 2025-2035
Chapter 18 Company Profiles
- 18.1 Company Coverage and Selection Criteria
- 18.2 EVA Pharma
- 18.2.1 Business Description
- 18.2.2 Company Ownership and Geographic Presence
- 18.2.3 Product and Service Portfolio
- 18.2.4 Manufacturing and Operating Footprint
- 18.2.5 Production Capacity and Expansion Plans
- 18.2.6 Financial Performance and Investment
- 18.2.7 Market Share and Competitive Position
- 18.2.8 Technology and Innovation Capabilities
- 18.2.9 Strategic Alliances or Partnerships
- 18.2.10 Recent Developments
- 18.2.11 Growth Strategy and Outlook
- 18.3 Pharco Pharmaceuticals
- 18.4 Amoun Pharmaceutical Company
- 18.5 EIPICO
- 18.6 Rameda
- 18.7 SEDICO
- 18.8 APEX Pharma
- 18.9 Minapharm Pharmaceuticals
- 18.10 Global Napi Pharmaceuticals
- 18.11 Marcyrl Pharmaceutical Industries
- 18.12 Sanofi (Sanofi Egypt)
- 18.13 Other Relevant Market Participants
Note: Every listed company is profiled on the structure shown under the first company. The company list is preliminary and may change based on research findings, market developments, data availability and client requirements.
Chapter 19 Disclaimer
- 19.1 Research and Forecast Disclaimer
- 19.2 Data Source and Estimation Limitations
Note: The depth of individual sections depends on data availability for this market. Volume, capacity, trade and other unit-based metrics are included where applicable.