Tourism and clinic growth lift chair and imaging spending
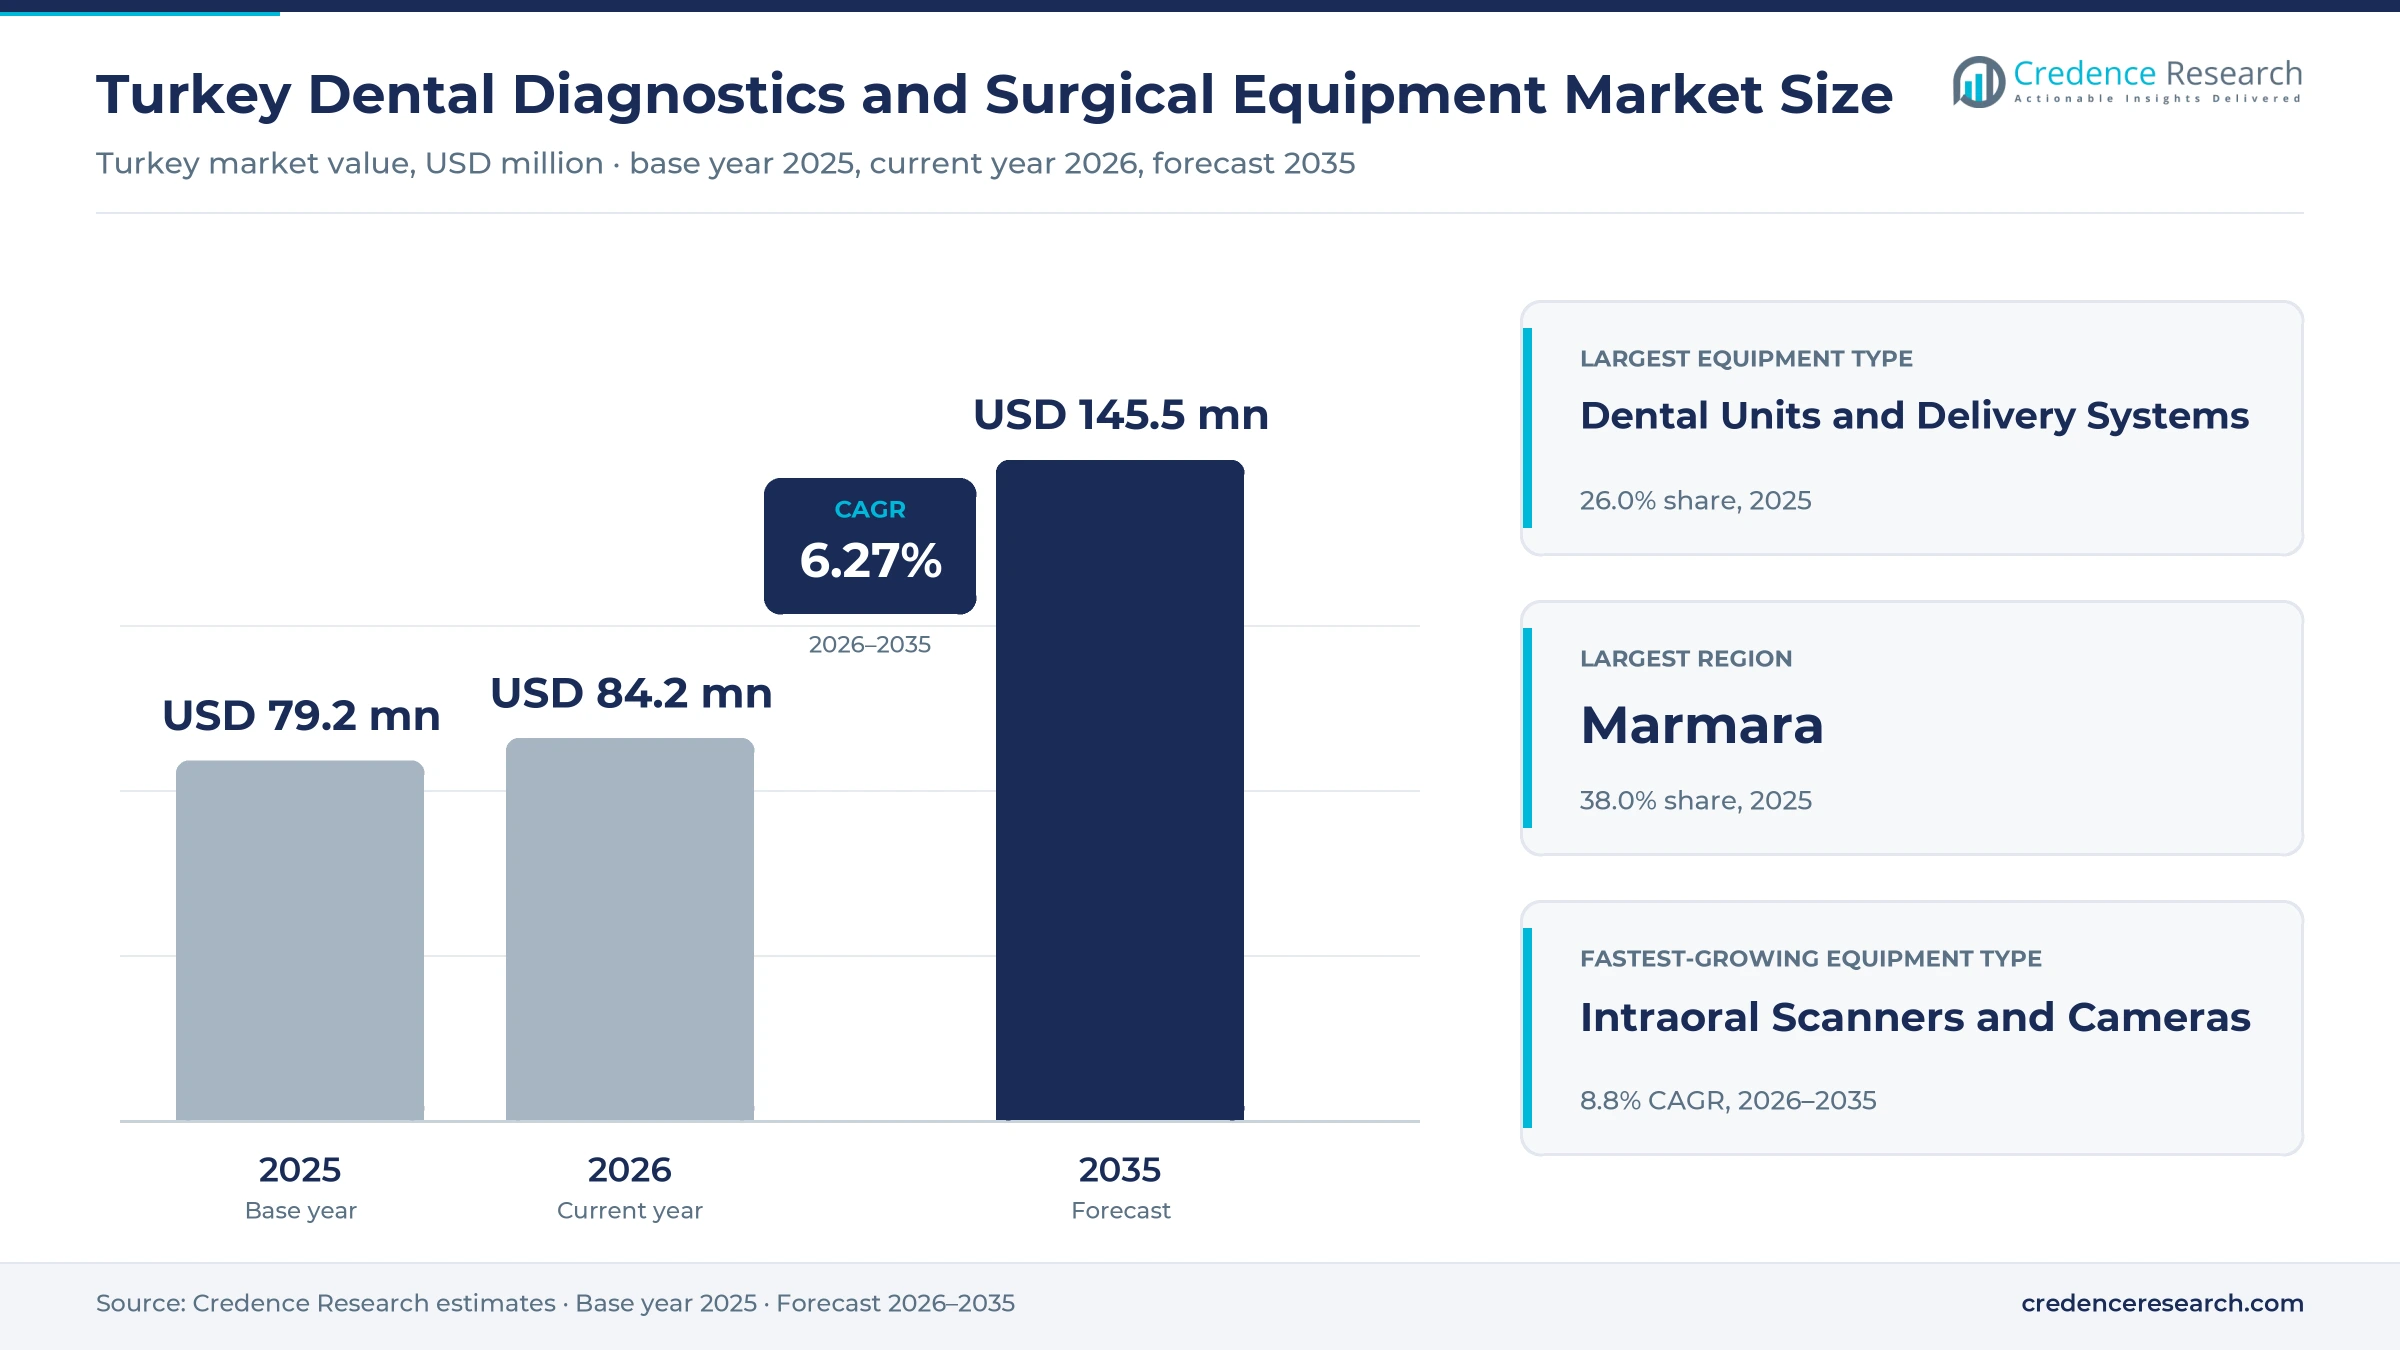
The Turkey dental diagnostics and surgical equipment market was valued at USD 79.2 million in 2025 and is projected to increase from USD 84.2 million in 2026 to USD 145.5 million by 2035, registering a CAGR of 6.27% during 2026–2035. Demand comes from private dental polyclinics, solo practices, Ministry of Health oral and dental health centers and university faculty hospitals that buy treatment units, imaging systems, scanners, milling units and sterilization lines, most of them imported. Marmara held the largest regional share, 38.0% in 2025, because Istanbul concentrates private polyclinics, tourism-focused clinics and the local offices of the main brands. The Mediterranean is the fastest-growing region at 7.2% a year, as Antalya clinics treat a rising number of foreign patients. On the regulatory side, a March 2024 amendment brought cone-beam computed tomography into the definition of a dental radiology unit and required every device to be registered in the national product tracking system, which favors suppliers with documented, traceable equipment.
Chairs, imaging and surgical devices bought by Turkish clinics
The estimate covers sales in Turkey of diagnostic equipment, meaning intraoral X-ray units, panoramic, cephalometric and cone-beam units, and intraoral scanners and cameras, together with CAD/CAM milling units and 3D printers. It also covers surgical and treatment equipment, including dental units and delivery systems, handpieces, lasers, implant, piezo and electrosurgery units, surgical hand instruments and sterilization equipment. Each item is counted once, at the price the clinic or hospital pays, including the dealer margin and installation.
Consumables, dental implants and orthodontic products are excluded, and so are Turkish-made devices shipped abroad. The value chain runs from manufacturers in Europe, East Asia and the United States, plus a small group of Turkish makers, through brand offices and dealers in Istanbul, Ankara and Izmir to private polyclinics, solo dentists, Ministry of Health centers and university hospitals that install and use the equipment.
Turkey Dental Diagnostics and Surgical Equipment Market Insights
- The Turkey dental diagnostics and surgical equipment market was valued at USD 79.2 million in 2025 and is projected to reach USD 145.5 million by 2035, registering a CAGR of 6.27% during 2026–2035.
- Marmara held 38.0% of 2025 value, because Istanbul alone had 12,276 dentists in 2024 and the densest network of private polyclinics and tourism clinics.
- Dental units and delivery systems led equipment types with 26.0% of 2025 value, because Turkish institutions ran 43,499 dental units in 2024 that need periodic replacement.
- A March 5, 2024, amendment added cone-beam CT to the definition of a dental radiology unit and made registration of every device in the national tracking system mandatory.
- Dentsply Sirona, Envista and Planmeca sell through Istanbul offices or Turkish dealers, while Grup Dental in Ankara and Ersoy Dental in Samsun supply locally made units and instruments.
Treatment units lead as scanners and CAD/CAM grow fastest
Why do treatment units outweigh imaging in clinic budgets?
Based on product category, the market is categorized into diagnostic equipment, surgical and treatment equipment, and CAD/CAM equipment. Surgical and Treatment Equipment led with 56.0% of 2025 value, because every operatory needs a chair, a delivery system, handpieces and sterilization, and the 5,020 private polyclinics alone ran 21,326 units in 2024, according to the Ministry of Health yearbook. CAD/CAM Equipment grows fastest at 8.1% a year, as clinics that serve part of the 1.5 million health tourists recorded in 2024 make crowns and surgical guides on site to shorten each stay.
Which devices take the largest and fastest-growing slices?
Based on equipment type, the market is categorized into intraoral X-ray units, panoramic, cephalometric and CBCT units, intraoral scanners and cameras, CAD/CAM milling and 3D printers, dental units and delivery systems, handpieces, dental lasers, implant, piezo and electrosurgery units, surgical hand instruments and sterilization equipment. Dental Units and Delivery Systems led with 26.0% of 2025 value, because Turkish institutions ran 43,499 dental units in 2024 that are replaced on long but steady cycles. Intraoral Scanners and Cameras grow fastest at 8.8% a year, as Dentsply Sirona launched Primescan 2 on Sept. 5, 2024, and moved scanning onto a cloud platform.
How do private polyclinics and faculties split purchases?
Based on end user, the market is categorized into private polyclinics and centers, solo practices, public MoH facilities and university faculties. Private Polyclinics and Centers led with 48.0% of 2025 value, because the private sector employed 29,347 of the country's 52,994 dentists in 2025, according to Ministry of Health figures, and polyclinics buy imaging and digital systems that solo practices often share or outsource. University Faculties grow fastest at 7.1% a year, as faculties add teaching hospitals such as the 183-unit Fırat University hospital opened in Elazığ in March 2026.
Why do dealers still carry most equipment sales?
Based on distribution channel, the market is categorized into direct sales, dealers and distributors, and public tenders. Dealers and Distributors led with 52.0% of 2025 value, because many brands reach clinics through Turkish partners, and Planmeca named Ünaldı Medikal as its Turkish equipment distributor when its Plandent division opened a Turkish supply company in August 2013. Direct Sales grow fastest at 7.3% a year, as Dentsply Sirona sells from its office in Ataşehir, Istanbul and Envista staffs sales teams in Istanbul and Izmir, which lets both brands bundle software, training and financing directly.
| Segment Group | Leading Sub-segment | Share, 2025 | Fastest-growing Sub-segment | CAGR, 2026–2035 |
|---|---|---|---|---|
| By Product Category | Surgical and Treatment Equipment | 56.0% | CAD/CAM Equipment | 8.1% |
| By Equipment Type | Dental Units and Delivery Systems | 26.0% | Intraoral Scanners and Cameras | 8.8% |
| By End User | Private Polyclinics and Centers | 48.0% | University Faculties | 7.1% |
| By Distribution Channel | Dealers and Distributors | 52.0% | Direct Sales | 7.3% |
Import costs and the lira set chair and imaging prices
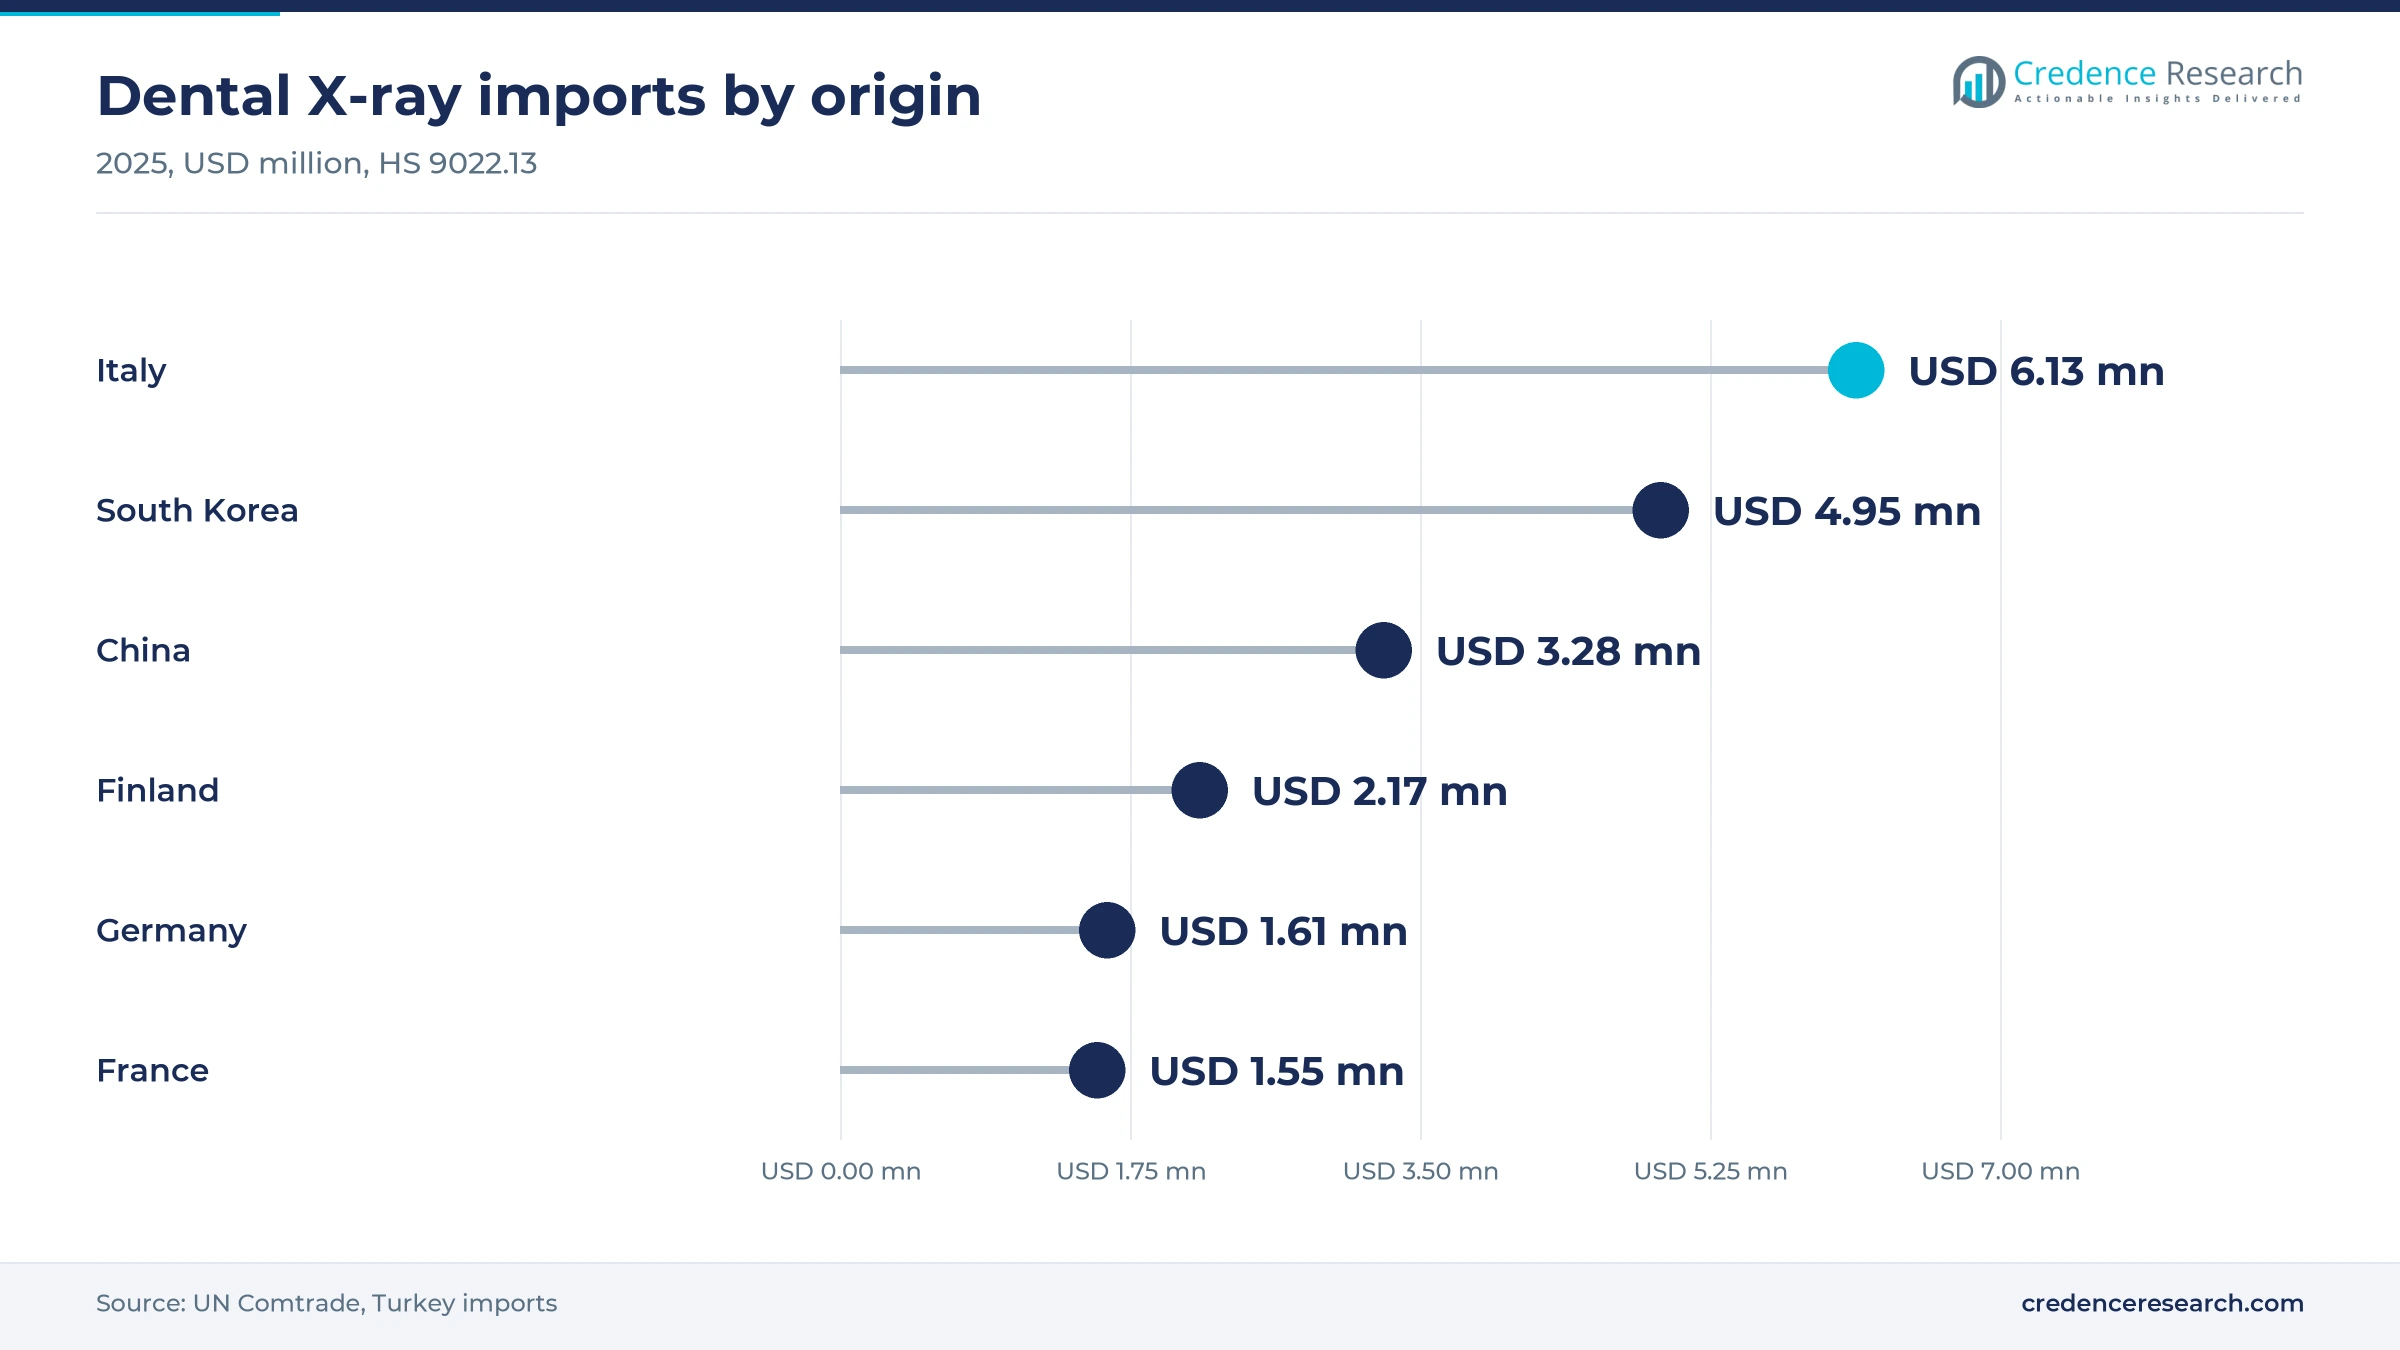
Prices in Turkey start from import costs, because most imaging units, scanners and premium chairs arrive from Europe and East Asia. Average customs values for dental X-ray units ranged from about USD 600 for Chinese units, mostly small intraoral devices, to about USD 21,700 for Finnish systems in 2025. Dealers then add freight, registration, installation, service and their margin before the clinic price is set in lira. Because the lira lost more than half its dollar value between 2022 and 2025, list prices change often, and clinics favor installment plans, Turkish-made chairs and mid-priced Asian imaging.
| Origin of imported dental X-ray units | Typical price or fee | Basis |
|---|---|---|
| Finland | About USD 21,700 per unit | Credence Research calculation from UN Comtrade, HS 9022.13, 2025 |
| Germany | About USD 12,500 per unit | Credence Research calculation from UN Comtrade, HS 9022.13, 2025 |
| Italy | About USD 10,800 per unit | Credence Research calculation from UN Comtrade, HS 9022.13, 2025 |
| South Korea | About USD 10,100 per unit | Credence Research calculation from UN Comtrade, HS 9022.13, 2025 |
| China | About USD 600 per unit | Credence Research calculation from UN Comtrade, HS 9022.13, 2025 |
Request a Free Sample
Fill in your details and we'll send you a free sample report.
- Sample data tables & charts
- Research methodology
Clinic capacity, tourism and new rules drive orders
Why does a large clinic base keep chair orders steady?
Every new or refitted operatory needs a complete treatment set, so a large and still growing clinic base keeps orders for chairs, delivery systems and handpieces steady. Turkey reached 62 dentists per 100,000 residents in 2025, according to Ministry of Health yearbook figures reported by Hürriyet Daily News. The ministry counted 6,496 institutions with 43,499 dental units in 2024, and dentists recorded 62.6 million patient visits in the same year. Heavy use wears out chairs, turbines and suction systems faster in busy urban clinics, so replacement rather than first-time purchase sets the floor of annual demand. This installed base is why dental units and delivery systems hold 26.0% of 2025 value.
How does health tourism push clinics toward 3D imaging?
Foreign patients expect implant planning and restorations within a short stay, which pushes private clinics toward 3D imaging and digital workflows. Turkey earned USD 3.0 billion from health services exports in 2024 with 1.5 million health tourists, and that revenue rose fourfold between 2012 and 2024, according to the Ministry of Trade. Istanbul's provincial health director said in January 2025 that the city delivered more than 1 million health tourism services in 2024 and counted 4,460 facilities offering oral and dental care, Anadolu Agency reported. Many of these clinics compete in medical tourism on speed and price, so they buy cone-beam units, scanners and milling machines earlier than resident demand alone would justify.
How does the 2024 clinic rule lift imaging and traceability?
The 2024 amendment to the private dental clinic rules lifts demand for imaging and for documented equipment at the same time. Published in the Official Gazette on March 5, 2024, it defines a dental radiology unit as one that holds a dental cone-beam computed tomography device in addition to standard dental radiology. The same text requires every medical device and consumable used in a private dental facility to be registered in the ministry's Product Tracking System, with unit-level notifications. Clinics that want to offer 3D diagnosis therefore install cone-beam CT scanners in a dedicated, licensed room. Registered products from established suppliers gain an edge, while unregistered gray-market units become harder to install and service across the 6,496 dental institutions.
Why do new faculty hospitals add large public orders?
New dental faculties and their teaching hospitals add some of the largest single orders in the country, because each one equips dozens of treatment units, imaging rooms and sterilization lines at once. Turkey had 105 dental faculties in 2024, 75 public and 30 private, with an annual intake of 12,920 students, according to the Council of European Dentists country profile published in February 2026. University dental training hospitals already ran 8,602 units across 84 sites in 2024, the Ministry of Health yearbook shows. Every new cohort needs clinical chairs, simulation labs and digital imaging for training. This pipeline is why university faculties grow fastest among end users at 7.1% a year to 2035.
Digital impressions and Asian supply reshape purchasing
Shift from impression trays to cloud-connected scanners
Dental practices in Turkey are shifting from impression trays to intraoral scanners linked to cloud software, which changes what a typical clinic fit-out includes. Dentsply Sirona launched Primescan 2 on Sept. 5, 2024, as a wireless scanner that sends data straight to its DS Core cloud platform without a dedicated computer. IDEX Istanbul, held May 7–10, 2025, at the Istanbul Expo Center, drew 98,595 professionals from more than 135 countries, according to the organizer, which gives brands a large showroom for intraoral scanners and chairside systems. The fair returned on April 15–18, 2026, at the same venue. As a result, intraoral scanners and cameras grow fastest among equipment types at 8.8% a year.
Rise of Chinese and Korean supply in imported equipment
Chinese and Korean suppliers are gaining weight in Turkey's equipment imports, while European brands keep the premium end. China was the largest origin of dental instrument and imaging imports in 2025, followed by Germany, with Italy and South Korea next, according to UN Comtrade data, and the value of core dental imports rose by about 37% between 2021 and 2025. Dental X-ray imports alone were USD 21.2 million in 2025, almost unchanged from USD 21.1 million in 2021, even as clinic numbers grew. China shipped the most X-ray units at a low average value, while Italy and South Korea led by value. This mix pulls prices down in intraoral X-ray and pushes European suppliers toward 3D and integrated systems.
Opportunity for Turkish makers of chairs and instruments
Local manufacturing is an opening for suppliers that want shorter lead times and prices closer to lira budgets. Turkey's exports of chairs classified under HS 9402.10, which covers dental chairs, reached USD 7.4 million in 2025, far above imports, UN Comtrade data show, and exports across the core dental codes rose by about 43% from 2021. Grup Dental has made dental units in Ankara's İvedik Organized Industrial Zone for more than two decades, and Ersoy Dental produces surgical instruments in Samsun with a branch in Istanbul. MegaGen announced on Feb. 26, 2024, a USD 15 million first phase for an Istanbul plant, its first outside South Korea, Ekonomist reported. These makers can win price-sensitive solo practices and public tenders across the country.
Opportunity in chairside CAD/CAM for tourism clinics
Chairside CAD/CAM is the clearest growth opening, because tourism clinics sell short treatment windows that depend on making crowns and guides on site. Antalya welcomed a record 17.28 million visitors in 2024, Hürriyet Daily News reported, which gives Mediterranean clinics a large pool of potential dental patients. Istanbul alone delivered more than 1 million health tourism services in 2024, and health services exports quadrupled in value between 2012 and 2024, the Ministry of Trade reports. Clinics that can scan, design and mill in one visit convert more of these patients into implant and crown cases. That is why CAD/CAM equipment grows fastest among product categories at 8.1% a year to 2035.
The lira, tracking rules and tenders squeeze margins
Why does the weaker lira slow equipment upgrades?
The weaker lira is the main barrier to upgrades, because almost every imaging unit and most chairs are priced from dollar or euro import costs. The lira averaged 16.56 per U.S. dollar in 2022 and 39.49 in 2025, according to Federal Reserve Bank of St. Louis data, so a clinic paid about 2.4 times more lira for the same imported unit. Solo dentists feel this pressure most and often delay the replacement of chairs and imaging. Dealers respond with installment plans, refurbished units and local alternatives.
How do registration and tracking rules add cost?
Compliance is a growing barrier and cost for every supplier that sells into private clinics. Since the March 5, 2024, amendment, each device used in a private dental facility must be recorded in the Product Tracking System with unit-level notifications. Small importers and gray-market sellers struggle to document older or parallel-imported units, which narrows the low-price channel. Established brands and dealers absorb the work more easily, but they pass part of the cost to clinics through list prices and service fees.
Why do public tenders cap prices for ministry centers?
Ministry of Health facilities buy through formal bids that usually reward the lowest compliant offer, which puts steady price pressure on suppliers. The ministry ran 135 oral and dental health centers with 4,731 units in 2024, according to its yearbook, so each tender round covers many chairs at once. Winning bidders face thin margins together with long service and spare parts commitments. As a result, premium brands often leave basic chair tenders to lower-cost and Turkish-made suppliers that can meet the price limit.
Why do thinner networks in the east slow upgrades?
Dentists and service engineers are concentrated in the west, which slows equipment upgrades in eastern provinces. Istanbul had 78 dentists per 100,000 residents in 2024, well above the national ratio of 62 reported for 2025, according to Ministry of Health yearbook figures. Clinics far from the main dealer hubs wait longer for engineers and spare parts, so they keep older chairs and film-based X-ray units in use. Suppliers respond with regional dealers, remote diagnostics and training at faculty hospitals.
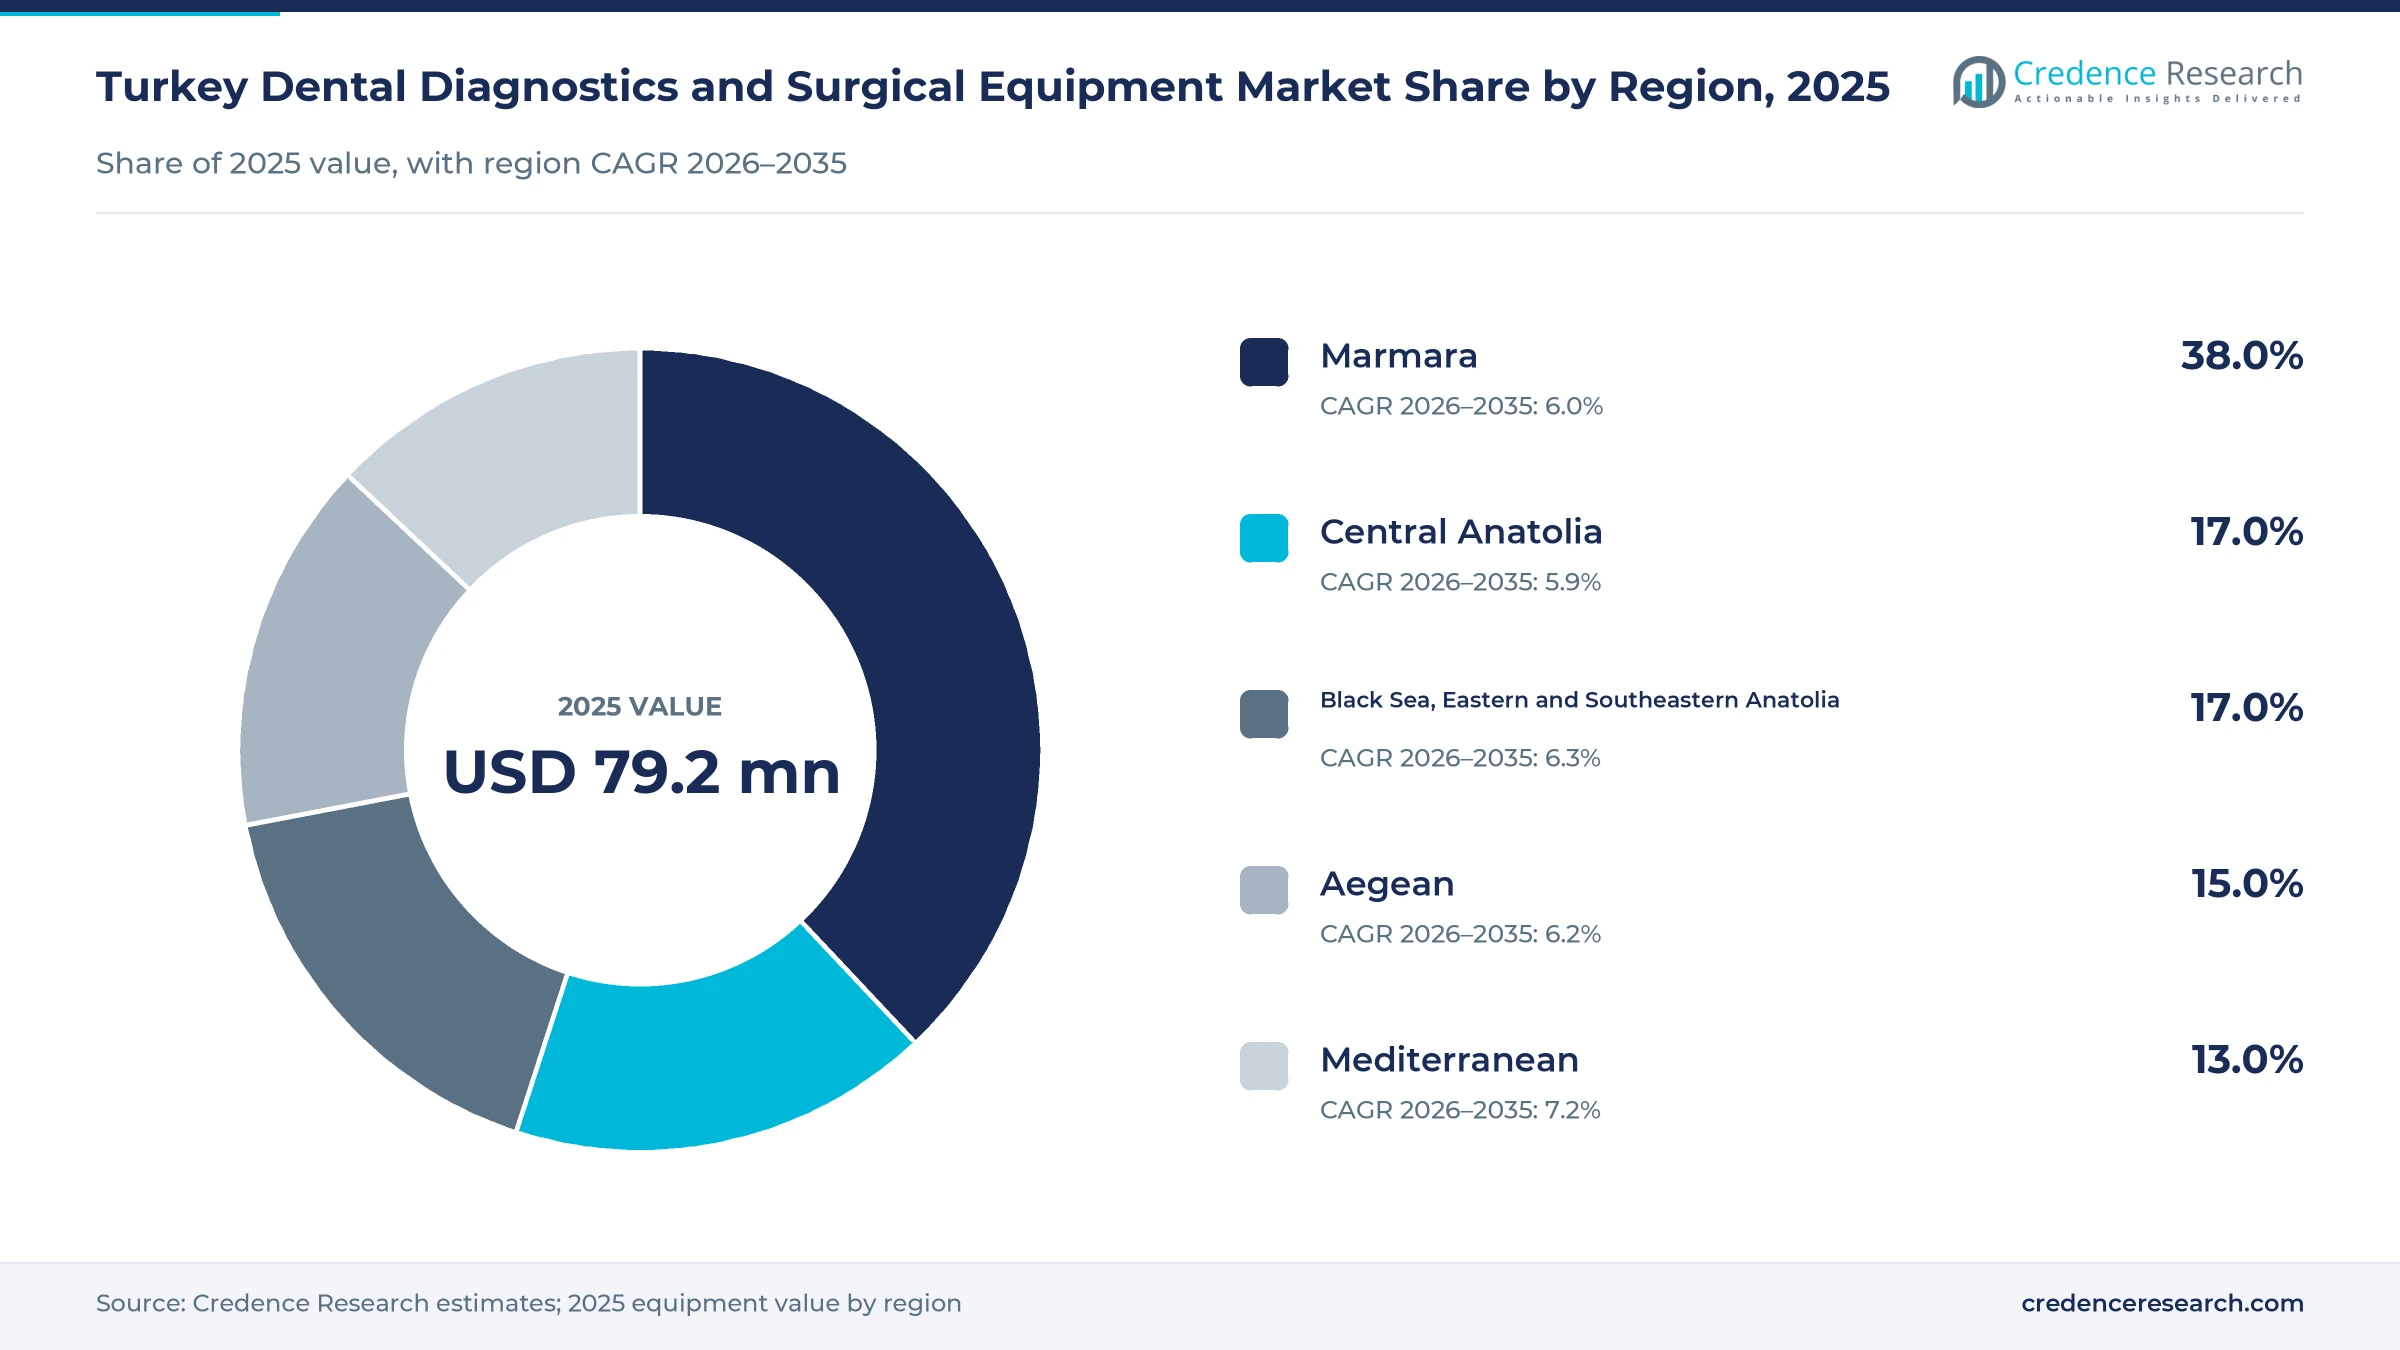
Marmara leads while the Mediterranean grows fastest
Regional shares follow Turkey's geographic regions, with the Black Sea, Eastern and Southeastern Anatolia combined into one zone. Shares and growth rates are Credence Research estimates based on dentists and dental units by province, weighted for private clinic and tourism intensity.
| Region | Value, 2025 (USD million) | Share, 2025 | CAGR, 2026–2035 |
|---|---|---|---|
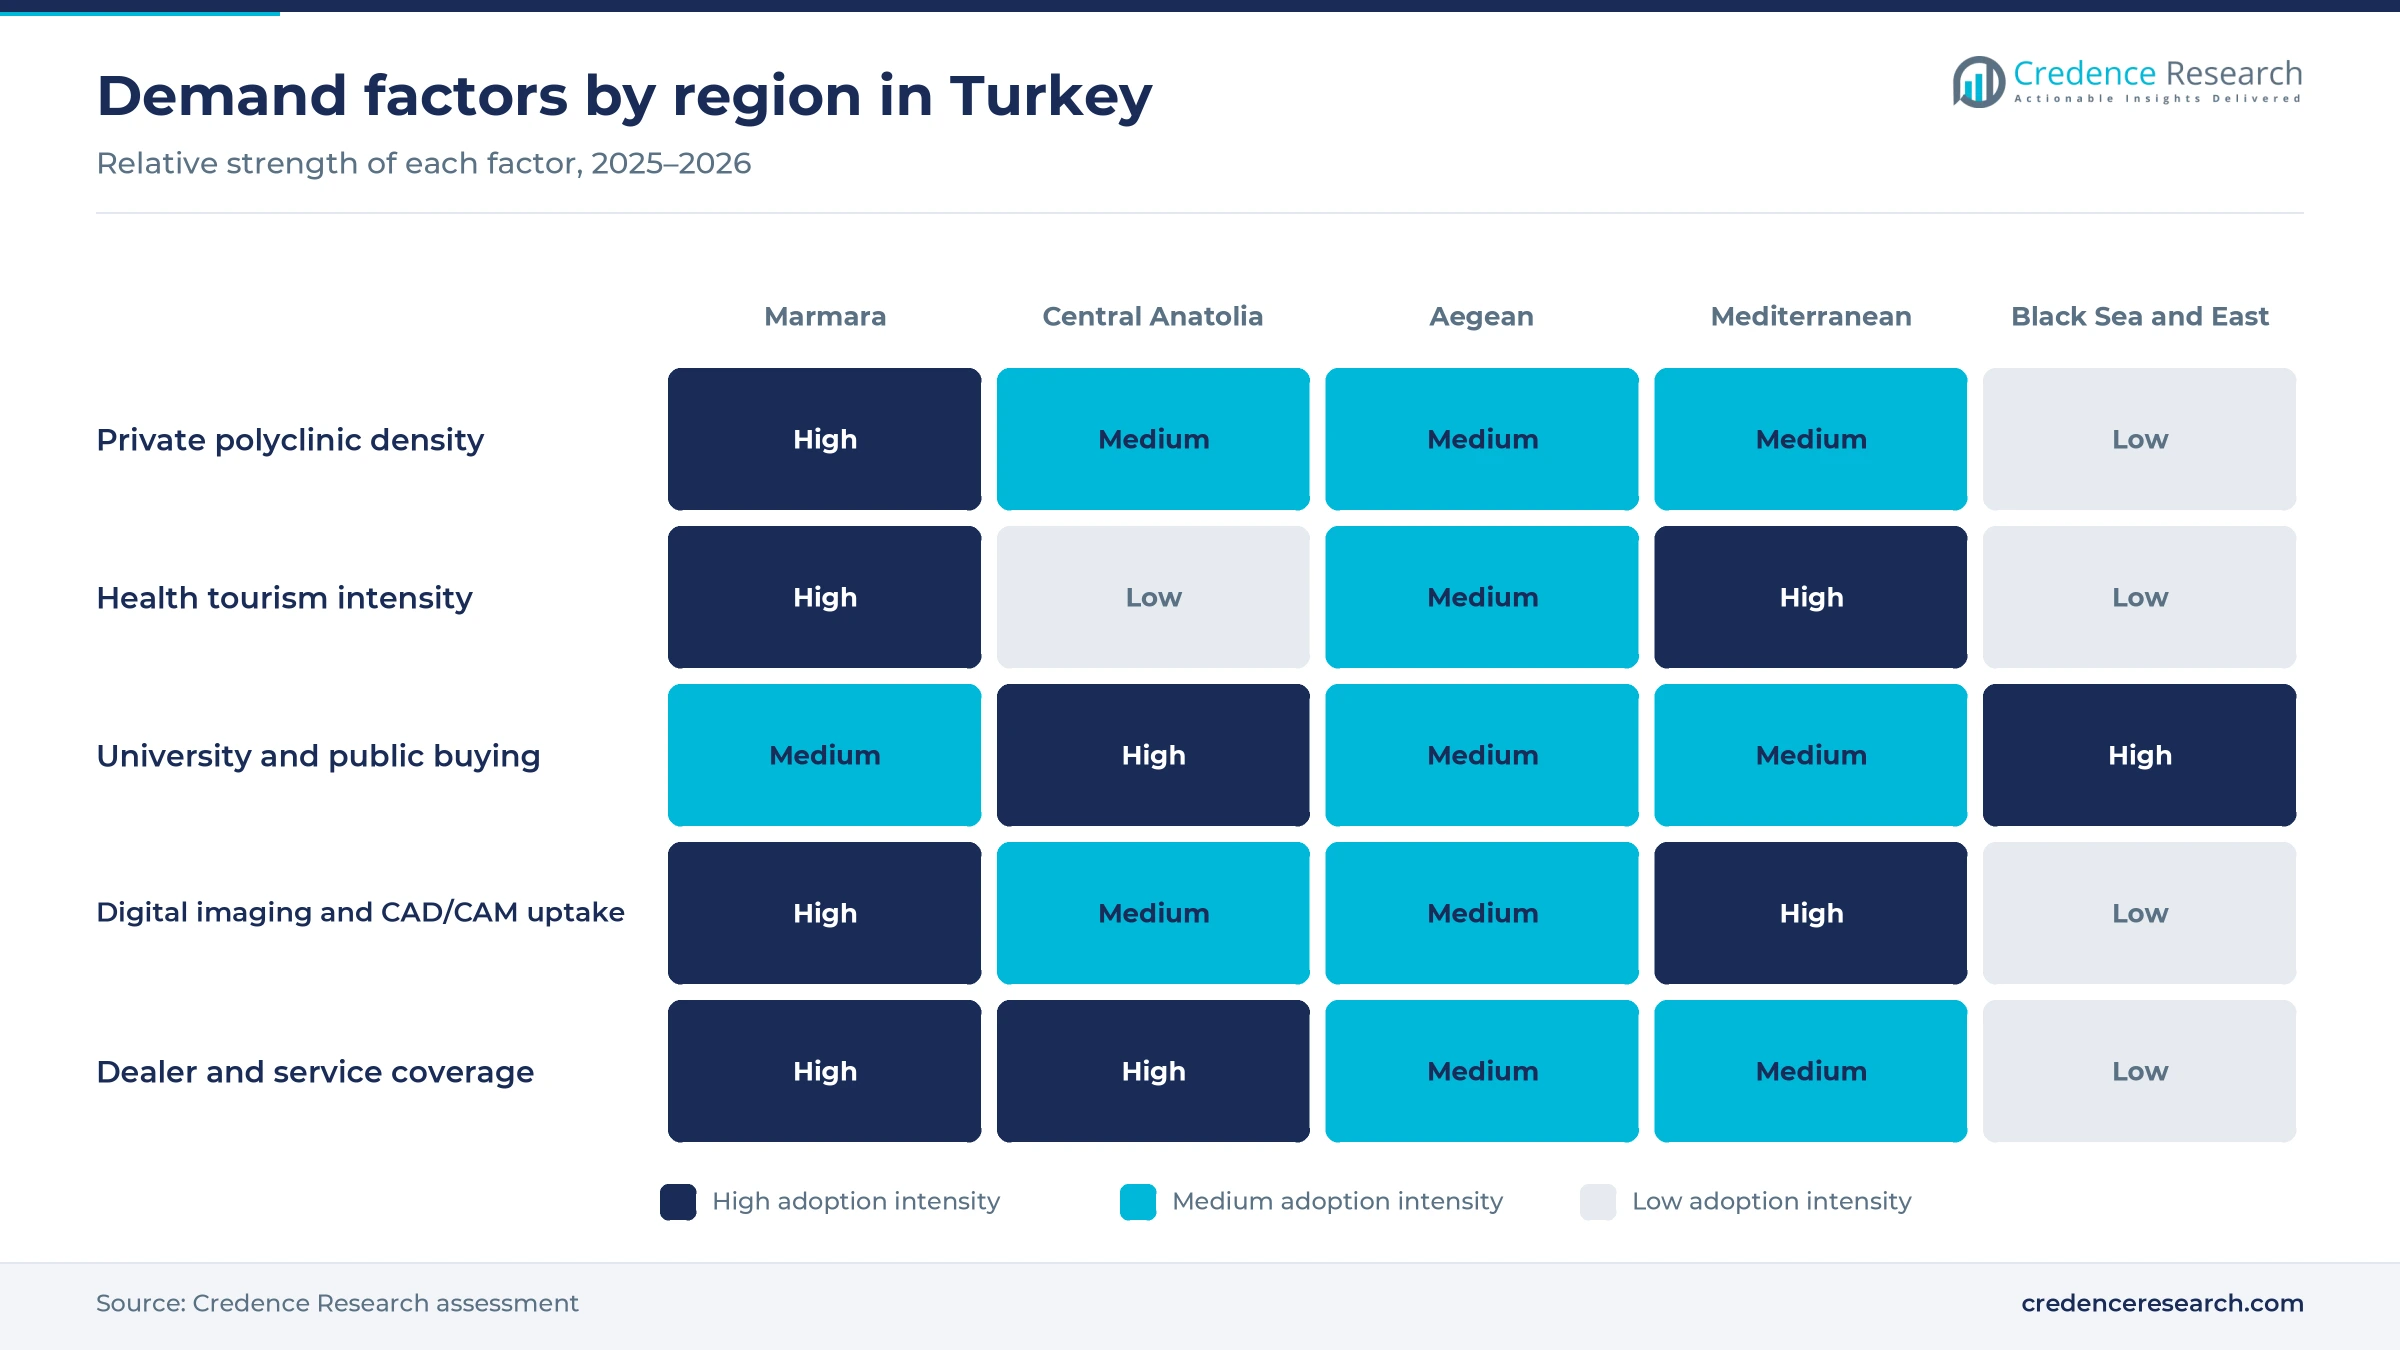
| Marmara | 30.1 | 38.0% | 6.0% |
| Central Anatolia | 13.5 | 17.0% | 5.9% |
| Black Sea, Eastern and Southeastern Anatolia | 13.5 | 17.0% | 6.3% |
| Aegean | 11.9 | 15.0% | 6.2% |
| Mediterranean | 10.3 | 13.0% | 7.2% |
Marmara leads on Istanbul polyclinics and tourism clinics
Marmara held 38.0% of 2025 value and grows at 6.0% a year, because it is home to Istanbul, the largest dental market in the country. The region had 18,030 dentists in 2024, about 36% of the national total, and Istanbul alone had 12,276, according to Ministry of Health yearbook figures. Istanbul also hosts the Turkish offices of the main multinational brands and the annual IDEX fair, while Bursa adds a second large clinic base. Growth is slightly slower than average because the installed base is already dense.
Central Anatolia draws on Ankara hospitals and makers
Central Anatolia held a 17.0% share of 2025 value and grows at 5.9% a year. Ankara anchors the zone with large university dental hospitals, ministry facilities and the public buyers that run national tenders. Grup Dental, founded in 2001, builds dental units and compressors in the city's İvedik Organized Industrial Zone and sells them across the country. Konya, Kayseri and Eskişehir add steady demand from faculty hospitals and private polyclinics, although tourism plays a smaller role here than on the coasts.
Aegean clinics serve residents and coastal visitors
The Aegean held a 15.0% share of 2025 value and grows at 6.2% a year, led by Izmir and the resort coast of Muğla and Aydın. Envista lists sales positions in Izmir alongside Istanbul, which shows how brands staff the zone directly rather than through dealers alone. Private clinics here serve both residents and foreign visitors, so they invest in panoramic and cone-beam units and in scanners. Denizli and Manisa add demand from solo practices and ministry centers that replace chairs on longer cycles.
The Mediterranean grows fastest on Antalya dental tourism
The Mediterranean held 13.0% of 2025 value and grows fastest at 7.2% a year, as Antalya clinics treat more foreign patients. Antalya welcomed a record 17.28 million visitors in 2024, which gives local dental clinics a large pool of potential tourism patients. Clinics in Antalya and Adana are adding cone-beam imaging, scanners and milling units to complete implant and crown work within one stay, so their purchases run ahead of resident population growth.
Black Sea and eastern zones rely on public and faculty buyers
The Black Sea, Eastern and Southeastern Anatolia zone held 17.0% of 2025 value and grows at 6.3% a year. Public ministry centers and university faculties buy a larger part of the equipment here than in the west, often through tenders. Ersoy Dental produces surgical hand instruments in Samsun, and new faculty hospitals in eastern provinces add large single orders. Gaziantep, Diyarbakır, Erzurum and Trabzon remain the main private clinic centers in the zone.
Rules, launches and hospital openings from 2024 to 2026
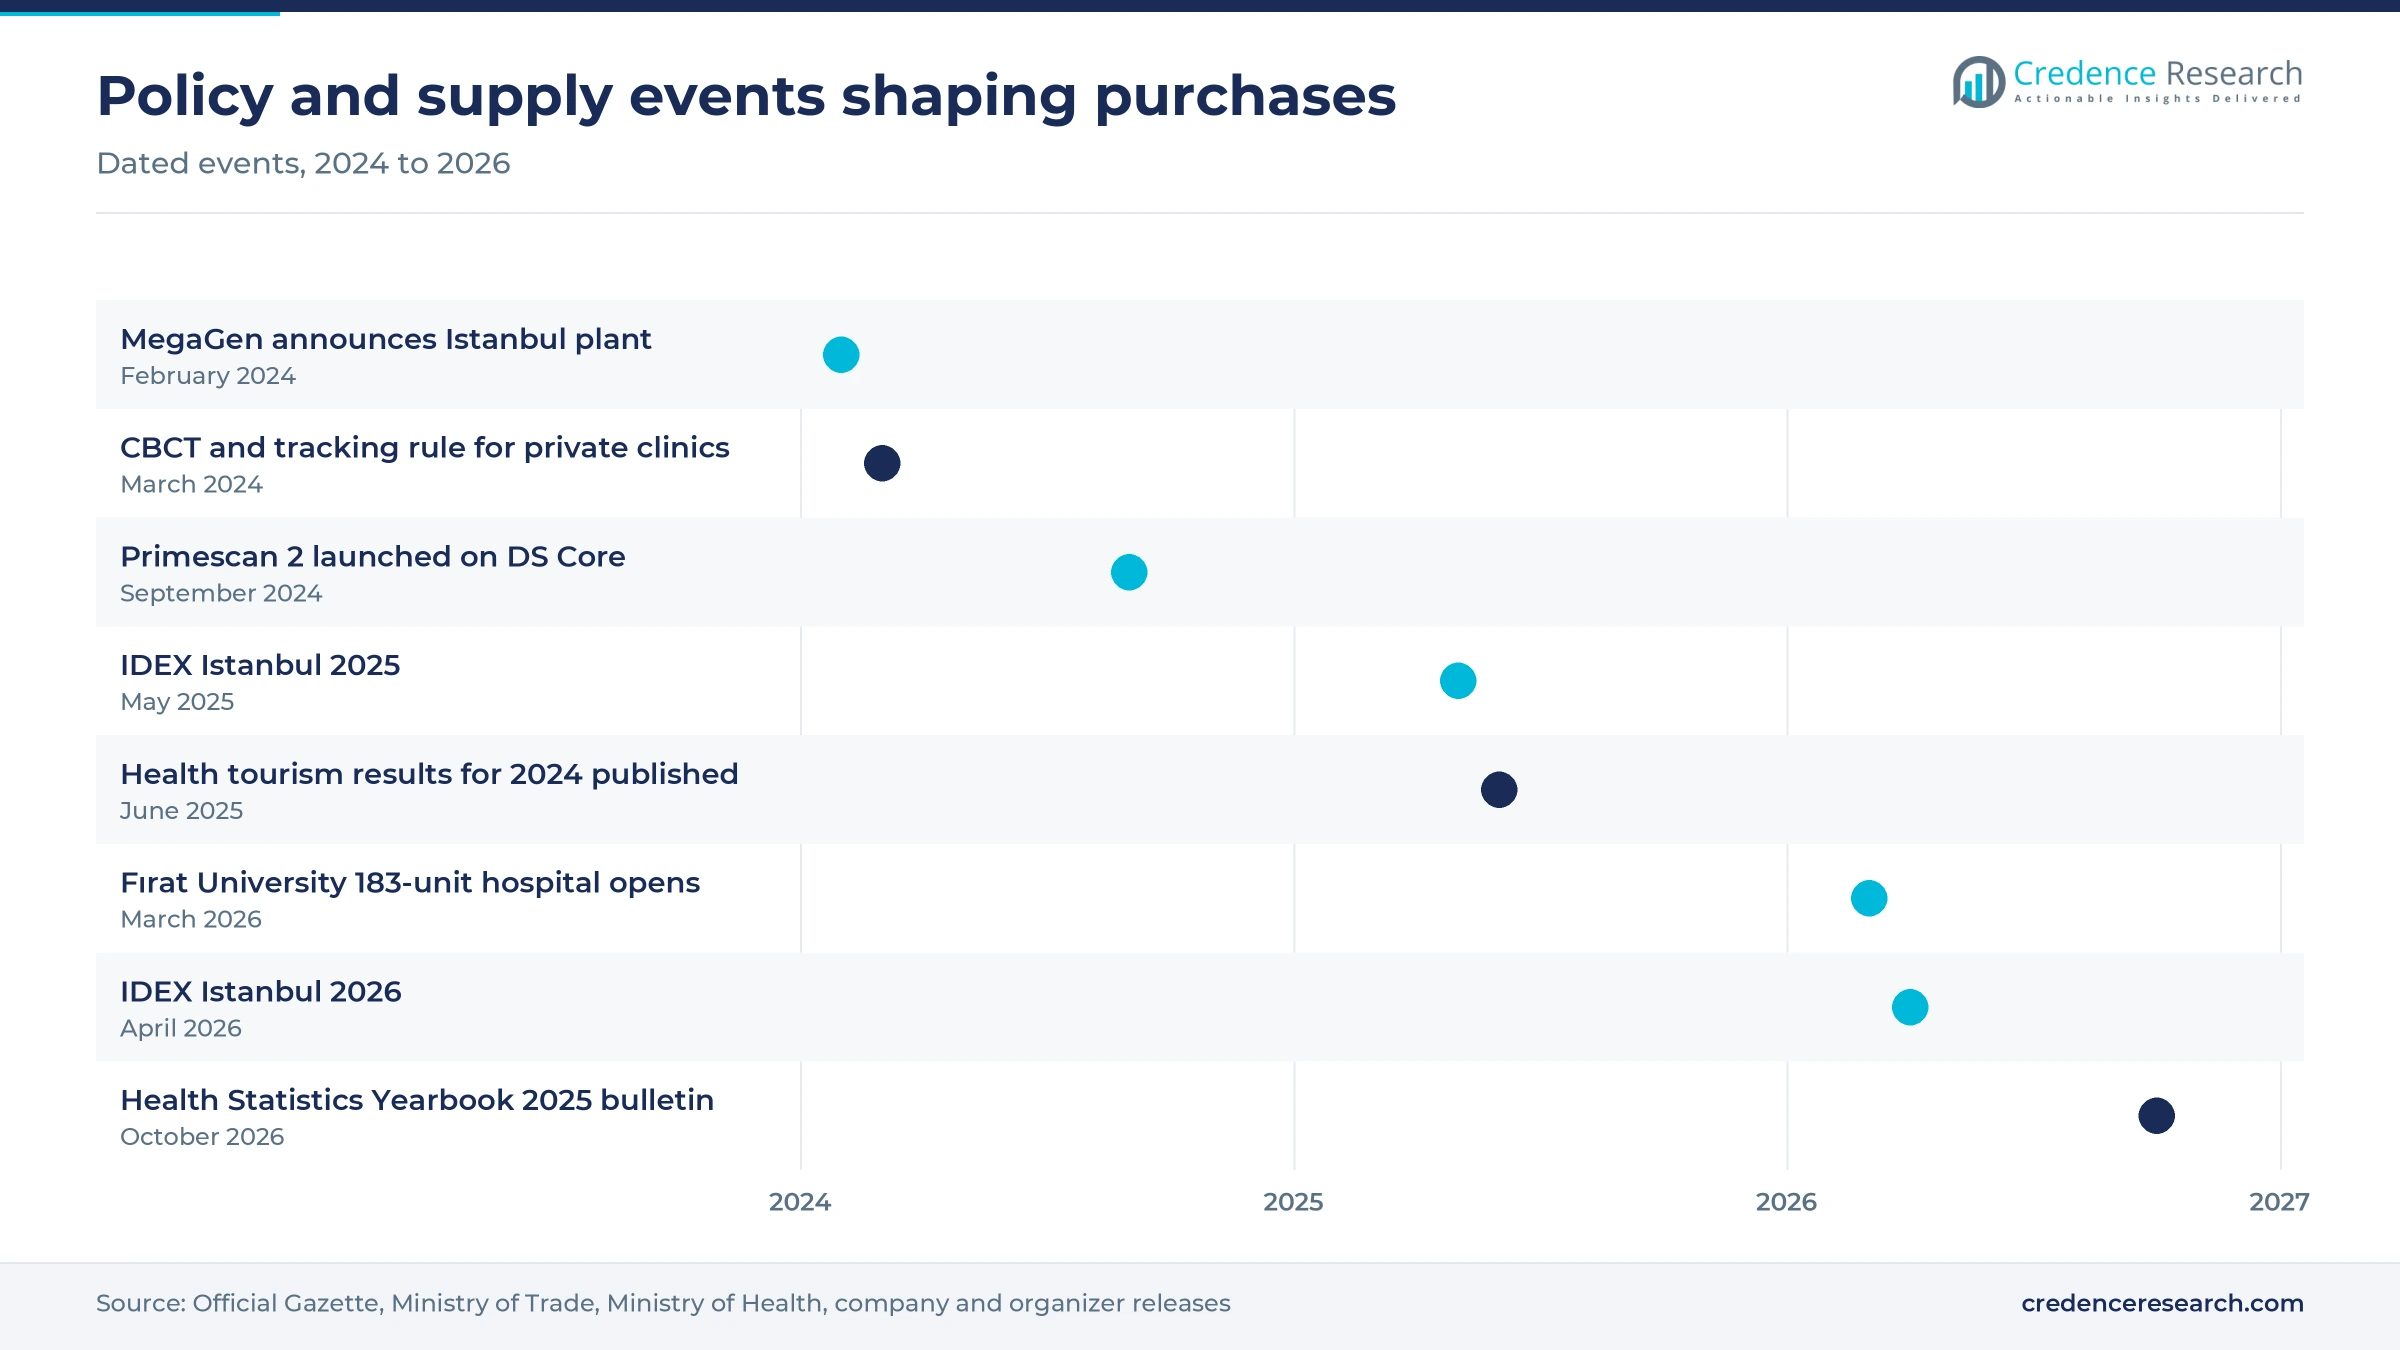
| Development | Status and market relevance |
|---|---|
| In March 2024, the Ministry of Health added cone-beam CT to the definition of a dental radiology unit in private clinics. | In force; device registration in the Product Tracking System is mandatory |
| In September 2024, Dentsply Sirona launched Primescan 2, a cloud-native intraoral scanner running on DS Core. | Launched; operation requires a paid DS Core subscription |
| In May 2025, IDEX Istanbul drew 98,595 dental professionals from more than 135 countries to the Istanbul Expo Center. | Main national showroom for imaging, scanners and treatment units |
| In June 2025, the Ministry of Trade reported USD 3.0 billion in 2024 health services exports from 1.5 million health tourists. | Confirms the tourism demand behind private clinic upgrades |
| In March 2026, Fırat University opened its faculty dental hospital in Elazığ with 183 dental units. | Opened; about 400 patients a day on average |
Cone-beam CT and chairside milling raise clinic value
- Cone-beam CT gives clinics three-dimensional views of bone and nerves, and since March 2024 it is part of the legal definition of a dental radiology unit.
- Intraoral scanning replaces impression trays with digital models that move straight to laboratories or chairside milling units through cloud platforms.
- Chairside milling and 3D printing lets tourism clinics produce crowns, splints and surgical guides during a short stay, which shortens treatment for foreign patients.
- Lasers and piezo surgery support soft tissue and bone procedures with less bleeding, which suits implant-focused clinics that compete on patient comfort.
Need a Custom Version of This Report?
Tailor the scope, geography, or segments to your exact requirements.
- Custom geography or segment scope
- Direct access to our analyst team
Global brands rely on dealers as Turkish makers compete
Competition for dental diagnostic and surgical equipment in Turkey splits between multinational brands in imaging and digital systems and a wider field of suppliers in chairs, handpieces and instruments. Dentsply Sirona sells imaging, scanners, CAD/CAM and treatment centers from Istanbul, and Envista employs sales and clinical support staff for its imaging and restorative brands. Planmeca, which has owned the KaVo treatment unit business since January 2022, has used Turkish dealer Ünaldı Medikal and its own Plandent supply arm. NSK and W&H serve clinics with handpieces, surgical motors and sterilizers through Turkish distributors and local websites, and NSK added chairs by acquiring DCI International in 2023. Osstem trades through its own Turkish company and serves implant-focused clinics. Turkish makers Grup Dental and Ersoy Dental compete on price and delivery time. Clinics choose on service coverage, financing terms and workflow integration as much as on list price.
How concentrated is supply among brands and dealers?
Supply is concentrated among a few multinational brands in imaging, scanners and CAD/CAM, while chairs, handpieces and hand instruments are more fragmented. The leading imaging and digital brands sell through Istanbul offices or long-standing dealers, and Japanese and Austrian handpiece makers rely on Turkish distributors. Turkish makers such as Grup Dental and Ersoy Dental compete in units and instruments on price and delivery. Entry barriers are device registration, the tracking rules and a nationwide service network. Margins sit increasingly with dealers that bundle installation, financing and service, which is why dealers and distributors hold 52.0% of 2025 value.
Key equipment suppliers active in Turkey
| Company | Type | Role in the market |
|---|---|---|
| Dentsply Sirona | Imaging, CAD/CAM and treatment centers | Office in Ataşehir, Istanbul; Primescan 2 launched September 2024 |
| Planmeca Group | Imaging, treatment units and CAD/CAM | Distributor Ünaldı Medikal named in 2013; owns KaVo treatment units since January 2022 |
| Envista Holdings Corporation | Imaging and restorative brands | Sales and clinical support teams in Istanbul and Izmir |
| NSK (Nakanishi) | Handpieces, surgical motors and chairs | Turkish website and distributors; acquired DCI International in 2023 |
| W&H Group | Handpieces, sterilizers and implant motors | Turkish website and distributor network |
| Osstem Implant | Korean implant and equipment maker | Turkish trading company, Osstem Implant Dış Ticaret |
| Grup Dental | Turkish maker of dental units | Factory in İvedik Organized Industrial Zone, Ankara, since 2001 |
| Ersoy Dental | Turkish maker of surgical hand instruments | Production in Samsun, branch in Istanbul |
Credence Research view on clinic fit-out spending
Credence Research's view is that diagnostic and surgical equipment demand in Turkey will be shaped less by the number of new dentists and more by what each operatory contains. Surgical and treatment equipment held 56.0% of 2025 value and remains the largest purchase, but 3D imaging, scanners and chairside milling add more value per clinic, especially where tourism patients pay in foreign currency. Marmara keeps the largest base, while the Mediterranean adds value fastest. The lira is the swing factor for solo practices, so suppliers that combine financing, local service and registered, traceable products are best placed to gain share.
Installed base, replacement and trade data anchor the model
The report uses 2021 to 2035 as the study period, 2025 as the base year and 2026 to 2035 as the forecast period, with market values from the Credence Research model. Desk research builds the fact base from UN Comtrade trade data, Ministry of Health yearbooks, TurkStat, Official Gazette regulations, Ministry of Trade health tourism data and company material. Published dealer price lists, public tender awards and supplier product material inform unit prices and channel structure. The bottom-up model multiplies the installed base of dental units, imaging and sterilization lines by replacement rates, adds demand from new clinics and faculty hospitals, and values each unit at end-user prices. A top-down check reconciles the result with trade flows and company disclosures, and the final figures are cross-checked against dentist and facility counts. All segment shares, regional shares and growth rates shown on this page are Credence Research estimates.
Digital diagnosis and tourism clinics carry growth to 2035
Diagnostic and surgical equipment value is expected to rise from USD 84.2 million in 2026 to USD 145.5 million by 2035, as clinics replace aging chairs and add digital diagnosis. Growth should lean toward intraoral scanners, cone-beam imaging and CAD/CAM, while chairs and handpieces follow replacement cycles. Private polyclinics, which held 48.0% of 2025 demand, keep the largest share of purchases, and university faculties grow fastest as new teaching hospitals open. Marmara stays the largest regional market and the Mediterranean gains share on tourism. A steadier lira after 2026 would bring forward delayed upgrades, while a new devaluation would push buyers toward Turkish-made and Asian equipment.
The lira and tourism decide the range of outcomes
The spread between the cases depends mainly on the lira and on foreign patient flows. A stable currency and continued growth in health tourism keep private polyclinics buying 3D imaging and CAD/CAM, while a sharp new devaluation would delay chair and imaging replacement in solo practices. Faster opening of faculty hospitals and ministry centers would add public demand. The base case keeps the 6.27% CAGR through 2035, led by private clinics in Marmara and the Mediterranean.
| Scenario | CAGR, 2026–2035 | Value, 2035 | What has to hold |
|---|---|---|---|
| Downside | 4.7% | USD 127.0 million | A new lira slide and weaker tourist arrivals delay private clinic upgrades until 2028 |
| Base | 6.27% | USD 145.5 million | The lira weakens gradually and health tourism keeps growing at recent rates |
| Upside | 7.5% | USD 161.0 million | Tourism clinics expand faster and new faculty hospitals open on schedule across Anatolia |
Frequently Asked Questions
How big is the Turkey dental diagnostics and surgical equipment market?
Which region leads equipment demand in Turkey?
Which equipment type has the largest share?
Which equipment type grows fastest?
How did the 2024 regulation change dental imaging?
How does the lira affect equipment purchases?
Who are the main suppliers in Turkey?
Which distribution channel leads?
Table of Content
Chapter 1 Market Segmentation
- 1.1 Segmentation Framework
- 1.1.1 Product and Service Classification
- 1.1.2 Application and End-Use Classification
- 1.1.3 Technology and Solution Classification
- 1.1.4 Customer and Distribution Channel Classification
- 1.1.5 Geographic Segmentation
- 1.1.6 Market Segment Definitions and Boundaries
- 1.2 By Product Category
- 1.2.1 Diagnostic Equipment
- 1.2.2 Surgical and Treatment Equipment
- 1.2.3 CAD/CAM Equipment
- 1.3 By Equipment Type
- 1.3.1 Intraoral X-ray Units
- 1.3.2 Panoramic, Cephalometric and CBCT
- 1.3.3 Intraoral Scanners and Cameras
- 1.3.4 CAD/CAM Milling and 3D Printers
- 1.3.5 Dental Units and Delivery Systems
- 1.3.6 Handpieces
- 1.3.7 Dental Lasers
- 1.3.8 Implant, Piezo and Electrosurgery Units
- 1.3.9 Surgical Hand Instruments
- 1.3.10 Sterilization Equipment
- 1.4 By End User
- 1.4.1 Private Polyclinics and Centers
- 1.4.2 Solo Practices
- 1.4.3 Public MoH Facilities
- 1.4.4 University Faculties
Chapter 2 Introduction
- 2.1 Report Objectives and Scope
- 2.2 Product Definition and Industry Terminology
- 2.3 Market Inclusions and Exclusions
- 2.4 Research Process
- 2.4.1 Primary Research and Expert Interviews
- 2.4.2 Secondary Research and Source Review
- 2.4.3 Top-Down and Bottom-Up Estimation
- 2.4.4 Data Triangulation and Verification
- 2.5 Market Size Measurement Basis
- 2.5.1 2025: USD 79.2 million → 2035: USD 145.5 million
- 2.6 Historical and Forecast Reference Periods
- 2.6.1 Historical Period: 2018-2025
- 2.6.2 Base Year: 2025
- 2.6.3 Forecast Period: 2025-2035
- 2.7 Research Assumptions and Limitations
Chapter 3 Executive Summary
- 3.1 Market Snapshot and Key Findings
- 3.2 Base-Year Market Size, 2025
- 3.3 Forecast Market Size, 2035
- 3.4 Revenue and Volume Growth Outlook
- 3.5 Key Demand and Supply Indicators
- 3.6 Leading Market Segments
- 3.7 Fastest-Growing Market Opportunities
- 3.8 Regional Performance Highlights
- 3.9 Technology and Industry Transformation
- 3.10 Competitive Landscape Summary
- 3.11 Analyst View and Strategic Implications
Chapter 4 Turkey Dental Diagnostics and Surgical Equipment Market Trends and Developments
- 4.1 Historical Industry Development, 2018-2025
- 4.2 Recent Market Trends and Developments
- 4.3 Demand and Customer Behavior Trends
- 4.4 Technology and Product Innovation
- 4.5 Artificial Intelligence, Automation and Digitalization
- 4.6 Local Manufacturing and Supply Chain Realignment
- 4.7 Industry Partnerships, Mergers and Acquisitions
- 4.8 Sustainability and Circular Economy Developments
- 4.9 Government and Private Sector Investment Trends
- 4.10 Emerging Business Models and Commercialization
- 4.11 Industry Developments and Announcements
Chapter 5 Turkey Dental Diagnostics and Surgical Equipment Market Production, Supply and Demand Analysis
- 5.1 Demand Trend and Consumption Analysis, 2018-2025
- 5.2 Demand Forecast, 2025-2035
- 5.3 Production and Output Trend, 2018-2025
- 5.4 Production and Output Forecast, 2025-2035
- 5.5 Installed Capacity and Capacity Utilization
- 5.6 Company-Wise Production Plants and Statistics
- 5.6.1 Installed Production Capacity
- 5.6.2 Actual Production
- 5.6.3 Planned Capacity and Expansion Targets
- 5.7 Supply Chain Structure and Procurement Trends
- 5.8 Supply-Demand Gap and Bottlenecks
- 5.9 Import Dependence and Sourcing Structure
- 5.10 Contract Manufacturing and Outsourcing
- 5.11 Regional Supply and Demand Concentration
Chapter 6 Turkey Dental Diagnostics and Surgical Equipment Market Pricing Analysis
- 6.1 Pricing Structure and Measurement
- 6.2 Historical Pricing Trends, 2018-2025
- 6.3 Pricing Outlook, 2025-2035
- 6.4 Average Selling Price and Unit Economics
- 6.5 Pricing by Product and Market Segment
- 6.6 Geographic Pricing Differences
- 6.7 Key Input, Energy, Labor and Logistics Costs
- 6.8 Contract Pricing and Purchasing Models
- 6.9 Pricing Sensitivity and Competitive Positioning
- 6.10 Price, Margin and Profitability Implications
Chapter 7 Turkey Dental Diagnostics and Surgical Equipment Market Dynamics
- 7.1 Market Growth Drivers
- 7.1.1 Demand-Side Drivers
- 7.1.2 Technology and Innovation Drivers
- 7.1.3 Infrastructure and Investment Drivers
- 7.1.4 Regulatory and Policy Drivers
- 7.2 Market Restraints
- 7.2.1 Cost and Affordability Constraints
- 7.2.2 Technology and Adoption Barriers
- 7.2.3 Supply Chain and Operational Constraints
- 7.3 Market Challenges
- 7.3.1 Competitive Pressure and Margin Erosion
- 7.3.2 Skills, Infrastructure and Implementation Gaps
- 7.4 Emerging Market Opportunities
- 7.5 Market Dynamics Impact and Time-Horizon Assessment
Chapter 8 Turkey Dental Diagnostics and Surgical Equipment Value Chain Analysis
- 8.1 Industry Value Chain Overview
- 8.2 Upstream Suppliers and Critical Inputs
- 8.3 Technology and Component Providers
- 8.4 Manufacturing or Service Delivery
- 8.5 Distribution, Channel Partners and Integrators
- 8.6 Downstream Applications and End Users
- 8.7 Value Addition and Profit Pools
- 8.8 Vertical Integration and Outsourcing
- 8.9 Supplier Concentration and Risk
- 8.10 Supply Chain Localization and Resilience
Chapter 9 Turkey Dental Diagnostics and Surgical Equipment Market Regulations and Policies
- 9.1 Relevant Laws, Standards and Compliance Frameworks
- 9.2 Product, Service, Safety and Quality Requirements
- 9.3 Government Policies, Incentives and Subsidies
- 9.4 Imports, Exports and Trade Barriers
- 9.5 Public Procurement and Local Content Requirements
- 9.6 Environmental and Sustainability Compliance
- 9.7 Upcoming Policy Changes and Market Implications
Chapter 10 Turkey Dental Diagnostics and Surgical Equipment Market Hotspots and Opportunities
- 10.1 Market Opportunity Mapping and Growth Hotspots
- 10.2 High-Growth Applications and Customer Groups
- 10.3 Underserved Markets and White-Space Opportunities
- 10.4 Emerging Technology and Product Opportunities
- 10.5 New Capacity and Investment Hotspots
- 10.6 Market Entry and Expansion Opportunities
- 10.7 Distribution and Partnership Opportunities
- 10.8 Near-Term and Long-Term Commercial Potential
- 10.9 Opportunity Attractiveness and Execution Risks
Chapter 11 Turkey Dental Diagnostics and Surgical Equipment Market Outlook, 2025-2035
- 11.1 Market Size and Analysis
- 11.1.1 Revenue (Market Measurement: 2025: USD 79.2 million → 2035: USD 145.5 million)
- 11.1.2 Market Volume and Quantity Sold
- 11.1.3 Historical Market Size, 2018-2025
- 11.1.4 Base-Year Market Size, 2025
- 11.2 Market Forecast, 2025-2035
- 11.2.1 Revenue Forecast to 2035
- 11.2.2 Volume Forecast to 2035
- 11.2.3 CAGR and Year-on-Year Growth
- 11.2.4 Incremental Revenue Opportunity
- 11.3 Forecast Assumptions and Scenario Analysis
- 11.3.1 Base-Case Forecast
- 11.3.2 Optimistic and Conservative Scenarios
- 11.3.3 Technology, Pricing and Policy Sensitivities
- 11.4 Market Attractiveness and Growth Outlook
Chapter 12 Turkey Dental Diagnostics and Surgical Equipment Market Segmentation and Outlook
- 12.1 Segmentation Summary and Market Shares, 2025
- 12.2 Largest and Fastest-Growing Segments
- 12.3 By Product Category - Market Size and Forecast, 2025-2035
- 12.3.1 Segment Definition and Scope
- 12.3.2 Historical Market Size, 2018-2025
- 12.3.3 Revenue Forecast, 2025-2035
- 12.3.4 Volume Forecast, 2025-2035
- 12.3.5 Base-Year Market Share, 2025
- 12.3.6 Segment CAGR and Growth Drivers
- 12.3.7 Subsegment Market Size and Forecast
- 12.3.7.1 Diagnostic Equipment
- 12.3.7.2 Surgical and Treatment Equipment
- 12.3.7.3 CAD/CAM Equipment
- 12.3.8 Subsegment Pricing and Adoption Trends
- 12.3.9 Leading Suppliers and Competition
- 12.3.10 Regional Demand and Opportunities
- 12.4 By Equipment Type - Market Size and Forecast, 2025-2035
- 12.4.1 Segment Definition and Scope
- 12.4.2 Historical Market Size, 2018-2025
- 12.4.3 Revenue Forecast, 2025-2035
- 12.4.4 Volume Forecast, 2025-2035
- 12.4.5 Base-Year Market Share, 2025
- 12.4.6 Segment CAGR and Growth Drivers
- 12.4.7 Subsegment Market Size and Forecast
- 12.4.7.1 Intraoral X-ray Units
- 12.4.7.2 Panoramic, Cephalometric and CBCT
- 12.4.7.3 Intraoral Scanners and Cameras
- 12.4.7.4 CAD/CAM Milling and 3D Printers
- 12.4.7.5 Dental Units and Delivery Systems
- 12.4.7.6 Handpieces
- 12.4.7.7 Dental Lasers
- 12.4.7.8 Implant, Piezo and Electrosurgery Units
- 12.4.7.9 Surgical Hand Instruments
- 12.4.7.10 Sterilization Equipment
- 12.4.8 Subsegment Pricing and Adoption Trends
- 12.4.9 Leading Suppliers and Competition
- 12.4.10 Regional Demand and Opportunities
- 12.5 By End User - Market Size and Forecast, 2025-2035
- 12.5.1 Segment Definition and Scope
- 12.5.2 Historical Market Size, 2018-2025
- 12.5.3 Revenue Forecast, 2025-2035
- 12.5.4 Volume Forecast, 2025-2035
- 12.5.5 Base-Year Market Share, 2025
- 12.5.6 Segment CAGR and Growth Drivers
- 12.5.7 Subsegment Market Size and Forecast
- 12.5.7.1 Private Polyclinics and Centers
- 12.5.7.2 Solo Practices
- 12.5.7.3 Public MoH Facilities
- 12.5.7.4 University Faculties
- 12.5.8 Subsegment Pricing and Adoption Trends
- 12.5.9 Leading Suppliers and Competition
- 12.5.10 Regional Demand and Opportunities
- 12.6 Segment Growth Comparison
- 12.7 Segment Attractiveness and Priority Matrix
Chapter 13 Turkey Dental Diagnostics and Surgical Equipment End-Use and Application Market Outlook
- 13.1 End-Use Industry and Customer Demand Structure
- 13.2 Leading Applications and Customer Groups
- 13.3 End-Use Market Size, Share and Forecast
- 13.4 Major End-Use Industry Deep Dives
- 13.4.1 Customer Requirements and Use Cases
- 13.4.2 Demand and Replacement Cycles
- 13.4.3 Technical and Regulatory Considerations
- 13.4.4 Purchasing and Procurement Models
- 13.4.5 Leading Vendors and Distribution Channels
- 13.4.6 Forecast and Commercial Opportunities
- 13.5 Emerging Applications and Cross-Segment Demand
- 13.6 End-Use Industry Investment Priorities
Chapter 14 Turkey Dental Diagnostics and Surgical Equipment Geographic Market Outlook, 2025-2035
- 14.1 Domestic Market Distribution and Demand Clusters
- 14.2 State- or Province-Wise Market Size and Forecast, 2025-2035
- 14.3 City and Metropolitan Market Outlook
- 14.4 Industrial, Manufacturing and Commercial Clusters
- 14.5 Geographic Concentration of Key End Users
- 14.6 Local Pricing and Purchasing Differences
- 14.7 Domestic Production Facilities and Capacity Map
- 14.8 Local Infrastructure and Project Pipeline
- 14.9 State-Level Policy and Incentive Differences
- 14.10 Subnational Investment Hotspots and Opportunities
- 14.11 Distribution and Logistics Networks
- 14.12 Domestic Competitive Footprint
Chapter 15 Turkey Dental Diagnostics and Surgical Equipment Technology, Innovation and Sustainability Outlook
- 15.1 Technology Landscape and Maturity
- 15.2 Product, Process and Service Innovation
- 15.3 AI, Automation and Digital Tools in the Industry
- 15.4 Technology Adoption and Performance Benchmarking
- 15.5 Innovation Pipeline and R&D Investment
- 15.6 Patent and Intellectual Property Trends
- 15.7 Energy Efficiency and Resource Management
- 15.8 Sustainability, Recycling and Circularity
- 15.9 Technology Roadmap, 2025-2035
- 15.10 Risks of Obsolescence and Technology Substitution
Chapter 16 Turkey Dental Diagnostics and Surgical Equipment Market Key Strategic Imperatives
- 16.1 Growth and Market Entry Priorities
- 16.2 High-Return Products and Segments
- 16.3 Pricing, Profitability and Cost Optimization
- 16.4 Technology Investment and Product Differentiation
- 16.5 Supply Chain Localization and Resilience
- 16.6 Distribution and Customer Acquisition
- 16.7 Partnership, Acquisition and Capacity Strategy
- 16.8 Regional Expansion Priorities
- 16.9 Short-, Medium- and Long-Term Actions
Chapter 17 Competition Outlook
- 17.1 Industry Competition Characteristics
- 17.2 Market Structure and Concentration
- 17.3 Market Share and Competitive Positioning, 2025
- 17.4 Company-Wise Revenue and Product Benchmarking
- 17.5 Production and Service Capacity Benchmarking
- 17.6 Technology, Pricing and Differentiation
- 17.7 Regional Footprint and Distribution Strength
- 17.8 Mergers, Acquisitions and Strategic Alliances
- 17.9 New Entrants and Competitive Threats
- 17.10 Porter's Five Forces and Industry Attractiveness
- 17.11 Competitive Outlook, 2025-2035
Chapter 18 Company Profiles
- 18.1 Company Coverage and Selection Criteria
- 18.2 Dentsply Sirona
- 18.2.1 Business Description
- 18.2.2 Company Ownership and Geographic Presence
- 18.2.3 Product and Service Portfolio
- 18.2.4 Manufacturing and Operating Footprint
- 18.2.5 Production Capacity and Expansion Plans
- 18.2.6 Financial Performance and Investment
- 18.2.7 Market Share and Competitive Position
- 18.2.8 Technology and Innovation Capabilities
- 18.2.9 Strategic Alliances or Partnerships
- 18.2.10 Recent Developments
- 18.2.11 Growth Strategy and Outlook
- 18.3 Planmeca Group
- 18.4 Envista Holdings Corporation
- 18.5 Vatech
- 18.6 NSK (Nakanishi)
- 18.7 W&H Group
- 18.8 Osstem Implant
- 18.9 A-dec
- 18.10 Grup Dental
- 18.11 Ersoy Dental
- 18.12 Other Relevant Market Participants
Note: Every listed company is profiled on the structure shown under the first company. The company list is preliminary and may change based on research findings, market developments, data availability and client requirements.
Chapter 19 Disclaimer
- 19.1 Research and Forecast Disclaimer
- 19.2 Data Source and Estimation Limitations
Note: The depth of individual sections depends on data availability for this market. Volume, capacity, trade and other unit-based metrics are included where applicable.