Insurance rollout and cancer care fill scanner order books
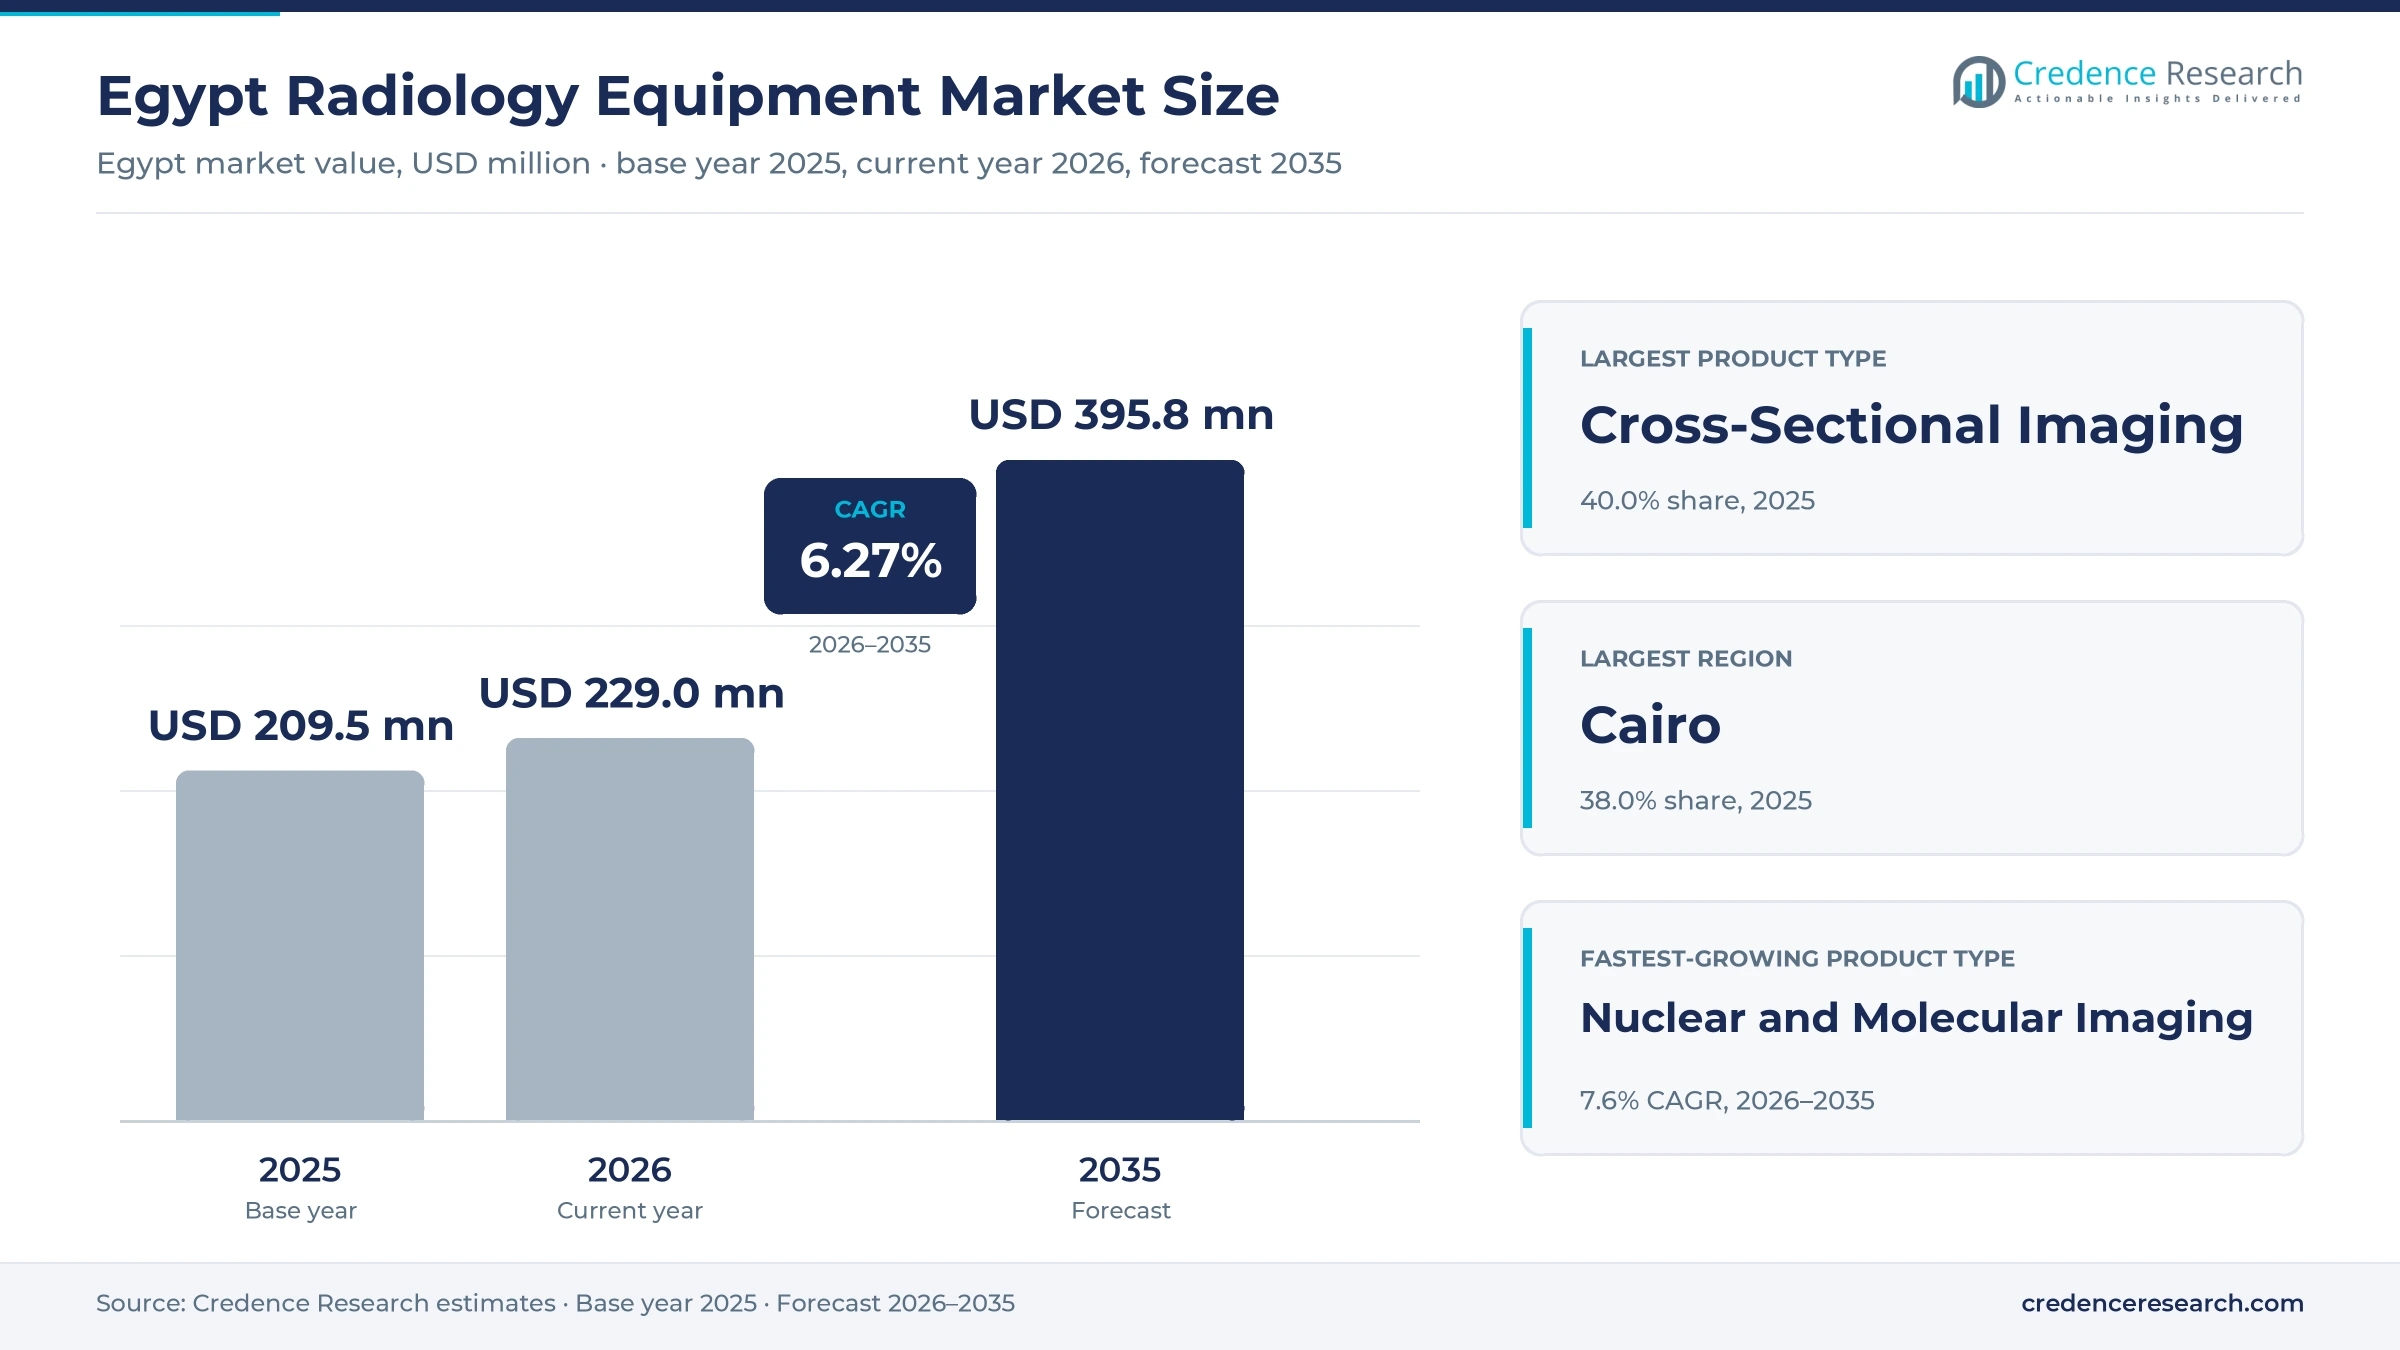
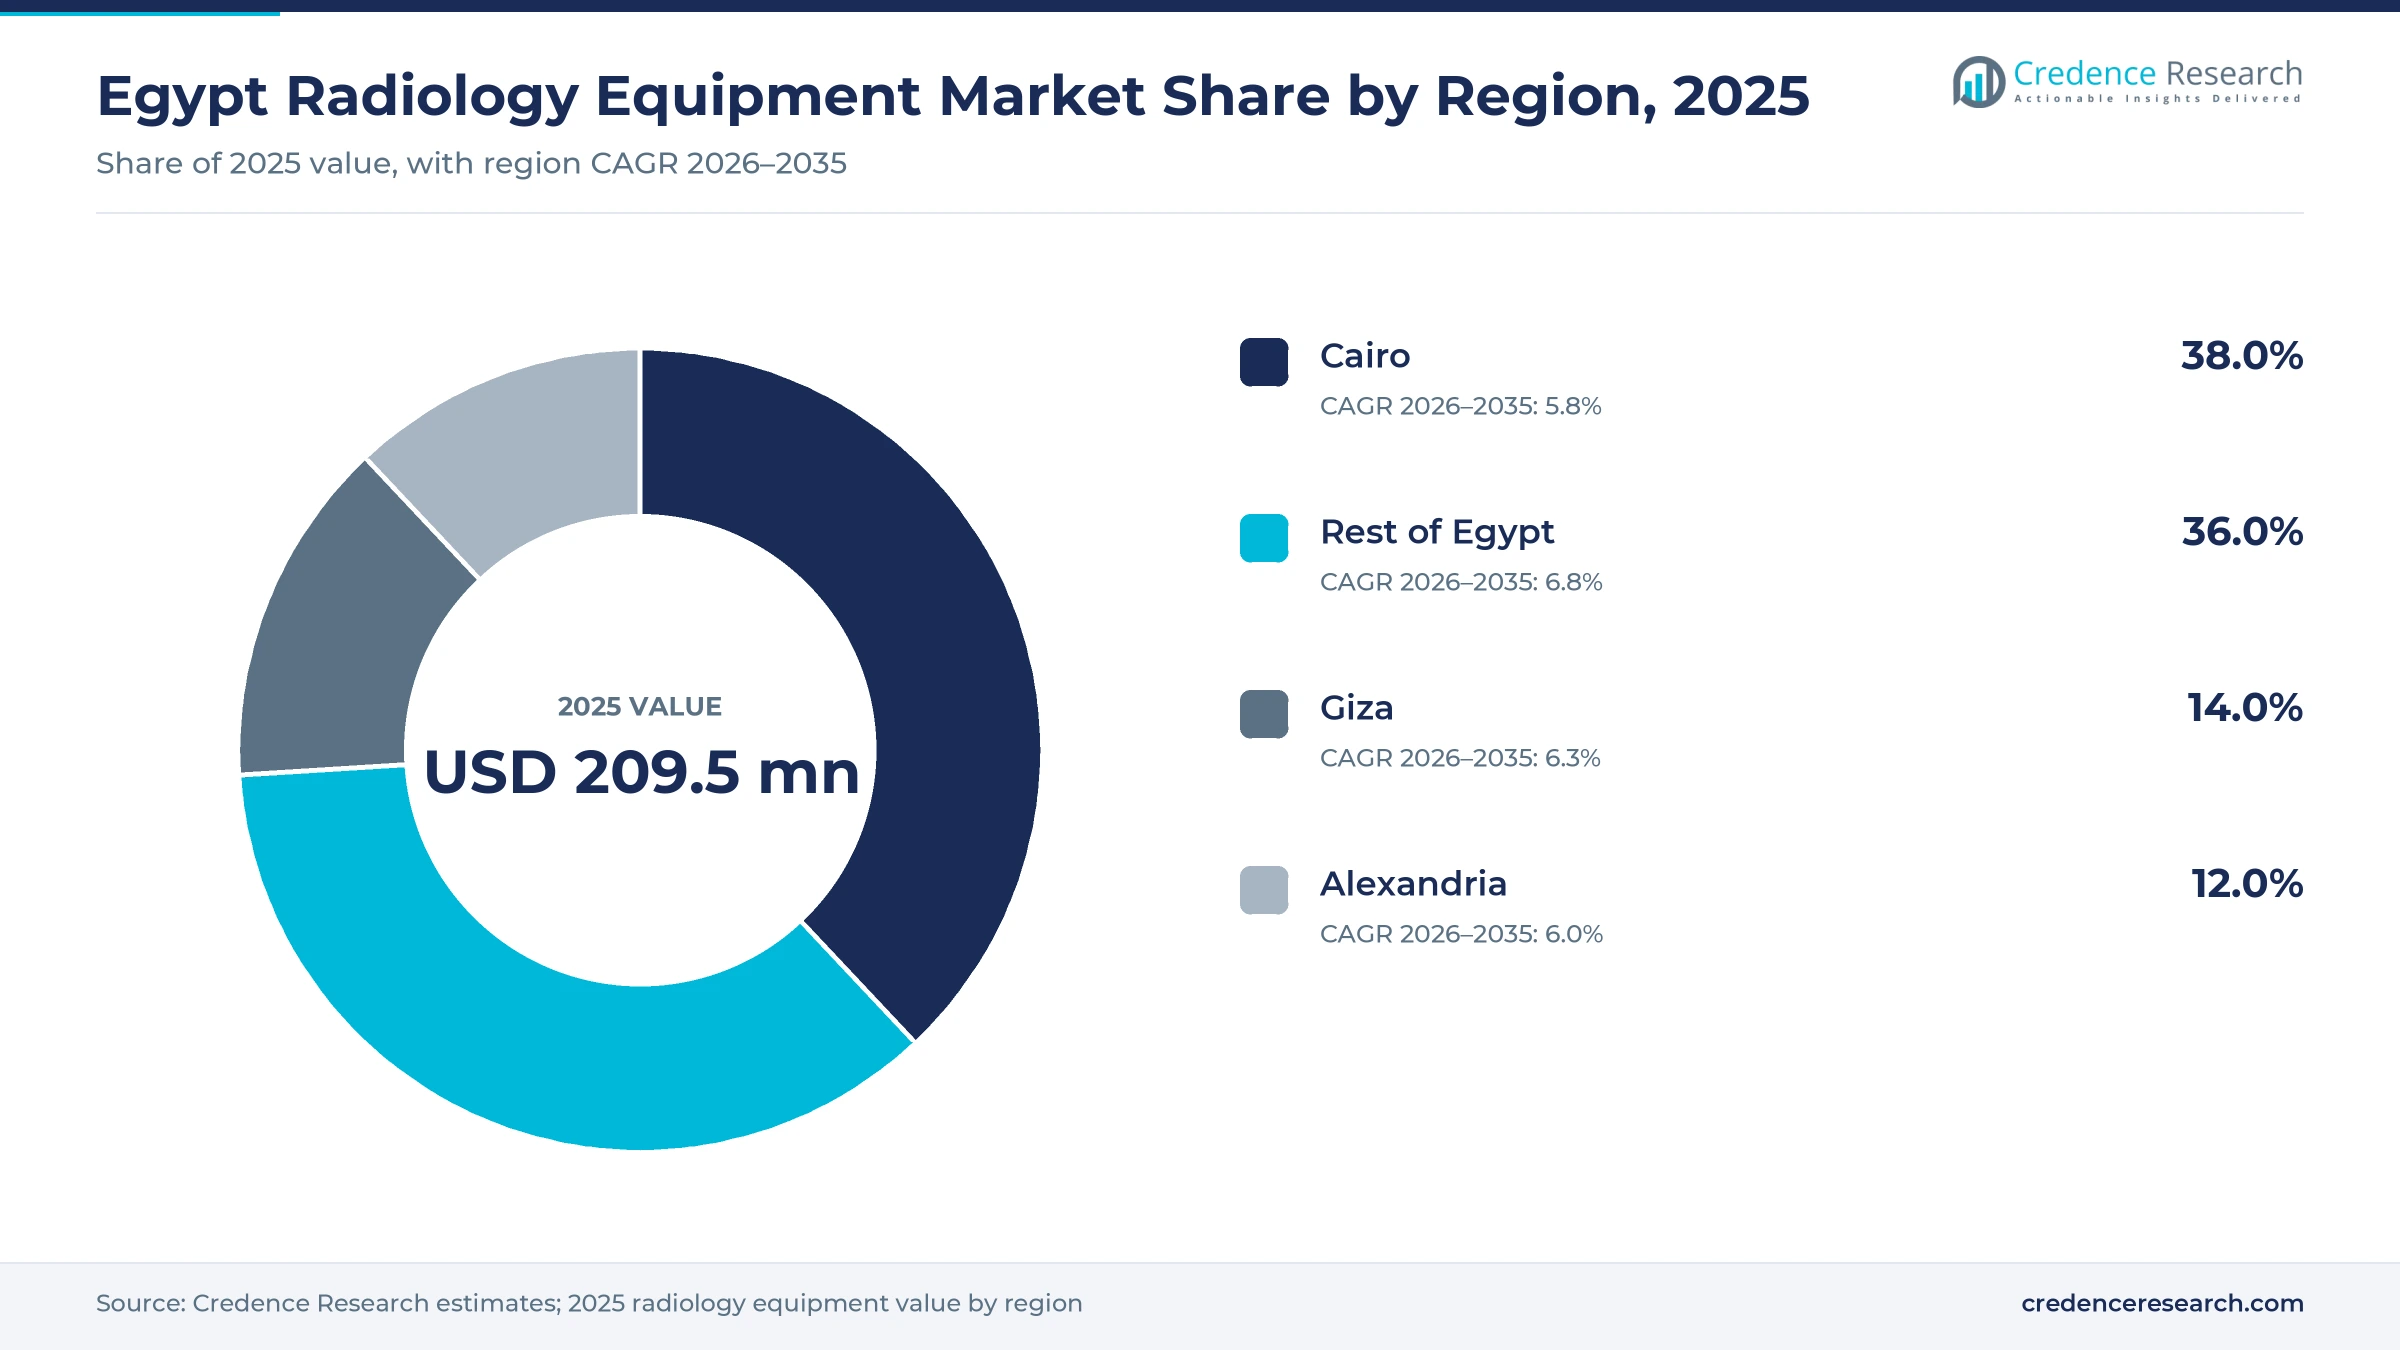
The Egypt radiology equipment market was valued at USD 209.5 million in 2025 and is projected to increase from USD 229.0 million in 2026 to USD 395.8 million by 2035, registering a CAGR of 6.27% during 2026–2035. Demand comes from public hospitals preparing for universal health insurance contracts, from cancer screening and treatment programs that need repeated scans, and from private chains replacing analog rooms with digital systems. Cairo held the largest regional share, 38.0% in 2025, because the capital concentrates university hospitals, private imaging chains and the local offices of every major vendor. The Rest of Egypt is the fastest-growing region at 6.8% a year, as the insurance system spreads from Port Said and Upper Egypt to new governorates. Local production is the main commercial change, because ultrasound and X-ray systems are now built in Egypt and compete in public tenders against imported units.
Imaging hardware bought by hospitals and centers, counted once
The estimate covers new and refurbished X-ray and breast imaging, ultrasound, CT and MRI, and nuclear and molecular imaging systems sold to public hospitals, private hospitals, diagnostic imaging centers and specialty clinics in Egypt. Each system is counted once, at the price paid by the buyer, whether it is bought through a public tender, directly from the manufacturer or through an authorized distributor.
The estimate excludes imaging services and scan fees, contrast media, radiotherapy machines, dental imaging and stand-alone software subscriptions, which are counted in their own markets. The value chain runs from global and local manufacturers through agents and service companies to the Unified Procurement Authority, hospital groups and private imaging chains that operate the rooms.
Egypt Radiology Equipment Market Insights
- The market was valued at USD 209.5 million in 2025 and is projected to reach USD 395.8 million by 2035, registering a CAGR of 6.27% during 2026–2035.
- Cairo held 38.0% of 2025 value, because the capital concentrates university hospitals, private imaging chains and the local service teams of major vendors.
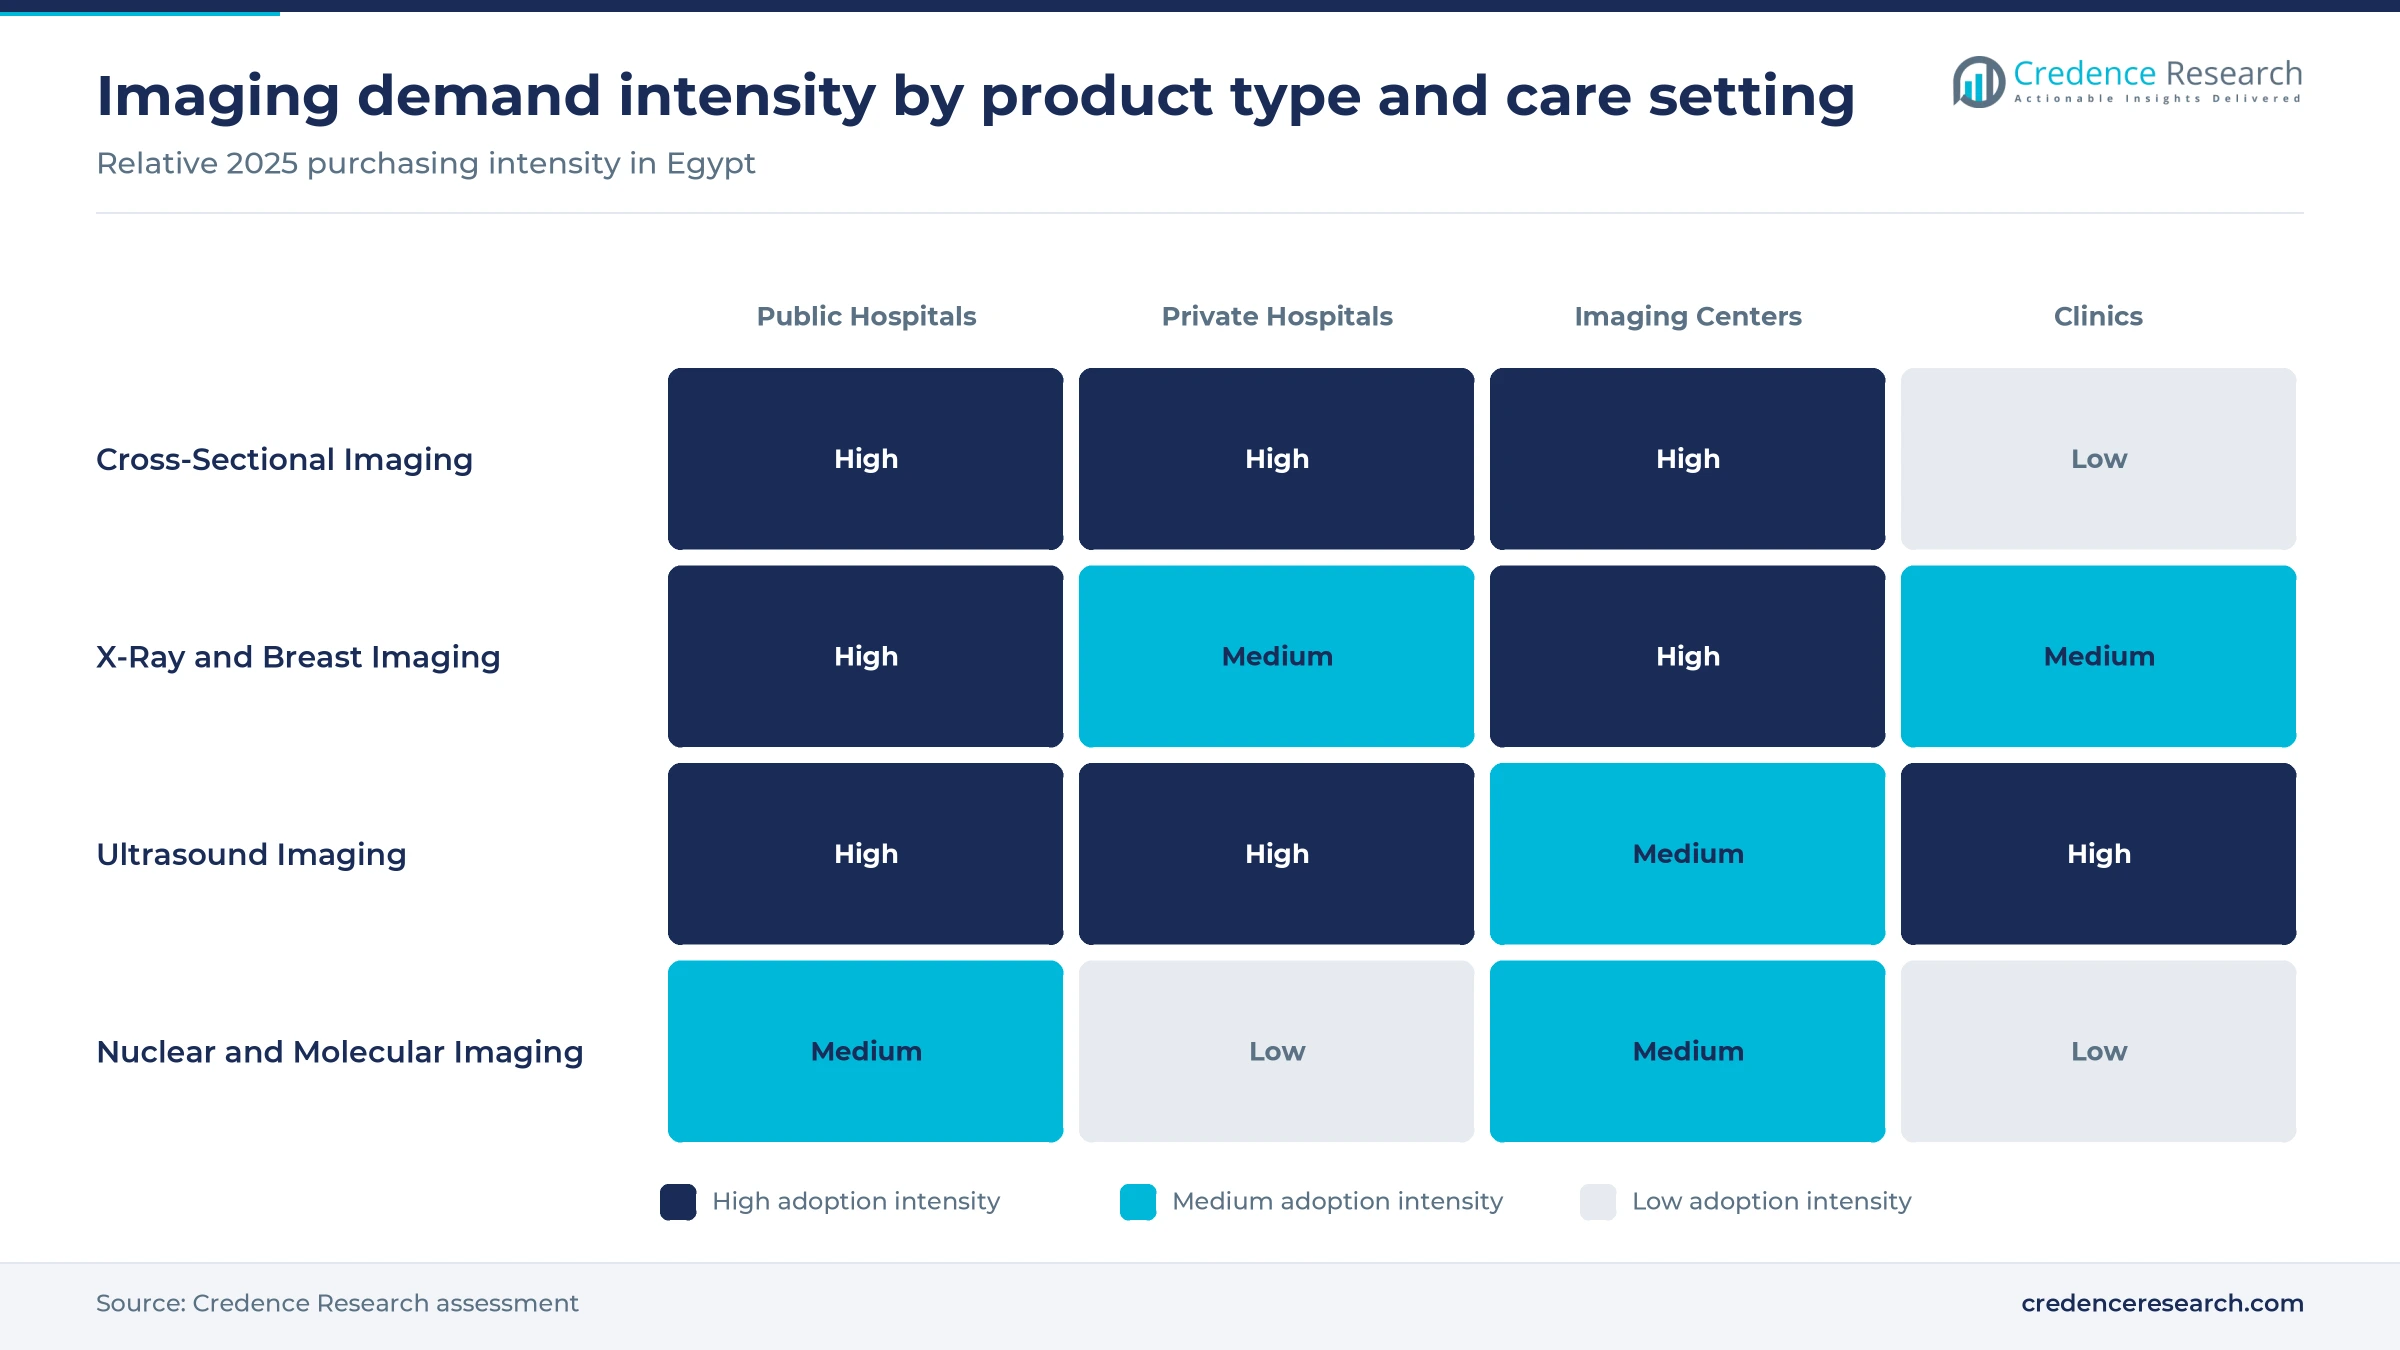
- Cross-sectional imaging led product types with 40.0% of 2025 value, as each CT or MRI system costs many times more than an X-ray room.
- The second insurance phase covers Minya, Matrouh, Damietta, Kafr El Sheikh and North Sinai, with 69 hospitals that will need imaging rooms before contracting.
- GE HealthCare, Mindray and China's XGY have all committed to local production in Egypt since 2025, which shifts public tenders toward domestic content.
CT and MRI lead while nuclear imaging grows fastest
Why do CT and MRI systems take the largest share?
Based on product type, the market is categorized into X-ray and breast imaging, ultrasound imaging, cross-sectional imaging and nuclear and molecular imaging. Cross-Sectional Imaging led with 40.0% of 2025 value, because each scanner costs far more than other rooms, and Cairo University's Kasr Al Ainy hospital paid EGP 12.8 million for one large-bore MRI in January 2024, Masrawy reported. Hospitals buy magnetic resonance imaging systems mainly for neurology and cancer referrals. Nuclear and Molecular Imaging grows fastest at 7.6% a year, as the Ain Sokhna plant signed in October 2025 will remanufacture PET-CT systems for oncology centers.
How much do public hospitals buy?
Based on care setting, the market is categorized into public hospitals, private hospitals, diagnostic imaging centers and ambulatory and specialty clinics. Public Hospitals led with 42.0% of 2025 value, because ministry, university and insurance hospitals buy through national tenders, and 102 hospitals take part in advanced diagnostics under the Women's Health Initiative. Diagnostic Imaging Centers grow fastest at 7.0% a year, as private chains expand, and Al Borg Scan, the imaging arm of Integrated Diagnostics Holdings, bought Cairo Ray for EGP 400 million in June 2025, taking its network to eight locations.
Which diseases generate the most scans?
Based on disease area, the market is categorized into oncology, cardiovascular disease, neurology and musculoskeletal and trauma. Oncology led with 34.0% of 2025 value, because cancer patients are scanned at diagnosis, staging and every follow-up, and breast and liver cancer together made up about 36% of new cases in 2024, IARC estimates. Neurology grows fastest at 7.0% a year, as Philips and the Health Ministry were studying specialized stroke units across Egypt in September 2026, the Cairo Governorate reported. Stroke care needs CT or MRI within hours of arrival, which adds scanners at emergency hospitals.
How do hospitals buy their imaging systems?
Based on channel, the market is categorized into direct OEM sales, authorized distributors, public tenders and refurbished equipment channels. Public Tenders led with 36.0% of 2025 value, because the state buys centrally, and Tatweer Medical Industries won government contracts for 100 ultrasound and 150 diagnostic X-ray units worth EGP 300 million to EGP 400 million, The Middle East Observer reported in July 2026. Refurbished Equipment Channels grow fastest at 8.1% a year from a small base of locally remanufactured systems, as Philips told Daily News Egypt in July 2026 that it is exploring refurbishment facilities in Egypt and that its Circular Edition systems cost about 25% less than comparable new ones.
| Segment Group | Leading Sub-segment | Share, 2025 | Fastest-growing Sub-segment | CAGR, 2026–2035 |
|---|---|---|---|---|
| By Product Type | Cross-Sectional Imaging | 40.0% | Nuclear and Molecular Imaging | 7.6% |
| By Care Setting | Public Hospitals | 42.0% | Diagnostic Imaging Centers | 7.0% |
| By Disease Area | Oncology | 34.0% | Neurology | 7.0% |
| By Channel | Public Tenders | 36.0% | Refurbished Equipment Channels | 8.1% |
Tenders, currency and origin set the price of a room
Imaging prices in Egypt are set by tender, by currency and by country of origin. Public buyers award most systems through Unified Procurement Authority tenders priced in pounds, while vendors pay for most components in dollars, so the March 2024 float raised pound prices for every imported room. Locally assembled ultrasound and X-ray units sit at the bottom of the range, and large-bore MRI and advanced CT at the top. Service contracts signed with the system often decide supplier margins more than the hardware price. Buyers that accept refurbished or locally built units can stretch a fixed budget across more sites, while premium vendors defend price with throughput, dose reduction and AI features.
| System or contract | Typical price or fee | Basis |
|---|---|---|
| Large-bore MRI, university hospital order | EGP 12.8 million per system | Kasr Al Ainy hospital, reported by Masrawy, January 2024 |
| Breast imaging system, university hospital order | About USD 326,000 per system | Kasr Al Ainy hospital, reported by Masrawy, January 2024 |
| Locally made ultrasound or diagnostic X-ray unit, government contract | About EGP 1.2 million to EGP 1.6 million per unit on average | Credence Research estimate from contracts for 250 units worth EGP 300 million to EGP 400 million, July 2026 |
| Manufacturer-refurbished system | About 25% below a comparable new system | Philips Circular Edition, Daily News Egypt, July 2026 |
Request a Free Sample
Fill in your details and we'll send you a free sample report.
- Sample data tables & charts
- Research methodology
Insurance, cancer care and local plants drive orders
How universal insurance and accreditation lift orders
The Universal Health Insurance System turns imaging into a contracted, audited service and every contracted hospital needs working scanners to qualify. The first phase covered about 5.2 million beneficiaries in Port Said, Ismailia, Luxor, Suez, South Sinai and Aswan by November 2025, with an average registration rate of 81.7%, according to Enterprise. Private providers already make up 31% of the contracted network, which spreads equipment buying beyond the Health Ministry. The General Authority for Healthcare Accreditation and Regulation had accredited 945 facilities across 26 governorates by October 2026, Daily News Egypt reported. Accreditation reviews radiation safety, maintenance records and image quality, so hospitals preparing for a survey tend to replace old analog rooms rather than repair them.
Why cancer and chronic disease keep scanners busy
Cancer and chronic disease are filling scanner schedules faster than public hospitals can add rooms. The International Agency for Research on Cancer estimates 137,390 new cancer cases in Egypt in 2024, including 26,052 breast cancers and 23,287 liver cancers, and both need ultrasound, CT or MRI for staging and follow-up. The Women's Health Initiative recorded 481,422 mammograms and 36,048 detected breast cancers between July 2019 and November 2025, the Health Ministry told Daily News Egypt. Each confirmed case then moves to treatment centers that scan patients again at every stage. This keeps oncology the largest disease area and rewards suppliers that bundle mammography systems, biopsy guidance and follow-up CT in one contract.
Digital rooms and central reading hubs replace film
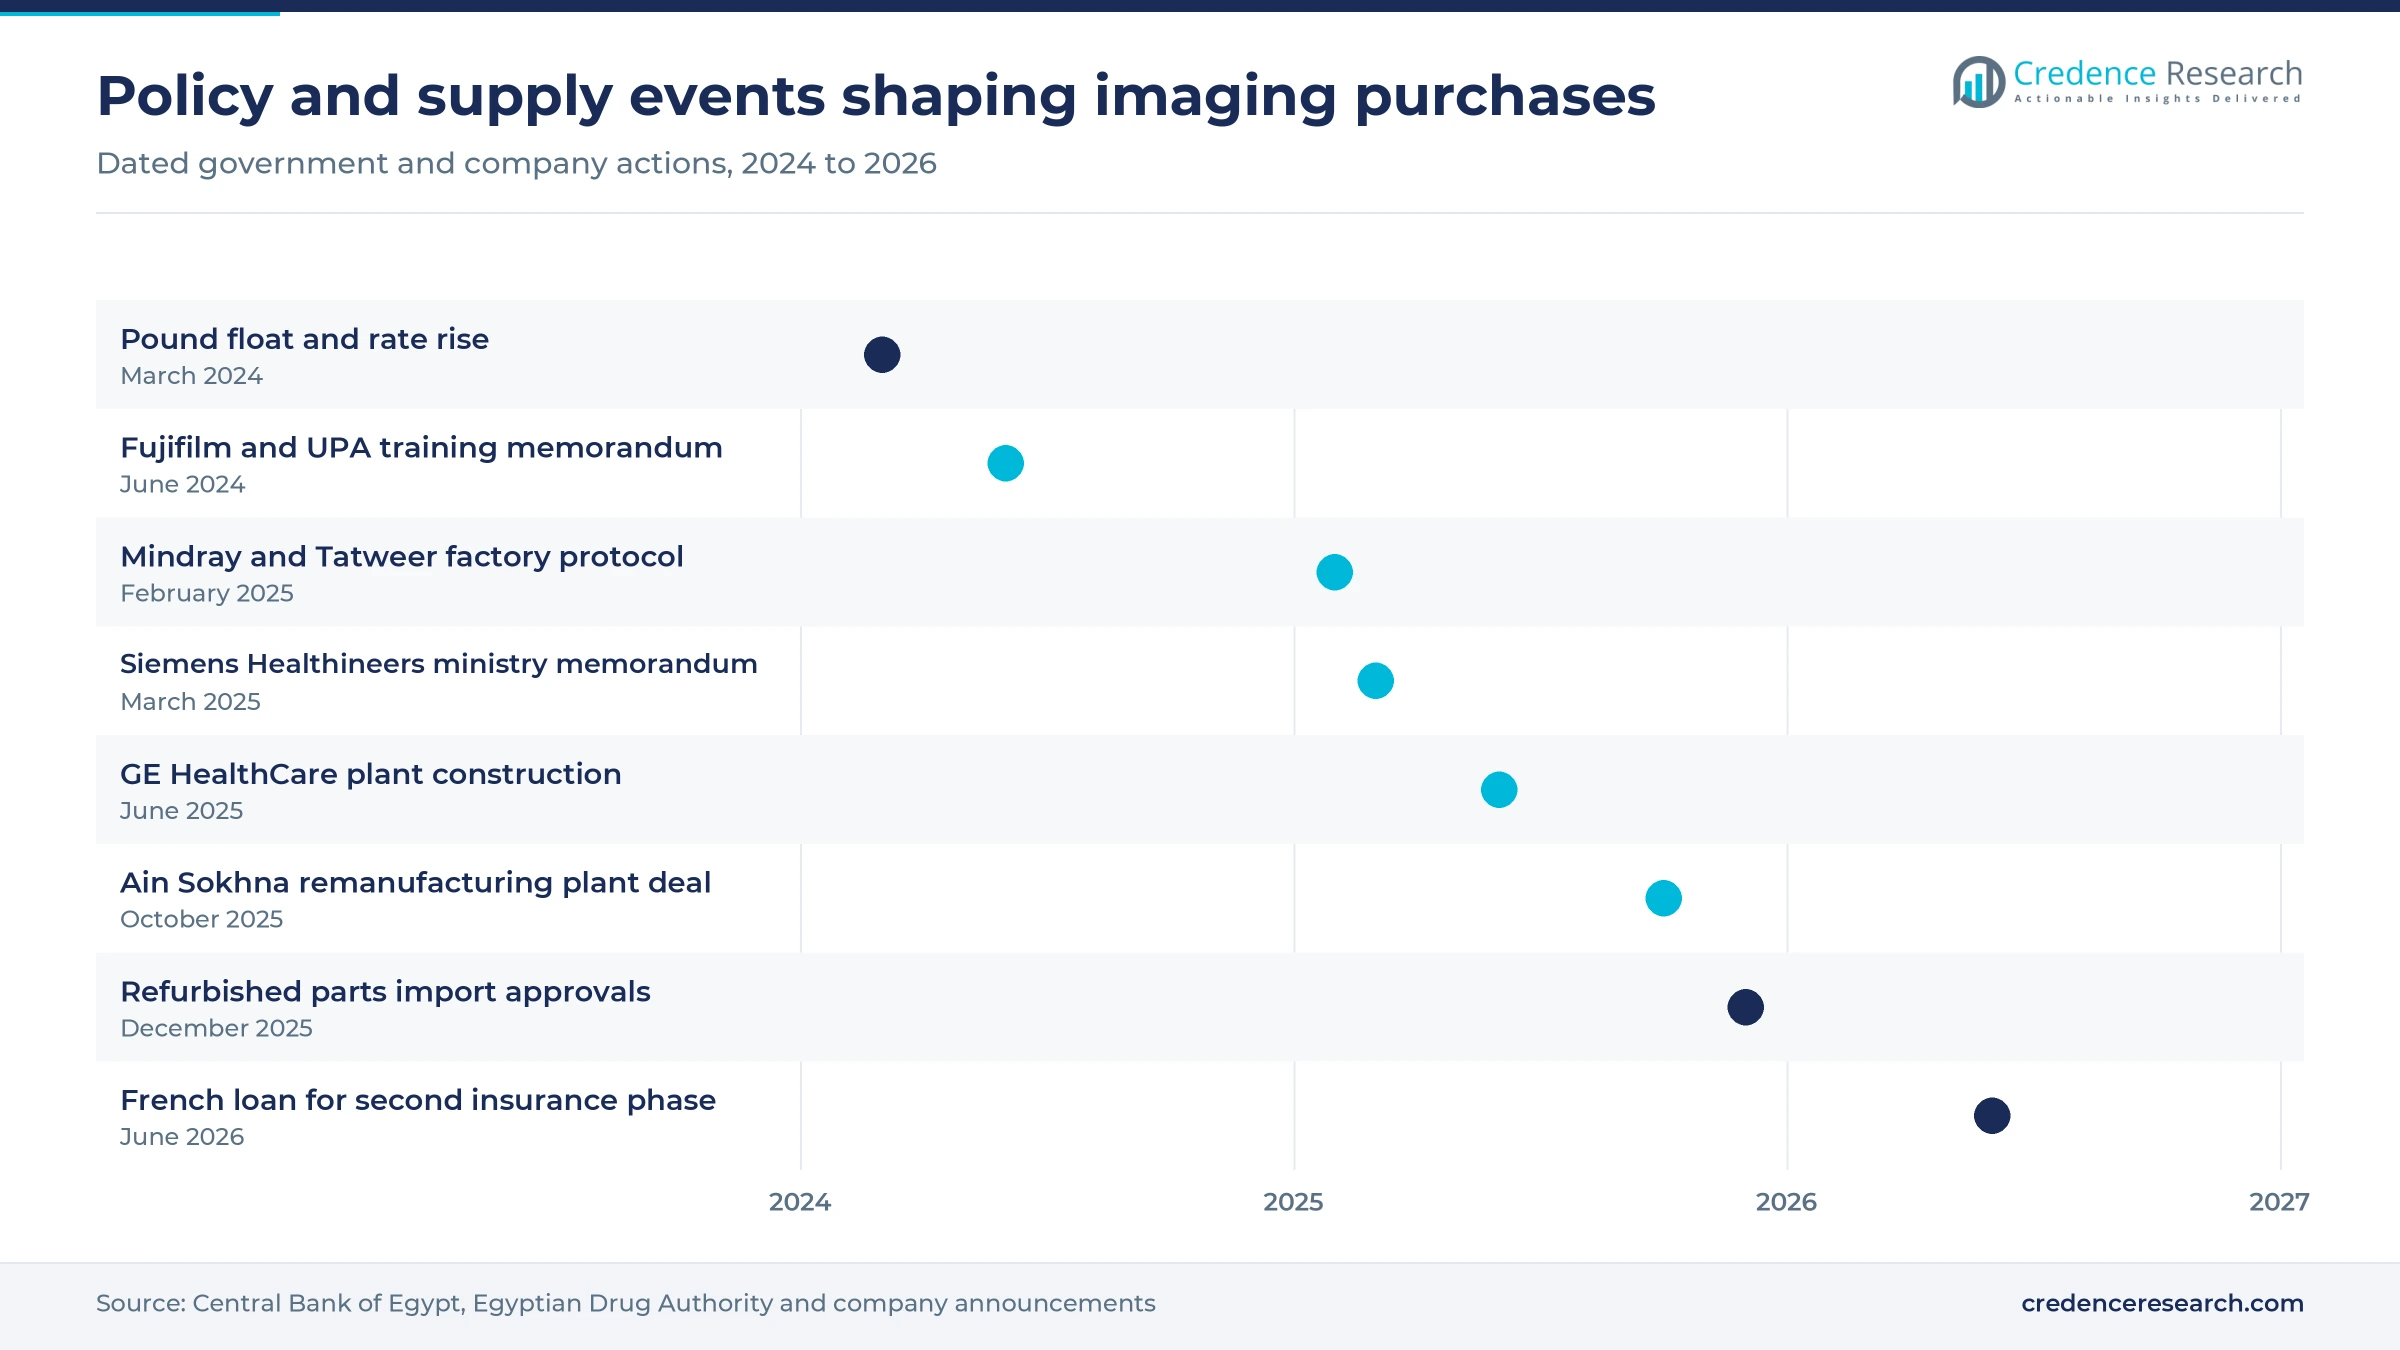
Public hospitals are replacing film and computed radiography with digital rooms that send images to central reading hubs. In March 2025, the Health Ministry signed a memorandum with Siemens Healthineers for a radiology equipment development center, which Arab Finance described as the first of its kind in Egypt and the Middle East. Siemens had already supplied 10 X-ray machines to four hospitals in North Sinai, and the plan links six hospitals to a control and monitoring center. Philips told Daily News Egypt in July 2026 that its Rembra CT can handle up to 270 examinations a day. Throughput per room matters because sites gain capacity without new shielded rooms or staff, which favors computed tomography upgrades over extra rooms.
Local scanner plants change what tenders reward
Local production is the fourth driver, because state buyers now favor devices that are made in Egypt and priced in pounds. Construction began on June 19, 2025, on a GE HealthCare and Al Safi Group plant in 6th of October City designed to make about 2,500 ultrasound devices and 40 to 50 MRI machines a year, according to Amwal Al Ghad. Tatweer Medical Industries and Mindray have started making ultrasound and diagnostic X-ray systems in Badr City, with capacity of about 2,000 and 1,500 units a year, The Middle East Observer reported in July 2026. In April 2025, the Arab African Company for Medical Industries also agreed with China's XGY to build MRI, X-ray and CT scanners locally. Domestic output shortens delivery times and cuts the dollar content of public tenders.
Remote reading and remanufacturing reshape supply
Shift to remote reading and AI triage of scans
Remote reporting is spreading because scanner numbers are growing faster than the pool of radiologists outside Cairo. Rology, a Cairo-based teleradiology platform that uses AI to route and prioritize studies, serves more than 300 hospitals in 13 countries and has delivered more than 1.3 million reports, MEA Tech Watch reported in December 2025. The same month, the Health Ministry signed a memorandum with the Royal College of Radiologists in the U.K. on training and accreditation standards, Daily News Egypt reported. Siemens Healthineers is also discussing a pilot control hub that links several public hospitals. Vendors that pair each scanner with artificial intelligence in healthcare tools and remote reading will win networked contracts more easily than vendors selling standalone rooms.
Rise of remanufactured systems lowers the entry price
Remanufacturing is emerging as a second supply route for hospitals that cannot afford new flagship systems after the 2024 currency float. In October 2025, BMEC Imaging Egypt and Main Development Company signed for a USD 4.5 million plant in the Ain Sokhna industrial zone that will remanufacture CT, MRI, PET-CT, cath lab and linear accelerator systems, Amwal Al Ghad reported. In December 2025, the Egyptian Drug Authority began issuing import approvals for refurbished spare parts, provided an ISO 13485 or Good Refurbishment Practice certificate covers the work. Siemens Healthineers is developing a refurbishment and replacement center in 6th of October City as well. These steps give hospitals a certified middle tier between new imports and aging installed systems.
Opportunity in the five second-phase governorates
The largest near-term opening is the equipment fit-out for the second phase of universal insurance. Minya, Matrouh, Damietta, Kafr El Sheikh and North Sinai are expected to add about 12 million to 13 million beneficiaries, served by 69 hospitals and 669 primary care units, Enterprise reported in August 2026. France's development agency signed a EUR 150 million loan in June 2026, paid in three tranches through 2028, and the World Bank is lending USD 400 million alongside it. Private providers are expected to supply 30% to 40% of hospital beds in the new governorates. Each hospital that seeks a contract needs digital X-ray, ultrasound and usually CT, so suppliers with installation crews in Upper Egypt and the Delta are best placed.
Opportunity to serve Africa from an Egyptian base
Egypt is positioning its new plants and procurement systems as a base for exports to Africa and the Middle East, which gives suppliers more volume than the home market alone. The Unified Procurement Authority launched a national digital procurement portal linked to its MediQ system in December 2025, developed with the Africa Centres for Disease Control and Prevention, The Middle East Observer reported. Tatweer Medical and Mindray plan to invest more than USD 100 million over three years and add eight products to grow from two to ten device categories. Fujifilm, active in Egypt for more than 30 years, opened a Cairo office in October 2024 as a regional hub for training and support. Suppliers that localize service and spare parts in Egypt can serve neighboring markets from the same base.
Currency, import rules and staffing slow purchases
Currency swings keep imported scanners expensive
Most CT, MRI and nuclear systems are still imported and priced in dollars or euros, so the pound sets the real budget. On March 6, 2024, the Central Bank of Egypt let the pound float and raised its key rates by 600 basis points, leaving it near EGP 45 per dollar, Egyptian Streets reported. A hospital budget approved in pounds before the float bought far fewer scanners after it. Buyers respond by delaying orders, splitting tenders or choosing refurbished and locally assembled units.
Strict rules on used equipment narrow low-cost options
Import rules limit how far hospitals can cut costs through second-hand systems. The International Trade Administration's Egypt country guide, updated in November 2025, says imported medical equipment must be brand new and that refurbished goods are not permitted. The spare parts route opened by the drug authority covers certified parts, not complete devices. This keeps the refurbished channel small and tied to local remanufacturing, and it raises the entry price for private clinics that would otherwise import used systems.
Too few trained radiographers outside the main cities
Staff shortages limit how quickly new scanners reach full use. Fujifilm's academy trained more than 500 radiographers and university students across Egypt in 2023, and Siemens Healthineers has proposed training 200 technicians on modern imaging systems, small numbers against the 69 hospitals planned for the second insurance phase. In December 2025, the president of the Egyptian Society of Radiology called for legislation to protect the specialty. Underused rooms weaken the case for new purchases, so suppliers now bundle training into tenders.
Centralized tenders stretch supplier payment cycles
Public purchasing runs largely through one buyer, which gives the state strong price leverage over suppliers. The Unified Procurement Authority board reviewed its 2024/25 accounts in September 2025, including debt settlements tied to loans and letters of credit, Amwal Al Ghad reported. The International Trade Administration also describes the tendering process as not transparent and says the state-owned El Gomhoureya Company dominates medical equipment imports. Suppliers face long payment cycles and price pressure, so many rely on well-funded local partners.
Cairo leads while the governorates grow fastest
| Region | Value, 2025 (USD million) | Share, 2025 | CAGR, 2026–2035 |
|---|---|---|---|
| Cairo | 79.6 | 38.0% | 5.8% |
| Rest of Egypt | 75.4 | 36.0% | 6.8% |
| Giza | 29.3 | 14.0% | 6.3% |
| Alexandria | 25.1 | 12.0% | 6.0% |
Cairo leads on university hospitals and private chains
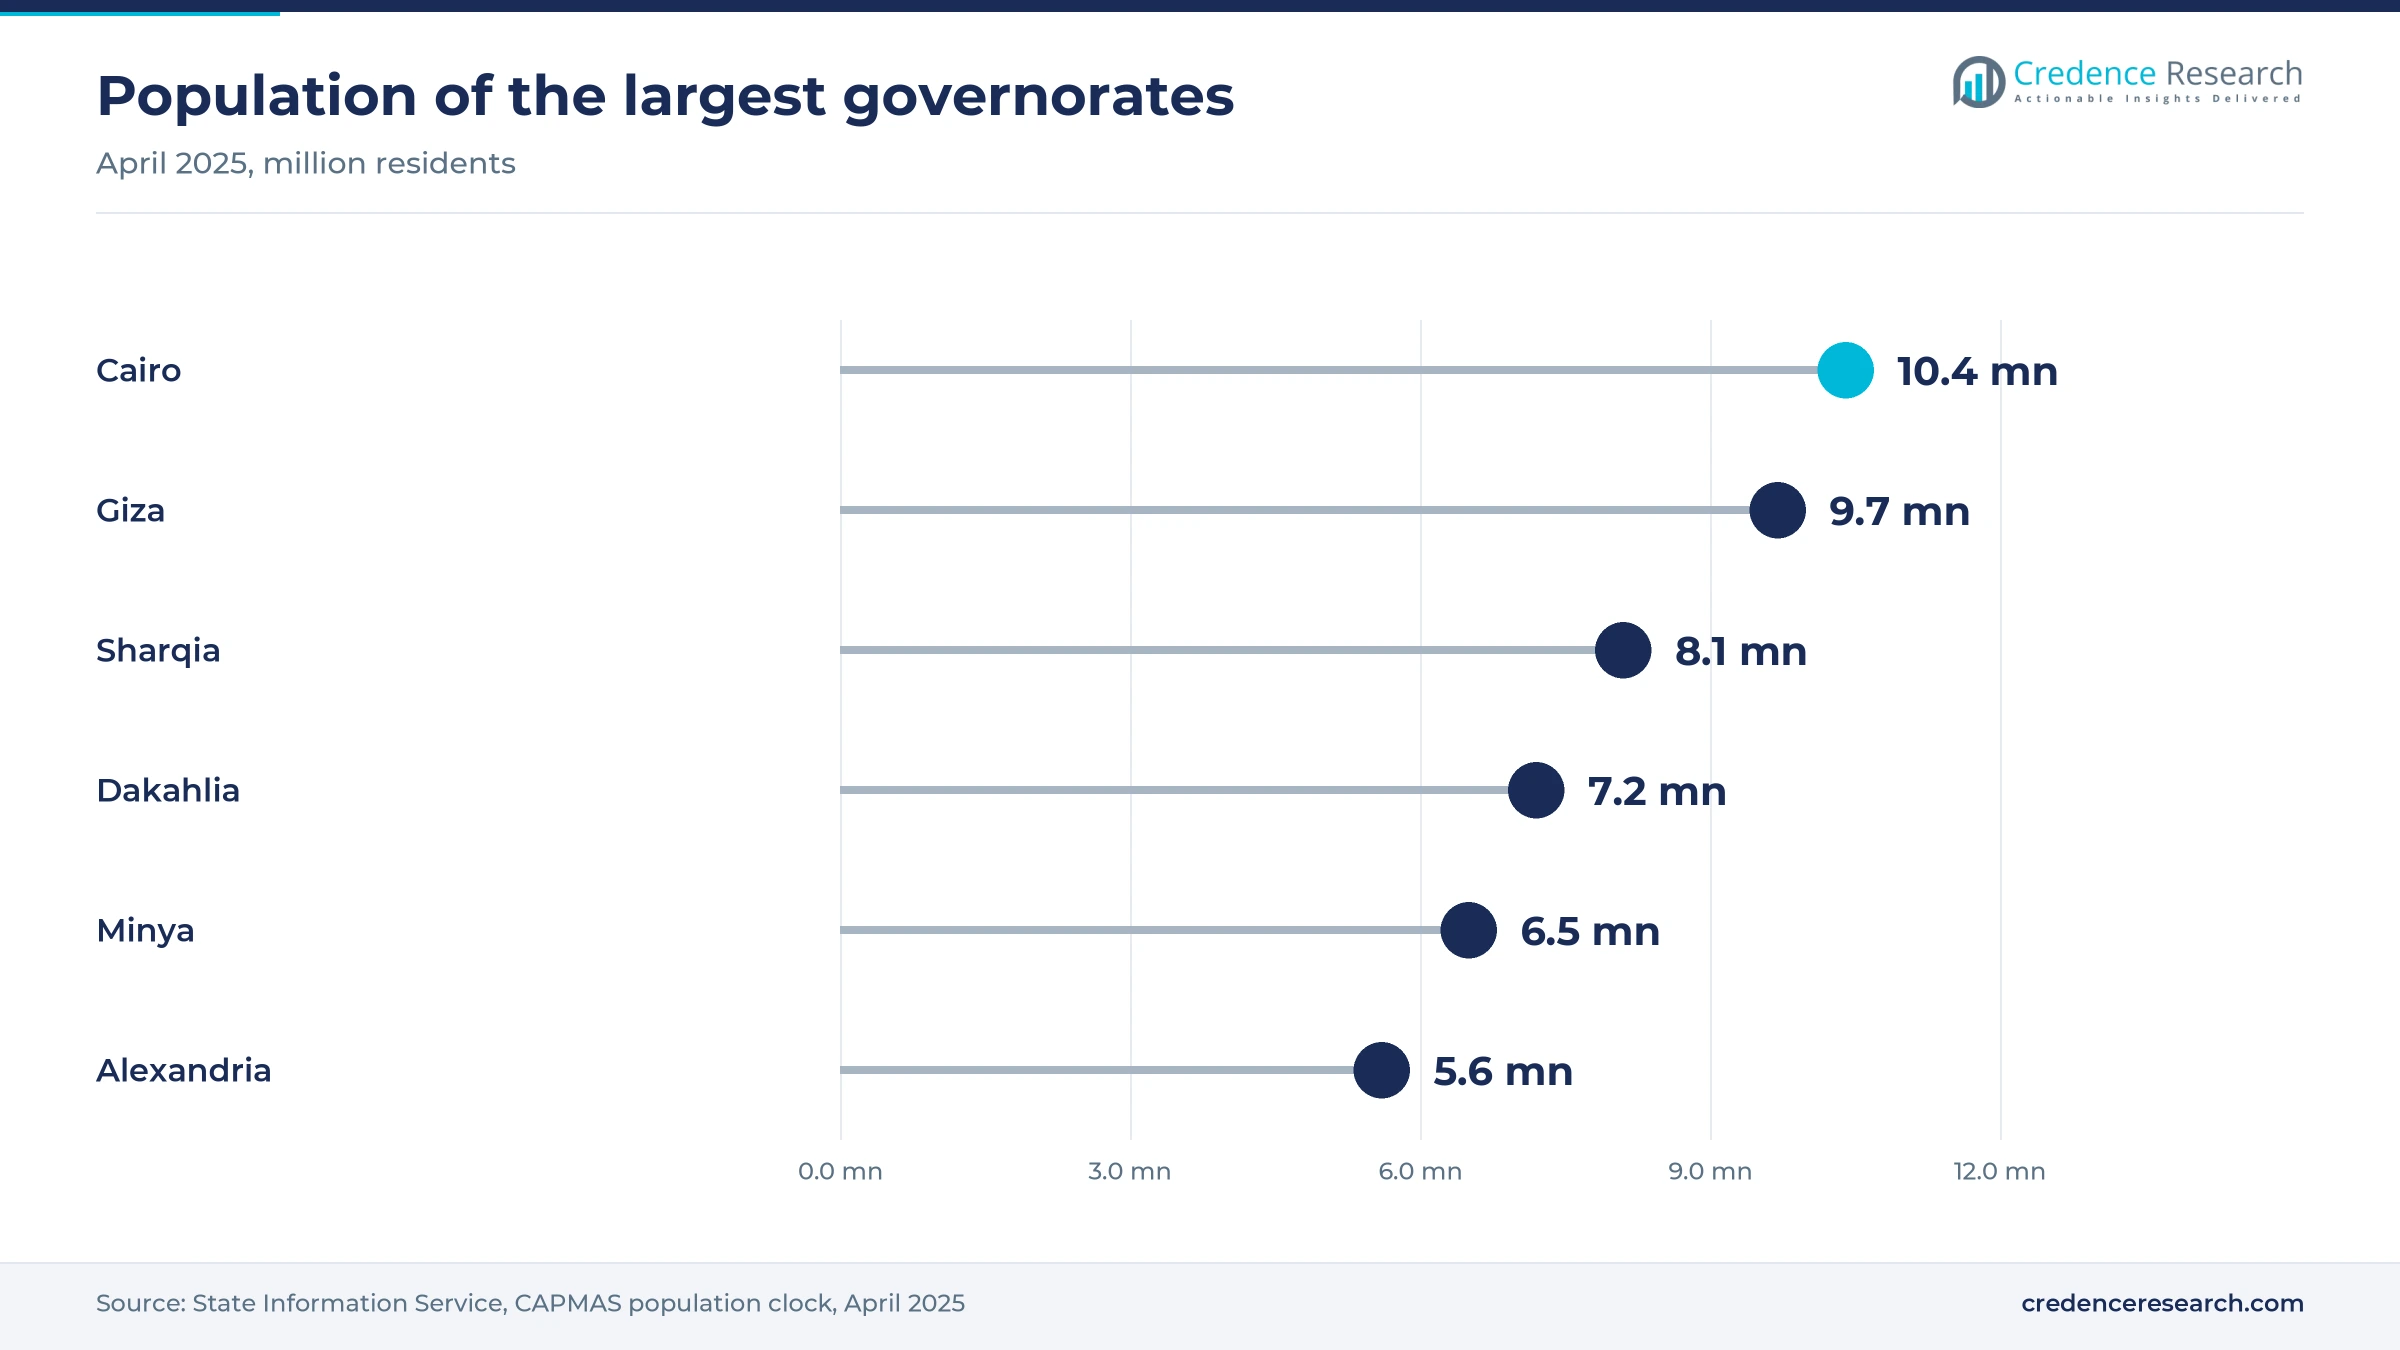
Cairo held 38.0% of 2025 radiology equipment value and grows at 5.8% a year. The capital concentrates university hospitals, private chains and the head offices of every major vendor. The governorate had about 10.4 million residents in April 2025, according to the State Information Service. Fujifilm opened its New Cairo office in October 2024, and the Kasr Al Ainy MRI order noted above shows the size of single university purchases. Growth is slower than elsewhere because the installed base is already dense, so demand leans toward replacement and software upgrades.
The Rest of Egypt gains as insurance moves south and east
The Rest of Egypt held 36.0% of 2025 value and grows fastest at 6.8% a year, as universal insurance reaches governorates far from the capital. All six first-phase governorates, from Port Said to Aswan, lie outside Cairo, Giza and Alexandria, and the second phase includes Minya with about 6.5 million residents. The North Sinai X-ray deliveries noted above show how ministry programs target border and Upper Egypt hospitals. Suppliers here compete on installation reach and service response times rather than flagship features.
Giza combines dense demand with new imaging plants
Giza held 14.0% of 2025 value and grows at 6.3% a year in radiology equipment demand. Its 9.7 million residents and its role as an industrial base for imaging support that growth. The GE HealthCare plant described above is in 6th of October City, which lies in Giza governorate. In July 2024, WHO invited bids to supply and install a 16-slice CT scanner at Umm El Atebaa Hospital in Giza, a typical mid-range public order. Local production nearby should shorten delivery and service times for Giza hospitals.
Alexandria waits on its insurance decision
Alexandria held 12.0% of 2025 value and grows at 6.0% a year in radiology equipment purchases, with demand centered on university hospitals and private groups serving the north coast. The governorate had about 5.6 million residents in April 2025, the State Information Service reported. In December 2025, the government listed Alexandria as under consideration for the second insurance phase, Amwal Al Ghad reported. Inclusion would bring its public hospitals into the accreditation and procurement cycle, and until then private buyers drive most new orders.
Plant, procurement and policy moves from 2024 to 2026
| Development | Status and market relevance |
|---|---|
| In February 2025, Mindray and Tatweer Medical Industries signed a protocol to build Egypt's first ultrasound device factory. | Ultrasound and X-ray production began in Badr City, with deliveries from July 2026 |
| In March 2025, the Ministry of Health and Population signed a memorandum with Siemens Healthineers for a radiology equipment development center. | Planned; links public hospitals to a central control and monitoring center |
| In June 2025, Al Borg Scan completed the purchase of Cairo Ray for Radiotherapy, a 2,000 square meter facility in New Cairo. | Completed; expected to contribute to group results from 2026 |
| In October 2025, BMEC Imaging Egypt and Main Development Company agreed to build a remanufacturing plant in Ain Sokhna. | Agreed; phased investment for remanufactured CT, MRI and PET-CT systems |
| In December 2025, the Egyptian Drug Authority began issuing import approvals for certified refurbished spare parts. | In force; applies to parts that are not standalone devices |
Digital rooms, AI reading and faster MRI raise output
- Digital radiography replaces film and computed radiography in public hospitals, and it lets images move to central reading hubs instead of being printed.
- AI-enabled imaging helps teleradiology platforms such as Rology sort urgent studies first, which matters where few radiologists cover many sites.
- Low-dose CT protocols reduce radiation for cancer patients who are scanned many times during staging, treatment and follow-up.
- Advanced MRI systems such as helium-free sealed magnets and faster reconstruction scan up to three times faster, Philips says, which raises daily patient numbers.
Need a Custom Version of This Report?
Tailor the scope, geography, or segments to your exact requirements.
- Custom geography or segment scope
- Direct access to our analyst team
Global vendors face local plants and Chinese rivals
Competition among radiology equipment suppliers in Egypt splits by modality and by buyer. In CT and MRI, GE HealthCare, Siemens Healthineers and Philips compete for university and insurance hospital tenders on image quality, throughput and service coverage, and all three have discussed local production or refurbishment with the Health Ministry since 2025. Canon Medical Systems and Fujifilm Healthcare compete in CT, X-ray and ultrasound, and Fujifilm adds training through its Cairo office and academy. Tatweer Medical Industries, a subsidiary of El Ezaby Medical, and its technology partner Mindray now compete as local makers of ultrasound and X-ray systems, which helps in tenders that reward domestic content. Hologic in breast imaging, Shimadzu in fluoroscopy and Neusoft Medical Systems in lower-priced CT are specialist alternatives. Price, local content, delivery time and the quality of after-sales service decide most public awards, while private chains also weigh financing and AI software.
How concentrated is the supply side?
Supply is concentrated among a handful of multinational vendors for CT, MRI and nuclear systems, while ultrasound and X-ray are more crowded. GE HealthCare, Siemens Healthineers, Philips, Canon Medical Systems and Fujifilm Healthcare hold the large installed bases in public and university hospitals, usually through local subsidiaries and long-standing agents. Chinese makers compete on price, and Mindray and XGY now make or plan to make systems locally with Egyptian partners. Entry barriers are drug authority registration, tender pre-qualification and a nationwide service network. Margins sit increasingly in service contracts, spare parts, software and training rather than in the initial hardware sale. Competition is fiercest in cross-sectional imaging, which held 40.0% of 2025 demand.
Key imaging system suppliers active in Egypt
| Company | Type | Role in the market |
|---|---|---|
| GE HealthCare | Full-line supplier | CT, MRI, X-ray and ultrasound; building an ultrasound and MRI plant with Al Safi Group |
| Siemens Healthineers | Full-line supplier | CT, MRI, X-ray and mammography; development center agreement with the Health Ministry |
| Philips | Full-line supplier | CT, MRI, ultrasound and refurbished Circular Edition systems; studying local production |
| Canon Medical Systems | Full-line supplier | CT, MRI, X-ray and ultrasound systems for hospitals and imaging centers |
| Fujifilm Healthcare | Full-line supplier | X-ray, CT, MRI, ultrasound and imaging IT; Cairo office and training academy |
| Mindray | Local manufacturing partner | Ultrasound and diagnostic X-ray systems made with Tatweer Medical Industries in Badr City |
| Tatweer Medical Industries (El Ezaby Medical) | Local manufacturer | Ultrasound and diagnostic X-ray systems made in Badr City under government supply contracts |
| Hologic | Specialist | Mammography and breast tomosynthesis systems and biopsy guidance |
| Neusoft Medical Systems | Specialist | Lower-priced CT and MRI systems for cost-sensitive public and private buyers |
| Shimadzu | Specialist | Fluoroscopy, general radiography and angiography systems |
Credence Research view on Egyptian imaging demand
Credence Research's view is that Egypt's imaging demand will be driven less by private luxury purchases and more by the state's need to equip insured hospitals outside Cairo. Each new governorate in the insurance system creates a wave of X-ray, ultrasound and CT orders, and local plants will capture much of the lower end. Multinational vendors keep the advantage in MRI, advanced CT and nuclear systems, where service quality and uptime matter most. Suppliers that offer local assembly, certified refurbishment, training and financing in one package are best placed to win as budgets stay tight in pounds.
Unit demand, prices and tenders anchor the estimate
The report uses 2025 as the base year and forecasts to 2035. Market values come from the Credence Research model, which combines annual unit demand by modality with typical prices from published tenders and hospital orders, and checks the 2025 radiology equipment value against government health spending and insurance rollout plans. Segment and regional splits are Credence Research estimates based on population, hospital locations and procurement patterns. Sources include the International Agency for Research on Cancer, Egyptian government and authority statements, company announcements and reputable Egyptian business media. No interviews or surveys were conducted by Credence Research for this edition.
Governorate hospitals and oncology gain to 2035
The market is expected to grow from USD 229.0 million in 2026 to USD 395.8 million by 2035 as universal insurance spreads across the country. The Rest of Egypt gains share fastest, because new insurance governorates need complete imaging departments rather than single replacements. Nuclear and molecular imaging grows fastest among product types at 7.6% a year to 2035. Diagnostic imaging centers and refurbished channels also grow faster than the market, while Cairo and public hospitals keep the largest absolute purchases. Local assembly will lower prices for ultrasound and X-ray over the period, and growth in value will depend increasingly on CT, MRI and service.
Insurance timing decides the range of outcomes
The spread between the cases depends mainly on when the second insurance phase starts and on the pound. A stable currency and an on-time rollout keep public tenders moving, while a new devaluation would push hospitals toward refurbished and locally built units and delay CT and MRI orders. Local production of CT and MRI by the multinational vendors would lower prices but raise unit volumes, which supports the upside case. The base case keeps the 6.27% CAGR through 2035, with demand led by insured hospitals in the new governorates.
| Scenario | CAGR, 2026–2035 | Value, 2035 | What has to hold |
|---|---|---|---|
| Downside | 5.1% | USD 357.4 million | A renewed pound slide and a delayed second phase push public tenders back to 2028 |
| Base | 6.27% | USD 395.8 million | The second phase starts on schedule and local plants deliver ultrasound and X-ray as planned |
| Upside | 7.3% | USD 430.7 million | Alexandria joins the second phase and multinational vendors begin local CT and MRI production |
Frequently Asked Questions
How big is the Egypt radiology equipment market?
Which region leads the market?
Which product type has the largest share?
How does universal health insurance affect demand?
Are imaging systems made locally in Egypt?
Can hospitals buy refurbished imaging equipment?
What are the main challenges for suppliers?
Who are the leading suppliers in the market?
Table of Content
Chapter 1 Market Segmentation
- 1.1 Segmentation Framework
- 1.1.1 Product and Service Classification
- 1.1.2 Application and End-Use Classification
- 1.1.3 Technology and Solution Classification
- 1.1.4 Customer and Distribution Channel Classification
- 1.1.5 Geographic Segmentation
- 1.1.6 Market Segment Definitions and Boundaries
- 1.2 By Product Type
- 1.2.1 Cross-Sectional Imaging
- 1.2.2 X-Ray and Breast Imaging
- 1.2.3 Ultrasound Imaging
- 1.2.4 Nuclear and Molecular Imaging
- 1.3 By Care Setting
- 1.3.1 Public Hospitals
- 1.3.2 Private Hospitals
- 1.3.3 Diagnostic Imaging Centers
- 1.3.4 Ambulatory and Specialty Clinics
- 1.4 By Disease Area
- 1.4.1 Oncology
- 1.4.2 Cardiovascular Disease
- 1.4.3 Musculoskeletal and Trauma
- 1.4.4 Neurology
- 1.5 By Channel
- 1.5.1 Public Tenders
- 1.5.2 Direct OEM Sales
- 1.5.3 Authorized Distributors
- 1.5.4 Refurbished Equipment Channels
Chapter 2 Introduction
- 2.1 Report Objectives and Scope
- 2.2 Product Definition and Industry Terminology
- 2.3 Market Inclusions and Exclusions
- 2.4 Research Process
- 2.4.1 Primary Research and Expert Interviews
- 2.4.2 Secondary Research and Source Review
- 2.4.3 Top-Down and Bottom-Up Estimation
- 2.4.4 Data Triangulation and Verification
- 2.5 Market Size Measurement Basis
- 2.5.1 2025: USD 209.5 million → 2035: USD 395.8 million
- 2.6 Historical and Forecast Reference Periods
- 2.6.1 Historical Period: 2018-2025
- 2.6.2 Base Year: 2025
- 2.6.3 Forecast Period: 2025-2035
- 2.7 Research Assumptions and Limitations
Chapter 3 Executive Summary
- 3.1 Market Snapshot and Key Findings
- 3.2 Base-Year Market Size, 2025
- 3.3 Forecast Market Size, 2035
- 3.4 Revenue and Volume Growth Outlook
- 3.5 Key Demand and Supply Indicators
- 3.6 Leading Market Segments
- 3.7 Fastest-Growing Market Opportunities
- 3.8 Regional Performance Highlights
- 3.9 Technology and Industry Transformation
- 3.10 Competitive Landscape Summary
- 3.11 Analyst View and Strategic Implications
Chapter 4 Egypt Radiology Equipment Market Trends and Developments
- 4.1 Historical Industry Development, 2018-2025
- 4.2 Recent Market Trends and Developments
- 4.3 Demand and Customer Behavior Trends
- 4.4 Technology and Product Innovation
- 4.5 Artificial Intelligence, Automation and Digitalization
- 4.6 Local Manufacturing and Supply Chain Realignment
- 4.7 Industry Partnerships, Mergers and Acquisitions
- 4.8 Sustainability and Circular Economy Developments
- 4.9 Government and Private Sector Investment Trends
- 4.10 Emerging Business Models and Commercialization
- 4.11 Industry Developments and Announcements
Chapter 5 Egypt Radiology Equipment Market Production, Supply and Demand Analysis
- 5.1 Demand Trend and Consumption Analysis, 2018-2025
- 5.2 Demand Forecast, 2025-2035
- 5.3 Production and Output Trend, 2018-2025
- 5.4 Production and Output Forecast, 2025-2035
- 5.5 Installed Capacity and Capacity Utilization
- 5.6 Company-Wise Production Plants and Statistics
- 5.6.1 Installed Production Capacity
- 5.6.2 Actual Production
- 5.6.3 Planned Capacity and Expansion Targets
- 5.7 Supply Chain Structure and Procurement Trends
- 5.8 Supply-Demand Gap and Bottlenecks
- 5.9 Import Dependence and Sourcing Structure
- 5.10 Contract Manufacturing and Outsourcing
- 5.11 Regional Supply and Demand Concentration
Chapter 6 Egypt Radiology Equipment Market Pricing Analysis
- 6.1 Pricing Structure and Measurement
- 6.2 Historical Pricing Trends, 2018-2025
- 6.3 Pricing Outlook, 2025-2035
- 6.4 Average Selling Price and Unit Economics
- 6.5 Pricing by Product and Market Segment
- 6.6 Geographic Pricing Differences
- 6.7 Key Input, Energy, Labor and Logistics Costs
- 6.8 Contract Pricing and Purchasing Models
- 6.9 Pricing Sensitivity and Competitive Positioning
- 6.10 Price, Margin and Profitability Implications
Chapter 7 Egypt Radiology Equipment Market Dynamics
- 7.1 Market Growth Drivers
- 7.1.1 Demand-Side Drivers
- 7.1.2 Technology and Innovation Drivers
- 7.1.3 Infrastructure and Investment Drivers
- 7.1.4 Regulatory and Policy Drivers
- 7.2 Market Restraints
- 7.2.1 Cost and Affordability Constraints
- 7.2.2 Technology and Adoption Barriers
- 7.2.3 Supply Chain and Operational Constraints
- 7.3 Market Challenges
- 7.3.1 Competitive Pressure and Margin Erosion
- 7.3.2 Skills, Infrastructure and Implementation Gaps
- 7.4 Emerging Market Opportunities
- 7.5 Market Dynamics Impact and Time-Horizon Assessment
Chapter 8 Egypt Radiology Equipment Value Chain Analysis
- 8.1 Industry Value Chain Overview
- 8.2 Upstream Suppliers and Critical Inputs
- 8.3 Technology and Component Providers
- 8.4 Manufacturing or Service Delivery
- 8.5 Distribution, Channel Partners and Integrators
- 8.6 Downstream Applications and End Users
- 8.7 Value Addition and Profit Pools
- 8.8 Vertical Integration and Outsourcing
- 8.9 Supplier Concentration and Risk
- 8.10 Supply Chain Localization and Resilience
Chapter 9 Egypt Radiology Equipment Market Regulations and Policies
- 9.1 Relevant Laws, Standards and Compliance Frameworks
- 9.2 Product, Service, Safety and Quality Requirements
- 9.3 Government Policies, Incentives and Subsidies
- 9.4 Imports, Exports and Trade Barriers
- 9.5 Public Procurement and Local Content Requirements
- 9.6 Environmental and Sustainability Compliance
- 9.7 Upcoming Policy Changes and Market Implications
Chapter 10 Egypt Radiology Equipment Market Hotspots and Opportunities
- 10.1 Market Opportunity Mapping and Growth Hotspots
- 10.2 High-Growth Applications and Customer Groups
- 10.3 Underserved Markets and White-Space Opportunities
- 10.4 Emerging Technology and Product Opportunities
- 10.5 New Capacity and Investment Hotspots
- 10.6 Market Entry and Expansion Opportunities
- 10.7 Distribution and Partnership Opportunities
- 10.8 Near-Term and Long-Term Commercial Potential
- 10.9 Opportunity Attractiveness and Execution Risks
Chapter 11 Egypt Radiology Equipment Market Outlook, 2025-2035
- 11.1 Market Size and Analysis
- 11.1.1 Revenue (Market Measurement: 2025: USD 209.5 million → 2035: USD 395.8 million)
- 11.1.2 Market Volume and Quantity Sold
- 11.1.3 Historical Market Size, 2018-2025
- 11.1.4 Base-Year Market Size, 2025
- 11.2 Market Forecast, 2025-2035
- 11.2.1 Revenue Forecast to 2035
- 11.2.2 Volume Forecast to 2035
- 11.2.3 CAGR and Year-on-Year Growth
- 11.2.4 Incremental Revenue Opportunity
- 11.3 Forecast Assumptions and Scenario Analysis
- 11.3.1 Base-Case Forecast
- 11.3.2 Optimistic and Conservative Scenarios
- 11.3.3 Technology, Pricing and Policy Sensitivities
- 11.4 Market Attractiveness and Growth Outlook
Chapter 12 Egypt Radiology Equipment Market Segmentation and Outlook
- 12.1 Segmentation Summary and Market Shares, 2025
- 12.2 Largest and Fastest-Growing Segments
- 12.3 By Product Type - Market Size and Forecast, 2025-2035
- 12.3.1 Segment Definition and Scope
- 12.3.2 Historical Market Size, 2018-2025
- 12.3.3 Revenue Forecast, 2025-2035
- 12.3.4 Volume Forecast, 2025-2035
- 12.3.5 Base-Year Market Share, 2025
- 12.3.6 Segment CAGR and Growth Drivers
- 12.3.7 Subsegment Market Size and Forecast
- 12.3.7.1 Cross-Sectional Imaging
- 12.3.7.2 X-Ray and Breast Imaging
- 12.3.7.3 Ultrasound Imaging
- 12.3.7.4 Nuclear and Molecular Imaging
- 12.3.8 Subsegment Pricing and Adoption Trends
- 12.3.9 Leading Suppliers and Competition
- 12.3.10 Regional Demand and Opportunities
- 12.4 By Care Setting - Market Size and Forecast, 2025-2035
- 12.4.1 Segment Definition and Scope
- 12.4.2 Historical Market Size, 2018-2025
- 12.4.3 Revenue Forecast, 2025-2035
- 12.4.4 Volume Forecast, 2025-2035
- 12.4.5 Base-Year Market Share, 2025
- 12.4.6 Segment CAGR and Growth Drivers
- 12.4.7 Subsegment Market Size and Forecast
- 12.4.7.1 Public Hospitals
- 12.4.7.2 Private Hospitals
- 12.4.7.3 Diagnostic Imaging Centers
- 12.4.7.4 Ambulatory and Specialty Clinics
- 12.4.8 Subsegment Pricing and Adoption Trends
- 12.4.9 Leading Suppliers and Competition
- 12.4.10 Regional Demand and Opportunities
- 12.5 By Disease Area - Market Size and Forecast, 2025-2035
- 12.5.1 Segment Definition and Scope
- 12.5.2 Historical Market Size, 2018-2025
- 12.5.3 Revenue Forecast, 2025-2035
- 12.5.4 Volume Forecast, 2025-2035
- 12.5.5 Base-Year Market Share, 2025
- 12.5.6 Segment CAGR and Growth Drivers
- 12.5.7 Subsegment Market Size and Forecast
- 12.5.7.1 Oncology
- 12.5.7.2 Cardiovascular Disease
- 12.5.7.3 Musculoskeletal and Trauma
- 12.5.7.4 Neurology
- 12.5.8 Subsegment Pricing and Adoption Trends
- 12.5.9 Leading Suppliers and Competition
- 12.5.10 Regional Demand and Opportunities
- 12.6 By Channel - Market Size and Forecast, 2025-2035
- 12.6.1 Segment Definition and Scope
- 12.6.2 Historical Market Size, 2018-2025
- 12.6.3 Revenue Forecast, 2025-2035
- 12.6.4 Volume Forecast, 2025-2035
- 12.6.5 Base-Year Market Share, 2025
- 12.6.6 Segment CAGR and Growth Drivers
- 12.6.7 Subsegment Market Size and Forecast
- 12.6.7.1 Public Tenders
- 12.6.7.2 Direct OEM Sales
- 12.6.7.3 Authorized Distributors
- 12.6.7.4 Refurbished Equipment Channels
- 12.6.8 Subsegment Pricing and Adoption Trends
- 12.6.9 Leading Suppliers and Competition
- 12.6.10 Regional Demand and Opportunities
- 12.7 Segment Growth Comparison
- 12.8 Segment Attractiveness and Priority Matrix
Chapter 13 Egypt Radiology Equipment Geographic Market Outlook, 2025-2035
- 13.1 Domestic Market Distribution and Demand Clusters
- 13.2 State- or Province-Wise Market Size and Forecast, 2025-2035
- 13.3 City and Metropolitan Market Outlook
- 13.4 Industrial, Manufacturing and Commercial Clusters
- 13.5 Geographic Concentration of Key End Users
- 13.6 Local Pricing and Purchasing Differences
- 13.7 Domestic Production Facilities and Capacity Map
- 13.8 Local Infrastructure and Project Pipeline
- 13.9 State-Level Policy and Incentive Differences
- 13.10 Subnational Investment Hotspots and Opportunities
- 13.11 Distribution and Logistics Networks
- 13.12 Domestic Competitive Footprint
Chapter 14 Egypt Radiology Equipment Technology, Innovation and Sustainability Outlook
- 14.1 Technology Landscape and Maturity
- 14.2 Product, Process and Service Innovation
- 14.3 AI, Automation and Digital Tools in the Industry
- 14.4 Technology Adoption and Performance Benchmarking
- 14.5 Innovation Pipeline and R&D Investment
- 14.6 Patent and Intellectual Property Trends
- 14.7 Energy Efficiency and Resource Management
- 14.8 Sustainability, Recycling and Circularity
- 14.9 Technology Roadmap, 2025-2035
- 14.10 Risks of Obsolescence and Technology Substitution
Chapter 15 Egypt Radiology Equipment Market Key Strategic Imperatives
- 15.1 Growth and Market Entry Priorities
- 15.2 High-Return Products and Segments
- 15.3 Pricing, Profitability and Cost Optimization
- 15.4 Technology Investment and Product Differentiation
- 15.5 Supply Chain Localization and Resilience
- 15.6 Distribution and Customer Acquisition
- 15.7 Partnership, Acquisition and Capacity Strategy
- 15.8 Regional Expansion Priorities
- 15.9 Short-, Medium- and Long-Term Actions
Chapter 16 Competition Outlook
- 16.1 Industry Competition Characteristics
- 16.2 Market Structure and Concentration
- 16.3 Market Share and Competitive Positioning, 2025
- 16.4 Company-Wise Revenue and Product Benchmarking
- 16.5 Production and Service Capacity Benchmarking
- 16.6 Technology, Pricing and Differentiation
- 16.7 Regional Footprint and Distribution Strength
- 16.8 Mergers, Acquisitions and Strategic Alliances
- 16.9 New Entrants and Competitive Threats
- 16.10 Porter's Five Forces and Industry Attractiveness
- 16.11 Competitive Outlook, 2025-2035
Chapter 17 Company Profiles
- 17.1 Company Coverage and Selection Criteria
- 17.2 GE HealthCare
- 17.2.1 Business Description
- 17.2.2 Company Ownership and Geographic Presence
- 17.2.3 Product and Service Portfolio
- 17.2.4 Manufacturing and Operating Footprint
- 17.2.5 Production Capacity and Expansion Plans
- 17.2.6 Financial Performance and Investment
- 17.2.7 Market Share and Competitive Position
- 17.2.8 Technology and Innovation Capabilities
- 17.2.9 Strategic Alliances or Partnerships
- 17.2.10 Recent Developments
- 17.2.11 Growth Strategy and Outlook
- 17.3 Siemens Healthineers
- 17.4 Philips
- 17.5 Canon Medical Systems
- 17.6 Fujifilm Healthcare
- 17.7 Mindray
- 17.8 Tatweer Medical Industries (El Ezaby Medical)
- 17.9 Hologic
- 17.10 Neusoft Medical Systems
- 17.11 Shimadzu
- 17.12 Other Relevant Market Participants
Note: Every listed company is profiled on the structure shown under the first company. The company list is preliminary and may change based on research findings, market developments, data availability and client requirements.
Chapter 18 Disclaimer
- 18.1 Research and Forecast Disclaimer
- 18.2 Data Source and Estimation Limitations
Note: The depth of individual sections depends on data availability for this market. Volume, capacity, trade and other unit-based metrics are included where applicable.