USA biosensors demand rests on wearable glucose sensors
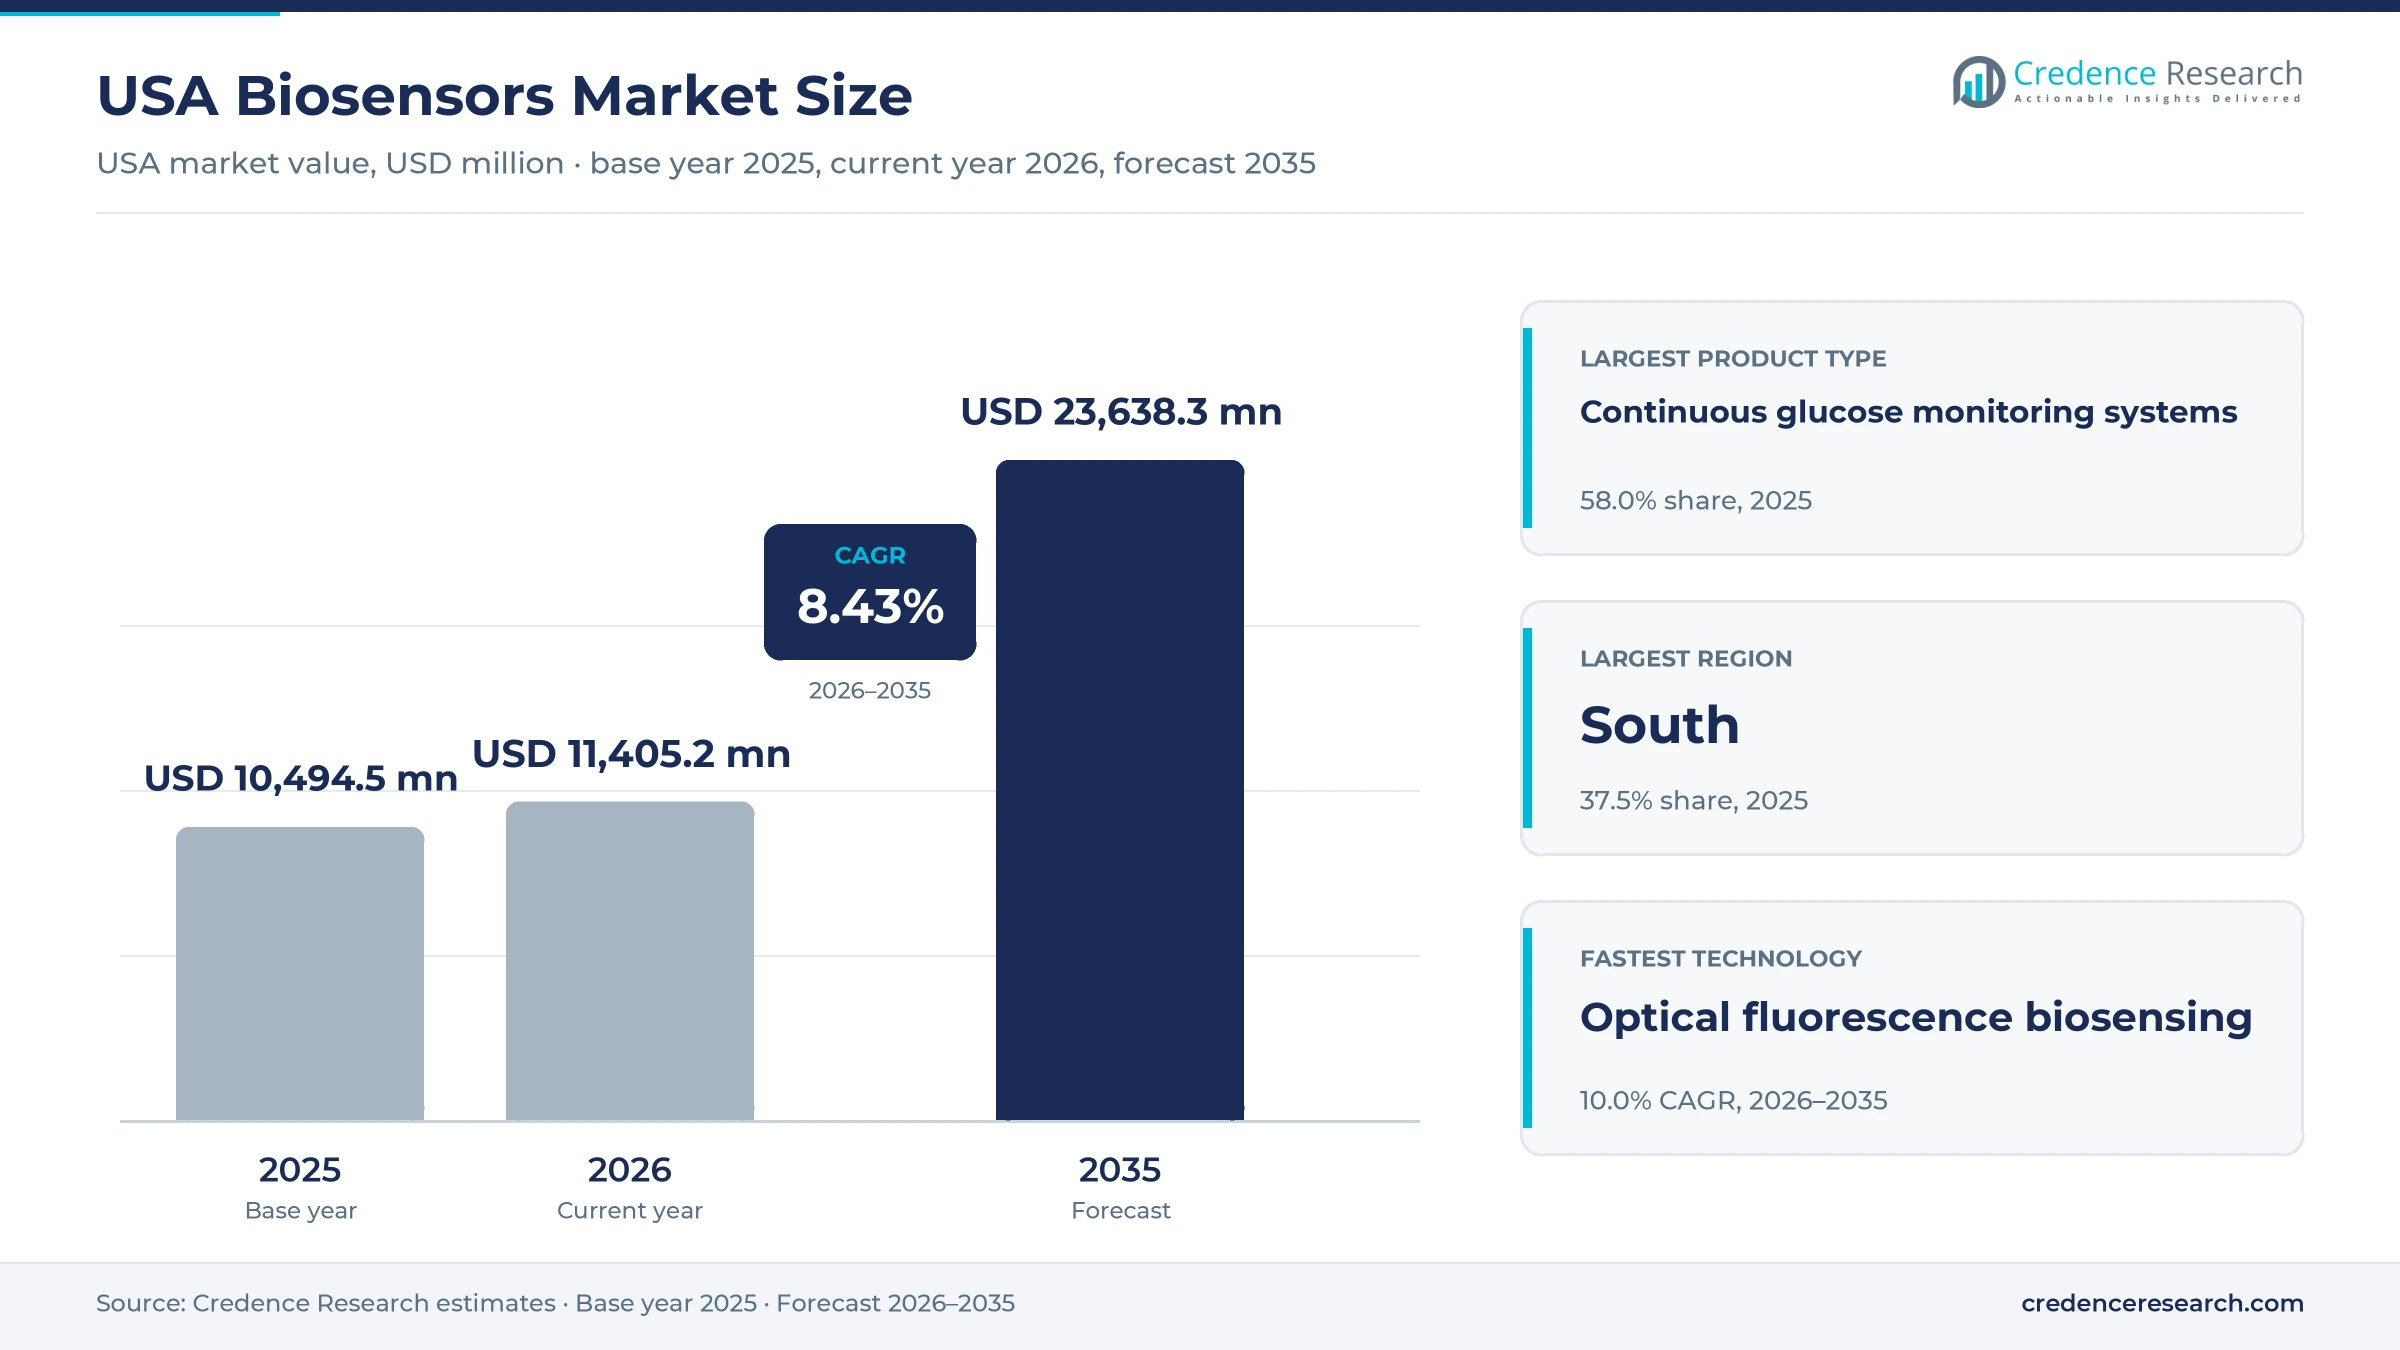
The USA biosensors market was valued at USD 10.49 billion in 2025 and is projected to increase from USD 11.41 billion in 2026 to USD 23.64 billion by 2035, registering a CAGR of 8.43% during 2026–2035. Demand comes mainly from people with diabetes who replace a wearable glucose sensor every two weeks or test with fingerstick strips several times a day, with hospitals, research laboratories and bioprocess plants adding a smaller but steady base. The South held the largest regional share, 37.5% in 2025, because it is the most populous Census region and is still adding residents, while it is also the fastest-growing region at 8.8% a year. Pharmacies and durable medical equipment suppliers move most sensors to patients, and over-the-counter sensors now reach buyers without a prescription. The most important commercial change is the federal decision to move continuous glucose monitors into Medicare competitive bidding with a monthly rental payment from 2028, which will reshape supplier margins.
Glucose wearables carry most of the value in this market
The market counts devices that pair a biological recognition element, such as an enzyme or antibody, with a transducer that turns a binding or reaction into a signal. It covers continuous glucose monitors, fingerstick strips and meters, point-of-care cartridges for blood chemistry and injury markers, and laboratory and process systems that measure molecular binding or culture metabolites. Patients buy through pharmacies and medical equipment suppliers, while hospitals and laboratories buy direct or through distributors.
The count excludes insulin pumps, smartphone apps sold on their own, central laboratory analyzers that do not use a biosensing element, and the fees that clinicians charge to interpret results. Value sits with sensor makers, which control chemistry and manufacturing, and with the pharmacies and suppliers that hold patient relationships.
USA Biosensors Market Insights
- The USA biosensors market rises from USD 10.49 billion in 2025 to USD 23.64 billion by 2035, growing at 8.43% a year as wearable glucose sensing spreads beyond insulin users.
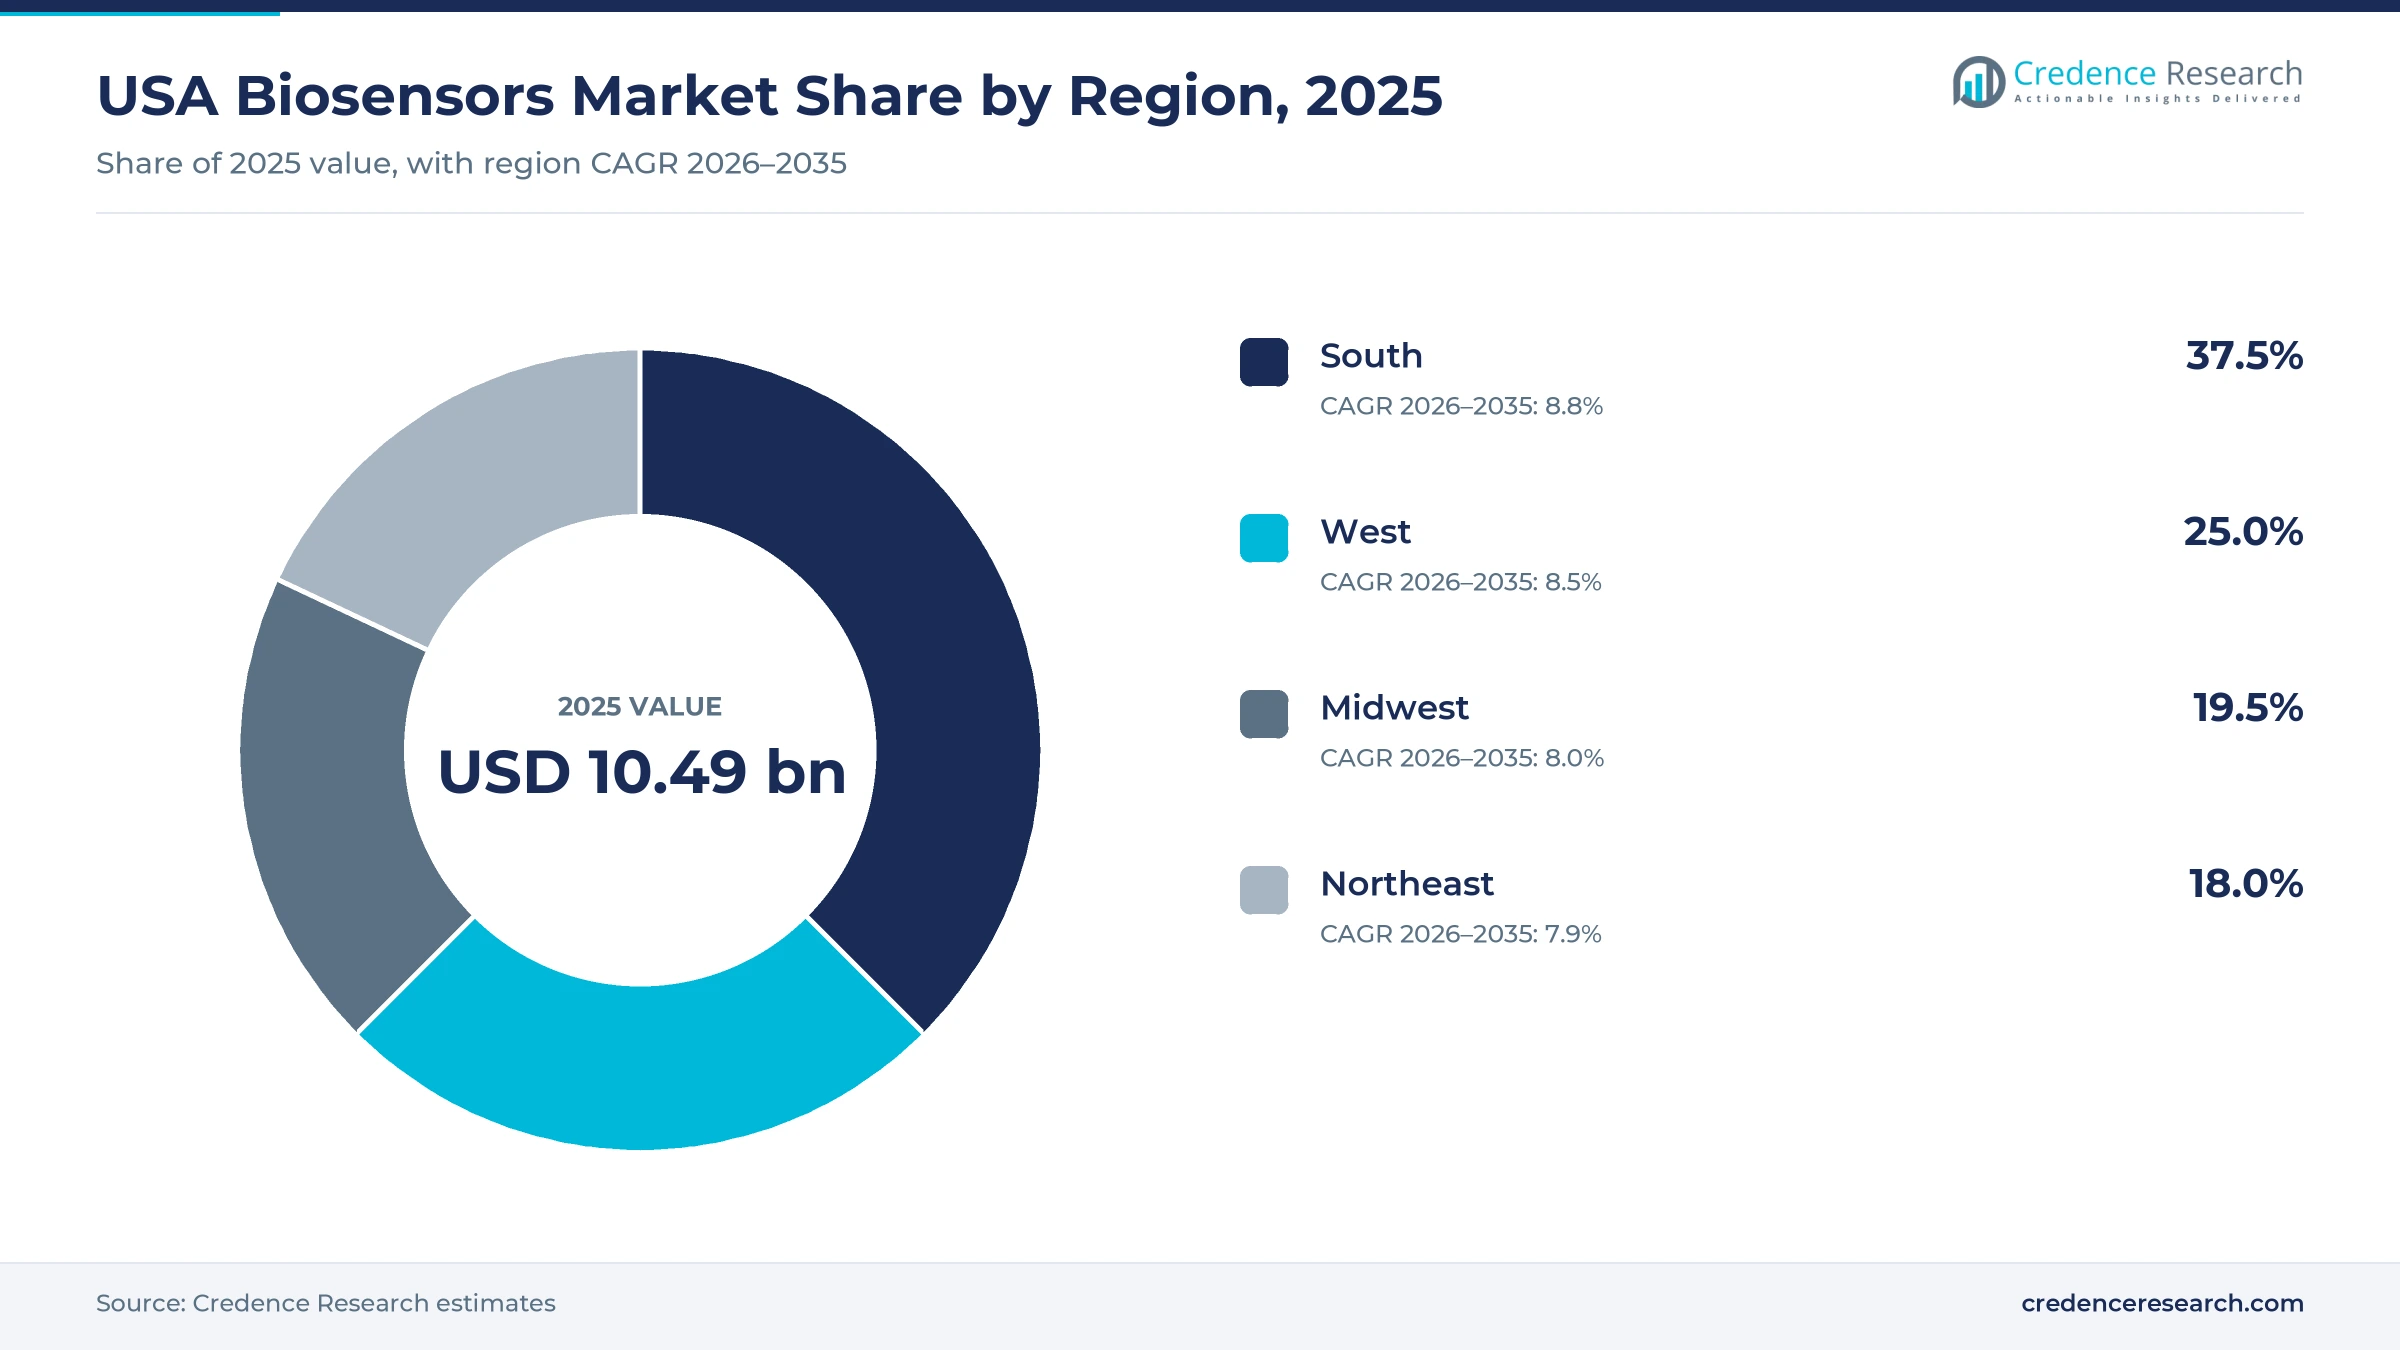
- The South held 37.5% of 2025 value, the largest share of any region, and it is also the fastest-growing region at 8.8% a year.
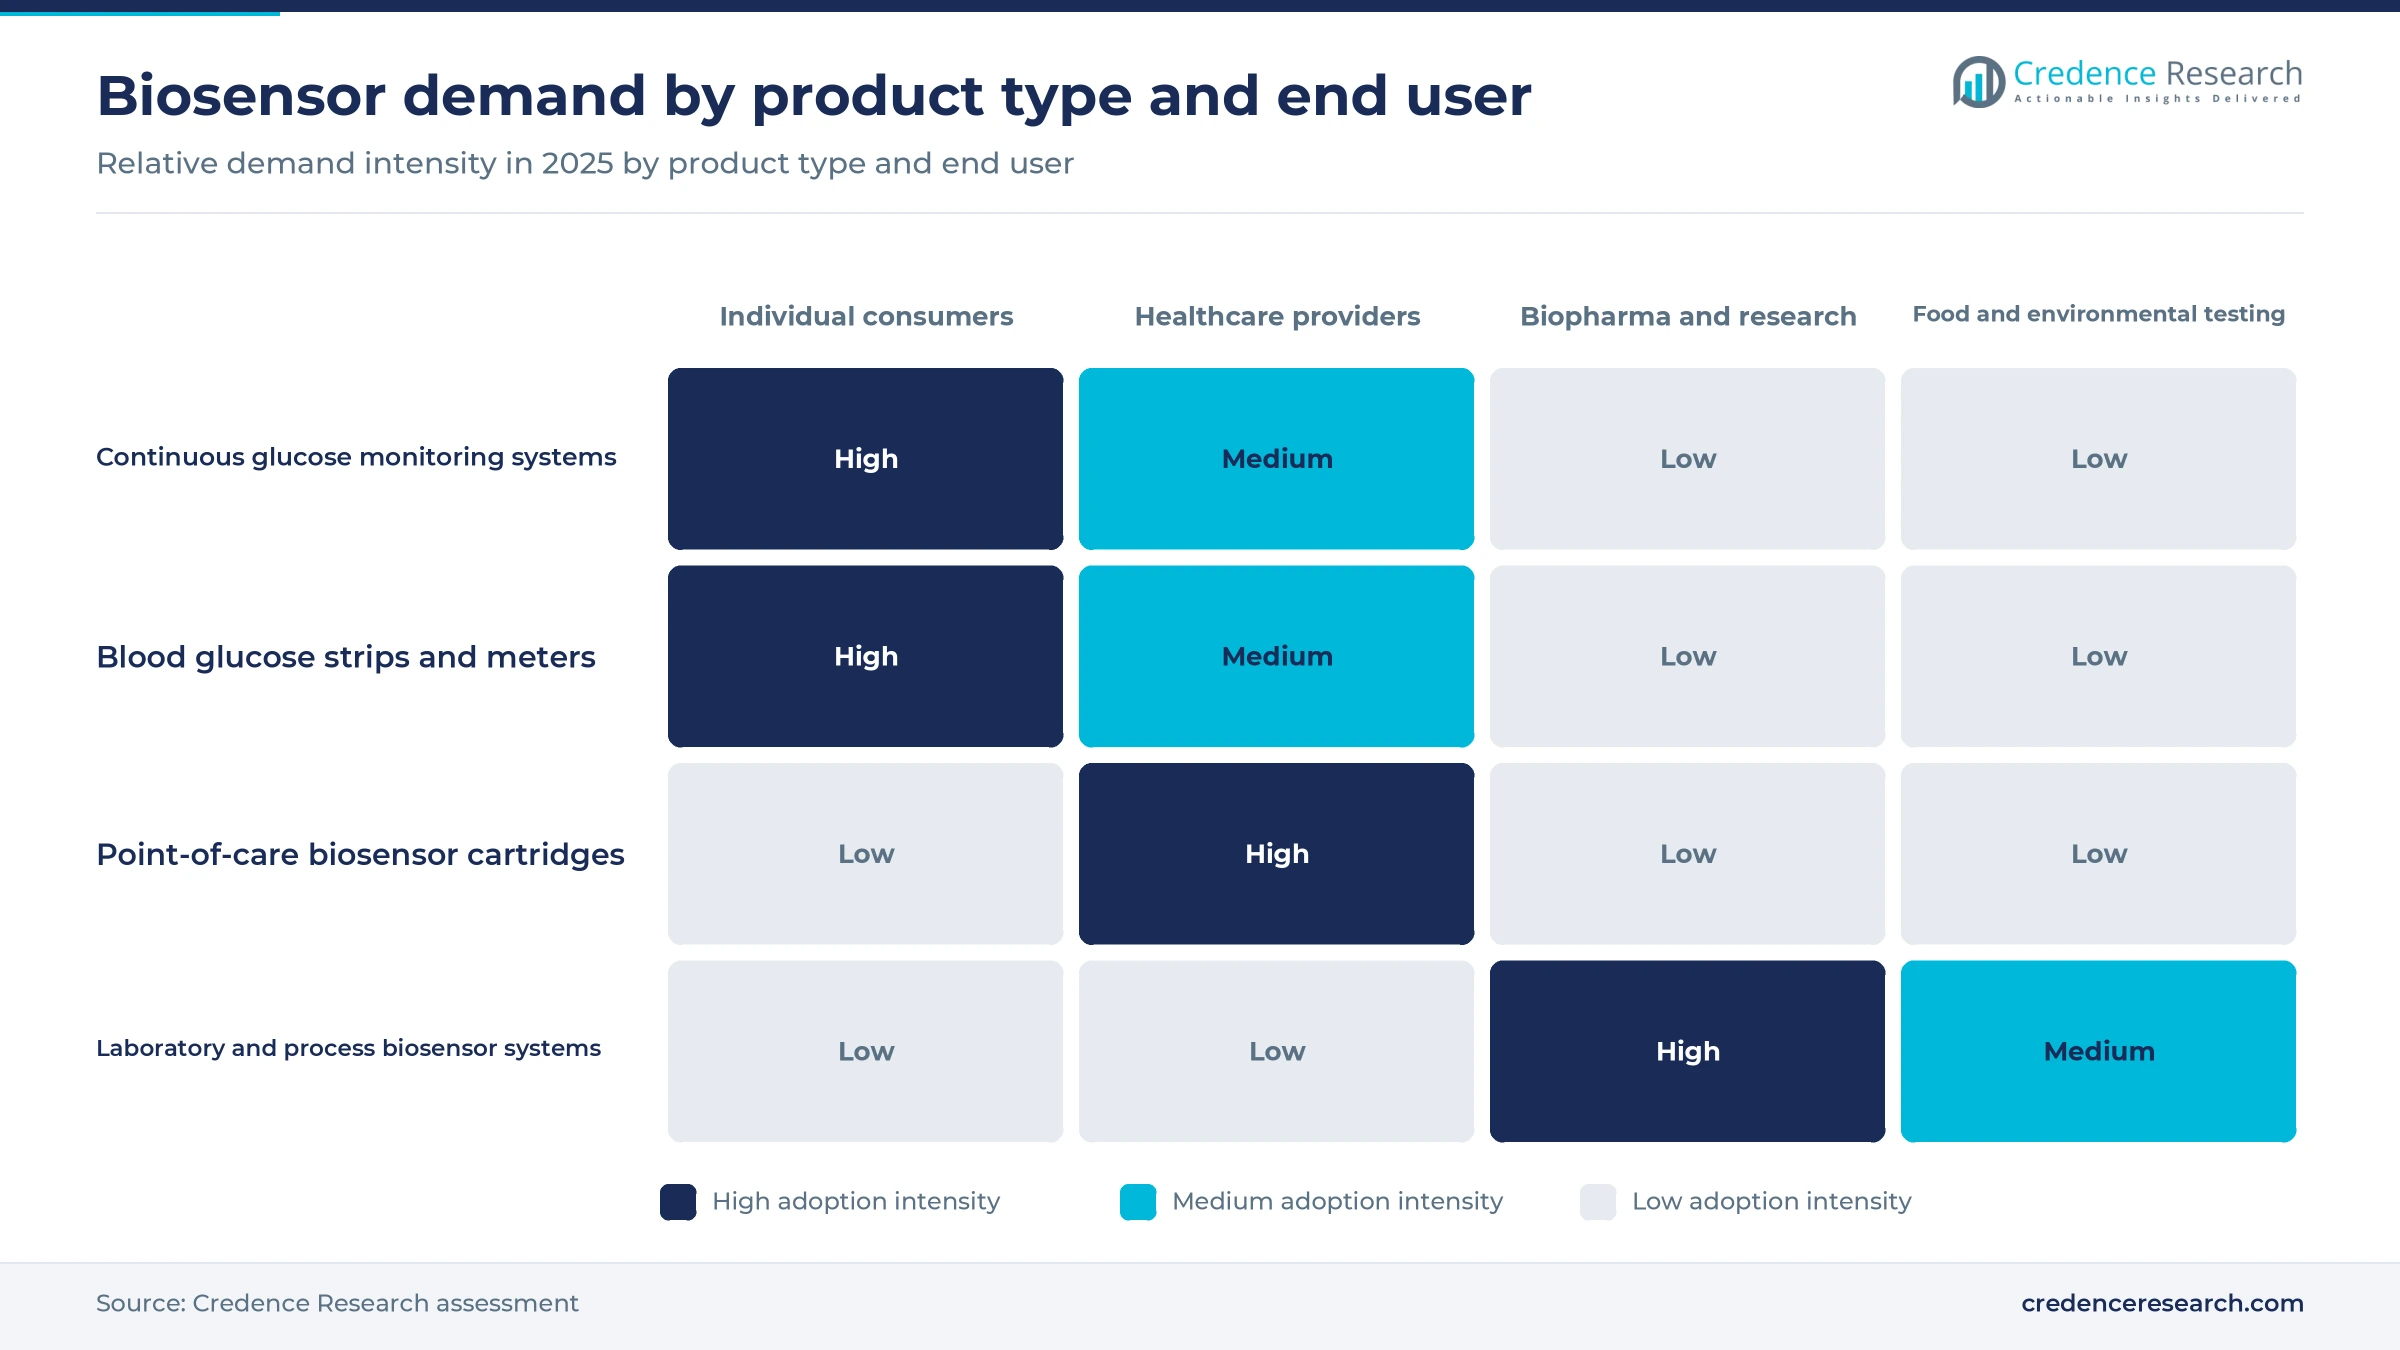
- Continuous glucose monitoring systems held 58.0% of 2025 value because each user replaces a sensor about every two weeks.
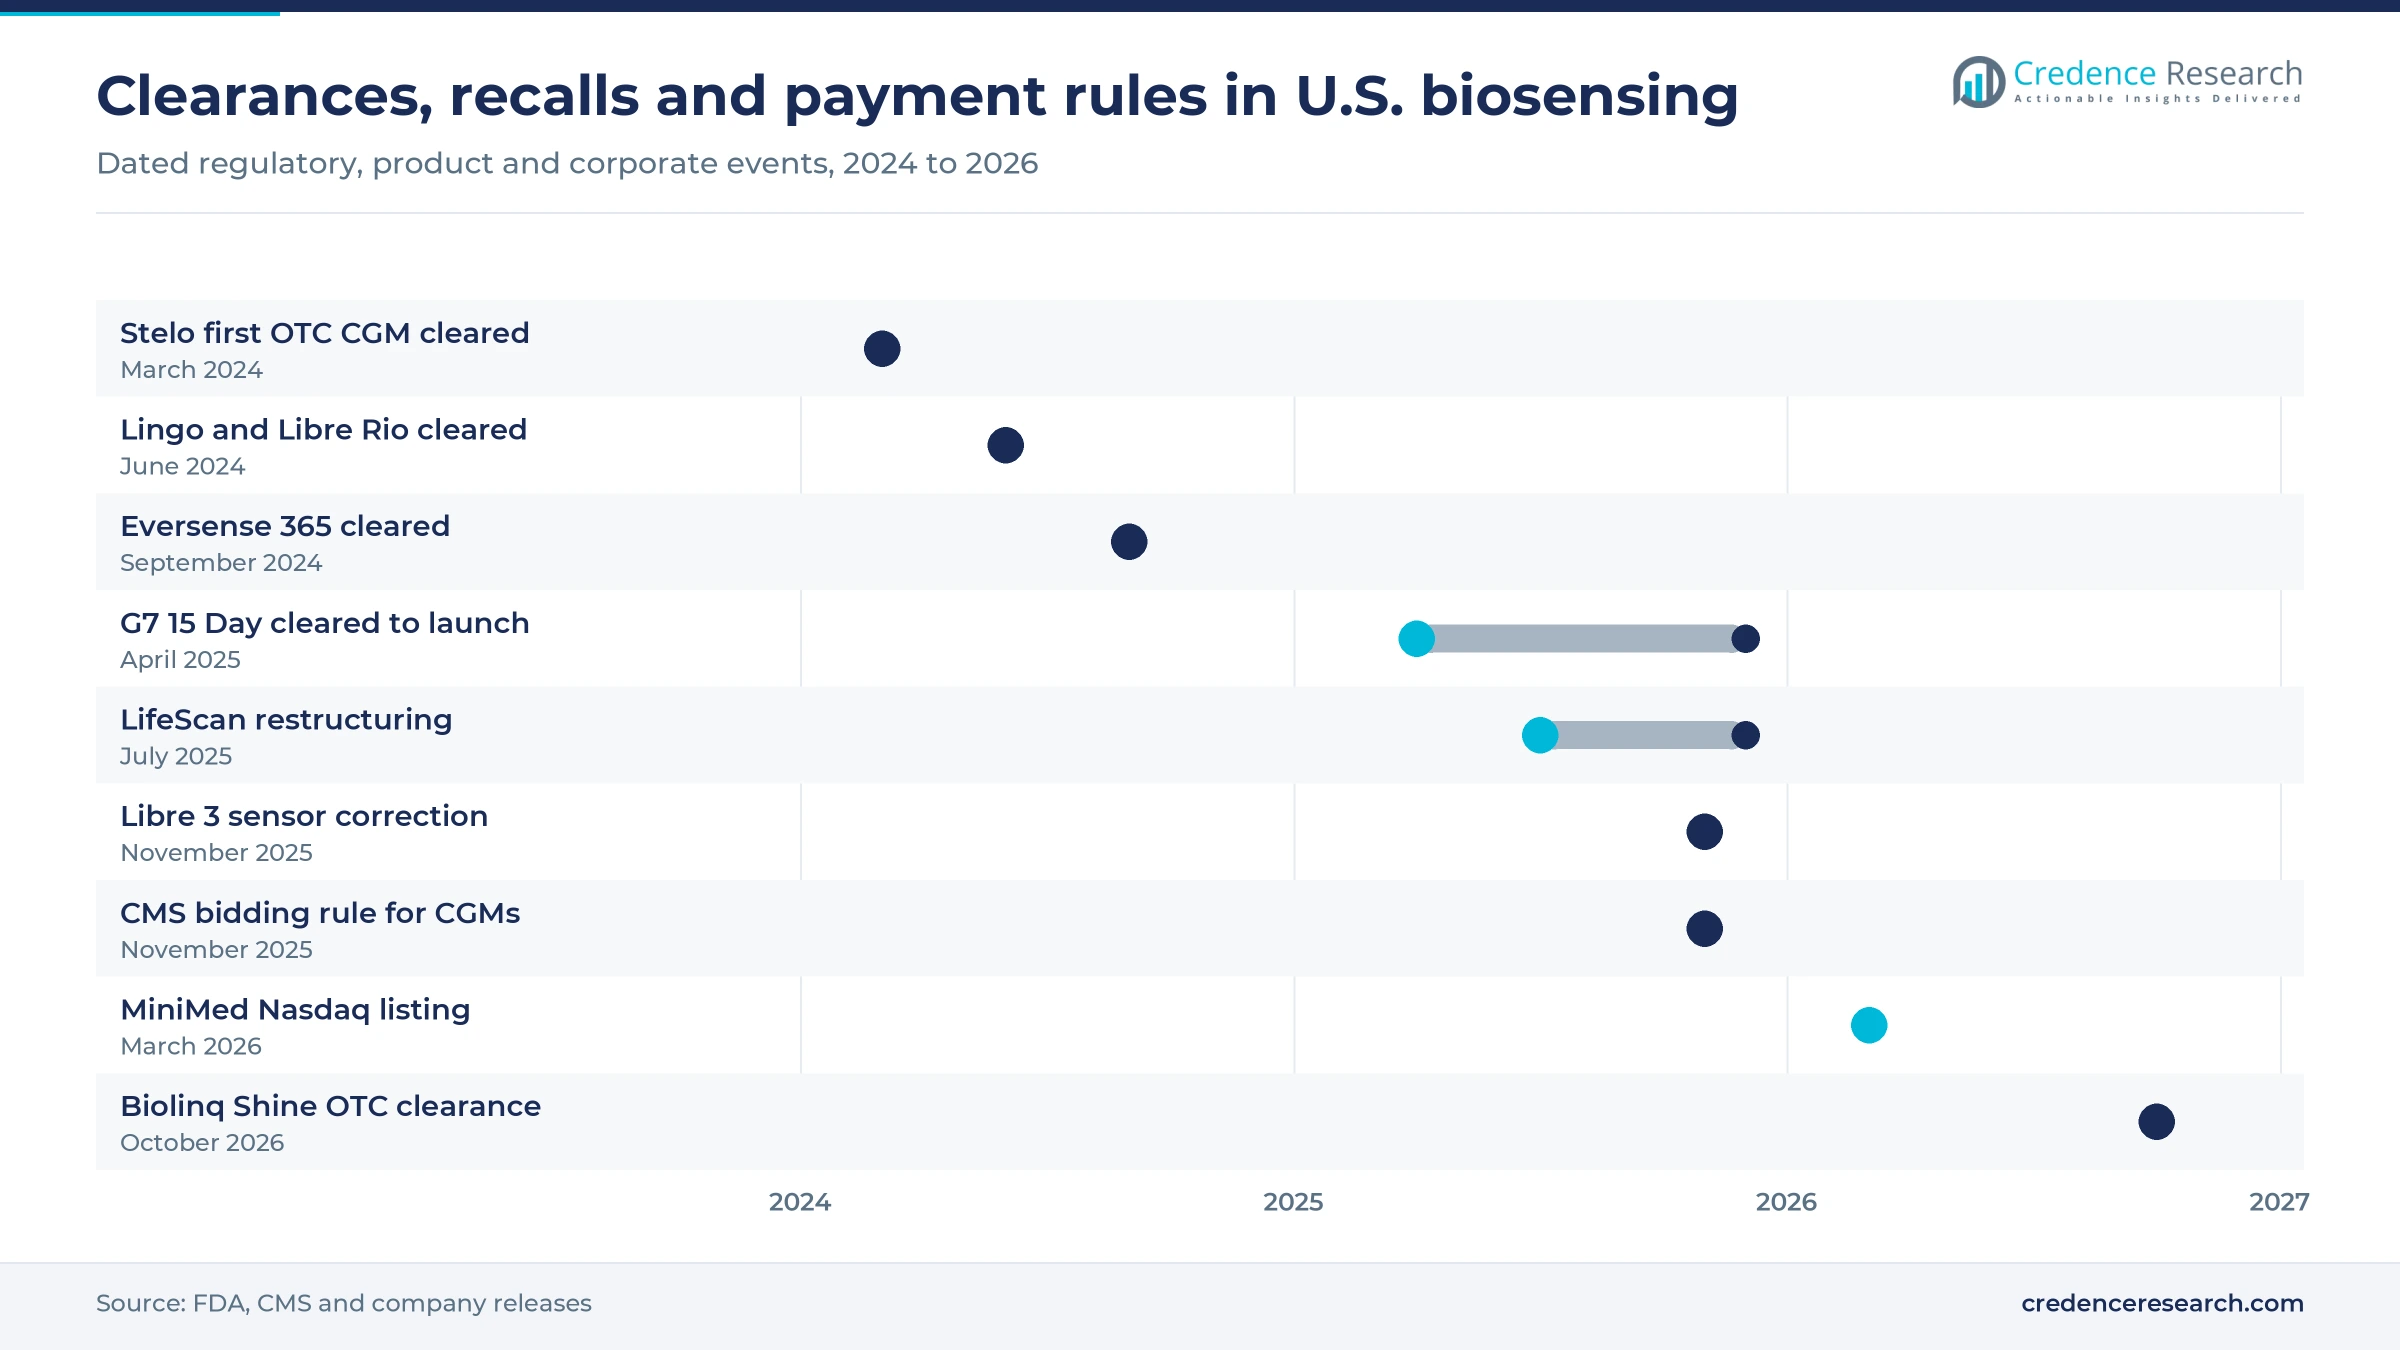
- The FDA cleared the first over-the-counter continuous glucose monitor, Dexcom Stelo, on March 5, 2024, opening a cash market for non-insulin users.
- CMS finalized a rule on Nov. 28, 2025, that moves continuous glucose monitors into Medicare competitive bidding no later than Jan. 1, 2028.
Continuous monitors lead while lab systems gain pace
Continuous monitors lead as lab binding systems grow fastest
Based on product type, the market is categorized into continuous glucose monitoring systems, blood glucose strips and meters, point-of-care biosensor cartridges and laboratory and process biosensor systems. Continuous glucose monitoring systems led with 58.0% of 2025 value because a sensor is a recurring purchase, and even the Dexcom G7 15 Day cleared in April 2025 lasts only 15.5 days. Laboratory and process biosensor systems grow fastest at 10.2% a year as Cytiva introduced the Biacore 8S and 8S+ surface plasmon resonance systems in May 2026 for high-throughput binding screens. Lab systems are a small base, so each instrument cycle moves their growth rate.
Diabetes monitoring leads while bioprocess sensing gains
Based on application, the market is categorized into diabetes glucose monitoring, acute-care metabolite testing, biomolecular interaction research and food, environmental and bioprocess sensing. Diabetes glucose monitoring led with 77.0% of 2025 value because the CDC counts 40.1 million Americans with diabetes, many of whom check glucose every day. Food, environmental and bioprocess sensing grows fastest at 9.3% a year as Eli Lilly committed about $27 billion to new U.S. manufacturing sites in February 2025, WFYI reported, and each new bioreactor train needs in-line metabolite sensing. Acute-care cartridges sit inside wider point-of-care testing budgets in hospitals.
Electrochemical sensing dominates as fluorescence widens
Based on technology, the market is categorized into electrochemical biosensing, optical affinity biosensing, optical fluorescence biosensing and piezoelectric affinity biosensing. Electrochemical biosensing led with 86.0% of 2025 value because fingerstick strips and needle-based wearables read glucose through enzyme electrodes, and LifeScan says its OneTouch meters alone serve more than 20 million people worldwide. Optical fluorescence biosensing grows fastest at 10.0% a year as the FDA cleared Senseonics' Eversense 365 in September 2024, an implanted fluorescence-based sensor that lasts one year with one calibration. Each implant replaces about two dozen short-wear sensors over a year of use.
Pharmacy shelves lead as direct subscriptions grow fastest
Based on distribution channel, the market is categorized into pharmacy and retail supply, durable medical equipment supply, direct manufacturer sales and specialist distributor sales. Pharmacy and retail supply led with 46.0% of 2025 value because strips and OTC sensors sell at the counter, and Abbott added Lingo to Walgreens in December 2025, when 78% of Americans lived within five miles of a Walgreens store. Direct manufacturer sales grow fastest at 9.6% a year as Dexcom began selling Stelo on Aug. 26, 2024, by one-time order and monthly subscription. Subscriptions give makers the reorder data that pharmacies usually keep for themselves.
| Segment Group | Leading Sub-segment | Share, 2025 | Fastest-growing Sub-segment | CAGR, 2026–2035 |
|---|---|---|---|---|
| By Product Type | Continuous glucose monitoring systems | 58.0% | Laboratory and process biosensor systems | 10.2% |
| By Application | Diabetes glucose monitoring | 77.0% | Food, environmental and bioprocess sensing | 9.3% |
| By Technology | Electrochemical biosensing | 86.0% | Optical fluorescence biosensing | 10.0% |
| By Distribution Channel | Pharmacy and retail supply | 46.0% | Direct manufacturer sales | 9.6% |
Monthly sensor prices anchor OTC and Medicare payment
Pricing in this market follows the sensor cycle rather than the device. Wearables are priced per sensor or per month, and OTC brands have converged on roughly the same monthly cash price, which signals price matching rather than cost-based pricing. Prescription sensors reach most insured patients through pharmacy and Medicare supply allowances, while strips fall below USD 5 a unit and lab systems sell as capital equipment with service contracts. The Medicare bid ceiling will turn monthly payment into a rental that bundles supplies, so margin will move from the sensor maker toward the contract supplier that wins the bid.
| Offer or benchmark | Typical price or fee | Basis |
|---|---|---|
| Stelo OTC biosensor, two 15-day sensors | USD 99 one-time, USD 89 a month by subscription | MedTech Dive, August 2024 |
| Lingo OTC biosensor, 14-day sensor | USD 49 for one, USD 89 for two, USD 249 for six | MedTech Dive, September 2024 |
| Medicare Class II CGM rental bid limit, supplies included | USD 272.69 a month at 2025 fee levels | CMS fact sheet, November 2025 |
| Fingerstick test strip, net unit price | Below USD 5 a strip | Credence Research price tier definition |
Request a Free Sample
Fill in your details and we'll send you a free sample report.
- Sample data tables & charts
- Research methodology
Diabetes load, OTC access and Medicare rules lift demand
Recurring monitoring demand from a large diabetes base
The size of the diabetes population turns glucose sensing into a repeat purchase that rarely stops once it starts. The CDC counts 40.1 million Americans with diabetes, 12.0% of the population, and 115.2 million adults with prediabetes form the next pool of potential users. The American Diabetes Association put the total cost of diabetes at $412.9 billion in 2022 and found that people with diagnosed diabetes account for one of every four U.S. health care dollars. Payers therefore have a strong reason to fund tools that cut hospital stays. Continuous glucose monitoring systems held 58.0% of 2025 value, and each new user adds about 26 sensor replacements a year, which makes user growth the main lever for revenue.
Broader commercial access through OTC sensors
Over-the-counter clearance has opened the market to buyers who never needed a prescription before. According to the FDA, Dexcom Stelo became the first cleared OTC continuous glucose monitor on March 5, 2024, for adults who do not use insulin. Abbott followed on June 10, 2024, with clearance for Lingo, aimed at general consumers, and Libre Rio, for adults with type 2 diabetes who do not use insulin. Biolinq Shine, a needle-free microsensor patch, gained OTC 510(k) clearance in October 2026 for adults aged 22 and older who do not use insulin, Healio reported. Cash buyers widen the base well beyond insulin users, and they reward brands that sell like consumer products rather than medical supplies.
Medicare coverage reaches more insulin users
Medicare rules decide how many older patients can afford a prescription sensor, and those rules have loosened. Since April 2023, Medicare has covered CGMs for insulin-using beneficiaries without the earlier multiple-daily-injection requirement, and Abbott estimated that more than two million insulin users became eligible. Dexcom launched the G7 15 Day on Dec. 1, 2025, first through durable medical equipment suppliers, stating that it meets CMS requirements for therapeutic CGM systems. FDA approval of the MiniMed 780G pump for adults with insulin-requiring type 2 diabetes on Sept. 2, 2025, adds another reason to prescribe a sensor. Coverage gains matter most in older populations, and they lift DME and pharmacy volumes first in the most populous Southern states.
Longer-wear and implantable sensors cut user burden
Longer sensor life lowers the effort of staying on a wearable, which keeps users from dropping out after the first months. The FDA cleared the Dexcom G7 15 Day on April 10, 2025, with 15.5 days of wear and an overall MARD of 8.0%, according to Dexcom. Senseonics and Ascensia Diabetes Care announced FDA clearance of the Eversense 365 in September 2024, the first one-year sensor, which needs a single insertion and one calibration a year. The FDA granted Biolinq Shine De Novo classification in September 2025 for a microsensor array that is up to 20 times shallower than conventional sensors. Fewer insertions widen the appeal of continuous glucose monitoring devices for people who dislike needles.
Pump-sensor ecosystems rise as fingerstick strips fade
A shift to integrated pump and sensor ecosystems
Sensor makers increasingly compete as part of closed-loop systems that pair a sensor with an insulin pump. Medtronic announced the spin-off of its diabetes unit in May 2025, MiniMed listed on Nasdaq under the ticker MMED in March 2026, and Medtronic launched an exchange offer on Sept. 14, 2026, to divest at least 80.1% of the shares, Drug Delivery Business reported. MiniMed's Simplera sensor won FDA approval in April 2025 and launched in September 2025. MedTech Dive reported that the Simplera rollout fell behind schedule because automated high-volume manufacturing underperformed, which shows that sensor yield now limits integrated systems as much as pump design does. Interoperability means a sensor can be chosen for the pump, so makers of insulin pumps now shape sensor demand.
The decline of fingerstick strips reshapes meter makers
Wearable sensors are taking daily testing away from fingerstick strips, and the strip business has had to restructure. LifeScan, the OneTouch maker based in Malvern, Pennsylvania, filed for Chapter 11 in July 2025, won court approval for its plan in October 2025 and emerged in December 2025 owned by its lenders, Drug Delivery Business reported. Blood glucose strips and meters remain the second-largest product type in 2025, but they grow far more slowly than wearables. Fierce Biotech reported in October 2025 that Walmart, which has more than 3,500 U.S. stores, would be the first retailer to stock Abbott's Lingo sensor, so the retail shelves that carry low-cost strips now offer a two-week sensor beside them. Suppliers of blood glucose test strips must compete on low-cost retail lines or pair meters with apps to keep users.
DME supply offers an opening on adherence evidence
Equipment suppliers can win payer contracts by showing that patients stay on sensors longer when they supply them. A study of more than 12,000 new CGM users published in Clinical Diabetes in March 2025 found 12-month adherence of 78% through DME suppliers versus 64% through pharmacies for Medicare and Medicare Advantage patients. Total costs were $11,154 through DME against $15,029 through pharmacies, about $3,875 less per patient. Commercially insured adherence was 60% through DME and 48% through pharmacies. Suppliers that bring this evidence to payers before Medicare bidding starts can defend their volumes and margins. Pharmacies, in turn, can answer with refill reminders and pharmacist follow-up, so the channel contest will be fought on adherence rather than on price.
Bioprocess and binding analysis offer an opening
Laboratory and process sensing gives sensor makers a growth path outside diabetes reimbursement. Cytiva's Biacore 8S series, launched in May 2026, combines high-throughput screening and automated workflows for drug discovery, the application where binding-kinetics data decide which antibodies advance. Eli Lilly's February 2025 manufacturing pledge, noted above, adds bioreactor capacity that needs glucose, lactate and glutamine sensing. Food, environmental and bioprocess sensing grows fastest at 9.3% a year among applications. Vendors of surface plasmon resonance systems and in-line probes can sell service contracts to these plants, which smooth revenue between instrument cycles. Biopharma buyers also pay faster than grant-funded laboratories, which improves working capital for smaller instrument makers.
Recalls, FDA findings and bidding squeeze suppliers
Sensor accuracy failures erode user trust
Wearable sensors make treatment decisions automatic, so a faulty batch can cause harm at scale. Abbott issued a medical device correction on Nov. 24, 2025, for about 3 million Libre 3 and Libre 3 Plus sensors in the U.S. that may show falsely low glucose readings, and MassDevice reported seven deaths among the adverse events. Prescribers and payers respond by asking for more accuracy data and backup fingersticks, which slows switching and raises compliance cost and recall risk for every maker.
FDA findings on design changes raise compliance cost
Changes to sensor chemistry now draw close regulatory scrutiny in this market. An FDA warning letter dated March 4, 2025 found that Dexcom changed a component in the resistance layer of its G6 and G7 sensors without a new 510(k), after inspections in San Diego and Mesa, Arizona, in 2024. Makers must now validate each material change more fully before scaling it, which lengthens development time, ties up quality staff and adds launch risk.
Medicare competitive bidding compresses supplier margins
Federal bidding will cut the number of suppliers that can serve Medicare sensor users. CMS finalized a rule on Nov. 28, 2025 that brings Class II CGMs and insulin pumps into competitive bidding no later than Jan. 1, 2028, with about ten national contract suppliers expected. Payment becomes a monthly rental that includes supplies for the whole contract period. Suppliers that lose a bid lose their Medicare patients, and winners face price pressure from lower single payment amounts across a national footprint.
Flat research funding slows lab instrument buying
Academic laboratories fund many binding analysis instruments through federal grants, and those grants are tighter. NIH extramural grant funding reached $35.30 billion in fiscal 2025, up only 0.4%, while the number of awards fell 6.2% and the research project grant success rate dropped to 13.0% from 18.5%. Fewer funded projects delay core-facility upgrades, so instrument makers face pressure to lean more on biopharma buyers and service revenue.
The South leads as its population grows fastest
| Region | Value, 2025 (USD billion) | Share, 2025 | CAGR, 2026–2035 |
|---|---|---|---|
| South | 3.94 | 37.5% | 8.8% |
| West | 2.62 | 25.0% | 8.5% |
| Midwest | 2.05 | 19.5% | 8.0% |
| Northeast | 1.89 | 18.0% | 7.9% |
The South leads on population size and growth
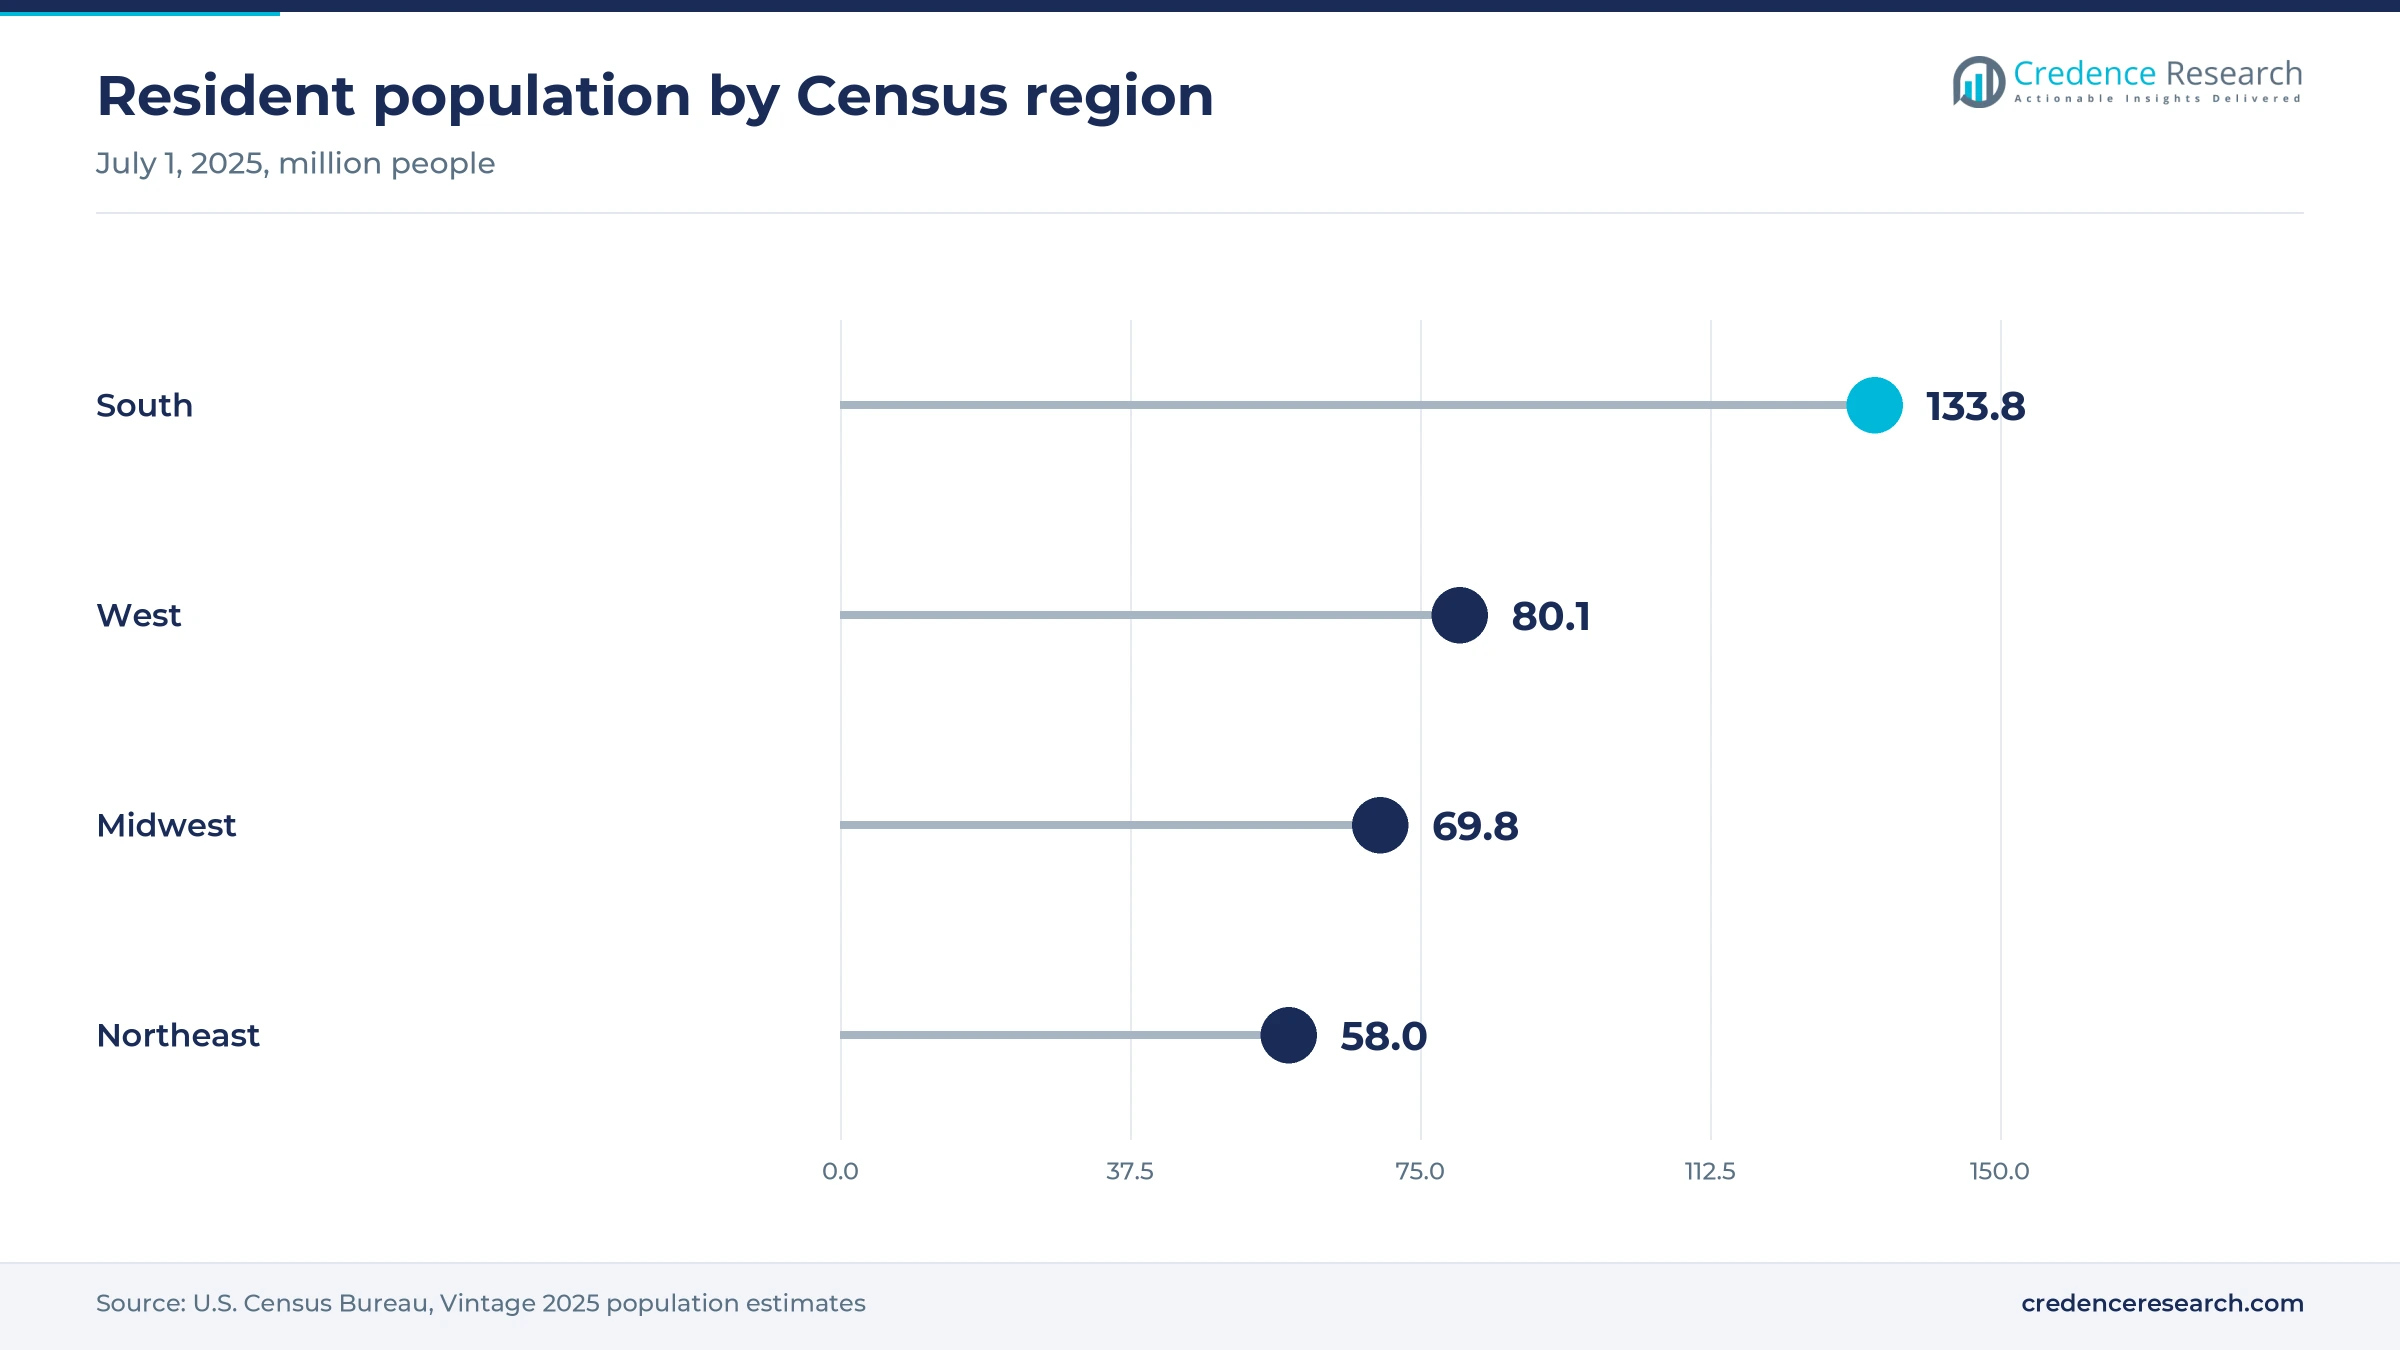
The South held 37.5% of 2025 value and grows at 8.8% a year, the fastest of the four regions. The Census Bureau counted 133.8 million residents in the South on July 1, 2025, after growth of 6.0% since 2020, nearly double the national 3.1%. It was also the only region to grow in all five age groups. A larger and still-growing patient base supports more prescriptions, more pharmacy counters and more DME suppliers than in any other region.
The West hosts sensor production and a large user base
The West held 25.0% of 2025 value and grows at 8.5% a year, close to the national rate. The Census Bureau put its population at 80.1 million in 2025, up 1.9% since 2020. Dexcom makes sensors in San Diego and Mesa, Arizona, so supply, engineering and early product launches cluster in the region. A falling under-18 population, down 5.7% since 2020, shifts demand toward adult and older users with type 2 diabetes.
The Midwest relies on a mature, slow-growing population
The Midwest held 19.5% of 2025 value and grows at 8.0% a year, below the national CAGR. The Census Bureau counted 69.8 million residents in 2025, up just 1.1% since 2020, and the 45 to 64 age group fell 6.2%. Abbott is based at Abbott Park, Illinois, which keeps product training and payer work close to Midwest health systems. Growth here depends more on converting strip users to sensors than on new patients.
The Northeast grows slowest but buys premium systems
The Northeast held 18.0% of 2025 value and grows at 7.9% a year, the slowest regional CAGR. Its population was 58.0 million in 2025, up 0.7% since 2020, and its 65-and-older group grew more slowly than any other region's, at 14.6%. LifeScan, the OneTouch strip maker, is based in Malvern, Pennsylvania. Dense academic medical centers support pump and sensor systems and lab binding instruments, yet slow population growth caps volume.
Clearances, a recall and a spin-off, 2025 to 2026
| Development | Status and market relevance |
|---|---|
| In April 2025, the FDA cleared the Dexcom G7 15 Day, which Dexcom launched in the U.S. on Dec. 1, 2025. | Launched; longest-wear prescription CGM |
| In September 2025, the FDA cleared MiniMed 780G integration with Abbott's Instinct sensor and approved use in type 2 diabetes. | Cleared; widens pump-linked sensor use |
| In November 2025, Abbott issued a U.S. correction for about 3 million Libre 3 and Libre 3 Plus sensors. | Correction; raises accuracy scrutiny |
| In March 2026, MiniMed listed on Nasdaq after its spin-off from Medtronic. | Completed; standalone pump and sensor company |
| In October 2026, Biolinq Shine received FDA 510(k) clearance for over-the-counter sale. | Cleared; first needle-free OTC wearable |
Enzyme electrodes dominate as optical methods widen
- Electrochemical enzyme sensors convert glucose or lactate reactions into current, which keeps strips and wearables cheap enough for daily use.
- Implanted fluorescence sensors use a glucose-binding hydrogel whose light output rises with glucose, which allows one sensor to last a year.
- Surface plasmon resonance systems measure binding without labels in real time, which lets drug developers rank antibodies by kinetics.
- Quartz crystal microbalance sensors detect mass change on a vibrating crystal, which suits surface and binding studies in niche laboratories.
Need a Custom Version of This Report?
Tailor the scope, geography, or segments to your exact requirements.
- Custom geography or segment scope
- Direct access to our analyst team
Three wearable makers set the pace in diabetes sensing
Competition in U.S. biosensing turns on accuracy, wear time, payer coverage and pump integration rather than on list price alone. Abbott and Dexcom lead wearable glucose sensing and both sell prescription and over-the-counter lines, with Abbott also supplying the Instinct sensor that works with MiniMed pumps. MiniMed pairs its own Simplera sensor with the 780G pump and pitches a complete system to clinics. LifeScan defends the strip and meter base after its 2025 restructuring, while Senseonics, with Ascensia Diabetes Care, and Biolinq compete through new sensor formats. In laboratories, Cytiva's Biacore systems set the reference for binding analysis. Recalls and FDA findings have made manufacturing quality a visible point of difference for prescribers and payers. Retail reach now matters too, because OTC sensors compete for shelf space and online placement with consumer health brands.
Three wearable makers and many niche suppliers share supply
Supply in the wearable segment is concentrated among Abbott, Dexcom and MiniMed, which control sensor chemistry, high-volume automated lines and payer contracts. Senseonics and Biolinq enter with different formats, an implant and a needle-free patch, rather than copying needle-based designs. Strips are a mature, price-led business with retail private labels, while lab and bioprocess sensing is a fragmented instrument market. Entry barriers are high in wearables because of FDA clearance, accuracy studies and manufacturing yield. The Commerce Department opened a Section 232 investigation into imports of medical equipment and devices on Sept. 2, 2025, which adds tariff risk for imported components.
Biosensing suppliers and their U.S. roles
| Company | Type | Role in the market |
|---|---|---|
| Abbott | Diversified medtech | FreeStyle Libre, Lingo and Libre Rio wearables, the Instinct sensor and i-STAT bedside cartridges |
| Dexcom | CGM specialist | G7 15 Day prescription CGM and Stelo OTC sensor, made in San Diego and Mesa |
| MiniMed | Pump and sensor maker | MiniMed 780G pump with Simplera and Instinct sensors, listed on Nasdaq in March 2026 |
| Medtronic | Former parent | Divesting its remaining MiniMed stake through an exchange offer from September 2026 |
| LifeScan | Meter and strip maker | OneTouch meters and strips, based in Malvern, Pennsylvania |
| Senseonics | Implantable CGM maker | Eversense 365 one-year fluorescence sensor, cleared in September 2024 |
| Biolinq | Wearable start-up | Biolinq Shine needle-free microsensor patch, OTC clearance in October 2026 |
| Cytiva | Lab instrument maker | Biacore surface plasmon resonance systems, Biacore 8S series from May 2026 |
Access and payment design decide the next decade
Credence Research's view is that wearable glucose sensing will keep supplying most of the value to 2035, but the direction of growth will be set by access and payment design rather than by new chemistry. OTC sensors open a cash market that rewards consumer marketing and retail reach, while Medicare bidding will reward suppliers that can serve patients nationally at a lower monthly rate. Sensor makers should invest in manufacturing quality after the 2025 correction and warning letter, and lab vendors should follow biopharma plant spending.
Values built from users, sensor cycles and prices
The report uses 2025 as the base year and forecasts to 2035. Market values come from the Credence Research model, built from the number of sensor and strip users, replacement cycles, cartridge and instrument volumes, and net prices by product type. Regional, segment and channel splits are Credence Research estimates built from these public inputs. Inputs include CDC, FDA, CMS, NIH and Census Bureau data, American Diabetes Association statistics, company releases, regulatory letters and published price listings. No interviews or primary surveys were conducted for this report.
Wearable volume grows as payment moves to rental
The USA biosensors market is set to reach USD 23.64 billion by 2035, as wearable sensors spread from insulin users to people with type 2 diabetes and to wellness buyers. Growth will be strongest in direct subscriptions, fluorescence-based implants, lab and process systems, and the South. Strip revenue will keep shrinking as a share of the total. The key variables are how many OTC buyers keep paying after a trial and how deeply Medicare bidding resets the monthly payment from 2028.
OTC uptake and Medicare bidding decide the range
The range of outcomes depends on how many non-insulin users keep paying cash for sensors and on how deeply Medicare bidding cuts the monthly rental. Fast OTC uptake and retail expansion would lift volume well above the base, while a second large recall or steep bid cuts would slow value growth even as unit volume rises. Lab and process sensing move the national total only slightly in either direction.
| Scenario | CAGR, 2026–2035 | Value, 2035 | What has to hold |
|---|---|---|---|
| Downside | 6.9% | USD 20.84 billion | OTC users churn after trial, bidding cuts rental rates and a recall slows switching |
| Base | 8.43% | USD 23.64 billion | OTC users grow steadily and Medicare bidding starts in 2028 with moderate cuts |
| Upside | 9.6% | USD 26.09 billion | OTC sensors spread through retail and payers cover sensors for more type 2 users |
Frequently Asked Questions
How big is the USA biosensors market?
Which product type leads U.S. biosensor spending?
Which region leads demand in the United States?
What changed with over-the-counter glucose sensors?
How will Medicare competitive bidding affect the market?
Which sensing technology dominates?
Who are the main suppliers in the United States?
What could slow the USA biosensors market?
Table of Content
Chapter 1 Market Segmentation
- 1.1 Segmentation Framework
- 1.1.1 Product and Service Classification
- 1.1.2 Application and End-Use Classification
- 1.1.3 Technology and Solution Classification
- 1.1.4 Customer and Distribution Channel Classification
- 1.1.5 Geographic Segmentation
- 1.1.6 Market Segment Definitions and Boundaries
- 1.2 By Product Type
- 1.2.1 Continuous glucose monitoring systems
- 1.2.2 Blood glucose strips and meters
- 1.2.3 Point-of-care biosensor cartridges
- 1.2.4 Laboratory and process biosensor systems
- 1.3 By Application
- 1.3.1 Diabetes glucose monitoring
- 1.3.2 Acute-care metabolite testing
- 1.3.3 Biomolecular interaction research
- 1.3.4 Food, environmental, and bioprocess sensing
- 1.4 By Technology
- 1.4.1 Electrochemical biosensing
- 1.4.2 Optical affinity biosensing
- 1.4.3 Optical fluorescence biosensing
- 1.4.4 Piezoelectric affinity biosensing
Chapter 2 Introduction
- 2.1 Report Objectives and Scope
- 2.2 Product Definition and Industry Terminology
- 2.3 Market Inclusions and Exclusions
- 2.4 Research Process
- 2.4.1 Primary Research and Expert Interviews
- 2.4.2 Secondary Research and Source Review
- 2.4.3 Top-Down and Bottom-Up Estimation
- 2.4.4 Data Triangulation and Verification
- 2.5 Market Size Measurement Basis
- 2.5.1 2025: USD 10.49 billion → 2035: USD 23.64 billion
- 2.6 Historical and Forecast Reference Periods
- 2.6.1 Historical Period: 2018-2025
- 2.6.2 Base Year: 2025
- 2.6.3 Forecast Period: 2025-2035
- 2.7 Research Assumptions and Limitations
Chapter 3 Executive Summary
- 3.1 Market Snapshot and Key Findings
- 3.2 Base-Year Market Size, 2025
- 3.3 Forecast Market Size, 2035
- 3.4 Revenue and Volume Growth Outlook
- 3.5 Key Demand and Supply Indicators
- 3.6 Leading Market Segments
- 3.7 Fastest-Growing Market Opportunities
- 3.8 Regional Performance Highlights
- 3.9 Technology and Industry Transformation
- 3.10 Competitive Landscape Summary
- 3.11 Analyst View and Strategic Implications
Chapter 4 USA Biosensors Market Trends and Developments
- 4.1 Historical Industry Development, 2018-2025
- 4.2 Recent Market Trends and Developments
- 4.3 Demand and Customer Behavior Trends
- 4.4 Technology and Product Innovation
- 4.5 Artificial Intelligence, Automation and Digitalization
- 4.6 Local Manufacturing and Supply Chain Realignment
- 4.7 Industry Partnerships, Mergers and Acquisitions
- 4.8 Sustainability and Circular Economy Developments
- 4.9 Government and Private Sector Investment Trends
- 4.10 Emerging Business Models and Commercialization
- 4.11 Industry Developments and Announcements
Chapter 5 USA Biosensors Market Production, Supply and Demand Analysis
- 5.1 Demand Trend and Consumption Analysis, 2018-2025
- 5.2 Demand Forecast, 2025-2035
- 5.3 Production and Output Trend, 2018-2025
- 5.4 Production and Output Forecast, 2025-2035
- 5.5 Installed Capacity and Capacity Utilization
- 5.6 Company-Wise Production Plants and Statistics
- 5.6.1 Installed Production Capacity
- 5.6.2 Actual Production
- 5.6.3 Planned Capacity and Expansion Targets
- 5.7 Supply Chain Structure and Procurement Trends
- 5.8 Supply-Demand Gap and Bottlenecks
- 5.9 Import Dependence and Sourcing Structure
- 5.10 Contract Manufacturing and Outsourcing
- 5.11 Regional Supply and Demand Concentration
Chapter 6 USA Biosensors Market Pricing Analysis
- 6.1 Pricing Structure and Measurement
- 6.2 Historical Pricing Trends, 2018-2025
- 6.3 Pricing Outlook, 2025-2035
- 6.4 Average Selling Price and Unit Economics
- 6.5 Pricing by Product and Market Segment
- 6.6 Geographic Pricing Differences
- 6.7 Key Input, Energy, Labor and Logistics Costs
- 6.8 Contract Pricing and Purchasing Models
- 6.9 Pricing Sensitivity and Competitive Positioning
- 6.10 Price, Margin and Profitability Implications
Chapter 7 USA Biosensors Market Dynamics
- 7.1 Market Growth Drivers
- 7.1.1 Demand-Side Drivers
- 7.1.2 Technology and Innovation Drivers
- 7.1.3 Infrastructure and Investment Drivers
- 7.1.4 Regulatory and Policy Drivers
- 7.2 Market Restraints
- 7.2.1 Cost and Affordability Constraints
- 7.2.2 Technology and Adoption Barriers
- 7.2.3 Supply Chain and Operational Constraints
- 7.3 Market Challenges
- 7.3.1 Competitive Pressure and Margin Erosion
- 7.3.2 Skills, Infrastructure and Implementation Gaps
- 7.4 Emerging Market Opportunities
- 7.5 Market Dynamics Impact and Time-Horizon Assessment
Chapter 8 USA Biosensors Value Chain Analysis
- 8.1 Industry Value Chain Overview
- 8.2 Upstream Suppliers and Critical Inputs
- 8.3 Technology and Component Providers
- 8.4 Manufacturing or Service Delivery
- 8.5 Distribution, Channel Partners and Integrators
- 8.6 Downstream Applications and End Users
- 8.7 Value Addition and Profit Pools
- 8.8 Vertical Integration and Outsourcing
- 8.9 Supplier Concentration and Risk
- 8.10 Supply Chain Localization and Resilience
Chapter 9 USA Biosensors Market Regulations and Policies
- 9.1 Relevant Laws, Standards and Compliance Frameworks
- 9.2 Product, Service, Safety and Quality Requirements
- 9.3 Government Policies, Incentives and Subsidies
- 9.4 Imports, Exports and Trade Barriers
- 9.5 Public Procurement and Local Content Requirements
- 9.6 Environmental and Sustainability Compliance
- 9.7 Upcoming Policy Changes and Market Implications
Chapter 10 USA Biosensors Market Hotspots and Opportunities
- 10.1 Market Opportunity Mapping and Growth Hotspots
- 10.2 High-Growth Applications and Customer Groups
- 10.3 Underserved Markets and White-Space Opportunities
- 10.4 Emerging Technology and Product Opportunities
- 10.5 New Capacity and Investment Hotspots
- 10.6 Market Entry and Expansion Opportunities
- 10.7 Distribution and Partnership Opportunities
- 10.8 Near-Term and Long-Term Commercial Potential
- 10.9 Opportunity Attractiveness and Execution Risks
Chapter 11 USA Biosensors Market Outlook, 2025-2035
- 11.1 Market Size and Analysis
- 11.1.1 Revenue (Market Measurement: 2025: USD 10.49 billion → 2035: USD 23.64 billion)
- 11.1.2 Market Volume and Quantity Sold
- 11.1.3 Historical Market Size, 2018-2025
- 11.1.4 Base-Year Market Size, 2025
- 11.2 Market Forecast, 2025-2035
- 11.2.1 Revenue Forecast to 2035
- 11.2.2 Volume Forecast to 2035
- 11.2.3 CAGR and Year-on-Year Growth
- 11.2.4 Incremental Revenue Opportunity
- 11.3 Forecast Assumptions and Scenario Analysis
- 11.3.1 Base-Case Forecast
- 11.3.2 Optimistic and Conservative Scenarios
- 11.3.3 Technology, Pricing and Policy Sensitivities
- 11.4 Market Attractiveness and Growth Outlook
Chapter 12 USA Biosensors Market Segmentation and Outlook
- 12.1 Segmentation Summary and Market Shares, 2025
- 12.2 Largest and Fastest-Growing Segments
- 12.3 By Product Type - Market Size and Forecast, 2025-2035
- 12.3.1 Segment Definition and Scope
- 12.3.2 Historical Market Size, 2018-2025
- 12.3.3 Revenue Forecast, 2025-2035
- 12.3.4 Volume Forecast, 2025-2035
- 12.3.5 Base-Year Market Share, 2025
- 12.3.6 Segment CAGR and Growth Drivers
- 12.3.7 Subsegment Market Size and Forecast
- 12.3.7.1 Continuous glucose monitoring systems
- 12.3.7.2 Blood glucose strips and meters
- 12.3.7.3 Point-of-care biosensor cartridges
- 12.3.7.4 Laboratory and process biosensor systems
- 12.3.8 Subsegment Pricing and Adoption Trends
- 12.3.9 Leading Suppliers and Competition
- 12.3.10 Regional Demand and Opportunities
- 12.4 By Application - Market Size and Forecast, 2025-2035
- 12.4.1 Segment Definition and Scope
- 12.4.2 Historical Market Size, 2018-2025
- 12.4.3 Revenue Forecast, 2025-2035
- 12.4.4 Volume Forecast, 2025-2035
- 12.4.5 Base-Year Market Share, 2025
- 12.4.6 Segment CAGR and Growth Drivers
- 12.4.7 Subsegment Market Size and Forecast
- 12.4.7.1 Diabetes glucose monitoring
- 12.4.7.2 Acute-care metabolite testing
- 12.4.7.3 Biomolecular interaction research
- 12.4.7.4 Food, environmental, and bioprocess sensing
- 12.4.8 Subsegment Pricing and Adoption Trends
- 12.4.9 Leading Suppliers and Competition
- 12.4.10 Regional Demand and Opportunities
- 12.5 By Technology - Market Size and Forecast, 2025-2035
- 12.5.1 Segment Definition and Scope
- 12.5.2 Historical Market Size, 2018-2025
- 12.5.3 Revenue Forecast, 2025-2035
- 12.5.4 Volume Forecast, 2025-2035
- 12.5.5 Base-Year Market Share, 2025
- 12.5.6 Segment CAGR and Growth Drivers
- 12.5.7 Subsegment Market Size and Forecast
- 12.5.7.1 Electrochemical biosensing
- 12.5.7.2 Optical affinity biosensing
- 12.5.7.3 Optical fluorescence biosensing
- 12.5.7.4 Piezoelectric affinity biosensing
- 12.5.8 Subsegment Pricing and Adoption Trends
- 12.5.9 Leading Suppliers and Competition
- 12.5.10 Regional Demand and Opportunities
- 12.6 Segment Growth Comparison
- 12.7 Segment Attractiveness and Priority Matrix
Chapter 13 USA Biosensors End-Use and Application Market Outlook
- 13.1 End-Use Industry and Customer Demand Structure
- 13.2 Leading Applications and Customer Groups
- 13.3 End-Use Market Size, Share and Forecast
- 13.4 Major End-Use Industry Deep Dives
- 13.4.1 Customer Requirements and Use Cases
- 13.4.2 Demand and Replacement Cycles
- 13.4.3 Technical and Regulatory Considerations
- 13.4.4 Purchasing and Procurement Models
- 13.4.5 Leading Vendors and Distribution Channels
- 13.4.6 Forecast and Commercial Opportunities
- 13.5 Emerging Applications and Cross-Segment Demand
- 13.6 End-Use Industry Investment Priorities
Chapter 14 USA Biosensors Geographic Market Outlook, 2025-2035
- 14.1 Domestic Market Distribution and Demand Clusters
- 14.2 State- or Province-Wise Market Size and Forecast, 2025-2035
- 14.3 City and Metropolitan Market Outlook
- 14.4 Industrial, Manufacturing and Commercial Clusters
- 14.5 Geographic Concentration of Key End Users
- 14.6 Local Pricing and Purchasing Differences
- 14.7 Domestic Production Facilities and Capacity Map
- 14.8 Local Infrastructure and Project Pipeline
- 14.9 State-Level Policy and Incentive Differences
- 14.10 Subnational Investment Hotspots and Opportunities
- 14.11 Distribution and Logistics Networks
- 14.12 Domestic Competitive Footprint
Chapter 15 USA Biosensors Technology, Innovation and Sustainability Outlook
- 15.1 Technology Landscape and Maturity
- 15.2 Product, Process and Service Innovation
- 15.3 AI, Automation and Digital Tools in the Industry
- 15.4 Technology Adoption and Performance Benchmarking
- 15.5 Innovation Pipeline and R&D Investment
- 15.6 Patent and Intellectual Property Trends
- 15.7 Energy Efficiency and Resource Management
- 15.8 Sustainability, Recycling and Circularity
- 15.9 Technology Roadmap, 2025-2035
- 15.10 Risks of Obsolescence and Technology Substitution
Chapter 16 USA Biosensors Market Key Strategic Imperatives
- 16.1 Growth and Market Entry Priorities
- 16.2 High-Return Products and Segments
- 16.3 Pricing, Profitability and Cost Optimization
- 16.4 Technology Investment and Product Differentiation
- 16.5 Supply Chain Localization and Resilience
- 16.6 Distribution and Customer Acquisition
- 16.7 Partnership, Acquisition and Capacity Strategy
- 16.8 Regional Expansion Priorities
- 16.9 Short-, Medium- and Long-Term Actions
Chapter 17 Competition Outlook
- 17.1 Industry Competition Characteristics
- 17.2 Market Structure and Concentration
- 17.3 Market Share and Competitive Positioning, 2025
- 17.4 Company-Wise Revenue and Product Benchmarking
- 17.5 Production and Service Capacity Benchmarking
- 17.6 Technology, Pricing and Differentiation
- 17.7 Regional Footprint and Distribution Strength
- 17.8 Mergers, Acquisitions and Strategic Alliances
- 17.9 New Entrants and Competitive Threats
- 17.10 Porter's Five Forces and Industry Attractiveness
- 17.11 Competitive Outlook, 2025-2035
Chapter 18 Company Profiles
- 18.1 Company Coverage and Selection Criteria
- 18.2 Abbott
- 18.2.1 Business Description
- 18.2.2 Company Ownership and Geographic Presence
- 18.2.3 Product and Service Portfolio
- 18.2.4 Manufacturing and Operating Footprint
- 18.2.5 Production Capacity and Expansion Plans
- 18.2.6 Financial Performance and Investment
- 18.2.7 Market Share and Competitive Position
- 18.2.8 Technology and Innovation Capabilities
- 18.2.9 Strategic Alliances or Partnerships
- 18.2.10 Recent Developments
- 18.2.11 Growth Strategy and Outlook
- 18.3 Dexcom
- 18.4 Medtronic
- 18.5 Roche
- 18.6 LifeScan
- 18.7 MiniMed
- 18.8 Senseonics
- 18.9 Ascensia Diabetes Care
- 18.10 Biolinq
- 18.11 Cytiva
- 18.12 Other Relevant Market Participants
Note: Every listed company is profiled on the structure shown under the first company. The company list is preliminary and may change based on research findings, market developments, data availability and client requirements.
Chapter 19 Disclaimer
- 19.1 Research and Forecast Disclaimer
- 19.2 Data Source and Estimation Limitations
Note: The depth of individual sections depends on data availability for this market. Volume, capacity, trade and other unit-based metrics are included where applicable.