
Market overview
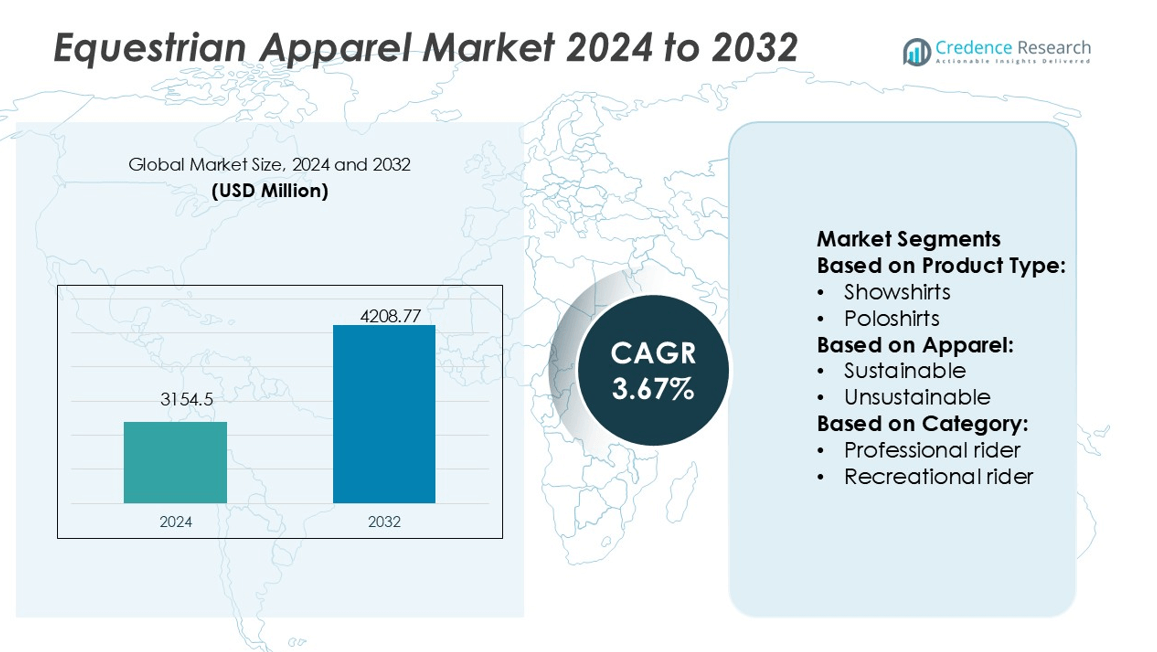
Equestrian Apparel Market size was valued USD 3154.5 million in 2024 and is anticipated to reach USD 4208.77 million by 2032, at a CAGR of 3.67% during the forecast period.
| REPORT ATTRIBUTE | DETAILS |
|---|---|
| Historical Period | 2020-2023 |
| Base Year | 2024 |
| Forecast Period | 2025-2032 |
| Equestrian Apparel MarketSize 2024 | USD 3154.5 million |
| Equestrian Apparel Market, CAGR | 3.67% |
| Equestrian Apparel Market Size 2032 | USD 4208.77 million |
The equestrian apparel market features strong competition from leading players such as Kingsland Equestrian, Horze, Pikeur, Goode Rider, Equi-Star, Eskadron, Dublin, Kentucky Horsewear, Helite, and Charles Owen. These companies focus on innovation, safety, sustainability, and performance-driven designs to strengthen their market presence across professional and recreational segments. North America leads the global equestrian apparel market with a 35% share, supported by high participation in equestrian sports, strong consumer spending on premium riding gear, and extensive distribution through both retail and e-commerce channels. This regional dominance is further reinforced by established equestrian culture, international competitions, and rising demand for sustainable and technologically advanced apparel.
Market Insights
- The equestrian apparel market size was valued at USD 3154.5 million in 2024 and is projected to reach USD 4208.77 million by 2032, registering a CAGR of 3.67% during the forecast period.
- Market growth is driven by increasing participation in equestrian sports, demand for performance-oriented apparel, and rising adoption of sustainable fabrics in riding gear.
- Key players strengthen competitiveness by focusing on safety-certified helmets, eco-friendly materials, and innovative product designs that cater to both professional and recreational riders.
- High pricing of premium apparel and seasonal demand variations remain restraints, creating challenges for affordability and inventory management across regions.
- North America leads with a 35% share, Europe follows with 30%, while breeches in the product category hold the dominant segment share at 42%, supported by their superior durability and rider comfort.
Market Segmentation Analysis:
By Product Type
In the equestrian apparel market, topwear remains the leading sub-segment, holding 38% market share. Showshirts and polos drive steady sales due to their functionality and appeal in both training and competition. Showjackets, although niche, sustain demand in formal events, while outwear supports seasonal growth. In bottomwear, breeches dominate with 42% share, driven by their design for durability, grip, and rider comfort. Riding tights gain traction among young and recreational riders for their affordability and ease of use. Socks and thermal wear serve as add-on purchases that enhance overall category revenue.
- For instance, Block, Inc., a financial services and digital payments company, reported a total workforce of around 11,300 employees as of late 2024, following strategic layoffs earlier in the year. Its consumer payments app, Cash App, served 57 million monthly active users as of early 2025.
By Apparel
Sustainable equestrian apparel has gained momentum, capturing 33% of total market share. Riders increasingly prefer eco-friendly fabrics and responsibly sourced materials that offer both performance and environmental value. Brands focusing on recycled textiles and biodegradable packaging attract environmentally conscious buyers. Companies introducing durable, high-performance sustainable breeches and jackets secure strong brand loyalty. This trend is reinforced by younger demographics prioritizing sustainability in purchase decisions. Demand is further fueled by international events highlighting sustainable equestrian fashion, encouraging wider adoption across competitive and recreational segments.
- For instance, PayPal’s fraud detection system saw significant performance improvements by integrating Aerospike as a real-time caching layer. This enabled a 5x throughput increase for the caching component, supporting scaling from 200,000 to 1,000,000 transactions per second.
By Category
Professional riders account for the dominant share at 55%, driven by high spending power and the need for premium-grade apparel. Their demand centers on performance-oriented gear such as breeches, showjackets, and advanced fabrics designed for flexibility and endurance. Sponsorship deals and brand endorsements further strengthen this segment, ensuring steady product innovation. Recreational riders, though price-sensitive, represent a growing customer base with rising interest in casual and leisure riding apparel. This group favors affordable tights, polos, and sustainable clothing, contributing to consistent category expansion. Growing participation in leisure riding strengthens long-term opportunities.
Key Growth Drivers
Rising Participation in Equestrian Sports
The equestrian apparel market benefits from growing participation in horse riding, dressage, and show jumping worldwide. Rising awareness of horse-related activities as a lifestyle and fitness option increases apparel demand. Expanding equestrian clubs, riding schools, and international competitions support consistent product uptake. High-performance gear that combines safety, comfort, and durability appeals to both professional and amateur riders. This trend is particularly visible in developed regions such as Europe and North America, where equestrian sports enjoy long-standing popularity and structured industry support.
- For instance, FIS reduced legacy tech workload share from 48 % to 9 %, shifting the majority of processing onto its new public and hybrid cloud platform, with its Investment Data Platform (IDP) processing billions of data records daily via Snowflake infrastructure.
Increased Focus on Performance-Oriented Apparel
Demand for performance-oriented equestrian apparel is driving significant growth, supported by innovations in fabric technology and design. Breeches, jackets, and riding shirts now incorporate moisture-wicking, stretchable, and breathable materials that enhance rider comfort during extended use. Safety features such as reinforced stitching and ergonomic fits also improve riding performance and protection. Professional riders increasingly demand apparel that combines durability with style, boosting premium product sales. This emphasis on functionality ensures strong repeat purchases and brand loyalty among competitive riders.
- For instance, Adyen routes every transaction through real-time ML inference models using its “Uplift” payments optimization system. This system has been shown to boost authorization rates, with some pilots demonstrating an uplift of up to 6% points compared to previous routing.
Shift Toward Sustainable and Ethical Products
Sustainability is a leading growth driver as consumers increasingly prioritize eco-friendly products. Brands investing in recycled fabrics, biodegradable materials, and ethical manufacturing practices are capturing rising market share. Younger demographics, in particular, value transparency in sourcing and production, pushing companies to adopt greener practices. International equestrian fashion shows and global sustainability movements further highlight eco-conscious apparel. This shift not only drives new product launches but also strengthens brand positioning among environmentally aware riders, creating long-term opportunities for manufacturers and retailers.
Key Trends & Opportunities
Integration of Smart and Functional Textiles
The market is witnessing growing adoption of smart textiles designed to improve rider safety and comfort. Wearable technologies, such as apparel with integrated sensors, provide posture monitoring, body temperature control, and performance feedback. Lightweight and breathable fabrics embedded with functional properties like UV protection and antibacterial resistance are gaining traction. This trend opens opportunities for brands to differentiate through innovation. As riders seek higher-value products, integrating technology into equestrian clothing becomes a pathway for premium pricing and expanded market appeal.
- For instance, OpenPayd processes an annualized transaction volume exceeding €130 billion via its API infrastructure, supporting over 5 million connected accounts and guaranteeing 99.99% platform uptime, which demonstrates its capacity to embed finance at scale.
Expansion of E-commerce Channels
E-commerce growth is creating strong opportunities for equestrian apparel brands to access broader consumer bases. Online platforms offer convenience, product variety, and customization options that traditional retail often lacks. Brands are leveraging digital marketing, influencer collaborations, and virtual fitting tools to attract riders globally. The pandemic accelerated consumer comfort with online shopping, a trend that continues to benefit niche apparel categories. International sales through e-commerce also allow emerging brands to compete alongside established players, strengthening market competitiveness.
- For instance, Rio Tinto’s BlueSmelting™ pilot plant at its Sorel-Tracy site can process up to 40,000 tonnes of ilmenite ore annually, enabling production of high-grade TiO₂ feedstock with a reduction in greenhouse gas emissions of up to 95% compared to conventional reduction methods.
Key Challenges
High Pricing of Premium Apparel
Premium equestrian apparel often comes with elevated costs due to advanced fabrics, tailored designs, and safety certifications. While professionals can afford high-performance gear, recreational riders may find prices restrictive. This creates a demand gap between affordable and premium segments, limiting wider adoption. Brands must balance cost efficiency and product innovation to sustain growth. Without addressing affordability, companies risk losing price-sensitive customers who may shift to lower-quality alternatives or limit purchases to essential items only.
Seasonal and Regional Demand Variations
The equestrian apparel market faces challenges from fluctuating seasonal and regional demand. Cold-weather gear such as jackets and thermal wear experience high sales in winter but lower volumes in warmer months. Similarly, regions with limited equestrian culture or infrastructure present slower adoption rates. This uneven demand complicates inventory management and supply chain planning. Companies need adaptive production cycles and flexible distribution networks to address these variations. Failure to manage seasonal fluctuations may lead to excess inventory or supply shortages.
Regional Analysis
North America
North America holds the largest share of the equestrian apparel market at 35%, driven by a strong culture of equestrian sports and well-established industry infrastructure. The United States leads with widespread participation in horse riding, competitive events, and recreational activities, while Canada contributes through growing adoption of equestrian leisure pursuits. High disposable income and preference for premium-quality apparel strengthen the demand for performance-driven products such as breeches, showjackets, and sustainable riding gear. Expanding e-commerce platforms also enable wider access to niche brands, consolidating North America’s dominant position in global equestrian apparel sales.
Europe
Europe accounts for 30% of the equestrian apparel market, supported by its long-standing equestrian traditions and extensive participation in horse sports. Countries such as Germany, the United Kingdom, and France dominate, hosting numerous professional competitions that drive apparel sales. European consumers place strong emphasis on sustainability and innovation, boosting demand for eco-friendly fabrics and advanced performance apparel. The region also benefits from established manufacturing hubs and globally recognized equestrian brands. Professional riders in Europe represent a significant customer base, driving steady adoption of high-end products that enhance both functionality and style in competitive settings.
Asia-Pacific
Asia-Pacific captures 20% of the equestrian apparel market, with growth led by rising equestrian sports participation in China, Japan, and Australia. Growing middle-class income and increasing interest in horse riding as a leisure and lifestyle activity fuel market expansion. China’s rapid development of equestrian clubs and training facilities is driving demand for affordable as well as premium riding gear. Australia contributes significantly through recreational riding culture and international competition presence. Expanding e-commerce platforms and growing brand penetration further strengthen the regional outlook, making Asia-Pacific a key emerging hub for equestrian apparel growth.
Latin America
Latin America holds 8% of the equestrian apparel market, supported by the popularity of horse-related sports such as polo in Argentina and rodeo traditions in Brazil and Mexico. Rising urbanization and disposable incomes are driving interest in leisure equestrian activities, creating opportunities for apparel brands. While the market remains smaller compared to North America and Europe, demand for affordable riding apparel and sustainable options is increasing. Local events and growing awareness of equestrian culture also contribute to steady market expansion. Limited infrastructure remains a challenge, but rising participation supports long-term growth prospects.
Middle East & Africa
The Middle East and Africa collectively account for 7% of the equestrian apparel market, supported by cultural and recreational interest in horse riding. The Middle East, particularly the UAE and Saudi Arabia, shows strong demand due to equestrian sports being deeply rooted in heritage. High spending power in the region sustains demand for luxury and premium riding apparel. Africa’s market is comparatively smaller, with South Africa leading through established riding clubs and events. While growth is moderate, increasing exposure to international competitions and rising recreational interest contribute to steady demand for equestrian apparel in these regions.
Market Segmentations:
By Product Type:
- Showshirts
- Poloshirts
By Apparel:
- Sustainable
- Unsustainable
By Category:
- Professional rider
- Recreational rider
By Geography
- North America
- U.S.
- Canada
- Mexico
- Europe
- Germany
- France
- U.K.
- Italy
- Spain
- Rest of Europe
- Asia Pacific
- China
- Japan
- India
- South Korea
- South-east Asia
- Rest of Asia Pacific
- Latin America
- Brazil
- Argentina
- Rest of Latin America
- Middle East & Africa
- GCC Countries
- South Africa
- Rest of the Middle East and Africa
Competitive Landscape
The equestrian apparel market is shaped by key players including Kingsland Equestrian, Horze, Pikeur, Goode Rider, Equi-Star, Eskadron, Dublin, Kentucky Horsewear, Helite, and Charles Owen. The equestrian apparel market is highly competitive, characterized by innovation, brand differentiation, and expanding product portfolios. Companies focus on developing high-performance riding gear that combines safety, comfort, and style to appeal to both professional and recreational riders. Sustainability is becoming a major competitive factor, with brands investing in eco-friendly fabrics and ethical production processes. Digital sales channels, particularly e-commerce platforms, play a critical role in expanding global reach and enabling direct consumer engagement. Partnerships with equestrian events and endorsements from professional riders further strengthen brand visibility, while affordability and premium quality continue to define market positioning strategies.
Key Player Analysis
- Kingsland Equestrian
- Horze
- Pikeur
- Goode Rider
- Equi-Star
- Eskadron
- Dublin
- Kentucky Horsewear
- Helite
- Charles Owen
Recent Developments
- In October 2024, Ariat International, Inc. teamed up with American rodeo champion Trevor Brazile to launch the Relentless Futurity collection. This new line features boots designed for competition, riding, and everyday wear, signifying an expansion of Ariat product offerings.
- In July 2024, Samshield, renowned for its innovative approach to horse riding helmets, launched a new line of helmets 2.0. These cutting-edge helmets represent the culmination of four years of research, offering exceptional comfort and top-tier safety.
- In June 2024, Horse Racing Ireland responded to an investigative documentary exposing mistreatment within the horse racing industry. HRI pledged a investment in welfare and integrity services, while the Irish Minister for Agriculture announced an investigation into equine slaughter supply practices, underscoring a commitment to animal welfare.
- In February 2023, US Equestrian reported an extension to their partnership with UK based sportswear Charles Owen. They will continue serving as the official helmet supplier for US Equestrian.
Report Coverage
The research report offers an in-depth analysis based on Product Type, Apparel, Category and Geography. It details leading market players, providing an overview of their business, product offerings, investments, revenue streams, and key applications. Additionally, the report includes insights into the competitive environment, SWOT analysis, current market trends, as well as the primary drivers and constraints. Furthermore, it discusses various factors that have driven market expansion in recent years. The report also explores market dynamics, regulatory scenarios, and technological advancements that are shaping the industry. It assesses the impact of external factors and global economic changes on market growth. Lastly, it provides strategic recommendations for new entrants and established companies to navigate the complexities of the market.
Future Outlook
- The equestrian apparel market will expand with rising global participation in horse riding activities.
- Demand for sustainable and eco-friendly fabrics will continue to strengthen brand positioning.
- Technological integration such as smart textiles will enhance rider safety and performance.
- E-commerce platforms will play a greater role in boosting global sales and visibility.
- Premium product demand will rise as professional riders seek high-performance apparel.
- Affordable collections will attract recreational riders and expand customer reach.
- Regional growth will accelerate in Asia-Pacific with increasing equestrian clubs and events.
- Strategic collaborations with equestrian associations will support brand recognition.
- Product customization and personalization will gain importance among younger riders.
- Sustainability certifications and ethical sourcing will become key differentiators for long-term competitiveness.

Request a Free Sample
Fill in your details and we'll send you a free sample report.
- Sample data tables & charts
- Research methodology
Market Dynamics
Rising Participation in Equestrian Sports
Increasing involvement in horse riding, dressage, and show jumping globally is expanding the consumer base for equestrian apparel. Growth in equestrian clubs, riding schools, and international competitions is fueling consistent demand for specialized clothing.
Demand for Performance-Oriented Apparel
Riders, especially professionals, are seeking apparel that offers enhanced comfort, durability, and safety. Innovations in fabric technology, such as moisture-wicking and stretchable materials, are driving repeat purchases and brand loyalty.
Shift Toward Sustainable and Ethical Products
Consumers, particularly younger demographics, are prioritizing eco-friendly and ethically produced apparel. Brands investing in recycled fabrics and biodegradable packaging are capturing greater market share and strengthening their competitive positioning.
Integration of Smart and Functional Textiles
The adoption of smart textiles, including apparel with integrated sensors for posture monitoring and temperature control, is enhancing rider safety and comfort. This technological innovation is enabling premium pricing and product differentiation.
Expansion of E-commerce Channels
Growth in online retail is making equestrian apparel more accessible to a global audience. E-commerce platforms offer convenience, product variety, and customization, allowing brands to reach new customers and boost sales beyond traditional retail channels.
Need a Custom Version of This Report?
Tailor the scope, geography, or segments to your exact requirements.
- Custom geography or segment scope
- Direct access to our analyst team
Frequently Asked Questions
What is the current market size for Equestrian Apparel Market, and what is its projected size in 2032?
At what Compound Annual Growth Rate is the Equestrian Apparel Market projected to grow between 2025 and 2032?
Which Equestrian Apparel Market segment held the largest share in 2024?
What are the primary factors fueling the growth of the Equestrian Apparel Market?
Who are the leading companies in the Equestrian Apparel Market?
Table of Content
Chapter 1 Market Segmentation
- 1.1 Segmentation Framework
- 1.1.1 Product and Service Classification
- 1.1.2 Application and End-Use Classification
- 1.1.3 Technology and Solution Classification
- 1.1.4 Customer and Distribution Channel Classification
- 1.1.5 Geographic Segmentation
- 1.1.6 Market Segment Definitions and Boundaries
- 1.2 By Apparel
- 1.2.1 Sustainable
- 1.2.2 Unsustainable
- 1.3 By Category
- 1.3.1 Professional rider
- 1.3.2 Recreational rider
- 1.4 By Product Type
- 1.4.1 Showshirts
- 1.4.2 Poloshirts
- 1.4.3 Showjackets
- 1.4.4 Breeches
- 1.4.5 Riding Tights
- 1.4.6 Outerwear
Chapter 2 Introduction
- 2.1 Report Objectives and Scope
- 2.2 Product Definition and Industry Terminology
- 2.3 Market Inclusions and Exclusions
- 2.4 Research Process
- 2.4.1 Primary Research and Expert Interviews
- 2.4.2 Secondary Research and Source Review
- 2.4.3 Top-Down and Bottom-Up Estimation
- 2.4.4 Data Triangulation and Verification
- 2.5 Market Size Measurement Basis
- 2.5.1 2024: USD 3154.5 million → 2032: USD 4208.77 million
- 2.6 Historical and Forecast Reference Periods
- 2.6.1 Base Year: 2024
- 2.6.2 Forecast Period: 2024-2032
- 2.7 Research Assumptions and Limitations
Chapter 3 Executive Summary
- 3.1 Market Snapshot and Key Findings
- 3.2 Base-Year Market Size, 2024
- 3.3 Forecast Market Size, 2032
- 3.4 Revenue and Volume Growth Outlook
- 3.5 Key Demand and Supply Indicators
- 3.6 Leading Market Segments
- 3.7 Fastest-Growing Market Opportunities
- 3.8 Regional Performance Highlights
- 3.9 Technology and Industry Transformation
- 3.10 Competitive Landscape Summary
- 3.11 Analyst View and Strategic Implications
Chapter 4 Equestrian Apparel Market Trends and Developments
- 4.1 Historical Industry Development
- 4.2 Recent Market Trends and Developments
- 4.3 Demand and Customer Behavior Trends
- 4.4 Technology and Product Innovation
- 4.5 Artificial Intelligence, Automation and Digitalization
- 4.6 Local Manufacturing and Supply Chain Realignment
- 4.7 Industry Partnerships, Mergers and Acquisitions
- 4.8 Sustainability and Circular Economy Developments
- 4.9 Government and Private Sector Investment Trends
- 4.10 Emerging Business Models and Commercialization
- 4.11 Industry Developments and Announcements
Chapter 5 Equestrian Apparel Market Production, Supply and Demand Analysis
- 5.1 Demand Trend and Consumption Analysis
- 5.2 Demand Forecast, 2024-2032
- 5.3 Production and Output Trend
- 5.4 Production and Output Forecast, 2024-2032
- 5.5 Installed Capacity and Capacity Utilization
- 5.6 Company-Wise Production Plants and Statistics
- 5.6.1 Installed Production Capacity
- 5.6.2 Actual Production
- 5.6.3 Planned Capacity and Expansion Targets
- 5.7 Supply Chain Structure and Procurement Trends
- 5.8 Supply-Demand Gap and Bottlenecks
- 5.9 Import Dependence and Sourcing Structure
- 5.10 Contract Manufacturing and Outsourcing
- 5.11 Regional Supply and Demand Concentration
Chapter 6 Equestrian Apparel Market Pricing Analysis
- 6.1 Pricing Structure and Measurement
- 6.2 Historical Pricing Trends
- 6.3 Pricing Outlook, 2024-2032
- 6.4 Average Selling Price and Unit Economics
- 6.5 Pricing by Product and Market Segment
- 6.6 Geographic Pricing Differences
- 6.7 Key Input, Energy, Labor and Logistics Costs
- 6.8 Contract Pricing and Purchasing Models
- 6.9 Pricing Sensitivity and Competitive Positioning
- 6.10 Price, Margin and Profitability Implications
Chapter 7 Equestrian Apparel Market Dynamics
- 7.1 Market Growth Drivers
- 7.1.1 Demand-Side Drivers
- 7.1.2 Technology and Innovation Drivers
- 7.1.3 Infrastructure and Investment Drivers
- 7.1.4 Regulatory and Policy Drivers
- 7.2 Market Restraints
- 7.2.1 Cost and Affordability Constraints
- 7.2.2 Technology and Adoption Barriers
- 7.2.3 Supply Chain and Operational Constraints
- 7.3 Market Challenges
- 7.3.1 Competitive Pressure and Margin Erosion
- 7.3.2 Skills, Infrastructure and Implementation Gaps
- 7.4 Emerging Market Opportunities
- 7.5 Market Dynamics Impact and Time-Horizon Assessment
Chapter 8 Equestrian Apparel Value Chain Analysis
- 8.1 Industry Value Chain Overview
- 8.2 Upstream Suppliers and Critical Inputs
- 8.3 Technology and Component Providers
- 8.4 Manufacturing or Service Delivery
- 8.5 Distribution, Channel Partners and Integrators
- 8.6 Downstream Applications and End Users
- 8.7 Value Addition and Profit Pools
- 8.8 Vertical Integration and Outsourcing
- 8.9 Supplier Concentration and Risk
- 8.10 Supply Chain Localization and Resilience
Chapter 9 Equestrian Apparel Market Regulations and Policies
- 9.1 Relevant Laws, Standards and Compliance Frameworks
- 9.2 Product, Service, Safety and Quality Requirements
- 9.3 Government Policies, Incentives and Subsidies
- 9.4 Imports, Exports and Trade Barriers
- 9.5 Public Procurement and Local Content Requirements
- 9.6 Environmental and Sustainability Compliance
- 9.7 Upcoming Policy Changes and Market Implications
Chapter 10 Equestrian Apparel Market Hotspots and Opportunities
- 10.1 Market Opportunity Mapping and Growth Hotspots
- 10.2 High-Growth Applications and Customer Groups
- 10.3 Underserved Markets and White-Space Opportunities
- 10.4 Emerging Technology and Product Opportunities
- 10.5 New Capacity and Investment Hotspots
- 10.6 Market Entry and Expansion Opportunities
- 10.7 Distribution and Partnership Opportunities
- 10.8 Near-Term and Long-Term Commercial Potential
- 10.9 Opportunity Attractiveness and Execution Risks
Chapter 11 Equestrian Apparel Market Outlook, 2024-2032
- 11.1 Market Size and Analysis
- 11.1.1 Revenue (Market Measurement: 2024: USD 3154.5 million → 2032: USD 4208.77 million)
- 11.1.2 Market Volume and Quantity Sold
- 11.1.3 Historical Market Size
- 11.1.4 Base-Year Market Size, 2024
- 11.2 Market Forecast, 2024-2032
- 11.2.1 Revenue Forecast to 2032
- 11.2.2 Volume Forecast to 2032
- 11.2.3 CAGR and Year-on-Year Growth
- 11.2.4 Incremental Revenue Opportunity
- 11.3 Forecast Assumptions and Scenario Analysis
- 11.3.1 Base-Case Forecast
- 11.3.2 Optimistic and Conservative Scenarios
- 11.3.3 Technology, Pricing and Policy Sensitivities
- 11.4 Market Attractiveness and Growth Outlook
Chapter 12 Equestrian Apparel Market Segmentation and Outlook
- 12.1 Segmentation Summary and Market Shares, 2024
- 12.2 Largest and Fastest-Growing Segments
- 12.3 By Apparel - Market Size and Forecast, 2024-2032
- 12.3.1 Segment Definition and Scope
- 12.3.2 Historical Market Size
- 12.3.3 Revenue Forecast, 2024-2032
- 12.3.4 Volume Forecast, 2024-2032
- 12.3.5 Base-Year Market Share, 2024
- 12.3.6 Segment CAGR and Growth Drivers
- 12.3.7 Subsegment Market Size and Forecast
- 12.3.7.1 Sustainable
- 12.3.7.2 Unsustainable
- 12.3.8 Subsegment Pricing and Adoption Trends
- 12.3.9 Leading Suppliers and Competition
- 12.3.10 Regional Demand and Opportunities
- 12.4 By Category - Market Size and Forecast, 2024-2032
- 12.4.1 Segment Definition and Scope
- 12.4.2 Historical Market Size
- 12.4.3 Revenue Forecast, 2024-2032
- 12.4.4 Volume Forecast, 2024-2032
- 12.4.5 Base-Year Market Share, 2024
- 12.4.6 Segment CAGR and Growth Drivers
- 12.4.7 Subsegment Market Size and Forecast
- 12.4.7.1 Professional rider
- 12.4.7.2 Recreational rider
- 12.4.8 Subsegment Pricing and Adoption Trends
- 12.4.9 Leading Suppliers and Competition
- 12.4.10 Regional Demand and Opportunities
- 12.5 By Product Type - Market Size and Forecast, 2024-2032
- 12.5.1 Segment Definition and Scope
- 12.5.2 Historical Market Size
- 12.5.3 Revenue Forecast, 2024-2032
- 12.5.4 Volume Forecast, 2024-2032
- 12.5.5 Base-Year Market Share, 2024
- 12.5.6 Segment CAGR and Growth Drivers
- 12.5.7 Subsegment Market Size and Forecast
- 12.5.7.1 Showshirts
- 12.5.7.2 Poloshirts
- 12.5.7.3 Showjackets
- 12.5.7.4 Breeches
- 12.5.7.5 Riding Tights
- 12.5.7.6 Outerwear
- 12.5.8 Subsegment Pricing and Adoption Trends
- 12.5.9 Leading Suppliers and Competition
- 12.5.10 Regional Demand and Opportunities
- 12.6 Segment Growth Comparison
- 12.7 Segment Attractiveness and Priority Matrix
Chapter 13 Equestrian Apparel Geographic Market Outlook, 2024-2032
- 13.1 Domestic Market Distribution and Demand Clusters
- 13.2 State- or Province-Wise Market Size and Forecast, 2024-2032
- 13.3 City and Metropolitan Market Outlook
- 13.4 Industrial, Manufacturing and Commercial Clusters
- 13.5 Geographic Concentration of Key End Users
- 13.6 Local Pricing and Purchasing Differences
- 13.7 Domestic Production Facilities and Capacity Map
- 13.8 Local Infrastructure and Project Pipeline
- 13.9 State-Level Policy and Incentive Differences
- 13.10 Subnational Investment Hotspots and Opportunities
- 13.11 Distribution and Logistics Networks
- 13.12 Domestic Competitive Footprint
Chapter 14 Equestrian Apparel Technology, Innovation and Sustainability Outlook
- 14.1 Technology Landscape and Maturity
- 14.2 Product, Process and Service Innovation
- 14.3 AI, Automation and Digital Tools in the Industry
- 14.4 Technology Adoption and Performance Benchmarking
- 14.5 Innovation Pipeline and R&D Investment
- 14.6 Patent and Intellectual Property Trends
- 14.7 Energy Efficiency and Resource Management
- 14.8 Sustainability, Recycling and Circularity
- 14.9 Technology Roadmap, 2024-2032
- 14.10 Risks of Obsolescence and Technology Substitution
Chapter 15 Equestrian Apparel Market Key Strategic Imperatives
- 15.1 Growth and Market Entry Priorities
- 15.2 High-Return Products and Segments
- 15.3 Pricing, Profitability and Cost Optimization
- 15.4 Technology Investment and Product Differentiation
- 15.5 Supply Chain Localization and Resilience
- 15.6 Distribution and Customer Acquisition
- 15.7 Partnership, Acquisition and Capacity Strategy
- 15.8 Regional Expansion Priorities
- 15.9 Short-, Medium- and Long-Term Actions
Chapter 16 Competition Outlook
- 16.1 Industry Competition Characteristics
- 16.2 Market Structure and Concentration
- 16.3 Market Share and Competitive Positioning, 2024
- 16.4 Company-Wise Revenue and Product Benchmarking
- 16.5 Production and Service Capacity Benchmarking
- 16.6 Technology, Pricing and Differentiation
- 16.7 Regional Footprint and Distribution Strength
- 16.8 Mergers, Acquisitions and Strategic Alliances
- 16.9 New Entrants and Competitive Threats
- 16.10 Porter's Five Forces and Industry Attractiveness
- 16.11 Competitive Outlook, 2024-2032
Chapter 17 Company Profiles
- 17.1 Company Coverage and Selection Criteria
- 17.2 Kingsland Equestrian
- 17.2.1 Business Description
- 17.2.2 Company Ownership and Geographic Presence
- 17.2.3 Product and Service Portfolio
- 17.2.4 Manufacturing and Operating Footprint
- 17.2.5 Production Capacity and Expansion Plans
- 17.2.6 Financial Performance and Investment
- 17.2.7 Market Share and Competitive Position
- 17.2.8 Technology and Innovation Capabilities
- 17.2.9 Strategic Alliances or Partnerships
- 17.2.10 Recent Developments
- 17.2.11 Growth Strategy and Outlook
- 17.3 Horze
- 17.4 Pikeur
- 17.5 Goode Rider
- 17.6 Equi-Star
- 17.7 Eskadron
- 17.8 Dublin
- 17.9 Kentucky Horsewear
- 17.10 Helite
- 17.11 Charles Owen
- 17.12 Other Relevant Market Participants
Note: Every listed company is profiled on the structure shown under the first company. The company list is preliminary and may change based on research findings, market developments, data availability and client requirements.
Chapter 18 Disclaimer
- 18.1 Research and Forecast Disclaimer
- 18.2 Data Source and Estimation Limitations
Note: The depth of individual sections depends on data availability for this market. Volume, capacity, trade and other unit-based metrics are included where applicable.

