
Ovarian stimulation and ovulation induction drive demand
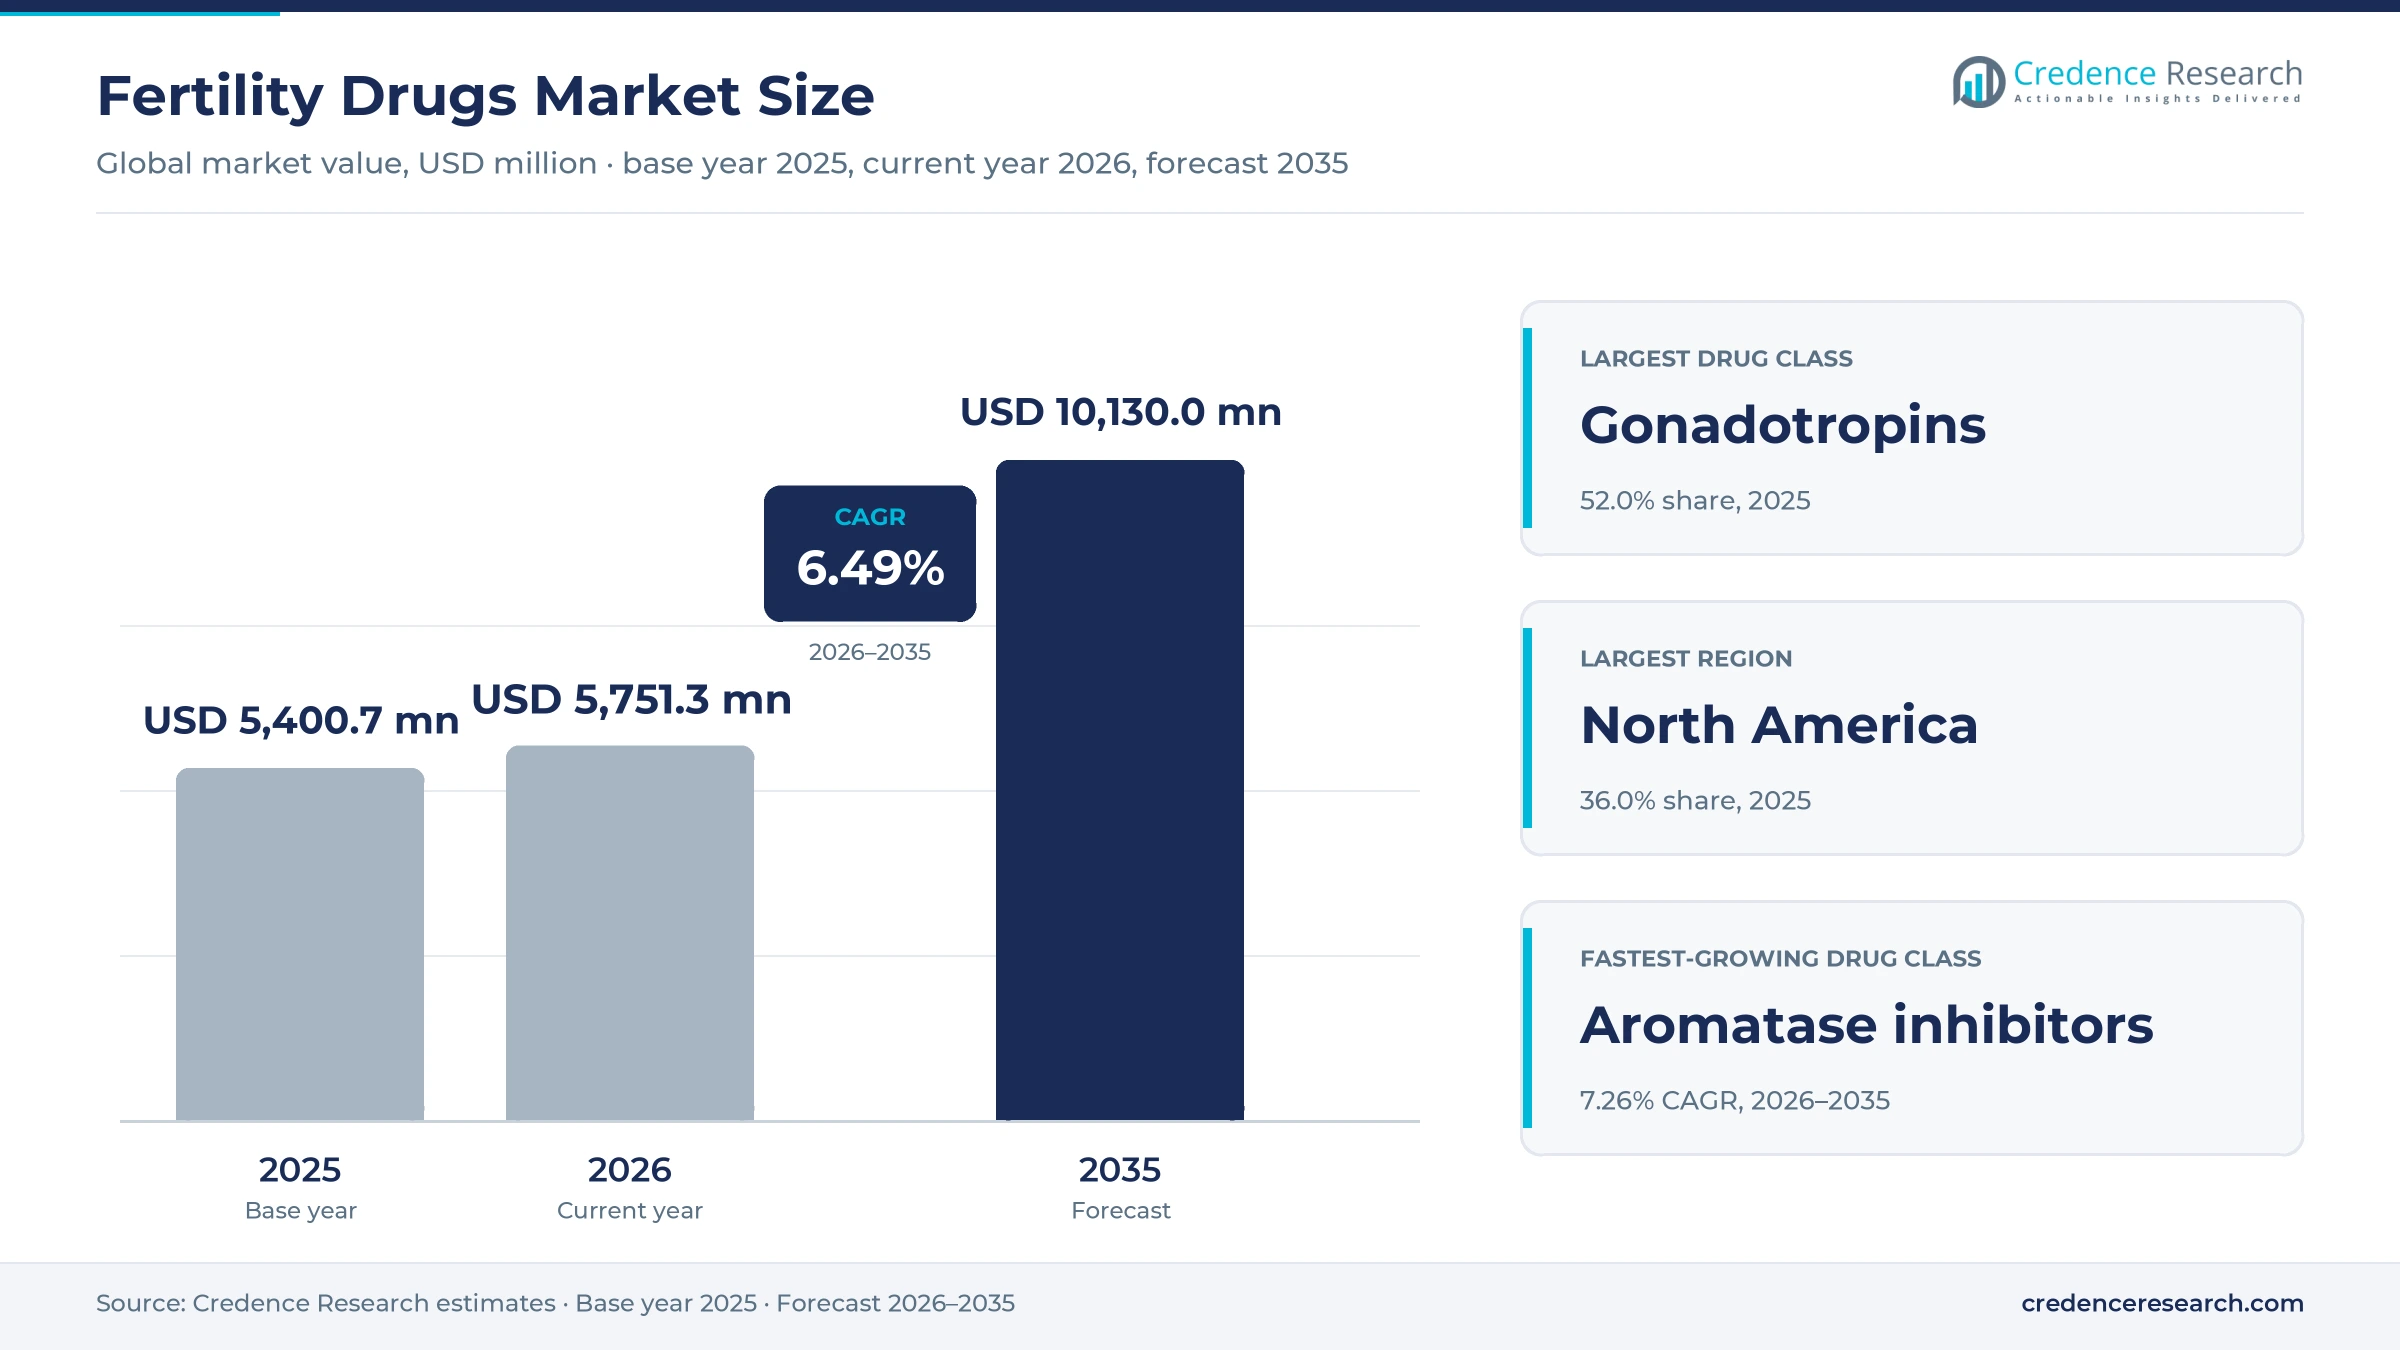
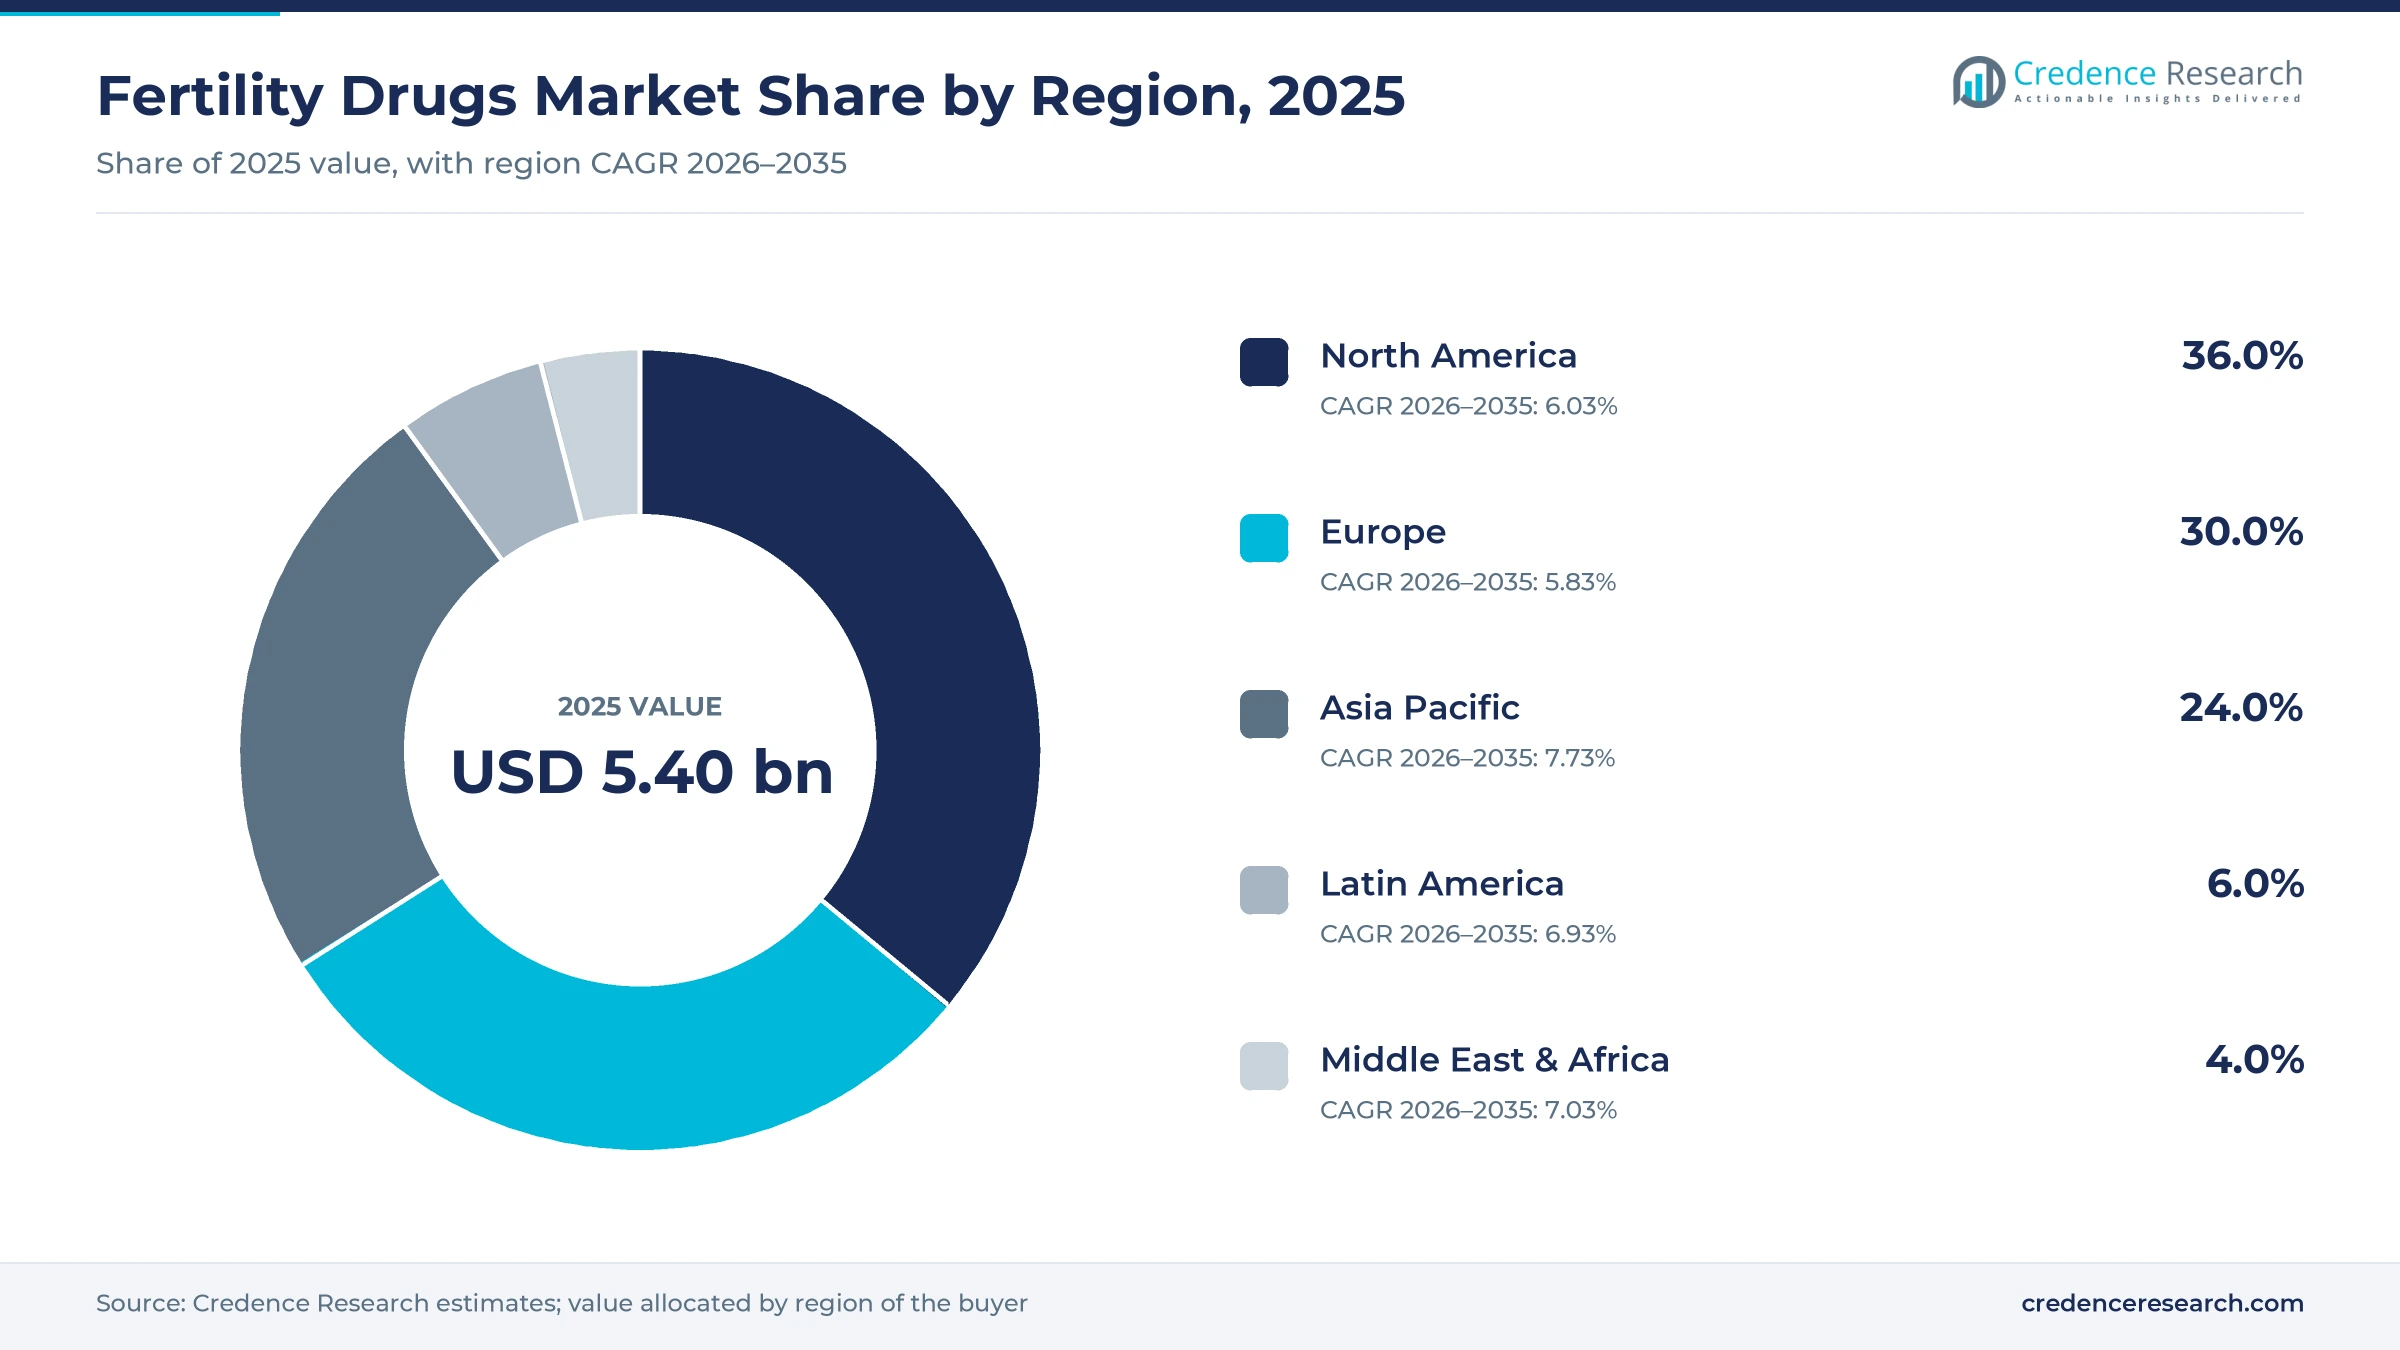
The global fertility drugs market was valued at USD 5.40 billion in 2025 and is projected to increase from USD 5.75 billion in 2026 to USD 10.13 billion by 2035, registering a CAGR of 6.49% during 2026–2035. Demand comes from couples and individuals treated for ovulation disorders, unexplained infertility and male factor infertility, and from clinics that use hormone injections to stimulate the ovaries before in vitro fertilization. North America held the largest regional share, 36.0% in 2025, because IVF cycles there use high doses of branded gonadotropins at high list prices. Asia Pacific is the fastest-growing region at 7.73% a year, as China, India and Japan expand fertility clinics and approve local recombinant hormones. The main commercial change came in October 2025, when EMD Serono agreed with the U.S. government to sell its core IVF medicines directly to patients at steep discounts.
Which hormones and tablets for conception are counted?
The market counts manufacturer revenue from prescription medicines used to treat infertility in women and men. It covers gonadotropins such as follicle-stimulating hormone and human chorionic gonadotropin, oral ovulation inducers, GnRH analogues used in stimulation cycles, dopamine agonists and luteal phase support. Buyers include fertility clinics, hospital and retail pharmacies, specialty and online pharmacies, insurers and patients paying out of pocket.
The scope excludes IVF laboratory equipment, culture media, clinic procedure fees, fertility tests and dietary supplements. Hormonal contraceptives and menopause hormone therapy are left out, even where the same molecules appear, because they are not prescribed to achieve pregnancy.
Fertility Drugs Market Insights
- The fertility drugs market grows from USD 5.40 billion in 2025 to USD 10.13 billion by 2035, a 6.49% CAGR over 2026–2035, as IVF access widens and hormone prices fall.
- North America held 36.0% of global fertility drug value in 2025, reflecting high-dose IVF protocols and high branded gonadotropin prices.
- Gonadotropins led drug classes with 52.0% of 2025 value, because every IVF stimulation cycle relies on daily hormone injections.
- The WHO issued its first global guideline on infertility on Nov. 28, 2025, with 40 recommendations on prevention, diagnosis and treatment.
- Sun Pharmaceutical agreed in April 2026 to acquire Organon & Co., maker of Follistim AQ, in an all-cash deal valued at USD 11.75 billion.
Gonadotropins and injectables hold most of the value
Why do gonadotropins hold the largest share?
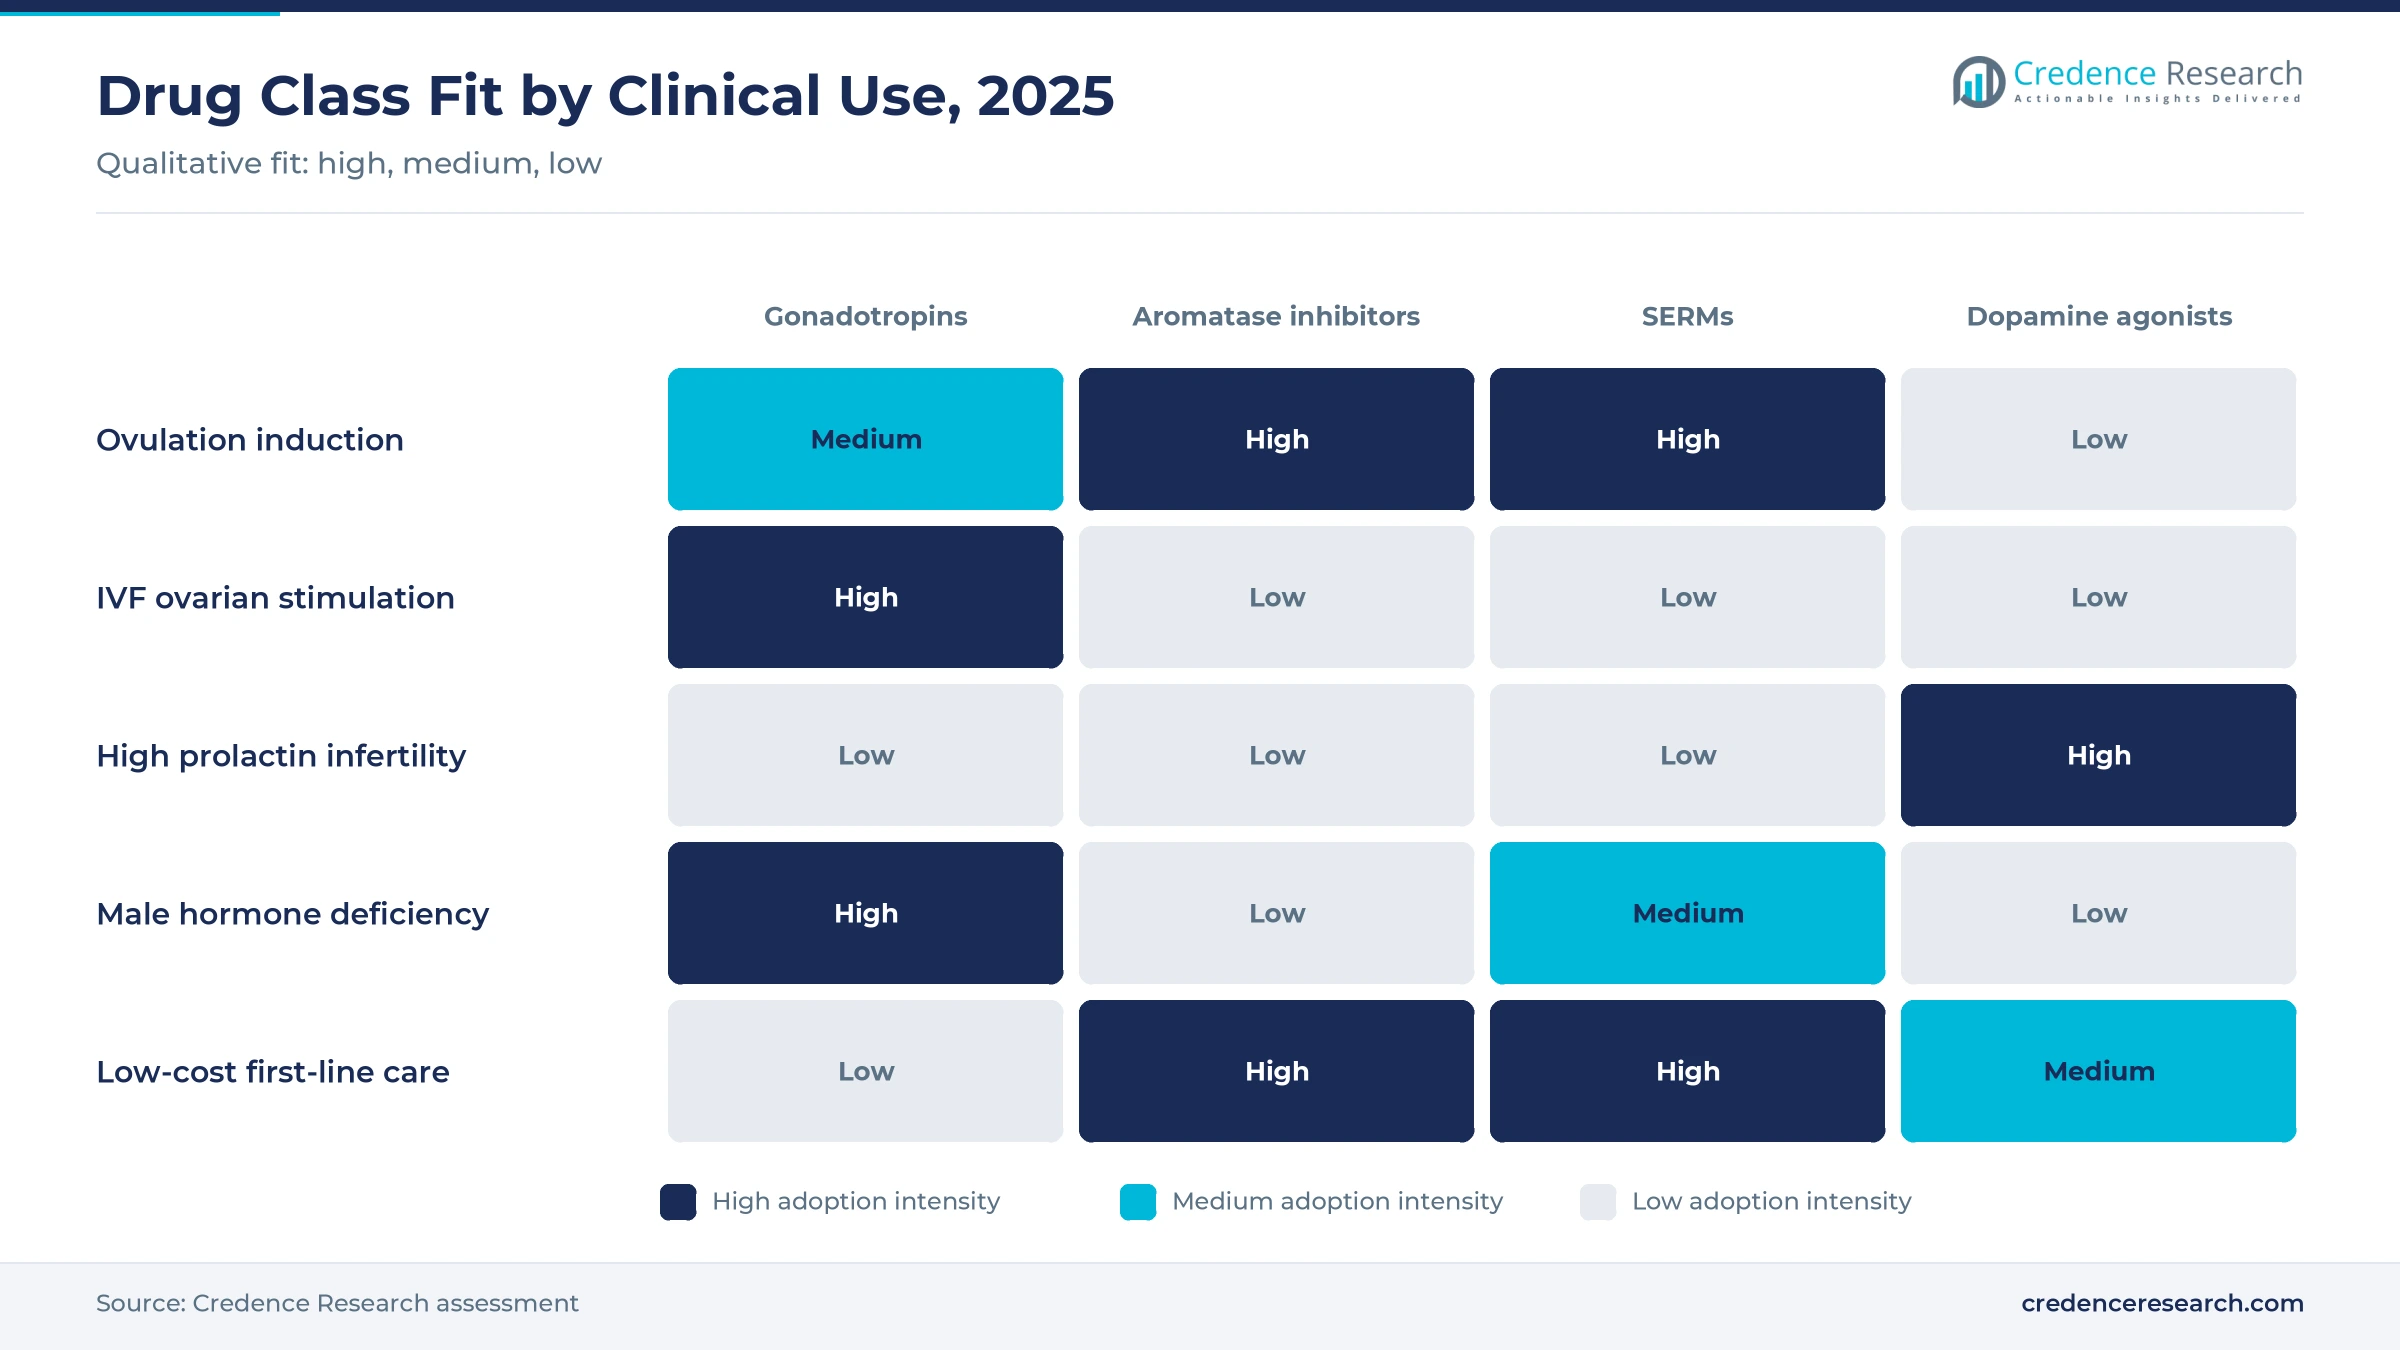
Based on drug class, the market is categorized into gonadotropins, aromatase inhibitors, selective estrogen receptor modulators (SERMs), dopamine agonists and other drug classes. Gonadotropins led with a 52.0% share of 2025 value, because IVF and intrauterine insemination cycles need several days of high-priced hormone injections. Aromatase inhibitors grow fastest at 7.26% a year, as clinicians use low-cost oral letrozole for ovulation induction in women with polycystic ovaries.
How do injections and tablets divide value?
Based on route of administration, the market is categorized into oral and injectable products. Injectable products led with a 68.0% share of 2025 value, because gonadotropins, GnRH antagonists and trigger shots are all given by injection. Injectable products also grow fastest at 6.63% a year, as more IVF cycles in Asia raise the use of prefilled hormone pens.
Why do treatments for women dominate spending?
Based on gender, the market is categorized into female and male patients. Female patients led with an 88.0% share of 2025 value, because ovarian stimulation, ovulation induction and luteal support are all given to women, even when the cause lies with the male partner. Male patients grow fastest at 7.28% a year, as hormone therapy for low sperm production gains wider clinical use.
Where do patients obtain fertility medicines?
Based on distribution channel, the market is categorized into hospital pharmacy, retail pharmacy, online pharmacy and others. Hospital Pharmacy led with a 38.0% share of 2025 value, because many IVF clinics sit within hospitals that dispense stimulation medicines. Online Pharmacy grows fastest at 8.12% a year, as direct-to-patient sales and home delivery of cold-chain pens expand.
| Segment Group | Leading Sub-segment | Share, 2025 | Fastest-growing Sub-segment | CAGR, 2026–2035 |
|---|---|---|---|---|
| By Drug Class | Gonadotropins | 52.0% | Aromatase inhibitors | 7.26% |
| By Route of Administration | Injectable | 68.0% | Injectable | 6.63% |
| By Gender | Female | 88.0% | Male | 7.28% |
| By Distribution Channel | Hospital Pharmacy | 38.0% | Online Pharmacy | 8.12% |
Request a Free Sample
Fill in your details and we'll send you a free sample report.
- Sample data tables & charts
- Research methodology
Common infertility, delayed parenthood and wider IVF access
How does common infertility sustain demand?
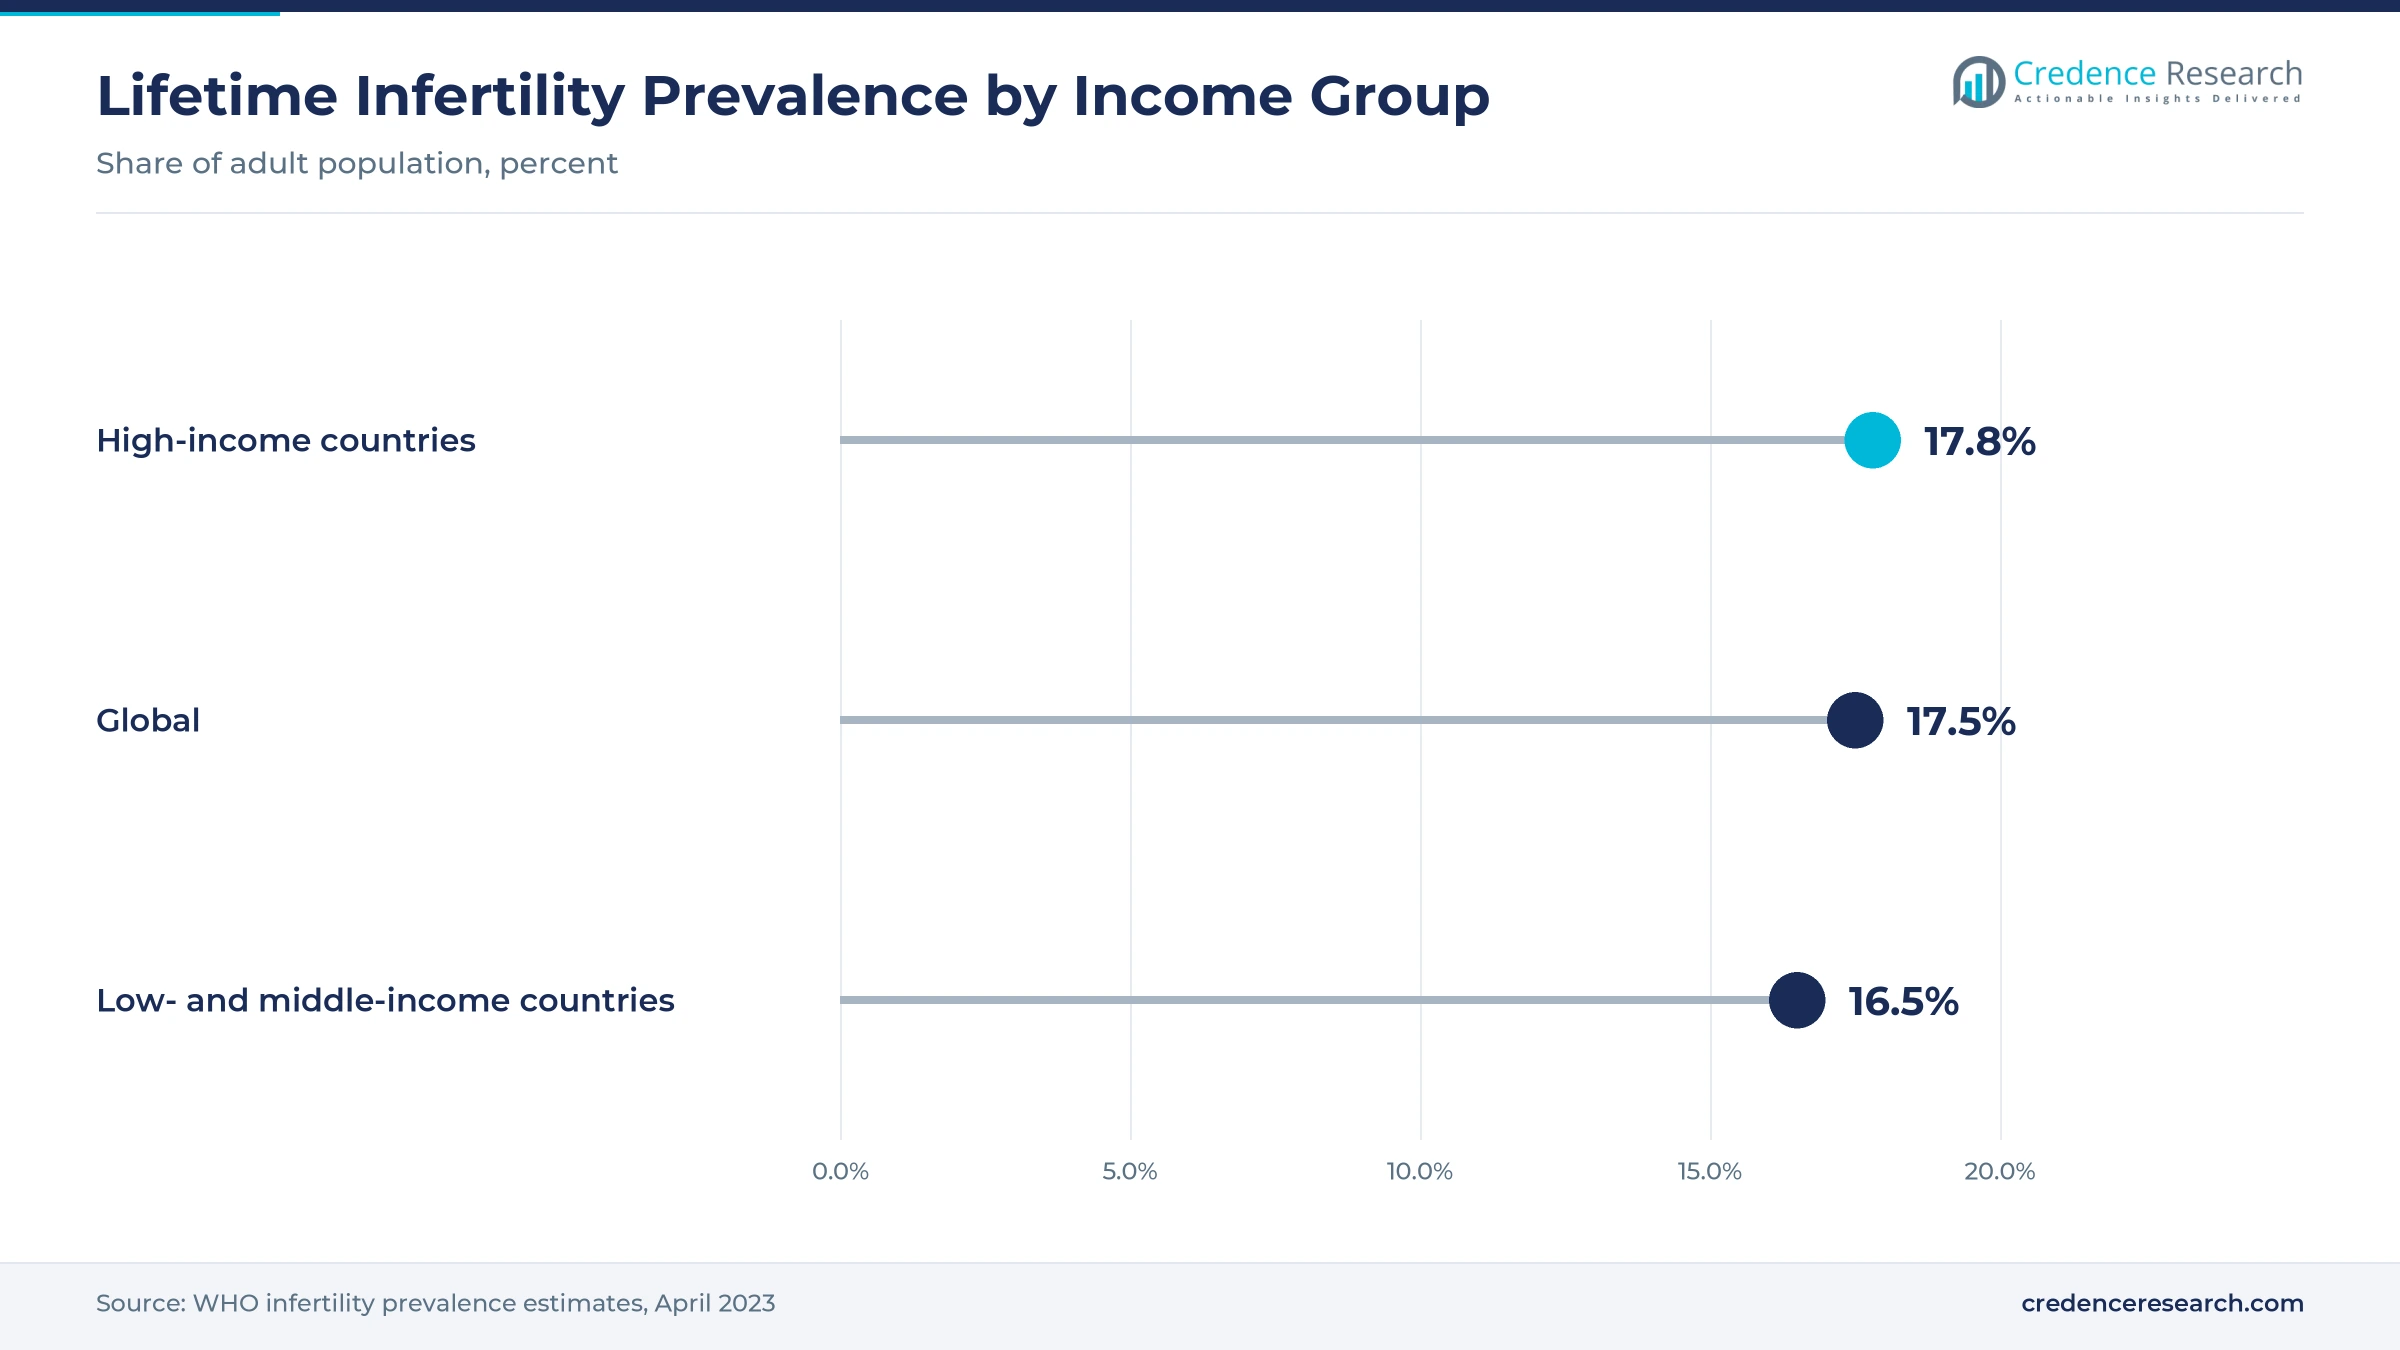
Infertility is far more common than many health systems assume, which keeps a large pool of patients seeking treatment. In April 2023, the WHO estimated that around 17.5% of the adult population, roughly 1 in 6 people worldwide, experience infertility during their lives. Lifetime prevalence was similar in high-income and in low- and middle-income countries, at 17.8% and 16.5%. Because the condition affects every region, demand for ovulation inducers and stimulation hormones is broad rather than concentrated in wealthy markets.
Why does delayed parenthood raise hormone use?
Many couples now try for a first child later in life, when natural fertility is lower and ovarian reserve has declined. Older patients often need higher hormone doses and more stimulation cycles to retrieve enough eggs for IVF. Many also pursue egg freezing and embryo banking, which uses the same stimulation protocols before any pregnancy attempt. As a result, average gonadotropin use per patient rises in North America, Europe and East Asia, lifting value even where birth rates fall.
How does new global guidance widen treatment?
Public health bodies are pushing countries to include fertility care in national health systems, which brings new patients into treatment. On Nov. 28, 2025, the WHO issued its first global guideline for the prevention, diagnosis and treatment of infertility, with 40 recommendations that favor cost-effective options. The WHO noted that a single IVF round can cost double the average annual household income in some settings. This guidance supports wider use of affordable oral ovulation inducers before costly IVF.
Why do PCOS and ovulation disorders add volume?
Ovulation disorders are one of the most frequent causes of female infertility, and they are usually treated first with tablets rather than injections. Women with polycystic ovary syndrome often receive letrozole or clomiphene for several cycles before moving to gonadotropins. This step-up approach creates high unit volume for low-cost oral products. In turn, patients who do not respond move on to injectable protocols, which carry much higher value per cycle. Because the WHO counts 1 in six adults affected, even modest gains in diagnosis add many patients.
Lower IVF prices, biosimilar FSH and direct patient sales
Why are IVF medicine prices shifting lower?
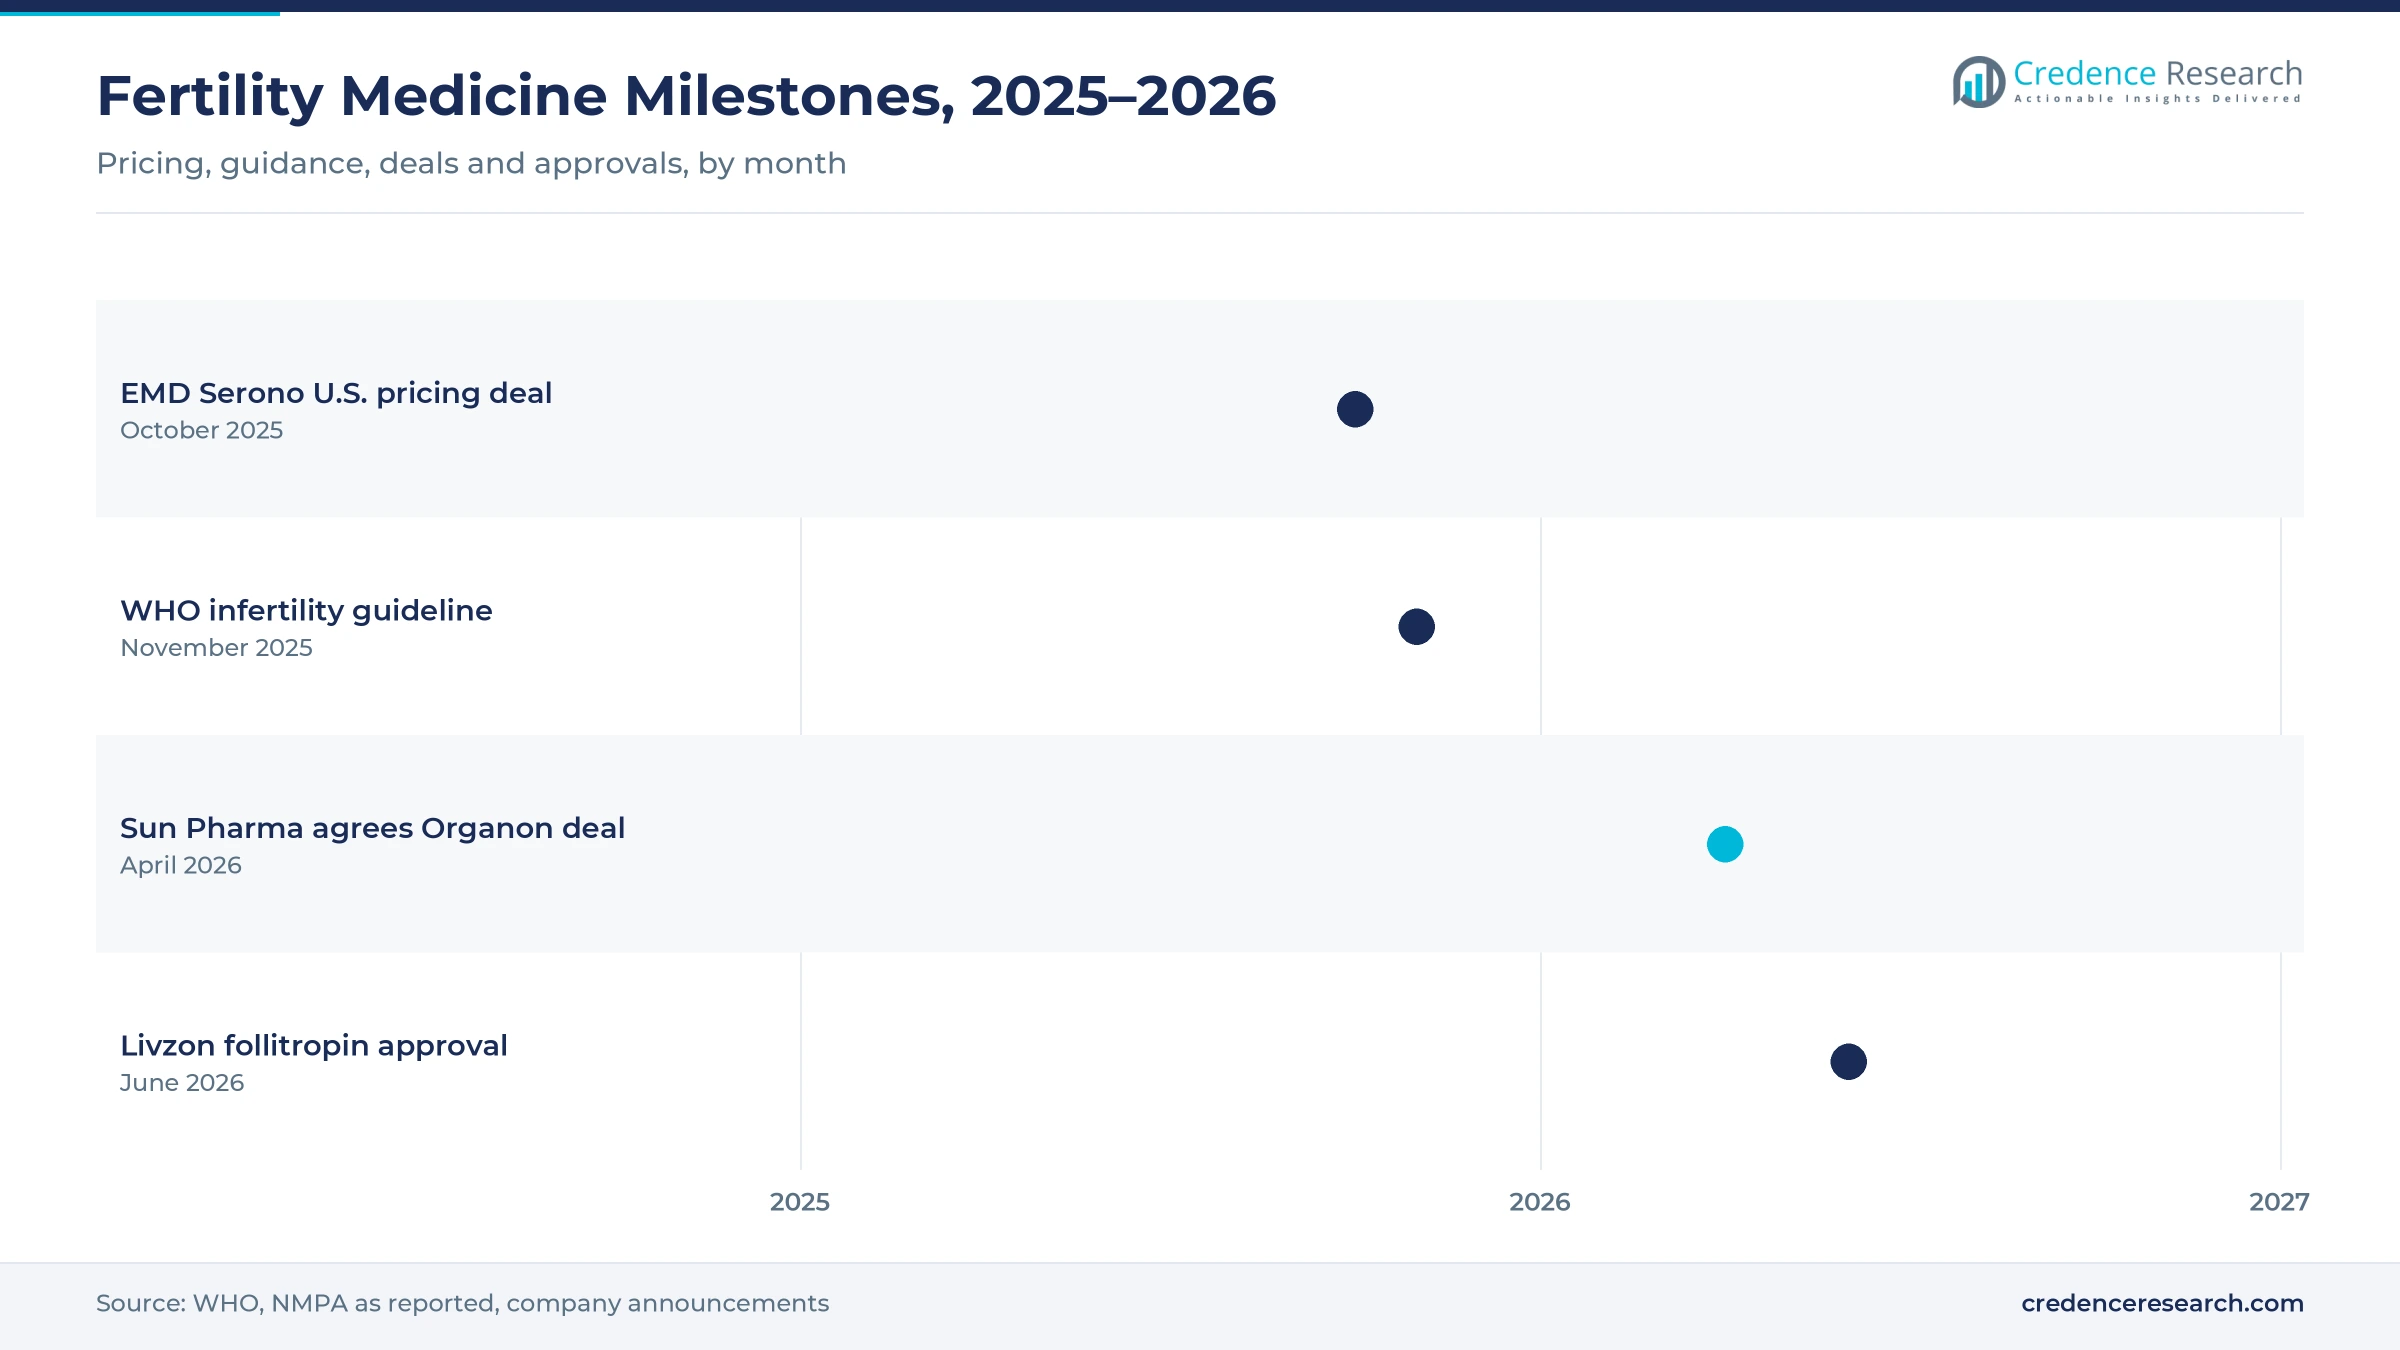
Governments and manufacturers are shifting IVF medicine pricing toward direct, discounted sales to patients who pay out of pocket. On Oct. 16, 2025, EMD Serono agreed with the U.S. government to sell Gonal-f, Ovidrel and Cetrotide directly to eligible patients, with an 84% discount off list prices when all three are used in a typical protocol. The company also joined the TrumpRx.gov platform planned for January 2026. Lower prices can raise cycle numbers while reducing revenue per cycle.
How are biosimilar hormones emerging in Asia?
Local makers of recombinant follicle-stimulating hormone are emerging in China and India, adding lower-cost supply to a field long led by a few originators. In June 2026, Livzon received a Drug Registration Certificate from China's National Medical Products Administration for its recombinant human follitropin injection. The same report counted four imported and four domestic recombinant follitropin products in China. This rise in local supply supports wider IVF access at lower prices across Asia Pacific.
Where is the opening in male infertility?
Male infertility offers a clear opening, because men are often diagnosed late and have fewer approved medicine options than women. Hormone therapy with human chorionic gonadotropin and follicle-stimulating hormone can support sperm production in men with hormone deficiency. Better semen testing and growing awareness among urologists bring more men into care. Companies that develop evidence for male indications can capture a fast-growing group of patients.
Can wider insurance cover open new IVF demand?
Expanding insurance and employer cover for IVF offers an opening, because cost remains the main reason couples delay or stop treatment. When public or employer plans pay for stimulation medicines, clinics run more cycles and patients complete more transfers through assisted reproductive technology. Employer fertility benefits in the U.S. and public funding in parts of Europe and Asia already show this effect. As a result, suppliers gain volume wherever public or employer coverage widens.
Out-of-pocket costs, uneven coverage and cycle risks
How do out-of-pocket costs limit treatment?
Most patients in many countries pay for fertility medicines and clinic fees themselves, which limits how many cycles they can afford. The WHO reports that, in many countries, tests and treatments for infertility are paid for out of pocket, often resulting in catastrophic financial expenditure. Patients who cannot pay stop after one cycle or never start. Lower drug prices and public funding programs help, but progress varies widely by country.
Why does uneven coverage slow uptake?
Insurance rules for infertility differ sharply between countries, states and employers, which creates uneven demand for stimulation medicines. Some plans cover diagnosis but not IVF, while others cap the number of funded cycles or set age limits. Patients in uncovered areas travel abroad or choose cheaper protocols with lower hormone doses. This patchwork makes demand hard to forecast and slows uptake of higher-priced branded products.
What clinical risks affect stimulation protocols?
High-dose ovarian stimulation can cause ovarian hyperstimulation syndrome and multiple pregnancies, which raise safety concerns for patients and clinics. Doctors respond with milder protocols, GnRH antagonist cycles and single embryo transfer, which can reduce total hormone use per patient. These safety practices protect patients but limit volume growth for gonadotropins. In turn, makers focus on dosing tools that match treatment to each patient.
How does cold-chain supply affect access?
Many injectable fertility medicines need refrigerated storage and careful handling from factory to patient, which adds cost. Pharmacies and clinics in rural areas of Asia, Africa and Latin America may lack reliable cold storage. Shortages or delivery delays can force clinics to postpone stimulation cycles at short notice. As a result, suppliers invest in room-temperature pens and specialty pharmacy networks to protect patient access.
North America leads while Asia Pacific grows fastest
| Region | Value, 2025 (USD billion) | Share, 2025 | CAGR, 2026–2035 |
|---|---|---|---|
| North America | 1.94 | 36.0% | 6.03% |
| Europe | 1.62 | 30.0% | 5.83% |
| Asia Pacific | 1.30 | 24.0% | 7.73% |
| Latin America | 0.32 | 6.0% | 6.93% |
| Middle East & Africa | 0.22 | 4.0% | 7.03% |
North America leads on IVF cycles and prices
North America held a 36.0% share of 2025 value and grows at 6.03% a year through 2035. The U.S. leads spending, because IVF protocols use branded gonadotropins at high list prices and many patients pay out of pocket. The October 2025 agreement that cut EMD Serono's direct prices to patients may increase cycle numbers. However, lower prices per cycle hold value growth below the global rate.
Europe balances public funding and generics
Europe held a 30.0% share of 2025 value and grows at 5.83% a year, the slowest pace among the five regions. Spain, the U.K., France, Germany and Italy account for most demand, with public funding for IVF in several countries. Biosimilar follitropin alfa products are already used across the region. However, tender pricing and national price controls keep value growth modest.
Asia Pacific grows on clinic expansion
Asia Pacific held a 24.0% share of 2025 value and is the fastest-growing region at 7.73% a year. China and India are adding fertility clinics quickly, and local producers such as Livzon, Intas Pharmaceuticals, Mankind Pharma and Sun Pharmaceutical supply hormones and oral agents. In June 2026, Livzon gained Chinese approval for a recombinant follitropin injection. As incomes rise, more couples in China and India pay for stimulation cycles.
Latin America relies on private clinics
Latin America held a 6.0% share of 2025 value and grows at 6.93% a year through 2035. Brazil, Mexico and Argentina account for most demand, with private clinics serving patients who pay out of pocket. Currency swings raise the cost of imported hormones and limit cycle numbers.
Gulf IVF clinics lead a small regional base
The Middle East & Africa held a 4.0% share of 2025 value and grows at 7.03% a year. Gulf states lead spending, with private IVF clinics and some public support for fertility care. Across much of Africa, access remains limited to oral ovulation inducers.
Pricing deals, guidance and approvals since 2025
| Development | Status and market relevance |
|---|---|
| In October 2025, EMD Serono agreed with the U.S. government to sell Gonal-f, Ovidrel and Cetrotide directly to eligible patients at reduced prices. | Agreed. Offers an 84% discount off list prices in a typical IVF protocol. |
| In November 2025, the WHO issued its first global guideline for the prevention, diagnosis and treatment of infertility. | Published. Sets 40 recommendations favoring cost-effective care. |
| In April 2026, Sun Pharmaceutical agreed to acquire Organon & Co. in an all-cash deal valued at USD 11.75 billion. | Pending. Expected to close in early 2027, subject to approvals. |
| In June 2026, Livzon received approval from China's National Medical Products Administration for a recombinant human follitropin injection. | Approved. Adds domestic recombinant FSH supply in China. |
Recombinant hormones and simpler pens reshape stimulation
- Recombinant FSH is produced in cell lines rather than extracted from urine, which gives consistent purity and dosing between batches.
- Biosimilar follitropin alfa offers the same molecule as the original product at lower prices, which widens access in Europe and Asia.
- Prefilled pens let patients inject precise hormone doses at home, which reduces clinic visits during stimulation cycles.
- GnRH antagonist protocols shorten stimulation and lower the risk of ovarian hyperstimulation compared with longer agonist protocols.
- Combined FSH and LH therapy supplies both hormones in one injection for patients with low natural luteinizing hormone.
Need a Custom Version of This Report?
Tailor the scope, geography, or segments to your exact requirements.
- Custom geography or segment scope
- Direct access to our analyst team
Hormone specialists and generic makers share the field
Competition in fertility medicines splits between hormone specialists, large diversified drugmakers and generic producers. EMD Serono, Ferring Pharmaceuticals and Organon & Co. lead in gonadotropins and GnRH analogues used for IVF, and Organon makes Follistim AQ. Sun Pharmaceutical agreed in April 2026 to acquire Organon for USD 14 per share in a deal valued at USD 11.75 billion, which would add a central IVF hormone to an Indian-based group. Merck & Co., Pfizer, Sanofi, Novartis, Bayer and Abbott Laboratories hold women's health and hormone products used in reproductive care, while Besins Healthcare focuses on progesterone and hormone therapy. Teva Pharmaceutical, Intas Pharmaceuticals, Mankind Pharma and Livzon supply generic and biosimilar products at lower prices. Because pricing deals and biosimilars cut revenue per cycle, companies compete on supply reliability, dosing devices and clinic relationships.
Companies profiled and their roles in this market
| Company | Type | Role in the market |
|---|---|---|
| EMD Serono | Hormone specialist | Gonal-f, Ovidrel and Cetrotide for IVF |
| Ferring Pharmaceuticals | Reproductive medicine specialist | Gonadotropins and reproductive medicine portfolio |
| Organon & Co. | Women's health company | Follistim AQ for ovarian stimulation |
| Sun Pharmaceutical | Specialty and generics | Agreed to acquire Organon in April 2026 |
| Livzon | Biopharmaceutical maker | Recombinant human follitropin approved in China |
| Merck & Co. | Diversified pharma | Women's health and hormone portfolio |
| Pfizer | Diversified pharma | Hormone and women's health products |
| Sanofi | Diversified pharma | Hormone and women's health products |
| Novartis | Diversified pharma | Endocrine and generic portfolio |
| Bayer | Diversified pharma | Women's health portfolio |
| Abbott Laboratories | Diversified health care | Branded generics in emerging markets |
| Besins Healthcare | Hormone specialist | Progesterone and hormone therapy |
| Teva Pharmaceutical | Generics | Generic oral and injectable products |
| Intas Pharmaceuticals | Generics and biosimilars | Biosimilar and generic products in India and abroad |
| Mankind Pharma | Branded generics | Women's health products in India |
Access policy, not new targets, sets the growth pace
Credence Research's view is that access policy, rather than new drug targets, will set the growth pace in fertility medicines through 2035. Gonadotropins keep most of the value, but direct-to-patient discounts in the U.S. and biosimilar follitropin in Asia lower revenue per cycle. Wider insurance cover and WHO guidance should raise the number of treated patients, which offsets lower prices. Companies with reliable cold-chain supply, home-use pens and strong clinic ties are best placed, while low-cost producers in India and China gain share in volume terms.
How the 2025 baseline and forecast were built
The report uses 2025 as the base year and forecasts market value to 2035, with growth rates stated for 2026–2035. Market values come from the Credence Research market model, which combines treated patient numbers, stimulation and ovulation induction cycles, typical dosing and average selling prices by region and channel. Splits by drug class, route of administration, gender, distribution channel and region are Credence Research estimates. Sources used include WHO infertility estimates and guidance, regulator decisions in China, and company announcements. No primary interviews or surveys were used to build the estimates in this report.
Biosimilars and cheaper cycles widen treatment by 2035
By 2035, the fertility drugs market reaches USD 10.13 billion, with more patients treated at lower prices per cycle. Gonadotropins remain the largest drug class as IVF expands in China, India and the Gulf states. Oral ovulation inducers gain volume as guidance favors cost-effective first steps. Online and direct-to-patient channels take a larger share of refill and home delivery orders. Biosimilar follitropin products spread across Asia and Europe, while consolidation such as the planned Sun Pharmaceutical purchase of Organon reshapes the supplier base.
Frequently Asked Questions
How big is the fertility drugs market?
Which drug class leads the market?
Which drug class grows fastest?
Which region holds the largest share?
How common is infertility?
What did EMD Serono agree in October 2025?
Who are the leading companies?
What are the main challenges?
Table of Content
Chapter 1 Market Segmentation
- 1.1 Segmentation Framework
- 1.1.1 Product and Service Classification
- 1.1.2 Application and End-Use Classification
- 1.1.3 Technology and Solution Classification
- 1.1.4 Customer and Distribution Channel Classification
- 1.1.5 Geographic Segmentation
- 1.1.6 Market Segment Definitions and Boundaries
- 1.2 By Drug Class
- 1.2.1 Gonadotropins
- 1.2.2 Selective Estrogen Receptor Modulators (SERMs)
- 1.2.3 Aromatase inhibitors
- 1.2.4 Dopamine agonists
- 1.2.5 Other drug classes
- 1.3 By Route of Administration
- 1.3.1 Injectable
- 1.3.2 Oral
- 1.4 By Gender
- 1.4.1 Female
- 1.4.2 Male
Chapter 2 Introduction
- 2.1 Report Objectives and Scope
- 2.2 Product Definition and Industry Terminology
- 2.3 Market Inclusions and Exclusions
- 2.4 Research Process
- 2.4.1 Primary Research and Expert Interviews
- 2.4.2 Secondary Research and Source Review
- 2.4.3 Top-Down and Bottom-Up Estimation
- 2.4.4 Data Triangulation and Verification
- 2.5 Market Size Measurement Basis
- 2.5.1 2025: USD 5.40 billion → 2035: USD 10.13 billion
- 2.6 Historical and Forecast Reference Periods
- 2.6.1 Historical Period: 2018-2025
- 2.6.2 Base Year: 2025
- 2.6.3 Forecast Period: 2025-2035
- 2.7 Research Assumptions and Limitations
Chapter 3 Executive Summary
- 3.1 Market Snapshot and Key Findings
- 3.2 Base-Year Market Size, 2025
- 3.3 Forecast Market Size, 2035
- 3.4 Revenue and Volume Growth Outlook
- 3.5 Key Demand and Supply Indicators
- 3.6 Leading Market Segments
- 3.7 Fastest-Growing Market Opportunities
- 3.8 Regional Performance Highlights
- 3.9 Technology and Industry Transformation
- 3.10 Competitive Landscape Summary
- 3.11 Analyst View and Strategic Implications
Chapter 4 Global Fertility Drugs Market Trends and Developments
- 4.1 Historical Industry Development, 2018-2025
- 4.2 Recent Market Trends and Developments
- 4.3 Demand and Customer Behavior Trends
- 4.4 Technology and Product Innovation
- 4.5 Artificial Intelligence, Automation and Digitalization
- 4.6 Local Manufacturing and Supply Chain Realignment
- 4.7 Industry Partnerships, Mergers and Acquisitions
- 4.8 Sustainability and Circular Economy Developments
- 4.9 Government and Private Sector Investment Trends
- 4.10 Emerging Business Models and Commercialization
- 4.11 Industry Developments and Announcements
Chapter 5 Global Fertility Drugs Market Production, Supply and Demand Analysis
- 5.1 Demand Trend and Consumption Analysis, 2018-2025
- 5.2 Demand Forecast, 2025-2035
- 5.3 Production and Output Trend, 2018-2025
- 5.4 Production and Output Forecast, 2025-2035
- 5.5 Installed Capacity and Capacity Utilization
- 5.6 Company-Wise Production Plants and Statistics
- 5.6.1 Installed Production Capacity
- 5.6.2 Actual Production
- 5.6.3 Planned Capacity and Expansion Targets
- 5.7 Supply Chain Structure and Procurement Trends
- 5.8 Supply-Demand Gap and Bottlenecks
- 5.9 Import Dependence and Sourcing Structure
- 5.10 Contract Manufacturing and Outsourcing
- 5.11 Regional Supply and Demand Concentration
Chapter 6 Global Fertility Drugs Market Pricing Analysis
- 6.1 Pricing Structure and Measurement
- 6.2 Historical Pricing Trends, 2018-2025
- 6.3 Pricing Outlook, 2025-2035
- 6.4 Average Selling Price and Unit Economics
- 6.5 Pricing by Product and Market Segment
- 6.6 Geographic Pricing Differences
- 6.7 Key Input, Energy, Labor and Logistics Costs
- 6.8 Contract Pricing and Purchasing Models
- 6.9 Pricing Sensitivity and Competitive Positioning
- 6.10 Price, Margin and Profitability Implications
Chapter 7 Global Fertility Drugs Market Dynamics
- 7.1 Market Growth Drivers
- 7.1.1 Demand-Side Drivers
- 7.1.2 Technology and Innovation Drivers
- 7.1.3 Infrastructure and Investment Drivers
- 7.1.4 Regulatory and Policy Drivers
- 7.2 Market Restraints
- 7.2.1 Cost and Affordability Constraints
- 7.2.2 Technology and Adoption Barriers
- 7.2.3 Supply Chain and Operational Constraints
- 7.3 Market Challenges
- 7.3.1 Competitive Pressure and Margin Erosion
- 7.3.2 Skills, Infrastructure and Implementation Gaps
- 7.4 Emerging Market Opportunities
- 7.5 Market Dynamics Impact and Time-Horizon Assessment
Chapter 8 Global Fertility Drugs Value Chain Analysis
- 8.1 Industry Value Chain Overview
- 8.2 Upstream Suppliers and Critical Inputs
- 8.3 Technology and Component Providers
- 8.4 Manufacturing or Service Delivery
- 8.5 Distribution, Channel Partners and Integrators
- 8.6 Downstream Applications and End Users
- 8.7 Value Addition and Profit Pools
- 8.8 Vertical Integration and Outsourcing
- 8.9 Supplier Concentration and Risk
- 8.10 Supply Chain Localization and Resilience
Chapter 9 Global Fertility Drugs Market Regulations and Policies
- 9.1 Relevant Laws, Standards and Compliance Frameworks
- 9.2 Product, Service, Safety and Quality Requirements
- 9.3 Government Policies, Incentives and Subsidies
- 9.4 Imports, Exports and Trade Barriers
- 9.5 Public Procurement and Local Content Requirements
- 9.6 Environmental and Sustainability Compliance
- 9.7 Upcoming Policy Changes and Market Implications
Chapter 10 Global Fertility Drugs Market Hotspots and Opportunities
- 10.1 Market Opportunity Mapping and Growth Hotspots
- 10.2 High-Growth Applications and Customer Groups
- 10.3 Underserved Markets and White-Space Opportunities
- 10.4 Emerging Technology and Product Opportunities
- 10.5 New Capacity and Investment Hotspots
- 10.6 Market Entry and Expansion Opportunities
- 10.7 Distribution and Partnership Opportunities
- 10.8 Near-Term and Long-Term Commercial Potential
- 10.9 Opportunity Attractiveness and Execution Risks
Chapter 11 Global Fertility Drugs Market Outlook, 2025-2035
- 11.1 Market Size and Analysis
- 11.1.1 Revenue (Market Measurement: 2025: USD 5.40 billion → 2035: USD 10.13 billion)
- 11.1.2 Market Volume and Quantity Sold
- 11.1.3 Historical Market Size, 2018-2025
- 11.1.4 Base-Year Market Size, 2025
- 11.2 Market Forecast, 2025-2035
- 11.2.1 Revenue Forecast to 2035
- 11.2.2 Volume Forecast to 2035
- 11.2.3 CAGR and Year-on-Year Growth
- 11.2.4 Incremental Revenue Opportunity
- 11.3 Forecast Assumptions and Scenario Analysis
- 11.3.1 Base-Case Forecast
- 11.3.2 Optimistic and Conservative Scenarios
- 11.3.3 Technology, Pricing and Policy Sensitivities
- 11.4 Market Attractiveness and Growth Outlook
Chapter 12 Global Fertility Drugs Market Segmentation and Outlook
- 12.1 Segmentation Summary and Market Shares, 2025
- 12.2 Largest and Fastest-Growing Segments
- 12.3 By Drug Class - Market Size and Forecast, 2025-2035
- 12.3.1 Segment Definition and Scope
- 12.3.2 Historical Market Size, 2018-2025
- 12.3.3 Revenue Forecast, 2025-2035
- 12.3.4 Volume Forecast, 2025-2035
- 12.3.5 Base-Year Market Share, 2025
- 12.3.6 Segment CAGR and Growth Drivers
- 12.3.7 Subsegment Market Size and Forecast
- 12.3.7.1 Gonadotropins
- 12.3.7.2 Selective Estrogen Receptor Modulators (SERMs)
- 12.3.7.3 Aromatase inhibitors
- 12.3.7.4 Dopamine agonists
- 12.3.7.5 Other drug classes
- 12.3.8 Subsegment Pricing and Adoption Trends
- 12.3.9 Leading Suppliers and Competition
- 12.3.10 Regional Demand and Opportunities
- 12.4 By Route of Administration - Market Size and Forecast, 2025-2035
- 12.4.1 Segment Definition and Scope
- 12.4.2 Historical Market Size, 2018-2025
- 12.4.3 Revenue Forecast, 2025-2035
- 12.4.4 Volume Forecast, 2025-2035
- 12.4.5 Base-Year Market Share, 2025
- 12.4.6 Segment CAGR and Growth Drivers
- 12.4.7 Subsegment Market Size and Forecast
- 12.4.7.1 Injectable
- 12.4.7.2 Oral
- 12.4.8 Subsegment Pricing and Adoption Trends
- 12.4.9 Leading Suppliers and Competition
- 12.4.10 Regional Demand and Opportunities
- 12.5 By Gender - Market Size and Forecast, 2025-2035
- 12.5.1 Segment Definition and Scope
- 12.5.2 Historical Market Size, 2018-2025
- 12.5.3 Revenue Forecast, 2025-2035
- 12.5.4 Volume Forecast, 2025-2035
- 12.5.5 Base-Year Market Share, 2025
- 12.5.6 Segment CAGR and Growth Drivers
- 12.5.7 Subsegment Market Size and Forecast
- 12.5.7.1 Female
- 12.5.7.2 Male
- 12.5.8 Subsegment Pricing and Adoption Trends
- 12.5.9 Leading Suppliers and Competition
- 12.5.10 Regional Demand and Opportunities
- 12.6 Segment Growth Comparison
- 12.7 Segment Attractiveness and Priority Matrix
Chapter 13 Global Fertility Drugs Geographic Market Outlook, 2025-2035
- 13.1 Regional Market Size and Share, 2025
- 13.2 Regional Market Forecast, 2025-2035
- 13.3 Regional Pricing, Production and Demand Differences
- 13.4 North America
- 13.4.1 United States
- 13.4.2 Canada
- 13.4.3 Mexico
- 13.5 Europe
- 13.5.1 Germany
- 13.5.2 France
- 13.5.3 Italy
- 13.5.4 United Kingdom
- 13.5.5 Spain
- 13.5.6 Poland
- 13.5.7 Russia
- 13.5.8 Netherlands
- 13.5.9 Belgium
- 13.5.10 Sweden
- 13.5.11 Denmark
- 13.5.12 Norway
- 13.5.13 Rest of Europe
- 13.6 Asia Pacific
- 13.6.1 China
- 13.6.2 India
- 13.6.3 Japan
- 13.6.4 South Korea
- 13.6.5 Thailand
- 13.6.6 Indonesia
- 13.6.7 Vietnam
- 13.6.8 Malaysia
- 13.6.9 Australia
- 13.6.10 Rest of Asia Pacific
- 13.7 Latin America
- 13.7.1 Brazil
- 13.7.2 Argentina
- 13.7.3 Colombia
- 13.7.4 Chile
- 13.7.5 Rest of Latin America
- 13.8 Middle East
- 13.8.1 Saudi Arabia
- 13.8.2 United Arab Emirates
- 13.8.3 Turkey
- 13.8.4 Israel
- 13.8.5 Iran
- 13.8.6 Rest of the Middle East
- 13.9 Africa
- 13.9.1 South Africa
- 13.9.2 Egypt
- 13.9.3 Nigeria
- 13.9.4 Morocco
- 13.9.5 Rest of Africa
- 13.10 Regional Investment, Policy and Supply Chain Differences
- 13.11 Regional Competitive Landscape
- 13.12 Geographic Growth Hotspots
Chapter 14 Global Fertility Drugs Technology, Innovation and Sustainability Outlook
- 14.1 Technology Landscape and Maturity
- 14.2 Product, Process and Service Innovation
- 14.3 AI, Automation and Digital Tools in the Industry
- 14.4 Technology Adoption and Performance Benchmarking
- 14.5 Innovation Pipeline and R&D Investment
- 14.6 Patent and Intellectual Property Trends
- 14.7 Energy Efficiency and Resource Management
- 14.8 Sustainability, Recycling and Circularity
- 14.9 Technology Roadmap, 2025-2035
- 14.10 Risks of Obsolescence and Technology Substitution
Chapter 15 Global Fertility Drugs Market Key Strategic Imperatives
- 15.1 Growth and Market Entry Priorities
- 15.2 High-Return Products and Segments
- 15.3 Pricing, Profitability and Cost Optimization
- 15.4 Technology Investment and Product Differentiation
- 15.5 Supply Chain Localization and Resilience
- 15.6 Distribution and Customer Acquisition
- 15.7 Partnership, Acquisition and Capacity Strategy
- 15.8 Regional Expansion Priorities
- 15.9 Short-, Medium- and Long-Term Actions
Chapter 16 Competition Outlook
- 16.1 Industry Competition Characteristics
- 16.2 Market Structure and Concentration
- 16.3 Market Share and Competitive Positioning, 2025
- 16.4 Company-Wise Revenue and Product Benchmarking
- 16.5 Production and Service Capacity Benchmarking
- 16.6 Technology, Pricing and Differentiation
- 16.7 Regional Footprint and Distribution Strength
- 16.8 Mergers, Acquisitions and Strategic Alliances
- 16.9 New Entrants and Competitive Threats
- 16.10 Porter's Five Forces and Industry Attractiveness
- 16.11 Competitive Outlook, 2025-2035
Chapter 17 Company Profiles
- 17.1 Company Coverage and Selection Criteria
- 17.2 Abbott Laboratories
- 17.2.1 Business Description
- 17.2.2 Company Ownership and Geographic Presence
- 17.2.3 Product and Service Portfolio
- 17.2.4 Manufacturing and Operating Footprint
- 17.2.5 Production Capacity and Expansion Plans
- 17.2.6 Financial Performance and Investment
- 17.2.7 Market Share and Competitive Position
- 17.2.8 Technology and Innovation Capabilities
- 17.2.9 Strategic Alliances or Partnerships
- 17.2.10 Recent Developments
- 17.2.11 Growth Strategy and Outlook
- 17.3 Bayer
- 17.4 Besins Healthcare
- 17.5 EMD Serono
- 17.6 Ferring Pharmaceuticals
- 17.7 Intas Pharmaceuticals
- 17.8 Livzon
- 17.9 Mankind Pharma
- 17.10 Merck & Co.
- 17.11 Novartis
- 17.12 Organon & Co.
- 17.13 Pfizer
- 17.14 Sanofi
- 17.15 Sun Pharmaceutical
- 17.16 Teva Pharmaceutical
- 17.17 Other Relevant Market Participants
Note: Every listed company is profiled on the structure shown under the first company. The company list is preliminary and may change based on research findings, market developments, data availability and client requirements.
Chapter 18 Disclaimer
- 18.1 Research and Forecast Disclaimer
- 18.2 Data Source and Estimation Limitations
Note: The depth of individual sections depends on data availability for this market. Volume, capacity, trade and other unit-based metrics are included where applicable.

