
Generic drugs fill most scripts at a fraction of spend
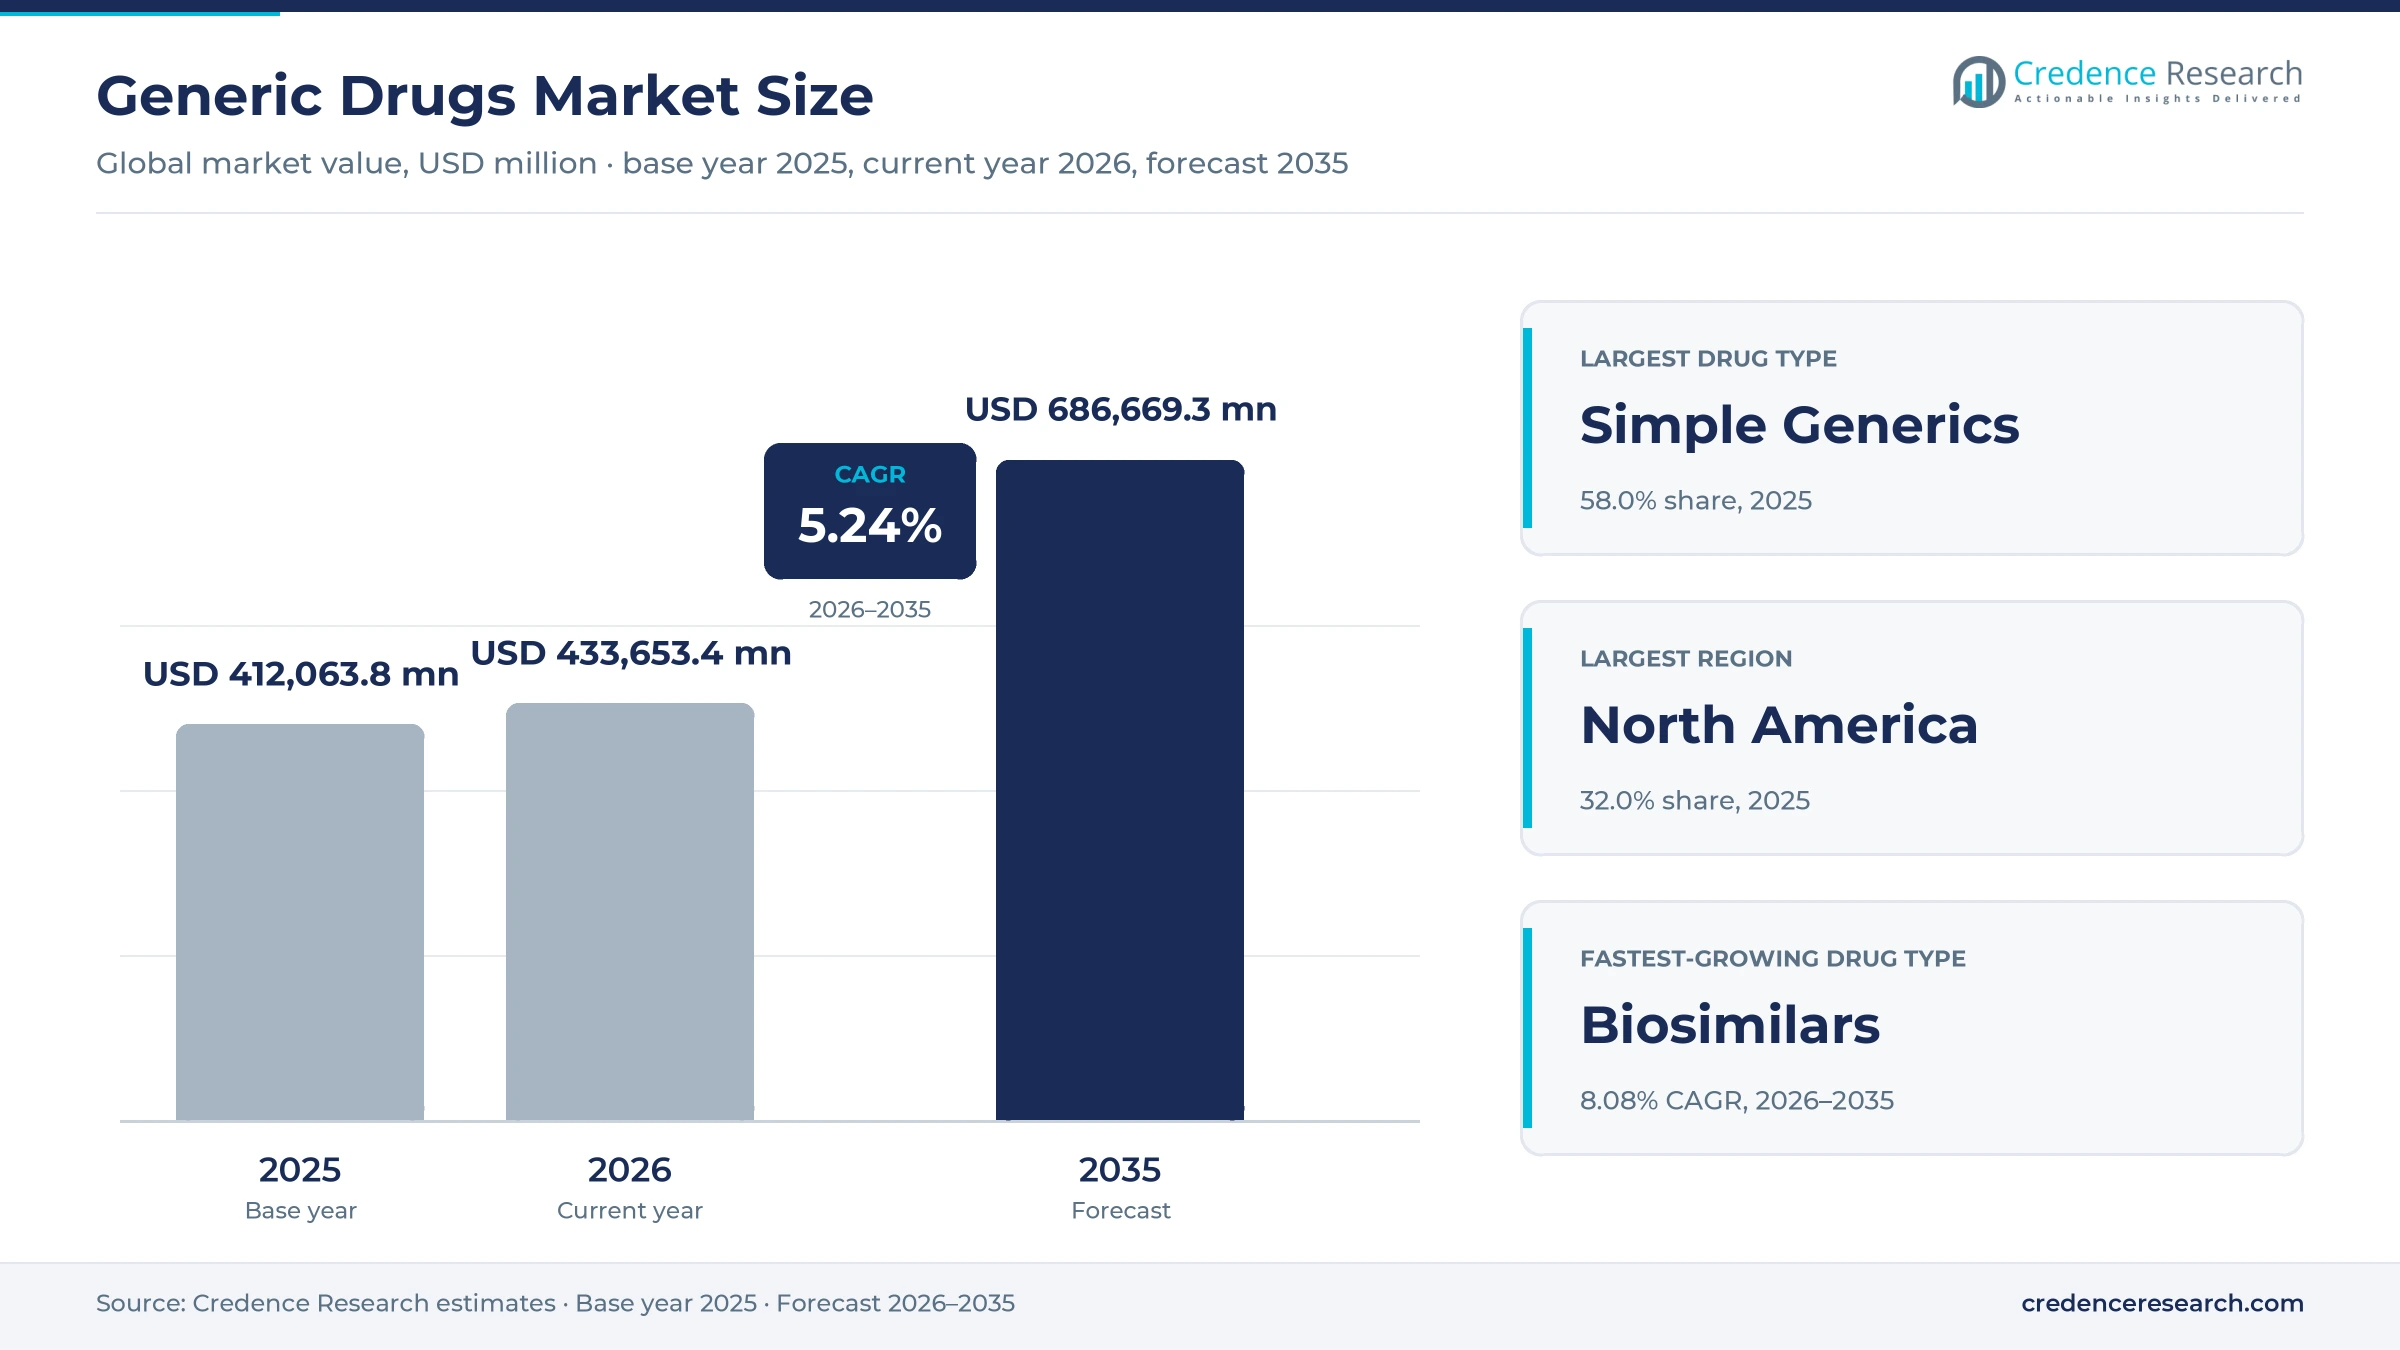
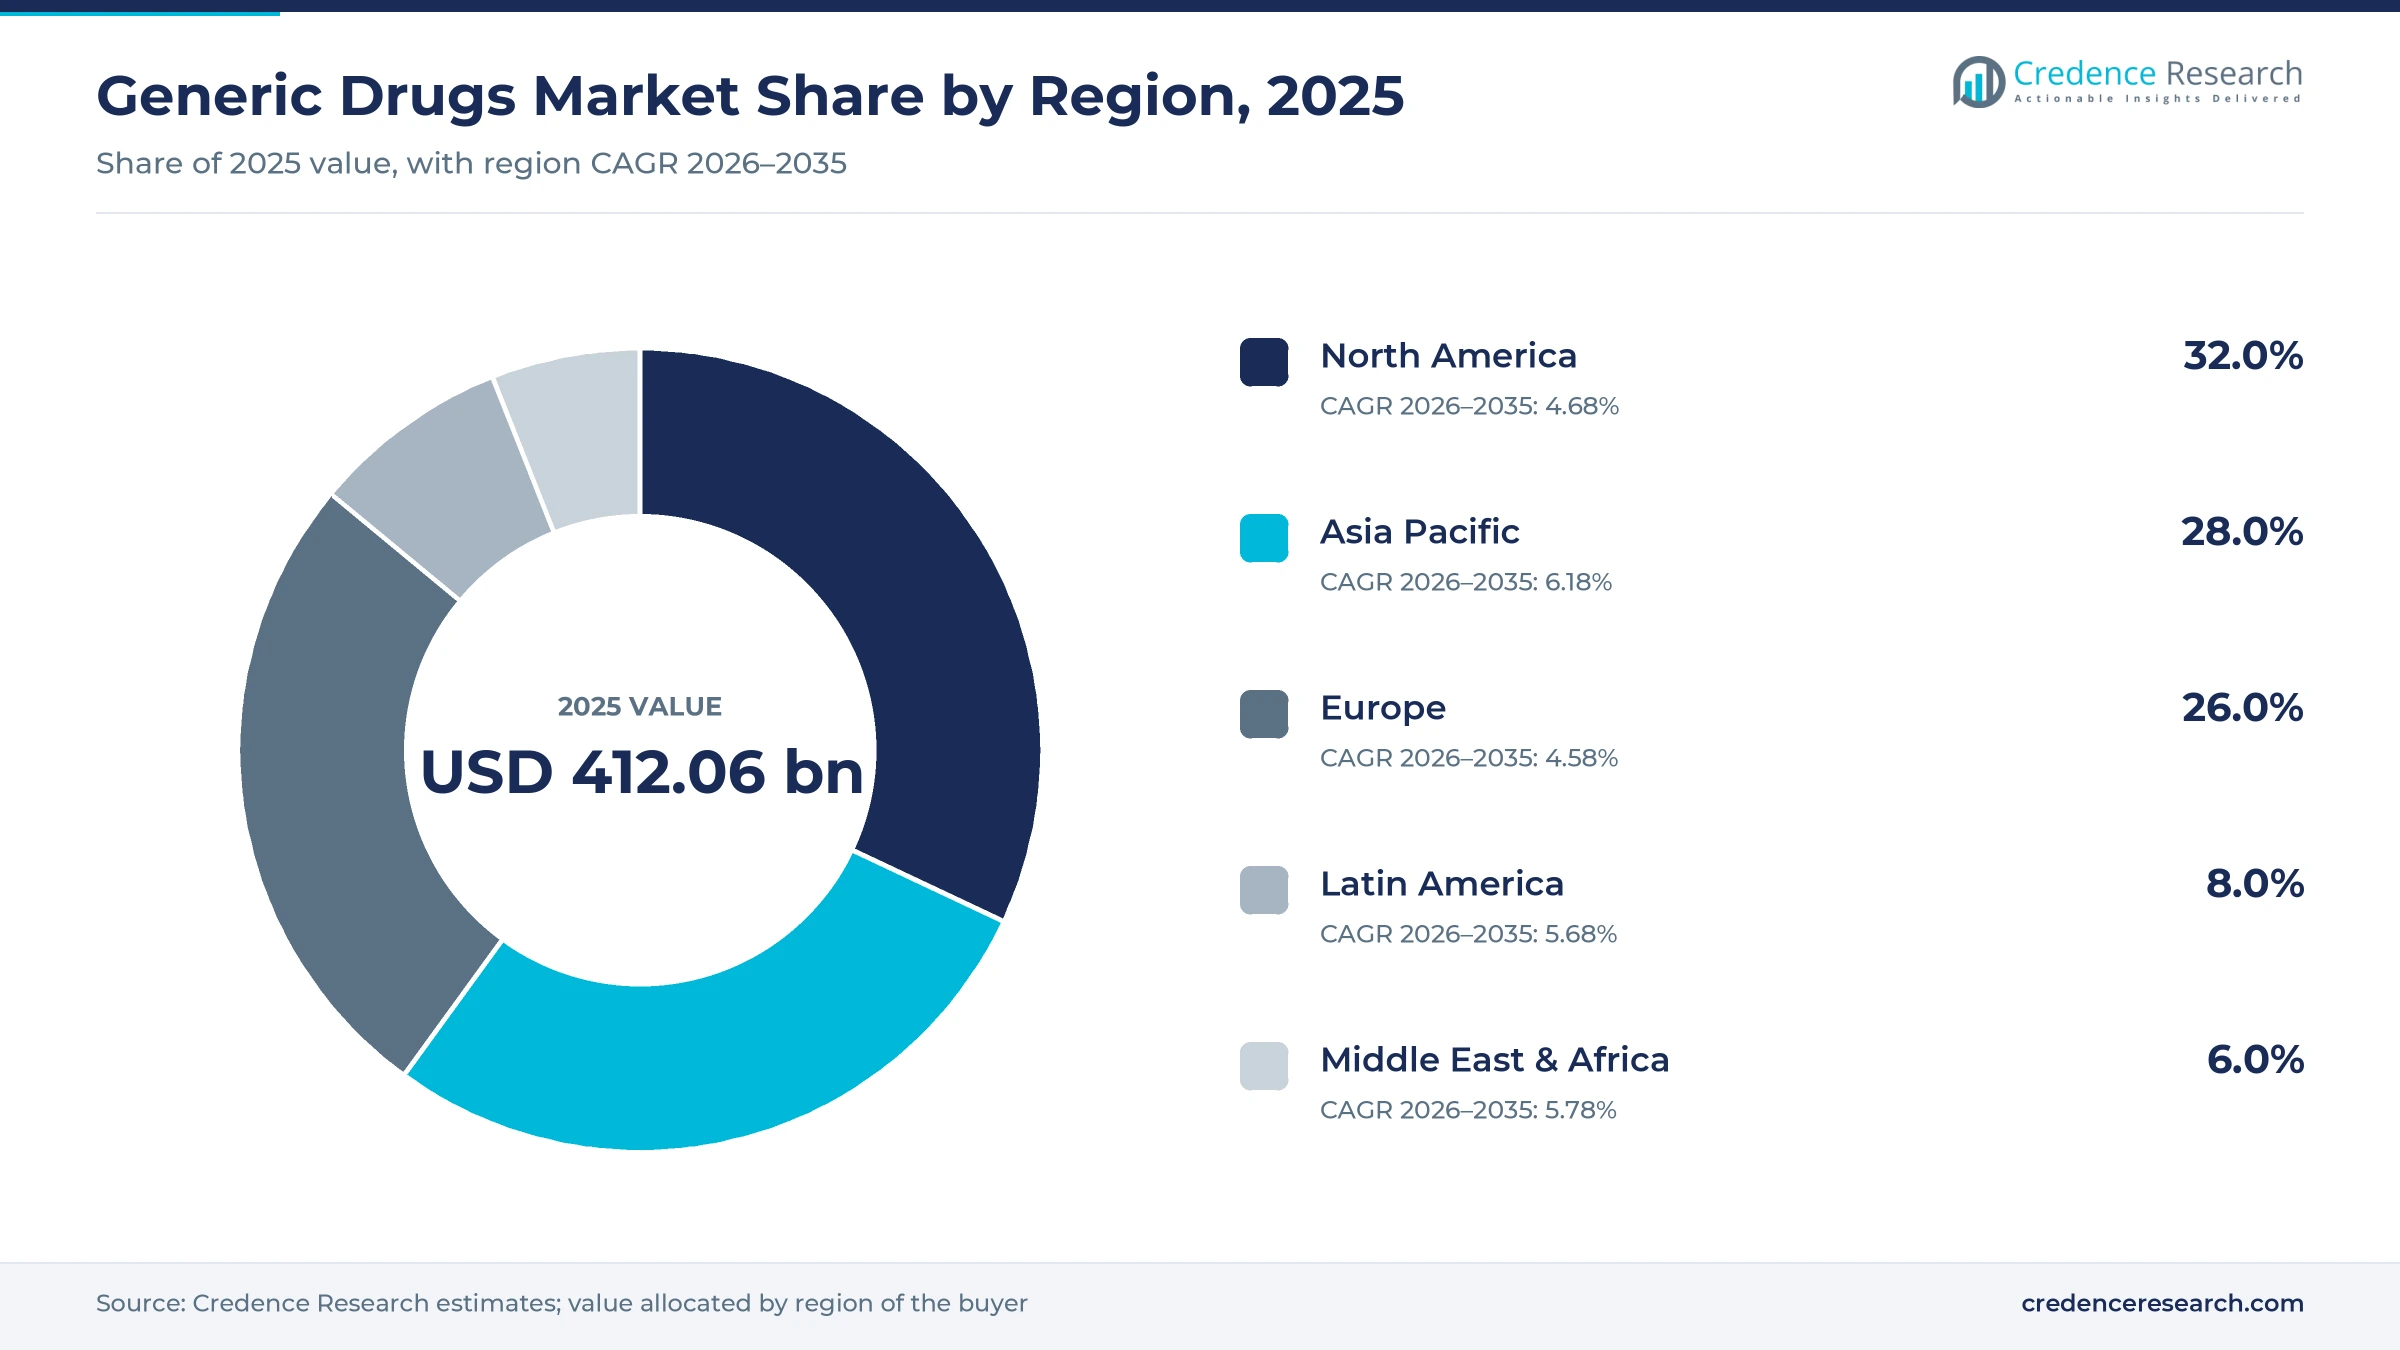
The global generic drugs market was valued at USD 412.06 billion in 2025 and is projected to increase from USD 433.65 billion in 2026 to USD 686.67 billion by 2035, registering a CAGR of 5.24% during 2026–2035. Demand comes from public and private payers that substitute off-patent medicines for branded originals, from hospitals that buy injectable generics in bulk, and from patients with chronic heart, infection, diabetes and cancer conditions. North America held the largest regional share, 32.0% in 2025, because high prescription volume and automatic pharmacy substitution keep generic use near universal. Asia Pacific is the fastest-growing region at 6.18% a year, as India and China expand domestic access while exporting finished doses and ingredients worldwide. The main commercial change is the move from simple tablets toward biosimilars, complex injectables and peptide copies, helped by U.S. regulators who proposed in 2025 to drop most comparative efficacy studies for biosimilars.
What does the generic drugs market cover?
The market counts manufacturer revenue from off-patent medicines sold after the originator loses exclusivity, including simple small-molecule generics, specialty and complex generics, and biosimilars of off-patent biologics. Buyers include retail and hospital pharmacies, online pharmacies, wholesalers, group purchasing organizations and national tender agencies.
The scope excludes branded originator products, authorized generics sold by the originator under its own label, over-the-counter vitamins and supplements, and contract manufacturing fees. Active ingredient sales are counted only once, inside the value of the finished dose sold to pharmacies and hospitals.
Generic Drugs Market Insights
- The generic drugs market grows from USD 412.06 billion in 2025 to USD 686.67 billion by 2035, a 5.24% CAGR over 2026–2035, as patent expiries and biosimilars add value.
- North America held 32.0% of global generic drug value in 2025, backed by automatic substitution and very high prescription volume.
- Simple generics led drug types with 58.0% of 2025 value, because tablets and capsules for chronic disease dominate daily prescribing.
- The FDA proposed in October 2025 to drop most comparative efficacy studies for biosimilars, cutting development time by one to three years.
- Generic semaglutide launched in India in March 2026, with Dr. Reddy's, Sun Pharma, Glenmark and Zydus entering on the first day.
Simple tablets lead while biosimilars gain the most value
Why do simple generics hold most of the value?
Based on drug type, the market is categorized into simple generics, specialty generics, biosimilars and complex generics. Simple Generics led with a 58.0% share of 2025 value, because off-patent tablets and capsules for blood pressure, cholesterol, infection and pain fill most prescriptions worldwide. Biosimilars grow fastest at 8.08% a year, as antibody patents expire and regulators lower the cost of proving similarity to the reference biologic.
Which therapy areas lead and which grow fastest?
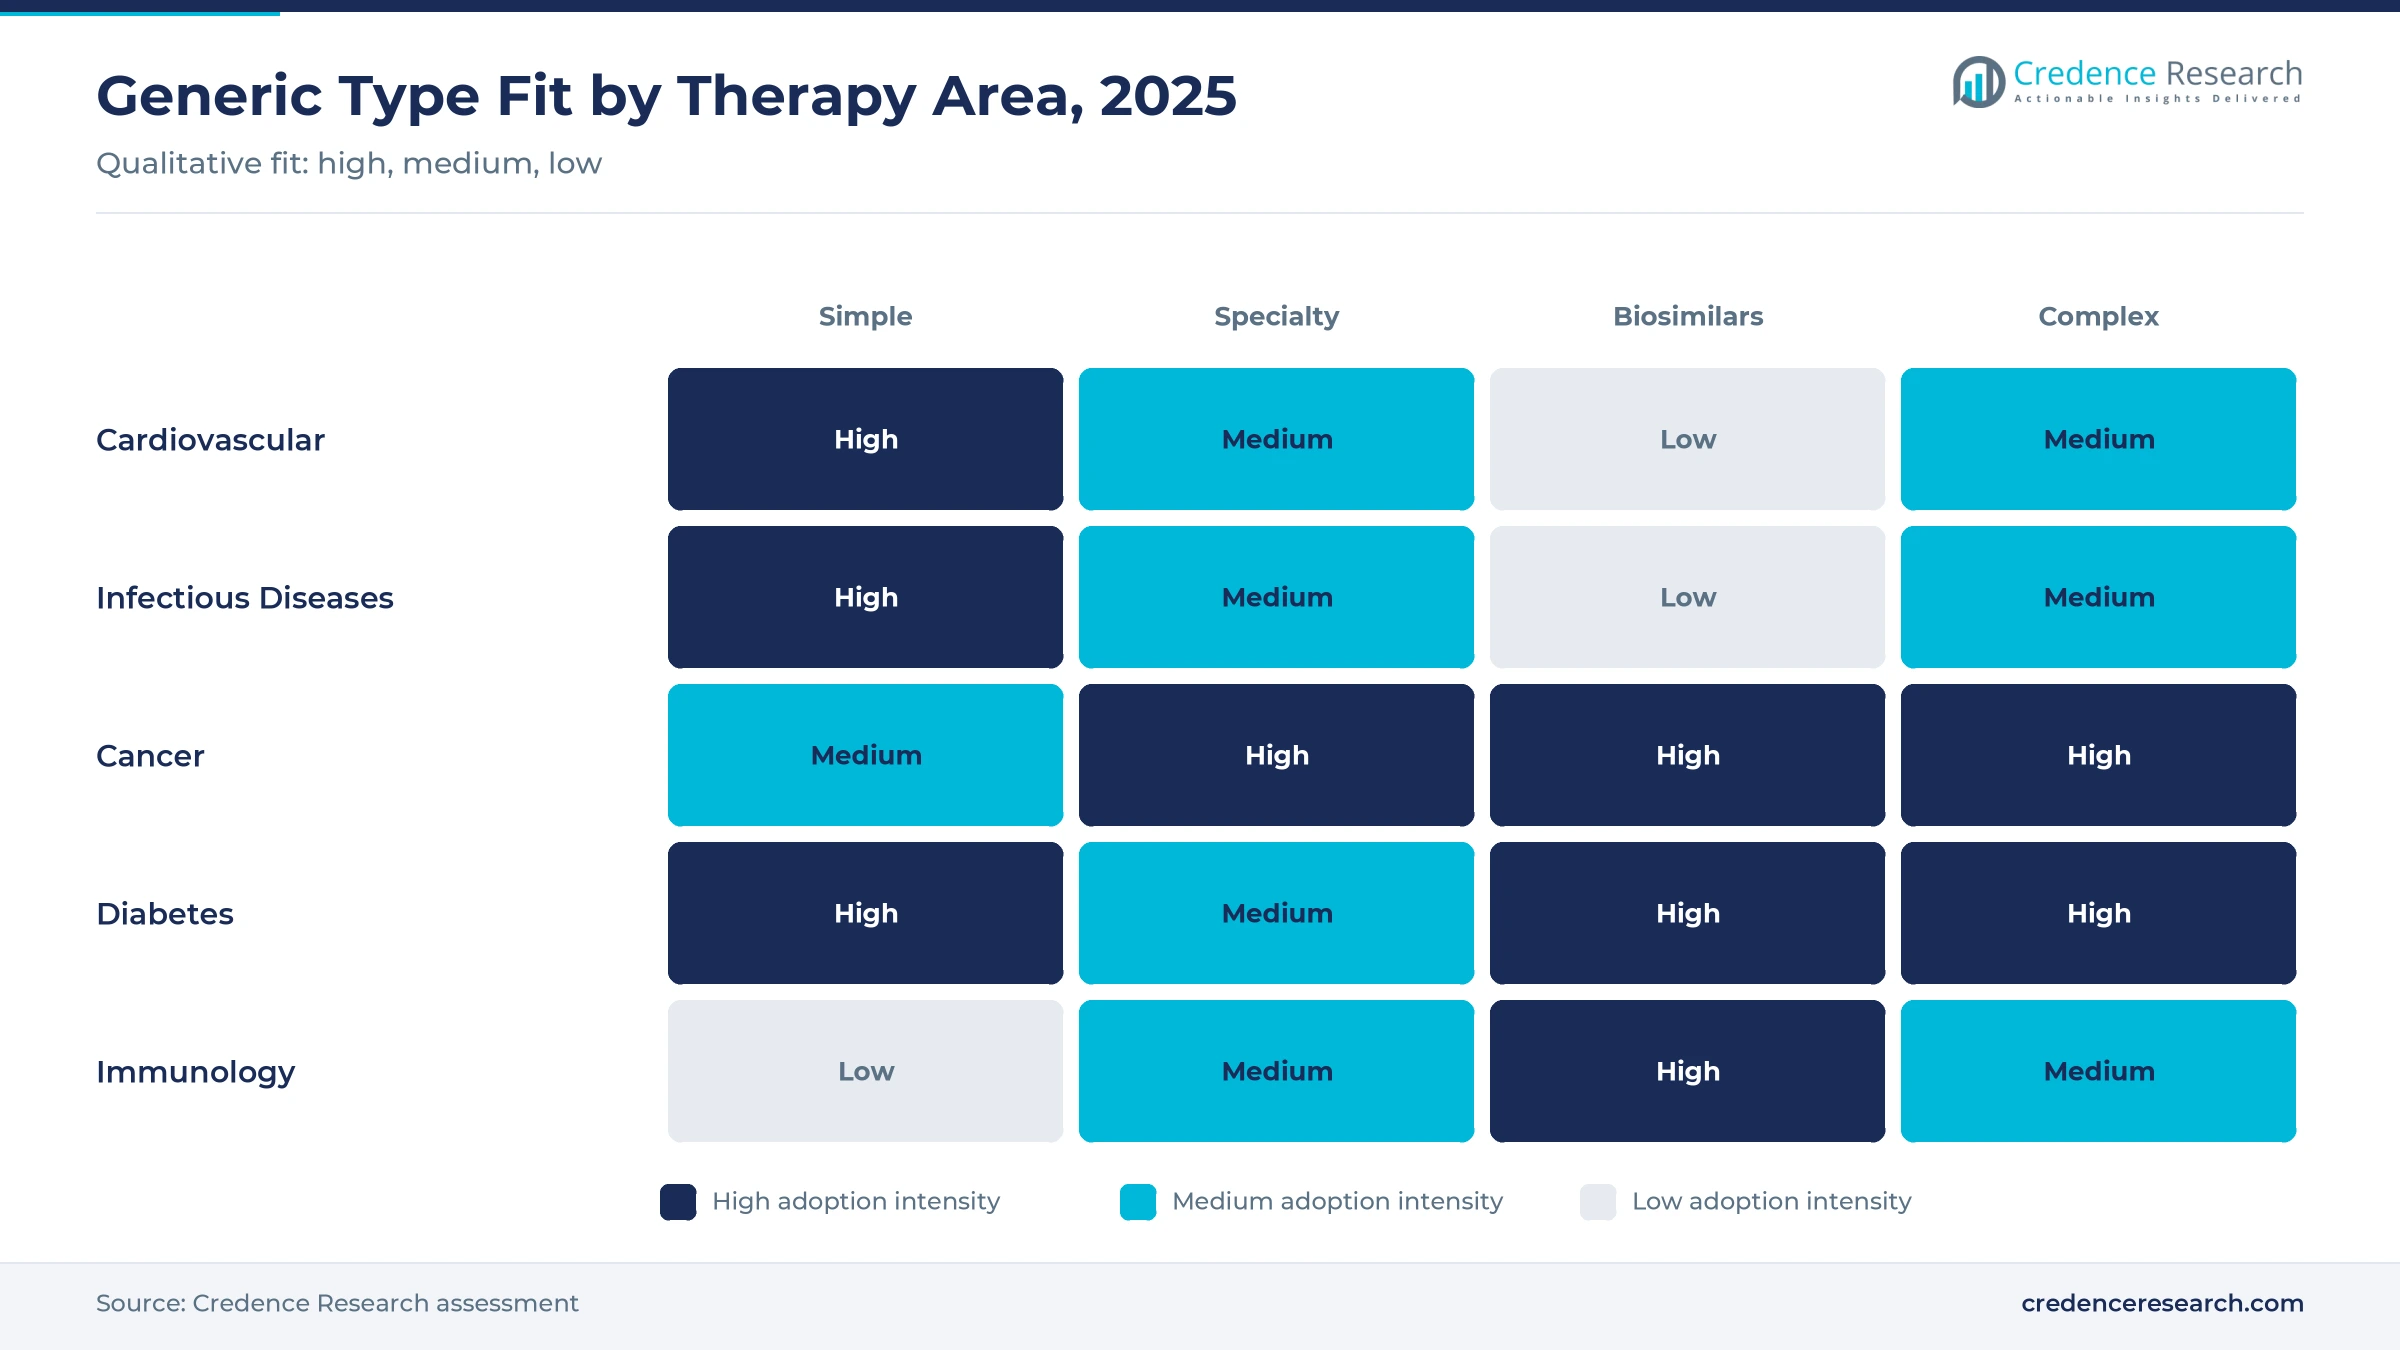
Based on therapeutic application, the market is categorized into cardiovascular, infectious diseases, cancer, diabetes and others. Cardiovascular led with a 28.0% share of 2025 value, because statins, blood pressure pills and anticoagulants are taken daily by millions of older adults. Diabetes grows fastest at 6.68% a year, as liraglutide and semaglutide copies reach patients in the U.S., India and other markets.
How do tablets and injections split generic value?
Based on route of administration, the market is categorized into oral, injections and others. Oral products led with a 66.0% share of 2025 value, because most chronic disease medicines are tablets or capsules dispensed by retail pharmacies. Injections grow fastest at 6.42% a year, as hospital injectables, peptide pens and biosimilars carry higher prices per dose than oral products.
Where do patients and hospitals buy generic medicines?
Based on distribution channel, the market is categorized into hospital pharmacies, retail pharmacies and drug stores, and online pharmacies. Retail pharmacies and drug stores led with a 58.0% share of 2025 value, because pharmacists substitute generics for branded prescriptions at the counter. Online Pharmacies grow fastest at 7.58% a year, as mail order, telehealth prescribing and home delivery expand for repeat chronic medicines.
| Segment Group | Leading Sub-segment | Share, 2025 | Fastest-growing Sub-segment | CAGR, 2026–2035 |
|---|---|---|---|---|
| By Drug Type | Simple Generics | 58.0% | Biosimilars | 8.08% |
| By Therapeutic Application | Cardiovascular | 28.0% | Diabetes | 6.68% |
| By Route of Administration | Oral | 66.0% | Injections | 6.42% |
| By Distribution Channel | Retail Pharmacies & Drug Stores | 58.0% | Online Pharmacies | 7.58% |
Request a Free Sample
Fill in your details and we'll send you a free sample report.
- Sample data tables & charts
- Research methodology
Patent expiries, payer savings and GLP-1 copies lift demand
How do payer savings keep generic substitution high?
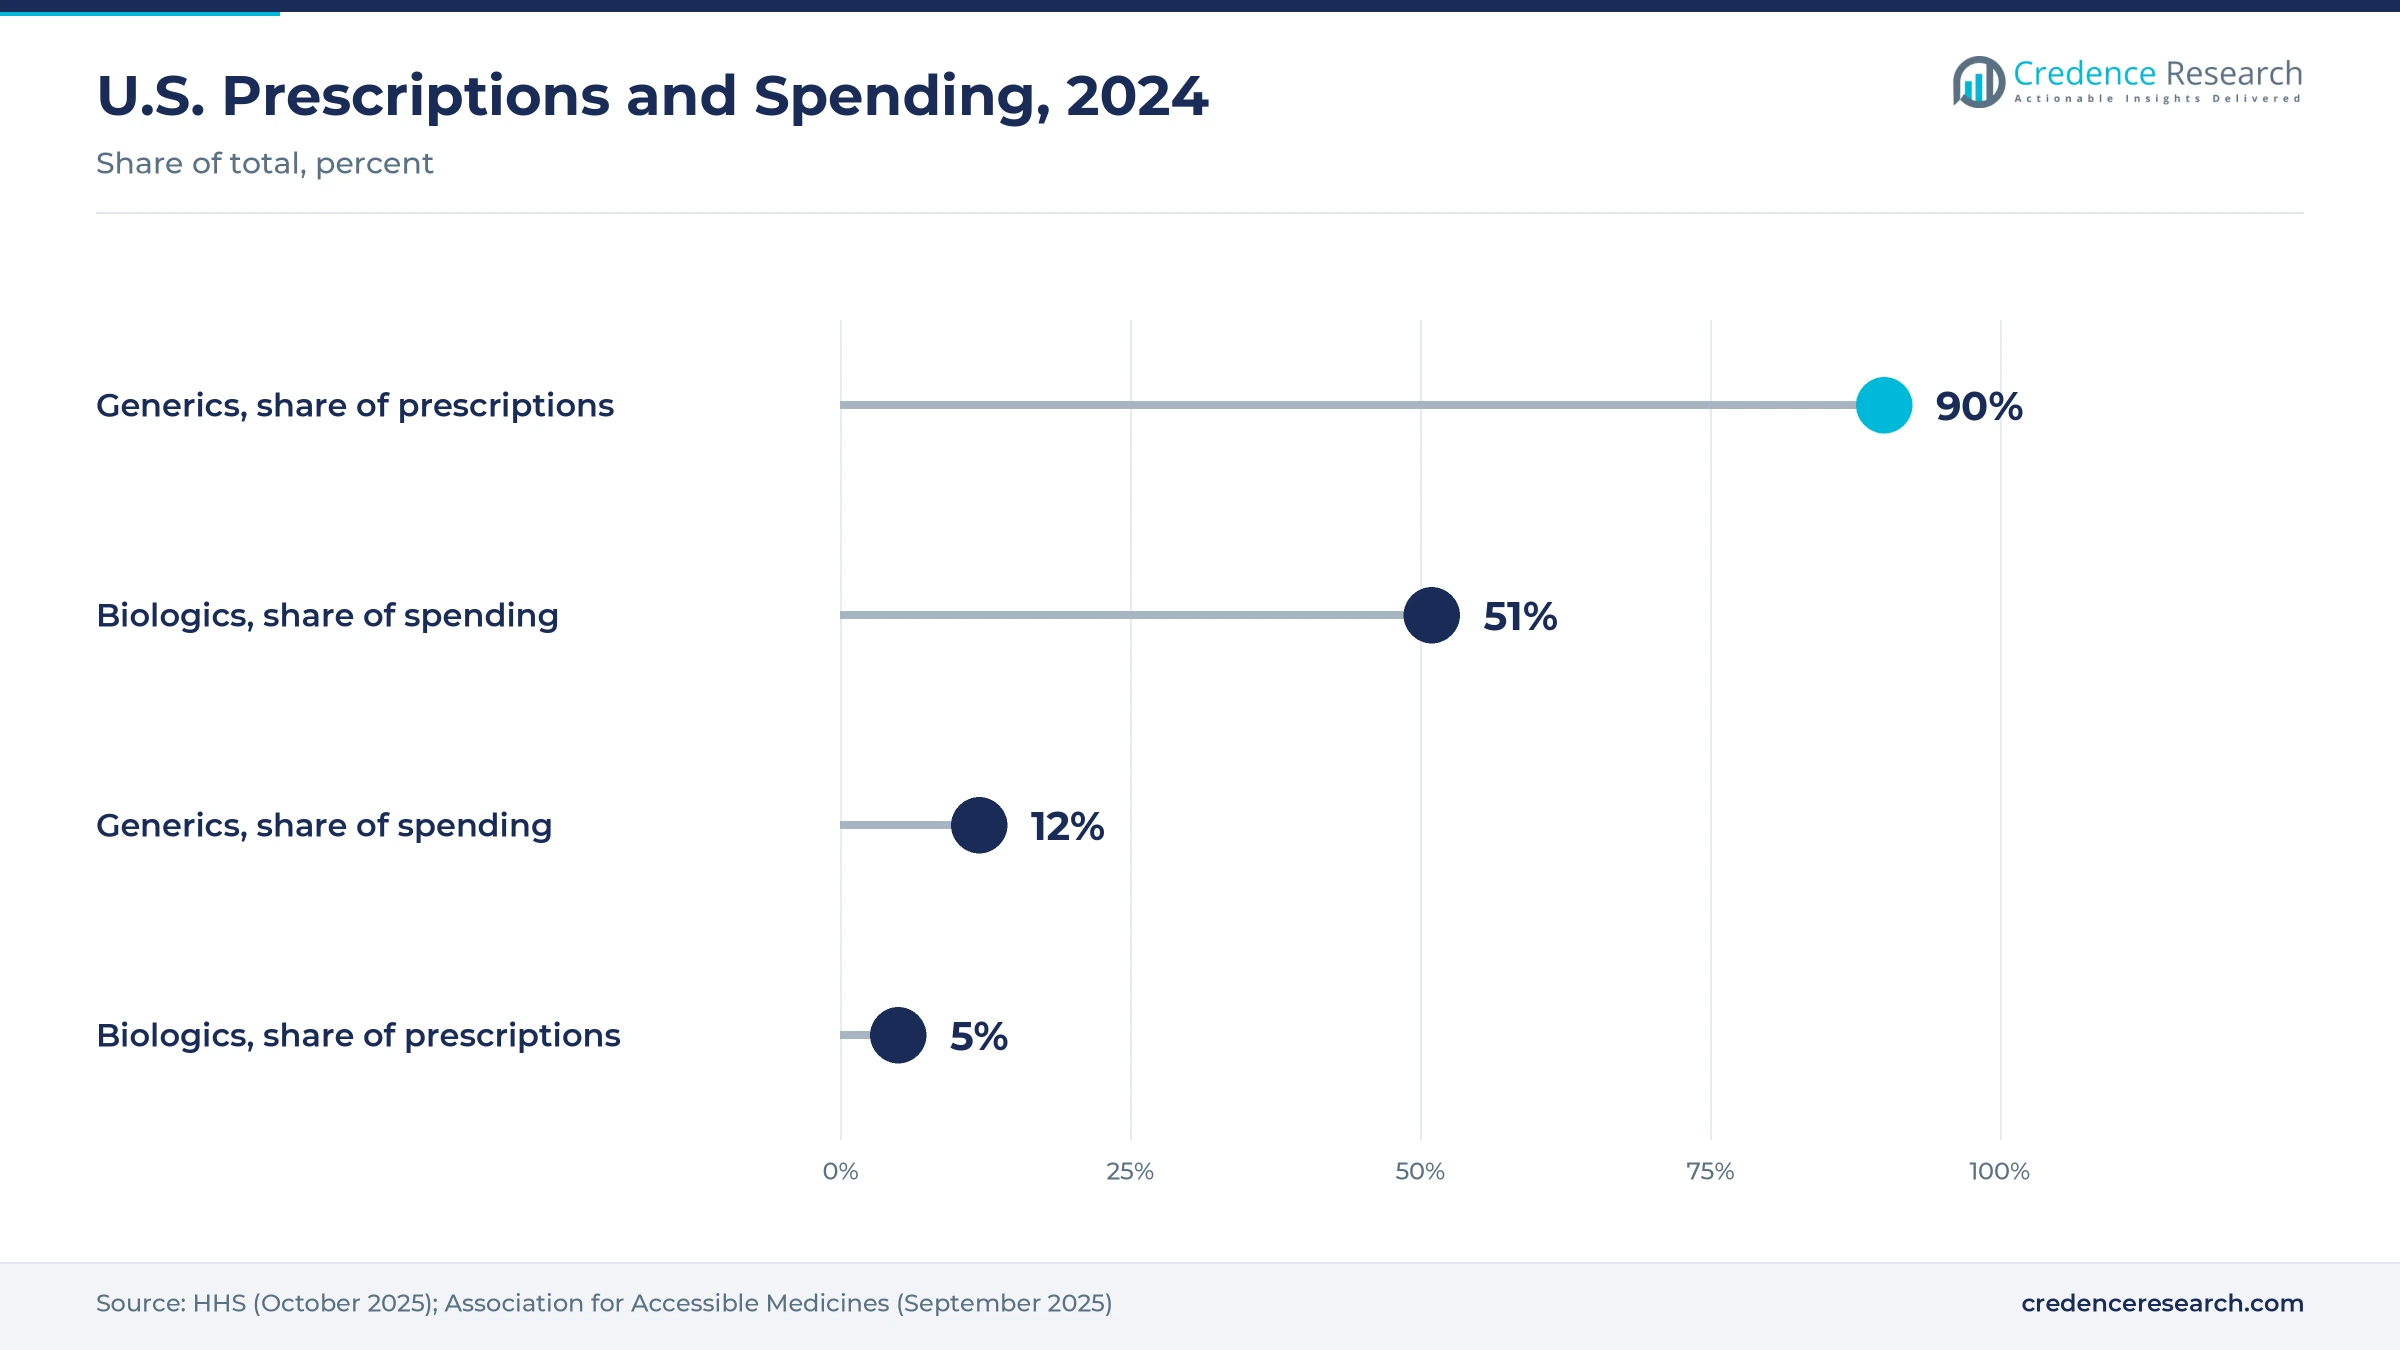
Payers rely on generics to control drug budgets, so substitution rules, tiered copays and formularies push patients toward off-patent products whenever one exists. On Sept. 3, 2025, the Association for Accessible Medicines reported that generic and biosimilar medicines saved USD 467 billion in 2024 in the U.S. These products filled 90% of prescriptions while accounting for 12% of drug spending. As a result, public and private payers keep strong incentives to widen generic use.
Why do patent expiries keep adding new molecules?
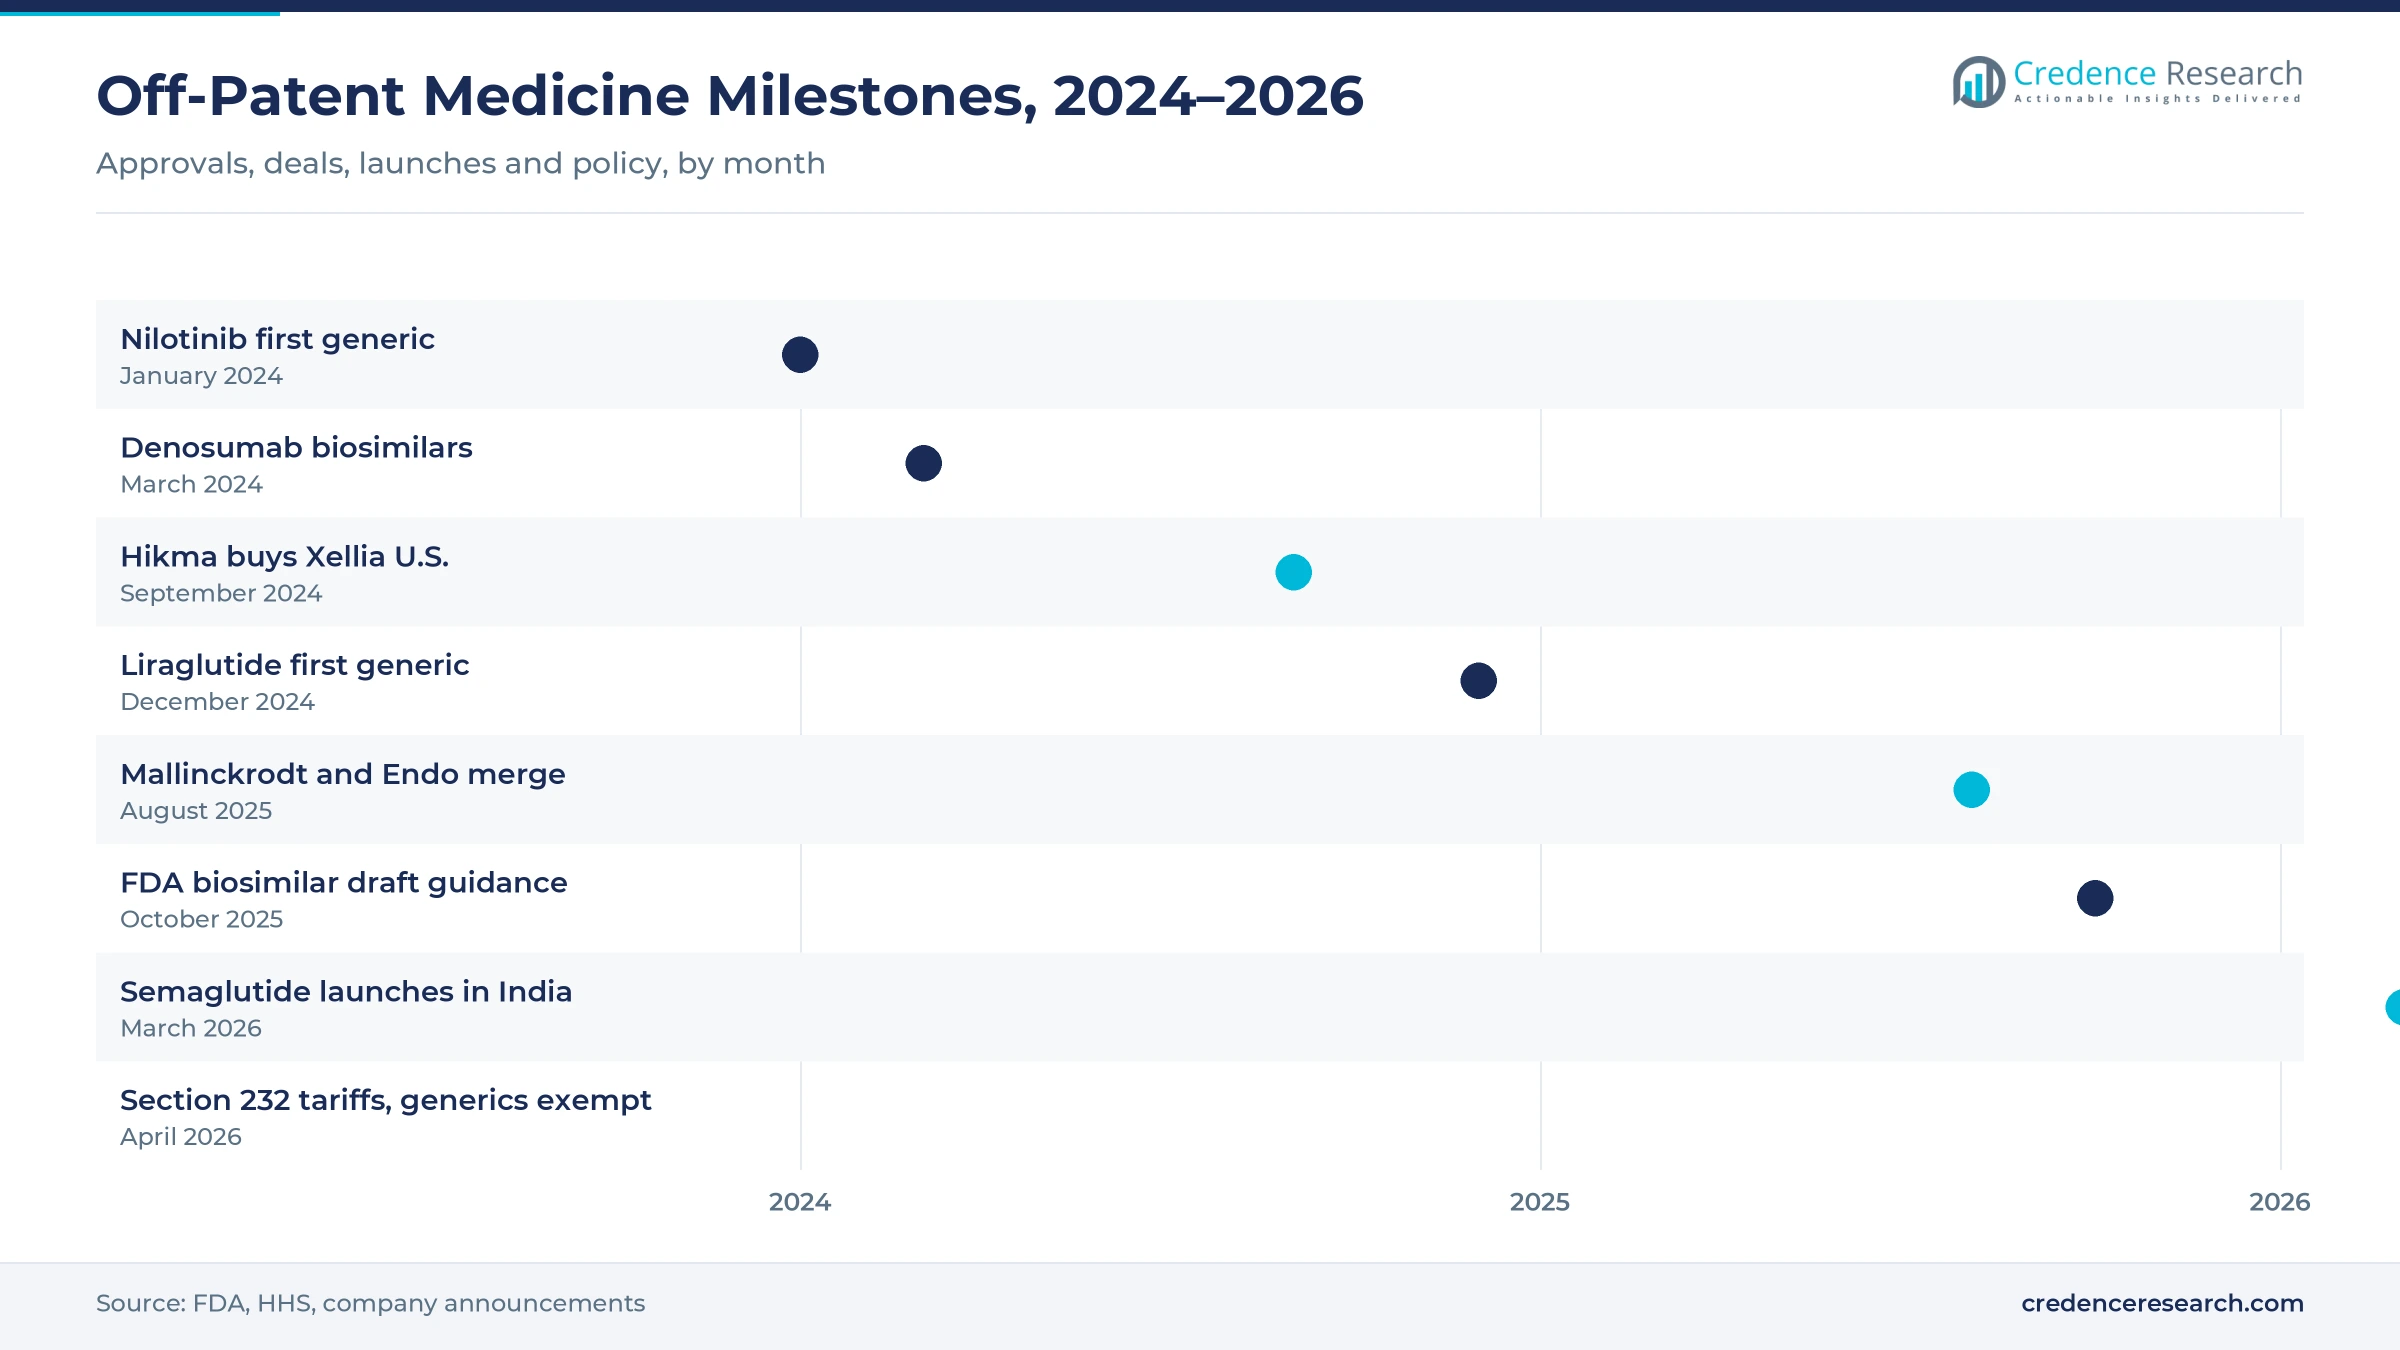
Each year, branded medicines lose exclusivity and open new markets to generic suppliers that file abbreviated applications with regulators. The FDA list of 2024 first generic approvals includes Apotex's nilotinib capsules in January 2024, edaravone injection from Hikma, Dr. Reddy's and Gland Pharma in May 2024, and Hikma's liraglutide injection in December 2024. Because first entrants often hold a period of limited competition, these launches add higher-margin revenue for several months before further entrants push prices down.
How are GLP-1 copies opening a new diabetes segment?
Peptide medicines for diabetes and weight control are moving into the generic market, which brings a large and growing patient pool to generic suppliers in both developed and emerging markets. Hikma launched the first U.S. generic of liraglutide after FDA approval in December 2024. On March 21, 2026, Dr. Reddy's, Sun Pharma, Glenmark, Alkem and Zydus launched semaglutide products in India on the day the core patent expired, with Lupin co-marketing the Zydus brands. This shift makes diabetes the fastest-growing therapy segment through 2035.
Why does chronic disease raise steady volume?
Aging populations take more medicines for heart disease, diabetes, infection and cancer, and most of those daily treatments are available as low-cost generics. Older patients often take several tablets each day, which multiplies volume per person across North America, Europe, Japan and China. Because these regimens often continue for many years, demand for cardiovascular medicines, antibiotics and antidiabetic tablets stays stable even when prices fall. This base supports reliable volume growth for large suppliers with broad portfolios of chronic therapy tablets.
Complex injectables, biosimilars and peptide copies rise
Why are biosimilars rising so quickly?
Biosimilars are rising because many large biologics are losing exclusivity while regulators lower development costs. On Oct. 29, 2025, HHS announced an FDA draft guidance that would let developers rely mainly on analytical testing rather than comparative efficacy studies that take one to three years. The release notes that biologics were 5% of U.S. prescriptions but 51% of spending in 2024. As a result, biosimilar competition should spread faster across immunology and oncology.
How are complex injectables shifting company strategy?
Suppliers are shifting investment from crowded oral tablets toward sterile injectables, which face fewer competitors and steadier hospital demand. On Sept. 10, 2024, Hikma completed the purchase of Xellia's U.S. finished dose business, adding a Cleveland, Ohio, plant and an R&D center in Zagreb, Croatia. Fresenius Kabi and Sandoz also build hospital injectable portfolios for intensive care, oncology and anesthesia. This shift raises the injection route faster than oral products over the forecast period.
Where is the opening in interchangeable biosimilars?
Interchangeable status offers a clear opening, because pharmacists in many U.S. states can substitute these products without a new prescription. In March 2024, the FDA approved Sandoz's Jubbonti and Wyost, the first denosumab biosimilars, as interchangeable for all reference product indications. The proposal to drop most switching studies would make this status easier to earn. Suppliers that reach interchangeability early can win retail share for bone, immunology and diabetes therapy.
Can domestic manufacturing become a growth lever?
Domestic manufacturing offers an opening for suppliers with U.S. and European plants, since buyers want fewer shortages and shorter supply chains. Hospitals and group purchasing organizations increasingly reward reliable supply with longer contracts. Investment in oral solid dosage contract manufacturing near end markets also lowers transport risk. Companies that combine local plants with Indian cost bases can win tenders where reliability now carries more weight than the lowest bid.
Price erosion, tariffs and thin margins strain suppliers
How does price erosion squeeze generic margins?
Price erosion is the main pressure, because each new entrant lowers prices until only a few low-cost suppliers remain. Wholesaler and pharmacy buying groups in the U.S. hold strong bargaining power, while European tenders often award contracts on price alone. As a result, margins on older tablets can fall below the cost of quality systems, and some makers withdraw products. These exits contribute to shortages of low-priced injectables and antibiotics in hospitals.
What do new pharmaceutical tariffs mean for generics?
Trade policy adds uncertainty, even though generics have so far been spared from new U.S. duties. A proclamation on April 2, 2026, set tariffs of up to 100% on imported patented medicines under Section 232, with effective dates in July and September 2026. Generic medicines and their ingredients are exempt for now, but the Commerce Secretary must review that exemption within a year. Because margins are thin, any future tariff would hit Indian and Chinese supply chains hard.
Why does ingredient concentration raise supply risk?
Supply risk remains high, because many off-patent medicines depend on a small number of ingredient plants in India and China. A quality failure or export restriction at one active pharmaceutical ingredient plant can disrupt several finished dose makers at once. Regulators respond with warning letters and import alerts, which take months to resolve. In turn, buyers pay more for dual sourcing, and smaller suppliers struggle to fund compliance upgrades.
Why are biosimilar launches still slow in some markets?
Biosimilar uptake remains uneven, because patent disputes, rebate contracts and prescriber habits delay switching from the reference biologic. The HHS release states that biosimilars hold less than 20% market share in the U.S. and that comparative efficacy studies cost about USD 24 million each. Outside the U.S. and Europe, many countries lack clear approval pathways or reimbursement rules. These hurdles slow the pace at which biosimilar value can replace originator sales.
North America leads value while Asia Pacific gains pace
| Region | Value, 2025 (USD billion) | Share, 2025 | CAGR, 2026–2035 |
|---|---|---|---|
| North America | 131.86 | 32.0% | 4.68% |
| Asia Pacific | 115.38 | 28.0% | 6.18% |
| Europe | 107.14 | 26.0% | 4.58% |
| Latin America | 32.97 | 8.0% | 5.68% |
| Middle East & Africa | 24.72 | 6.0% | 5.78% |
North America leads on volume and substitution
North America held 32.0% of 2025 value and grows at 4.68% a year through 2035. The U.S. leads spending, because pharmacists substitute generics automatically and generics fill about nine in ten prescriptions. Hikma, Apotex, Sandoz and Indian suppliers compete for wholesaler and pharmacy contracts. However, strong buyer power and rapid price erosion hold value growth below the global average, while biosimilars and injectables add value.
Asia Pacific grows on exports and access
Asia Pacific held 28.0% of 2025 value and is the fastest-growing region at 6.18% a year. India is a major producer, with Sun Pharma, Dr. Reddy's, Lupin, Cipla, Aurobindo and Glenmark supplying domestic and export markets. China expands generic use through volume-based procurement, while Japan relies on domestic suppliers such as Nichi-Iko for its generic supply. The March 2026 semaglutide launches in India show how fast new molecules can reach local patients.
Europe balances tenders and biosimilar uptake
Europe held 26.0% of 2025 value and grows at 4.58% a year, the slowest pace among the five regions. Germany, France, Italy, Spain and the U.K. account for most regional demand, with Sandoz, KRKA and Fresenius Kabi based in the region. Europe has a long record of biosimilar approvals and strong uptake in hospital tenders. However, tender pricing and reference pricing keep values low for simple tablets.
Latin America relies on branded generics
Latin America held 8.0% of 2025 value and grows at 5.68% a year through 2035. Brazil and Mexico account for most demand, where branded generics sold through retail pharmacies remain common. Public health systems buy injectables and essential medicines through tenders, while currency swings affect import costs.
Middle East and Africa build local supply
The Middle East & Africa held a 6.0% share of 2025 value and grows at 5.78% a year. Hikma has deep roots in the region, and Gulf states promote local manufacturing to reduce import reliance. In much of Africa, donor programs and tenders supply essential generics for infection and chronic disease.
Biosimilar approvals and injectables deals since 2024
| Development | Status and market relevance |
|---|---|
| In March 2024, the FDA approved Sandoz's Jubbonti and Wyost, the first denosumab biosimilars, as interchangeable for all reference indications. | Approved. Opens bone health and oncology biologics to biosimilar substitution. |
| In September 2024, Hikma completed its purchase of Xellia's U.S. finished dose business, including a Cleveland plant and a Zagreb R&D center. | Completed. Expands the U.S. sterile injectables portfolio. |
| In December 2024, the FDA approved Hikma's liraglutide injection as the first generic of Victoza for type 2 diabetes. | Approved. Brings the first GLP-1 generic to U.S. patients. |
| In August 2025, Mallinckrodt and Endo completed their merger, with the combined generics and sterile injectables business operating as Par Health. | Completed. A spin-off of Par Health was planned as a separate company. |
| In March 2026, Dr. Reddy's, Sun Pharma, Glenmark, Alkem and Zydus launched semaglutide products in India after the core patent expired. | Launched. Opens a large peptide market to Indian generic suppliers. |
Peptides, inhalers and long-acting injectables go generic
- Peptide synthesis and pen devices let generic makers copy GLP-1 medicines such as liraglutide and semaglutide and supply them in ready-to-use injectors.
- Analytical similarity testing allows biosimilar developers to show sameness with fewer clinical studies under the 2025 FDA draft guidance.
- Long-acting injectable formulations such as extended-release aripiprazole suspension extend generic competition into monthly psychiatric treatment.
- Inhaler and nasal spray device matching requires generic makers to copy both the formulation and the delivery device for respiratory products.
- Continuous manufacturing reduces batch failures and lowers the unit cost of high-volume oral tablets.
Need a Custom Version of This Report?
Tailor the scope, geography, or segments to your exact requirements.
- Custom geography or segment scope
- Direct access to our analyst team
Indian, European and U.S. makers compete on cost and scale
Competition in off-patent medicines divides into global portfolio companies, Indian exporters and hospital injectable specialists. Sandoz Group is a leading supplier of biosimilars and European retail generics, while KRKA serves Central and Eastern Europe. Indian companies, including Sun Pharmaceutical, Dr. Reddy's, Lupin, Cipla, Aurobindo and Glenmark, combine low cost manufacturing with large U.S. product filings and fast domestic launches, as the 2026 semaglutide launches showed. Hikma and Fresenius Kabi focus on sterile injectables for hospitals, and Hikma added Xellia's U.S. business in 2024. Apotex is a leading Canadian supplier, Nichi-Iko serves Japan and Endo completed its merger with Mallinckrodt in August 2025 to form a combined group with the Par Health generics unit. Because simple tablets face constant price pressure, leaders move toward biosimilars, peptides and complex injectables.
Companies profiled and their roles in this market
| Company | Type | Role in the market |
|---|---|---|
| Apotex Inc. | Generics | Canadian supplier, first generic of nilotinib in the U.S. |
| Aurobindo Pharma Ltd. | Generics | Oral and injectable generics for the U.S. and Europe |
| Cipla Ltd. | Generics | Respiratory, anti-infective and chronic therapy generics |
| Dr. Reddy's Laboratories Ltd. | Generics | Edaravone injection and semaglutide in India |
| Endo International plc | Generics and injectables | Merged with Mallinckrodt, Par Health generics unit |
| Fresenius Kabi AG | Injectables | Hospital injectables and biosimilars |
| Glenmark Pharmaceuticals Ltd. | Generics | Respiratory, dermatology and semaglutide in India |
| Hikma Pharmaceuticals plc | Injectables | U.S. liraglutide generic and Xellia injectables |
| KRKA d.d. | Generics | Central and Eastern European retail generics |
| Lupin Ltd. | Generics | Inhalation and complex generics, semaglutide co-marketing |
| Nichi-Iko Pharmaceutical Co., Ltd. | Generics | Japanese generic supplier |
| Sandoz Group AG | Generics and biosimilars | Interchangeable denosumab biosimilars |
| Sun Pharmaceutical Limited | Generics and specialty | Specialty generics and semaglutide in India |
Volume stays in tablets as value moves to complex products
Credence Research's view is that simple tablets will keep most of the volume in off-patent medicines, while biosimilars, peptide copies and complex injectables will carry most of the value growth through 2035. Price erosion limits the upside in crowded oral molecules, so returns depend on being first to file and on reliable low-cost supply. The 2025 FDA proposal on comparative efficacy studies should lower the cost of biosimilar entry. Suppliers with sterile capacity, peptide skills and local plants near major buyers are best placed to grow faster than the market.
How the 2025 baseline and forecast were built
The report uses 2025 as the base year and forecasts market value to 2035, with growth rates stated for 2026–2035. Market values come from the Credence Research market model, which combines prescription volume by therapy area, the generic share of dispensed units and average selling prices by region and channel. Splits by drug type, therapeutic application, route of administration, distribution channel and region are Credence Research estimates. Sources used include FDA approval lists, HHS releases, trade association data and company press releases and filings. No primary interviews or surveys were used to build the estimates.
Biosimilars and peptide copies reshape the mix by 2035
By 2035, the market reaches USD 686.67 billion, with biosimilars and injectables taking a larger part of value than they do today. Simple generics remain the largest type by value and by volume, although price erosion keeps their growth below the market average. Diabetes gains share as liraglutide and semaglutide copies spread to more countries. Online pharmacies take a growing part of repeat chronic prescriptions. Asia Pacific grows fastest as India and China widen access, while North America remains the largest region by value.
Frequently Asked Questions
How big is the generic drugs market?
Which drug type leads the market?
Which drug type grows fastest?
Which region holds the largest share?
How much do generics save U.S. payers?
When did semaglutide copies launch in India?
Who are the leading companies?
What are the main challenges?
Table of Content
Chapter 1 Market Segmentation
- 1.1 Segmentation Framework
- 1.1.1 Product and Service Classification
- 1.1.2 Application and End-Use Classification
- 1.1.3 Technology and Solution Classification
- 1.1.4 Customer and Distribution Channel Classification
- 1.1.5 Geographic Segmentation
- 1.1.6 Market Segment Definitions and Boundaries
- 1.2 By Drug Type
- 1.2.1 Simple Generics
- 1.2.2 Specialty Generics
- 1.2.3 Biosimilars
- 1.2.4 Complex Generics
- 1.3 By Therapeutic Application
- 1.3.1 Cardiovascular
- 1.3.2 Infectious Diseases
- 1.3.3 Cancer
- 1.3.4 Diabetes
- 1.3.5 Others
- 1.4 By Route of Administration
- 1.4.1 Oral
- 1.4.2 Injections
- 1.4.3 Others
Chapter 2 Introduction
- 2.1 Report Objectives and Scope
- 2.2 Product Definition and Industry Terminology
- 2.3 Market Inclusions and Exclusions
- 2.4 Research Process
- 2.4.1 Primary Research and Expert Interviews
- 2.4.2 Secondary Research and Source Review
- 2.4.3 Top-Down and Bottom-Up Estimation
- 2.4.4 Data Triangulation and Verification
- 2.5 Market Size Measurement Basis
- 2.5.1 2025: USD 412.06 billion → 2035: USD 686.67 billion
- 2.6 Historical and Forecast Reference Periods
- 2.6.1 Historical Period: 2018-2025
- 2.6.2 Base Year: 2025
- 2.6.3 Forecast Period: 2025-2035
- 2.7 Research Assumptions and Limitations
Chapter 3 Executive Summary
- 3.1 Market Snapshot and Key Findings
- 3.2 Base-Year Market Size, 2025
- 3.3 Forecast Market Size, 2035
- 3.4 Revenue and Volume Growth Outlook
- 3.5 Key Demand and Supply Indicators
- 3.6 Leading Market Segments
- 3.7 Fastest-Growing Market Opportunities
- 3.8 Regional Performance Highlights
- 3.9 Technology and Industry Transformation
- 3.10 Competitive Landscape Summary
- 3.11 Analyst View and Strategic Implications
Chapter 4 Global Generic Drugs Market Trends and Developments
- 4.1 Historical Industry Development, 2018-2025
- 4.2 Recent Market Trends and Developments
- 4.3 Demand and Customer Behavior Trends
- 4.4 Technology and Product Innovation
- 4.5 Artificial Intelligence, Automation and Digitalization
- 4.6 Local Manufacturing and Supply Chain Realignment
- 4.7 Industry Partnerships, Mergers and Acquisitions
- 4.8 Sustainability and Circular Economy Developments
- 4.9 Government and Private Sector Investment Trends
- 4.10 Emerging Business Models and Commercialization
- 4.11 Industry Developments and Announcements
Chapter 5 Global Generic Drugs Market Production, Supply and Demand Analysis
- 5.1 Demand Trend and Consumption Analysis, 2018-2025
- 5.2 Demand Forecast, 2025-2035
- 5.3 Production and Output Trend, 2018-2025
- 5.4 Production and Output Forecast, 2025-2035
- 5.5 Installed Capacity and Capacity Utilization
- 5.6 Company-Wise Production Plants and Statistics
- 5.6.1 Installed Production Capacity
- 5.6.2 Actual Production
- 5.6.3 Planned Capacity and Expansion Targets
- 5.7 Supply Chain Structure and Procurement Trends
- 5.8 Supply-Demand Gap and Bottlenecks
- 5.9 Import Dependence and Sourcing Structure
- 5.10 Contract Manufacturing and Outsourcing
- 5.11 Regional Supply and Demand Concentration
Chapter 6 Global Generic Drugs Market Pricing Analysis
- 6.1 Pricing Structure and Measurement
- 6.2 Historical Pricing Trends, 2018-2025
- 6.3 Pricing Outlook, 2025-2035
- 6.4 Average Selling Price and Unit Economics
- 6.5 Pricing by Product and Market Segment
- 6.6 Geographic Pricing Differences
- 6.7 Key Input, Energy, Labor and Logistics Costs
- 6.8 Contract Pricing and Purchasing Models
- 6.9 Pricing Sensitivity and Competitive Positioning
- 6.10 Price, Margin and Profitability Implications
Chapter 7 Global Generic Drugs Market Dynamics
- 7.1 Market Growth Drivers
- 7.1.1 Demand-Side Drivers
- 7.1.2 Technology and Innovation Drivers
- 7.1.3 Infrastructure and Investment Drivers
- 7.1.4 Regulatory and Policy Drivers
- 7.2 Market Restraints
- 7.2.1 Cost and Affordability Constraints
- 7.2.2 Technology and Adoption Barriers
- 7.2.3 Supply Chain and Operational Constraints
- 7.3 Market Challenges
- 7.3.1 Competitive Pressure and Margin Erosion
- 7.3.2 Skills, Infrastructure and Implementation Gaps
- 7.4 Emerging Market Opportunities
- 7.5 Market Dynamics Impact and Time-Horizon Assessment
Chapter 8 Global Generic Drugs Value Chain Analysis
- 8.1 Industry Value Chain Overview
- 8.2 Upstream Suppliers and Critical Inputs
- 8.3 Technology and Component Providers
- 8.4 Manufacturing or Service Delivery
- 8.5 Distribution, Channel Partners and Integrators
- 8.6 Downstream Applications and End Users
- 8.7 Value Addition and Profit Pools
- 8.8 Vertical Integration and Outsourcing
- 8.9 Supplier Concentration and Risk
- 8.10 Supply Chain Localization and Resilience
Chapter 9 Global Generic Drugs Market Regulations and Policies
- 9.1 Relevant Laws, Standards and Compliance Frameworks
- 9.2 Product, Service, Safety and Quality Requirements
- 9.3 Government Policies, Incentives and Subsidies
- 9.4 Imports, Exports and Trade Barriers
- 9.5 Public Procurement and Local Content Requirements
- 9.6 Environmental and Sustainability Compliance
- 9.7 Upcoming Policy Changes and Market Implications
Chapter 10 Global Generic Drugs Market Hotspots and Opportunities
- 10.1 Market Opportunity Mapping and Growth Hotspots
- 10.2 High-Growth Applications and Customer Groups
- 10.3 Underserved Markets and White-Space Opportunities
- 10.4 Emerging Technology and Product Opportunities
- 10.5 New Capacity and Investment Hotspots
- 10.6 Market Entry and Expansion Opportunities
- 10.7 Distribution and Partnership Opportunities
- 10.8 Near-Term and Long-Term Commercial Potential
- 10.9 Opportunity Attractiveness and Execution Risks
Chapter 11 Global Generic Drugs Market Outlook, 2025-2035
- 11.1 Market Size and Analysis
- 11.1.1 Revenue (Market Measurement: 2025: USD 412.06 billion → 2035: USD 686.67 billion)
- 11.1.2 Market Volume and Quantity Sold
- 11.1.3 Historical Market Size, 2018-2025
- 11.1.4 Base-Year Market Size, 2025
- 11.2 Market Forecast, 2025-2035
- 11.2.1 Revenue Forecast to 2035
- 11.2.2 Volume Forecast to 2035
- 11.2.3 CAGR and Year-on-Year Growth
- 11.2.4 Incremental Revenue Opportunity
- 11.3 Forecast Assumptions and Scenario Analysis
- 11.3.1 Base-Case Forecast
- 11.3.2 Optimistic and Conservative Scenarios
- 11.3.3 Technology, Pricing and Policy Sensitivities
- 11.4 Market Attractiveness and Growth Outlook
Chapter 12 Global Generic Drugs Market Segmentation and Outlook
- 12.1 Segmentation Summary and Market Shares, 2025
- 12.2 Largest and Fastest-Growing Segments
- 12.3 By Drug Type - Market Size and Forecast, 2025-2035
- 12.3.1 Segment Definition and Scope
- 12.3.2 Historical Market Size, 2018-2025
- 12.3.3 Revenue Forecast, 2025-2035
- 12.3.4 Volume Forecast, 2025-2035
- 12.3.5 Base-Year Market Share, 2025
- 12.3.6 Segment CAGR and Growth Drivers
- 12.3.7 Subsegment Market Size and Forecast
- 12.3.7.1 Simple Generics
- 12.3.7.2 Specialty Generics
- 12.3.7.3 Biosimilars
- 12.3.7.4 Complex Generics
- 12.3.8 Subsegment Pricing and Adoption Trends
- 12.3.9 Leading Suppliers and Competition
- 12.3.10 Regional Demand and Opportunities
- 12.4 By Therapeutic Application - Market Size and Forecast, 2025-2035
- 12.4.1 Segment Definition and Scope
- 12.4.2 Historical Market Size, 2018-2025
- 12.4.3 Revenue Forecast, 2025-2035
- 12.4.4 Volume Forecast, 2025-2035
- 12.4.5 Base-Year Market Share, 2025
- 12.4.6 Segment CAGR and Growth Drivers
- 12.4.7 Subsegment Market Size and Forecast
- 12.4.7.1 Cardiovascular
- 12.4.7.2 Infectious Diseases
- 12.4.7.3 Cancer
- 12.4.7.4 Diabetes
- 12.4.7.5 Others
- 12.4.8 Subsegment Pricing and Adoption Trends
- 12.4.9 Leading Suppliers and Competition
- 12.4.10 Regional Demand and Opportunities
- 12.5 By Route of Administration - Market Size and Forecast, 2025-2035
- 12.5.1 Segment Definition and Scope
- 12.5.2 Historical Market Size, 2018-2025
- 12.5.3 Revenue Forecast, 2025-2035
- 12.5.4 Volume Forecast, 2025-2035
- 12.5.5 Base-Year Market Share, 2025
- 12.5.6 Segment CAGR and Growth Drivers
- 12.5.7 Subsegment Market Size and Forecast
- 12.5.7.1 Oral
- 12.5.7.2 Injections
- 12.5.7.3 Others
- 12.5.8 Subsegment Pricing and Adoption Trends
- 12.5.9 Leading Suppliers and Competition
- 12.5.10 Regional Demand and Opportunities
- 12.6 Segment Growth Comparison
- 12.7 Segment Attractiveness and Priority Matrix
Chapter 13 Global Generic Drugs End-Use and Application Market Outlook
- 13.1 End-Use Industry and Customer Demand Structure
- 13.2 Leading Applications and Customer Groups
- 13.3 End-Use Market Size, Share and Forecast
- 13.4 Major End-Use Industry Deep Dives
- 13.4.1 Customer Requirements and Use Cases
- 13.4.2 Demand and Replacement Cycles
- 13.4.3 Technical and Regulatory Considerations
- 13.4.4 Purchasing and Procurement Models
- 13.4.5 Leading Vendors and Distribution Channels
- 13.4.6 Forecast and Commercial Opportunities
- 13.5 Emerging Applications and Cross-Segment Demand
- 13.6 End-Use Industry Investment Priorities
Chapter 14 Global Generic Drugs Geographic Market Outlook, 2025-2035
- 14.1 Regional Market Size and Share, 2025
- 14.2 Regional Market Forecast, 2025-2035
- 14.3 Regional Pricing, Production and Demand Differences
- 14.4 North America
- 14.4.1 United States
- 14.4.2 Canada
- 14.4.3 Mexico
- 14.5 Europe
- 14.5.1 Germany
- 14.5.2 France
- 14.5.3 Italy
- 14.5.4 United Kingdom
- 14.5.5 Spain
- 14.5.6 Poland
- 14.5.7 Russia
- 14.5.8 Netherlands
- 14.5.9 Belgium
- 14.5.10 Sweden
- 14.5.11 Denmark
- 14.5.12 Norway
- 14.5.13 Rest of Europe
- 14.6 Asia Pacific
- 14.6.1 China
- 14.6.2 India
- 14.6.3 Japan
- 14.6.4 South Korea
- 14.6.5 Thailand
- 14.6.6 Indonesia
- 14.6.7 Vietnam
- 14.6.8 Malaysia
- 14.6.9 Australia
- 14.6.10 Rest of Asia Pacific
- 14.7 Latin America
- 14.7.1 Brazil
- 14.7.2 Argentina
- 14.7.3 Colombia
- 14.7.4 Chile
- 14.7.5 Rest of Latin America
- 14.8 Middle East
- 14.8.1 Saudi Arabia
- 14.8.2 United Arab Emirates
- 14.8.3 Turkey
- 14.8.4 Israel
- 14.8.5 Iran
- 14.8.6 Rest of the Middle East
- 14.9 Africa
- 14.9.1 South Africa
- 14.9.2 Egypt
- 14.9.3 Nigeria
- 14.9.4 Morocco
- 14.9.5 Rest of Africa
- 14.10 Regional Investment, Policy and Supply Chain Differences
- 14.11 Regional Competitive Landscape
- 14.12 Geographic Growth Hotspots
Chapter 15 Global Generic Drugs Technology, Innovation and Sustainability Outlook
- 15.1 Technology Landscape and Maturity
- 15.2 Product, Process and Service Innovation
- 15.3 AI, Automation and Digital Tools in the Industry
- 15.4 Technology Adoption and Performance Benchmarking
- 15.5 Innovation Pipeline and R&D Investment
- 15.6 Patent and Intellectual Property Trends
- 15.7 Energy Efficiency and Resource Management
- 15.8 Sustainability, Recycling and Circularity
- 15.9 Technology Roadmap, 2025-2035
- 15.10 Risks of Obsolescence and Technology Substitution
Chapter 16 Global Generic Drugs Market Key Strategic Imperatives
- 16.1 Growth and Market Entry Priorities
- 16.2 High-Return Products and Segments
- 16.3 Pricing, Profitability and Cost Optimization
- 16.4 Technology Investment and Product Differentiation
- 16.5 Supply Chain Localization and Resilience
- 16.6 Distribution and Customer Acquisition
- 16.7 Partnership, Acquisition and Capacity Strategy
- 16.8 Regional Expansion Priorities
- 16.9 Short-, Medium- and Long-Term Actions
Chapter 17 Competition Outlook
- 17.1 Industry Competition Characteristics
- 17.2 Market Structure and Concentration
- 17.3 Market Share and Competitive Positioning, 2025
- 17.4 Company-Wise Revenue and Product Benchmarking
- 17.5 Production and Service Capacity Benchmarking
- 17.6 Technology, Pricing and Differentiation
- 17.7 Regional Footprint and Distribution Strength
- 17.8 Mergers, Acquisitions and Strategic Alliances
- 17.9 New Entrants and Competitive Threats
- 17.10 Porter's Five Forces and Industry Attractiveness
- 17.11 Competitive Outlook, 2025-2035
Chapter 18 Company Profiles
- 18.1 Company Coverage and Selection Criteria
- 18.2 Apotex Inc.
- 18.2.1 Business Description
- 18.2.2 Company Ownership and Geographic Presence
- 18.2.3 Product and Service Portfolio
- 18.2.4 Manufacturing and Operating Footprint
- 18.2.5 Production Capacity and Expansion Plans
- 18.2.6 Financial Performance and Investment
- 18.2.7 Market Share and Competitive Position
- 18.2.8 Technology and Innovation Capabilities
- 18.2.9 Strategic Alliances or Partnerships
- 18.2.10 Recent Developments
- 18.2.11 Growth Strategy and Outlook
- 18.3 Aurobindo Pharma Ltd.
- 18.4 Cipla Ltd.
- 18.5 Dr. Reddy's Laboratories Ltd.
- 18.6 Endo International plc
- 18.7 Fresenius Kabi AG
- 18.8 Glenmark Pharmaceuticals Ltd.
- 18.9 Hikma Pharmaceuticals plc
- 18.10 KRKA d.d.
- 18.11 Lupin Ltd.
- 18.12 Nichi-Iko Pharmaceutical Co., Ltd.
- 18.13 Sandoz Group AG
- 18.14 Sun Pharmaceutical Limited
- 18.15 Other Relevant Market Participants
Note: Every listed company is profiled on the structure shown under the first company. The company list is preliminary and may change based on research findings, market developments, data availability and client requirements.
Chapter 19 Disclaimer
- 19.1 Research and Forecast Disclaimer
- 19.2 Data Source and Estimation Limitations
Note: The depth of individual sections depends on data availability for this market. Volume, capacity, trade and other unit-based metrics are included where applicable.

