
Market Overview
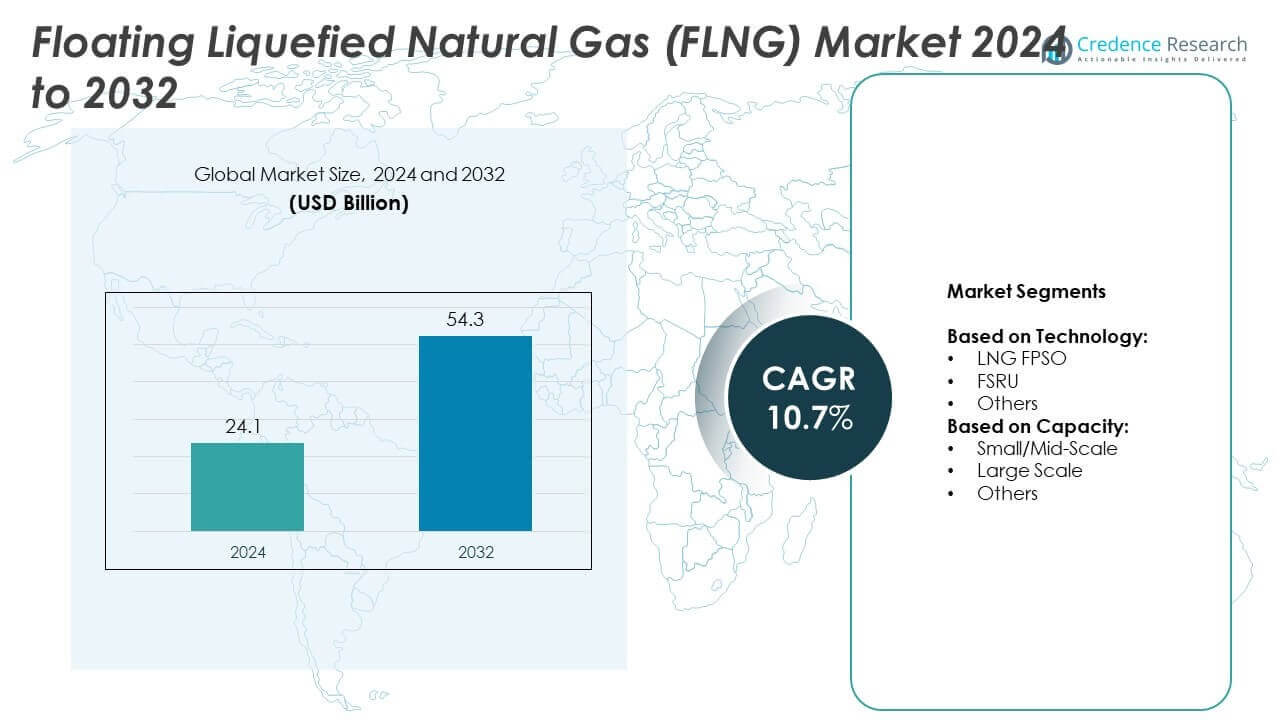
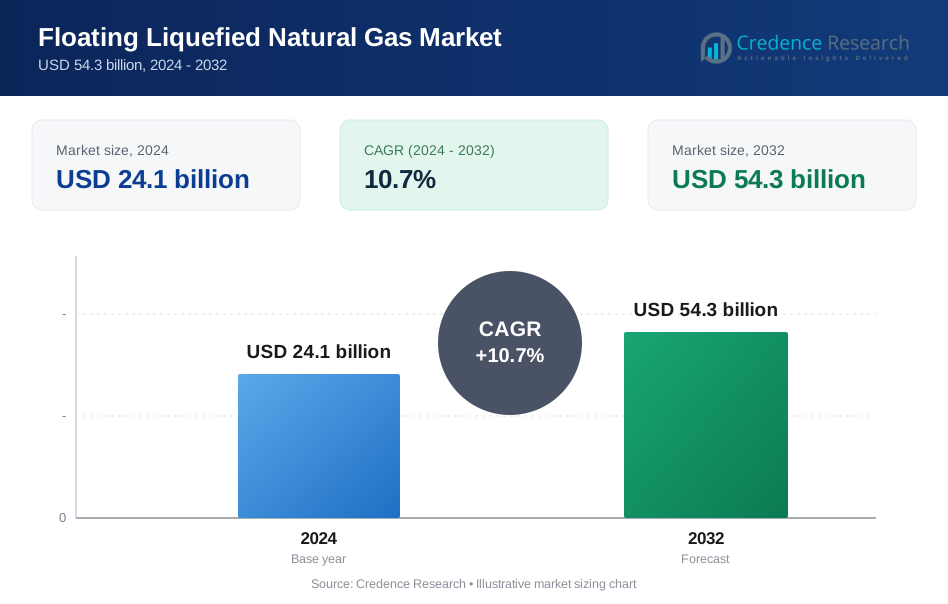
Floating Liquefied Natural Gas (FLNG) Market size was valued at USD 24.1 billion in 2024 and is anticipated to reach USD 54.3 billion by 2032, at a CAGR of 10.7% during the forecast period.
| REPORT ATTRIBUTE | DETAILS |
|---|---|
| Historical Period | 2020-2023 |
| Base Year | 2024 |
| Forecast Period | 2025-2032 |
| Floating Liquefied Natural Gas (FLNG) Market Size 2024 | USD 24.1 Billion |
| Floating Liquefied Natural Gas (FLNG) Market, CAGR | 10.7% |
| Floating Liquefied Natural Gas (FLNG) Market Size 2032 | USD 54.3 Billion |
The Floating Liquefied Natural Gas (FLNG) market grows with rising global demand for cleaner energy, increasing reliance on LNG imports, and the need for cost-efficient offshore resource monetization. Operators invest in FLNG projects to access stranded gas reserves and ensure energy security for importing nations. Trends include adoption of large-scale FLNG units, integration of digital monitoring technologies, and focus on decarbonization through carbon capture solutions. These factors position FLNG as a vital component in the global energy transition.
The Floating Liquefied Natural Gas (FLNG) market shows strong growth across regions, with Asia-Pacific leading due to high LNG consumption in China, India, and Southeast Asia. Europe accelerates adoption to secure energy diversification, while North America strengthens its position as a major exporter supported by offshore projects. Latin America and Middle East & Africa expand gradually through new offshore developments. Key players driving this landscape include Shell plc, PETRONAS, Golar LNG Limited, and Hoegh LNG.
Market Insights
- Floating Liquefied Natural Gas (FLNG) market was valued at USD 24.1 billion in 2024 and is projected to reach USD 54.3 billion by 2032, growing at a CAGR of 10.7%.
- Market drivers include rising global LNG demand, need for energy security, and cost-efficient offshore resource monetization.
- Key trends highlight expansion of large-scale FLNG projects, integration of digital monitoring and automation, and focus on decarbonization strategies.
- Competitive analysis shows strong participation from leading players investing in advanced liquefaction technologies, emission-control solutions, and strategic partnerships to secure long-term supply contracts.
- Market restraints include high capital investment, technical risks in deepwater operations, complex regulatory approvals, and growing environmental concerns impacting project timelines.
- Regional analysis indicates Asia-Pacific leads with strong demand from China, India, and Southeast Asia, while Europe focuses on reducing pipeline dependency, North America strengthens exports, and Latin America and Middle East & Africa grow through new offshore projects.
- Overall market insights point to FLNG’s vital role in the global energy transition, with emphasis on sustainability, diversification of supply sources, and adaptability to different demand scales through both large and small capacity solutions.
Market Drivers
Growing Global Energy Demand and Rising LNG Consumption
The Floating Liquefied Natural Gas (FLNG) market grows with increasing global demand for natural gas as a cleaner energy source. LNG supports energy security for nations aiming to diversify supply away from traditional oil and coal. Rising consumption in power generation, industrial use, and household demand strengthens LNG trade. It provides flexible sourcing solutions for countries with limited pipeline access. LNG imports expand in regions such as Asia-Pacific and Europe, where reliance on gas is intensifying. The surge in consumption pushes investment in offshore liquefaction capacity to secure long-term supplies.
- For instance, Shell's Prelude FLNG facility in Australia has a production capacity of 3.6 million tonnes per annum (mtpa) of LNG. The facility began production from the wellhead in December 2018, and the first LNG cargo was shipped in June 2019. The LNG is intended to supply regional demand, primarily in Asia.
Cost-Effective Offshore Resource Utilization
FLNG technology reduces the need for extensive onshore infrastructure, creating significant cost savings for operators. It allows direct processing and liquefaction of gas at offshore fields, bypassing long-distance pipelines. This method enhances project feasibility in remote and deepwater reserves. It helps monetize previously stranded assets that were uneconomical through conventional infrastructure. Oil and gas companies increasingly adopt FLNG solutions to optimize field development economics. Growing focus on capital efficiency drives strong interest in offshore liquefaction investments.
- For instance, Petronas’ PFLNG Dua began operations in 2021 with a capacity of 1.5 million tonnes per year, monetizing deepwater gas reserves offshore Sabah
Energy Security and Supply Diversification Strategies
Geopolitical risks and pipeline vulnerabilities make FLNG an attractive option for countries seeking energy security. It ensures continuous access to global LNG trade without dependency on land-based infrastructure. Countries pursue FLNG projects to diversify energy imports and reduce reliance on limited suppliers. It enhances resilience against supply disruptions caused by political instability or infrastructure sabotage. Governments actively support LNG import diversification policies to strengthen national energy portfolios. The emphasis on stable, diversified sourcing accelerates FLNG adoption worldwide.
Sustainability Goals and Cleaner Energy Transition
Natural gas plays a crucial role in the global shift toward lower-carbon energy. The FLNG market benefits from policies encouraging transition from coal to cleaner fuels. It offers lower carbon emissions compared to other fossil fuels, aligning with climate commitments. LNG adoption in power and industrial sectors helps reduce greenhouse gas intensity. Investments in FLNG align with global climate strategies while ensuring energy reliability. Rising focus on sustainable energy practices accelerates demand for offshore liquefaction solutions.
Market Trends
Expansion of Large-Scale FLNG Projects
The Floating Liquefied Natural Gas (FLNG) market observes a rising shift toward large-scale projects. Operators expand offshore capacity to monetize vast gas reserves in deepwater fields. It supports cost-effective development of regions where traditional infrastructure is limited. Companies invest in mega projects to secure long-term LNG supply contracts. Larger FLNG units improve economies of scale and reduce production costs. Growing confidence in offshore liquefaction boosts global investment in floating solutions.
- For instance, Eni’s Coral-Sul FLNG in Mozambique has a liquefaction capacity of 3.4 million tonnes per annum (mtpa). The facility successfully shipped its first LNG cargo in November 2022 and, as of April 2025, has delivered at least 100 LNG cargoes. In August 2024, Eni announced that the facility had achieved a production milestone of 5 million tonnes of LNG.
Integration of Digital and Automation Technologies
Digitalization trends reshape FLNG operations with advanced monitoring, automation, and predictive maintenance. Operators deploy real-time analytics to optimize liquefaction efficiency and reduce downtime. It enhances safety and reliability in complex offshore environments. Use of AI, IoT, and digital twins streamlines performance management across liquefaction units. Companies adopt remote operations to lower operational risks and improve workforce safety. Rising emphasis on digital technologies positions FLNG projects as more competitive in the energy market.
- For instance, Golar LNG's converted Hilli Episeyo FLNG facility began producing its first LNG in March 2018 and reached full commercial operation in June 2018, operating offshore Cameroon with a design capacity of up to 2.4 million tonnes per annum (mtpa).
Regional Shifts Toward Asia-Pacific Dominance
Asia-Pacific drives global demand for LNG due to rising consumption in China, India, and Southeast Asia. Import dependence pushes governments to invest in long-term FLNG supply contracts. It enhances energy security while meeting growing power and industrial needs. Regional dominance is reinforced by large import terminals and strong policy support. Strategic partnerships between Asian buyers and offshore producers expand liquefaction capacity. The region remains central to the growth trajectory of offshore LNG trade.
Growing Focus on Decarbonization and Cleaner Energy
Energy transition goals push companies to integrate cleaner processes in FLNG projects. Carbon capture and storage solutions become part of offshore liquefaction strategies. It helps reduce the carbon intensity of LNG supply chains. Operators prioritize renewable integration and low-emission technologies to meet stricter regulations. Cleaner LNG adoption supports global climate commitments and green financing access. Rising focus on decarbonization ensures FLNG aligns with long-term sustainability targets.
Market Challenges Analysis
High Capital Investment and Technical Complexities
The Floating Liquefied Natural Gas (FLNG) market faces challenges from high upfront investment and technical risks. Construction of FLNG vessels requires advanced engineering and specialized equipment, driving significant capital expenditure. It demands strong financial backing and long project timelines, which limit participation to large players. Smaller companies struggle to compete due to financial and technological barriers. Technical challenges in deepwater operations increase risks of delays and cost overruns. Uncertainties in global LNG pricing also impact project feasibility and long-term profitability.
Regulatory Barriers and Environmental Concerns
Regulatory approvals remain complex due to strict safety and environmental standards for offshore operations. It increases project timelines and adds compliance costs for developers. Environmental concerns about emissions, marine ecosystems, and potential accidents create resistance from stakeholders. Operators face pressure to integrate cleaner technologies, which further raises development costs. Political instability and shifting energy policies in key regions also add uncertainty to investment decisions. Regulatory and environmental pressures combine to slow adoption and expansion of FLNG projects
Market Opportunities
Untapped Offshore Gas Reserves and New Market Access
The Floating Liquefied Natural Gas (FLNG) market holds strong opportunities in monetizing stranded and remote offshore gas fields. FLNG units enable direct liquefaction at sea, removing the need for long-distance pipelines. It makes marginal and deepwater fields commercially viable, unlocking new production zones worldwide. Countries with limited onshore infrastructure can access global LNG trade more effectively. Growing demand in emerging economies strengthens the case for expanding FLNG deployment. Strategic partnerships with resource-rich regions open doors for long-term supply agreements.
Technological Advancements and Sustainability Alignment
Innovation in design, automation, and emission-control technologies enhances the efficiency of modern FLNG units. It allows operators to meet stricter environmental regulations while lowering operating costs. Integration of carbon capture systems and hybrid energy sources positions FLNG as a cleaner solution. Advances in digital monitoring further improve safety, reliability, and performance of offshore liquefaction. Growing emphasis on energy transition creates favorable conditions for investment in cleaner LNG solutions. Adoption of sustainable practices helps expand FLNG’s role in future global energy supply.
Market Segmentation Analysis:
By Technology:
The Floating Liquefied Natural Gas (FLNG) market is segmented into LNG FPSO, FSRU, and others. LNG Floating Production Storage and Offloading (FPSO) units dominate due to their ability to monetize offshore gas reserves directly at sea. It enables efficient liquefaction, storage, and offloading without the need for land-based infrastructure. Companies adopt LNG FPSO solutions to unlock stranded resources and reduce project costs in remote areas. Floating Storage and Regasification Units (FSRUs) also hold strong demand, driven by their role in LNG import and regasification. Countries with growing energy needs use FSRUs to ensure rapid access to LNG supplies. The others category includes niche technologies and hybrid solutions that provide flexibility in smaller or specialized projects.
- For instance, Höegh Evi operates a fleet that includes ten FSRUs and two LNG carriers. The Höegh Esperanza FSRU began service in Wilhelmshaven, Germany, in December 2022, and has a maximum regasification throughput of 750 million standard cubic feet per day (mmscf/d). The number of LNG carriers is currently two because the vessel Höegh Gandria is undergoing conversion into an FSRU for a charter agreement in Egypt starting in 2026
By Capacity:
The market is divided into small/mid-scale, large scale, and others. Large-scale FLNG units lead the segment due to their ability to process high volumes of gas and achieve economies of scale. It supports long-term LNG contracts for major importing countries, making such projects highly attractive to investors. Small and mid-scale units serve regions with moderate demand or limited infrastructure, offering more localized solutions. These units play a vital role in enabling access to LNG for smaller economies and island nations. The others category includes modular and experimental capacity solutions tailored for specific operational requirements. Growing focus on diverse capacity options highlights the adaptability of FLNG in meeting global energy needs.
- For instance, Exmar's Tango FLNG, with a reported liquefaction capacity of 0.5 to 0.6 million tonnes per annum (mtpa), was deployed in Argentina under a contract with YPF starting in 2019.
Segments:
Based on Technology:
- LNG FPSO
- FSRU
- Others
Based on Capacity:
- Small/Mid-Scale
- Large Scale
- Others
Based on the Geography:
- North America
- U.S.
- Canada
- Mexico
- Europe
- UK
- France
- Germany
- Italy
- Spain
- Russia
- Belgium
- Netherlands
- Austria
- Sweden
- Poland
- Denmark
- Switzerland
- Rest of Europe
- Asia Pacific
- China
- Japan
- South Korea
- India
- Australia
- Thailand
- Indonesia
- Vietnam
- Malaysia
- Philippines
- Taiwan
- Rest of Asia Pacific
- Latin America
- Brazil
- Argentina
- Peru
- Chile
- Colombia
- Rest of Latin America
- Middle East
- UAE
- KSA
- Israel
- Turkey
- Iran
- Rest of Middle East
- Africa
- Egypt
- Nigeria
- Algeria
- Morocco
- Rest of Africa
Regional Analysis
North America
North America accounted for 28% share of the Floating Liquefied Natural Gas (FLNG) market in 2024, driven by strong offshore reserves, robust investment in energy infrastructure, and advanced technological expertise. The region benefits from abundant shale gas production, which encourages operators to adopt flexible liquefaction and export solutions. It has also become a key supplier of LNG to Europe and Asia, which strengthens its export competitiveness. Offshore liquefaction projects in the Gulf of Mexico play a vital role in meeting long-term LNG demand. Strong collaboration between governments and private players supports faster project development and regulatory approvals. Rising demand from trading partners ensures North America continues to hold a leading position in global LNG exports.
Europe
Europe held 22% share of the Floating Liquefied Natural Gas (FLNG) market in 2024, supported by its urgent need to diversify away from pipeline imports and strengthen energy security. The region depends heavily on LNG imports to counter disruptions in traditional gas supply chains. FLNG provides Europe with flexible sourcing strategies, reducing reliance on single suppliers. Investment in floating regasification infrastructure has accelerated across major economies such as Germany, France, and Italy. It enables quicker deployment compared to permanent onshore terminals, which meets the growing urgency of securing energy resources. Europe’s climate commitments also encourage wider LNG adoption, positioning FLNG as a transitional solution that reduces emissions relative to coal and oil.
Asia-Pacific
Asia-Pacific dominated the Floating Liquefied Natural Gas (FLNG) market with 34% share in 2024, making it the largest regional market. Strong demand from China, India, South Korea, and Southeast Asia fuels LNG consumption for power generation, industrial processes, and residential needs. It benefits from growing partnerships with global suppliers to secure stable long-term contracts. Offshore projects in Australia, Indonesia, and Malaysia also contribute significantly to regional supply. Governments in Asia-Pacific prioritize LNG to meet rising energy demand while aligning with sustainability goals. Expansion of import terminals and regasification capacity creates sustained opportunities for floating liquefaction. Asia-Pacific’s large consumer base and policy support ensure its continued dominance in the global market.
Latin America
Latin America accounted for 9% share of the Floating Liquefied Natural Gas (FLNG) market in 2024, supported by new offshore gas developments and flexible import solutions. Countries like Brazil and Argentina increasingly adopt FLNG to enhance energy availability and reduce dependence on costly imports. It provides a practical solution for remote coastal and island regions lacking pipeline infrastructure. National oil companies and international partners collaborate to expand floating liquefaction and regasification projects. Growing industrial demand and rising power generation needs strengthen LNG’s role in regional energy planning. Latin America shows steady growth prospects as governments prioritize domestic energy development and foreign investment.
Middle East & Africa
Middle East & Africa represented 7% share of the Floating Liquefied Natural Gas (FLNG) market in 2024, reflecting its growing importance in offshore LNG development. The region leverages vast natural gas reserves in countries like Mozambique, Nigeria, and Qatar to expand floating liquefaction projects. It enables cost-effective monetization of reserves in areas lacking extensive infrastructure. Governments attract foreign investment by promoting LNG as a key export revenue source. It also supports energy access in underserved domestic markets, improving regional economic growth. Rising collaboration between local and international energy companies highlights the strategic role of FLNG in the Middle East & Africa’s long-term energy strategy.
Key Player Analysis
- Excelerate Energy, Inc.
- Mitsui O.S.K. Lines
- Woodside Energy Group Ltd
- EXMAR
- Shell plc
- Hoegh LNG
- Petroliam Nasional Berhad (PETRONAS)
- BASF SE
- Eni S.p.A.
- ABB Ltd.
- Golar LNG Limited
Competitive Analysis
The leading players in the Floating Liquefied Natural Gas (FLNG) market include ABB Ltd., Petroliam Nasional Berhad (PETRONAS), Woodside Energy Group Ltd, EXMAR, Hoegh LNG, Shell plc, Excelerate Energy, Inc., BASF SE, Golar LNG Limited, Mitsui O.S.K. Lines, and Eni S.p.A. These companies drive market growth through technological innovation, strategic partnerships, and global project expansion. The market is highly competitive, with players focusing on large-scale offshore projects to secure long-term contracts. Companies invest heavily in advanced liquefaction and regasification technologies to improve efficiency and reduce operational risks. They also strengthen their presence by aligning with governments and energy firms in emerging LNG-importing regions. Sustainability strategies remain central, with firms integrating carbon capture, digital monitoring, and emission-control systems into FLNG projects. Global energy transition policies provide opportunities for expansion, and key players leverage their expertise to meet demand for cleaner fuels. Strategic alliances, joint ventures, and investments in both large-scale and small/mid-scale capacity help capture a wide consumer base. Continuous innovation and project execution capabilities enable these companies to maintain a strong competitive edge. Together, their initiatives shape the growth trajectory and long-term resilience of the global FLNG industry.
Recent Developments
- In 2025, Golar LNG Limited's customer, Southern Energy S.A. (SESA), reached a Final Investment Decision (FID) for a 20-year charter of Golar's MK II FLNG unit to be deployed in Argentina. Golar's FLNG Gimi achieved its Commercial Operations Date (COD) in June 2025, triggering the start of its 20-year lease with BP.
- In July 2025, PETRONAS LNG and SMJ Energy signed a Heads of Agreement (HoA) for SMJ Energy to acquire a 25% equity stake in PFLNG 3 Sdn Bhd.
- In April 2025, Woodside Energy approved final investment for a Louisiana LNG development (three-train, 16.5 mtpa), with first LNG targeted for 2029.
Report Coverage
The research report offers an in-depth analysis based on Technology, Capacity, and Geography. It details leading market players, providing an overview of their business, product offerings, investments, revenue streams, and key applications. Additionally, the report includes insights into the competitive environment, SWOT analysis, current market trends, as well as the primary drivers and constraints. Furthermore, it discusses various factors that have driven market expansion in recent years. The report also explores market dynamics, regulatory scenarios, and technological advancements that are shaping the industry. It assesses the impact of external factors and global economic changes on market growth. Lastly, it provides strategic recommendations for new entrants and established companies to navigate the complexities of the market.
Future Outlook
- The Floating Liquefied Natural Gas (FLNG) market will expand with rising global LNG demand.
- Large-scale FLNG projects will dominate due to cost efficiency and higher output capacity.
- Small and mid-scale units will grow to meet localized energy needs and island demand.
- Asia-Pacific will remain the largest market with strong LNG consumption in China and India.
- Europe will invest in FLNG to reduce reliance on pipeline gas and diversify supply sources.
- North America will strengthen its position as a key LNG exporter through offshore projects.
- Digitalization, automation, and AI integration will enhance safety and operational efficiency.
- Sustainability initiatives will push companies to adopt low-emission and carbon capture solutions.
- Strategic partnerships between global energy companies and governments will accelerate project deployment.
- Rising investments in offshore reserves will secure FLNG’s role in long-term energy transition.
Request a Free Sample
Fill in your details and we'll send you a free sample report.
- Sample data tables & charts
- Research methodology
Market Dynamics
Rising Global LNG Demand and Cleaner Energy Transition
The shift towards cleaner energy sources and the need to reduce carbon emissions are driving increased LNG consumption worldwide. FLNG enables countries to access natural gas as a lower-carbon alternative to coal and oil, supporting global climate commitments and energy transition goals.
Cost-Efficient Monetization of Offshore and Stranded Gas Reserves
FLNG technology allows direct liquefaction and export of gas from offshore fields, bypassing the need for expensive onshore infrastructure and long pipelines. This makes previously uneconomical or remote gas reserves commercially viable, attracting investment in new offshore projects.
Energy Security and Supply Diversification
Geopolitical risks and pipeline vulnerabilities have prompted countries to seek flexible LNG import solutions. FLNG provides secure, diversified access to global LNG markets, reducing reliance on single suppliers and enhancing resilience against supply disruptions.
Technological Advancements and Digitalization
Integration of digital monitoring, automation, and emission-control technologies is improving the efficiency, safety, and environmental performance of FLNG units. These innovations lower operational risks and costs, making FLNG projects more attractive to operators and investors.
Rapid Deployment and Flexibility for Emerging Markets
FLNG and FSRU solutions can be deployed faster than traditional onshore terminals, enabling emerging economies and island nations to quickly access LNG supplies. This flexibility supports localized energy needs and accelerates market growth in regions with limited infrastructure.
Need a Custom Version of This Report?
Tailor the scope, geography, or segments to your exact requirements.
- Custom geography or segment scope
- Direct access to our analyst team
Frequently Asked Questions
What is the current market size for Floating Liquefied Natural Gas (FLNG) market, and what is its projected size in 2032?
At what Compound Annual Growth Rate is the Floating Liquefied Natural Gas (FLNG) Market projected to grow between 2025 and 2032?
Which Floating Liquefied Natural Gas (FLNG) market segment held the largest share in 2024?
What are the primary factors fueling the growth of the Floating Liquefied Natural Gas (FLNG) market?
Who are the leading companies in the Floating Liquefied Natural Gas (FLNG) Market?
Which region commanded the largest share of the Floating Liquefied Natural Gas (FLNG) market in 2024?
Table of Content
Chapter 1 Market Segmentation
- 1.1 Segmentation Framework
- 1.1.1 Product and Service Classification
- 1.1.2 Application and End-Use Classification
- 1.1.3 Technology and Solution Classification
- 1.1.4 Customer and Distribution Channel Classification
- 1.1.5 Geographic Segmentation
- 1.1.6 Market Segment Definitions and Boundaries
- 1.2 By Capacity
- 1.2.1 Small/Mid-Scale
- 1.2.2 Large Scale
- 1.2.3 Others
- 1.3 By Technology
- 1.3.1 LNG FPSO
- 1.3.2 FSRU
- 1.3.3 Others
Chapter 2 Introduction
- 2.1 Report Objectives and Scope
- 2.2 Product Definition and Industry Terminology
- 2.3 Market Inclusions and Exclusions
- 2.4 Research Process
- 2.4.1 Primary Research and Expert Interviews
- 2.4.2 Secondary Research and Source Review
- 2.4.3 Top-Down and Bottom-Up Estimation
- 2.4.4 Data Triangulation and Verification
- 2.5 Market Size Measurement Basis
- 2.5.1 2024: USD 24.1 billion → 2032: USD 54.3 billion
- 2.6 Historical and Forecast Reference Periods
- 2.6.1 Base Year: 2024
- 2.6.2 Forecast Period: 2024-2032
- 2.7 Research Assumptions and Limitations
Chapter 3 Executive Summary
- 3.1 Market Snapshot and Key Findings
- 3.2 Base-Year Market Size, 2024
- 3.3 Forecast Market Size, 2032
- 3.4 Revenue and Volume Growth Outlook
- 3.5 Key Demand and Supply Indicators
- 3.6 Leading Market Segments
- 3.7 Fastest-Growing Market Opportunities
- 3.8 Regional Performance Highlights
- 3.9 Technology and Industry Transformation
- 3.10 Competitive Landscape Summary
- 3.11 Analyst View and Strategic Implications
Chapter 4 Global Floating Liquefied Natural Gas Market Trends and Developments
- 4.1 Historical Industry Development
- 4.2 Recent Market Trends and Developments
- 4.3 Demand and Customer Behavior Trends
- 4.4 Technology and Product Innovation
- 4.5 Artificial Intelligence, Automation and Digitalization
- 4.6 Local Manufacturing and Supply Chain Realignment
- 4.7 Industry Partnerships, Mergers and Acquisitions
- 4.8 Sustainability and Circular Economy Developments
- 4.9 Government and Private Sector Investment Trends
- 4.10 Emerging Business Models and Commercialization
- 4.11 Industry Developments and Announcements
Chapter 5 Global Floating Liquefied Natural Gas Market Production, Supply and Demand Analysis
- 5.1 Demand Trend and Consumption Analysis
- 5.2 Demand Forecast, 2024-2032
- 5.3 Production and Output Trend
- 5.4 Production and Output Forecast, 2024-2032
- 5.5 Installed Capacity and Capacity Utilization
- 5.6 Company-Wise Production Plants and Statistics
- 5.6.1 Installed Production Capacity
- 5.6.2 Actual Production
- 5.6.3 Planned Capacity and Expansion Targets
- 5.7 Supply Chain Structure and Procurement Trends
- 5.8 Supply-Demand Gap and Bottlenecks
- 5.9 Import Dependence and Sourcing Structure
- 5.10 Contract Manufacturing and Outsourcing
- 5.11 Regional Supply and Demand Concentration
Chapter 6 Global Floating Liquefied Natural Gas Market Pricing Analysis
- 6.1 Pricing Structure and Measurement
- 6.2 Historical Pricing Trends
- 6.3 Pricing Outlook, 2024-2032
- 6.4 Average Selling Price and Unit Economics
- 6.5 Pricing by Product and Market Segment
- 6.6 Geographic Pricing Differences
- 6.7 Key Input, Energy, Labor and Logistics Costs
- 6.8 Contract Pricing and Purchasing Models
- 6.9 Pricing Sensitivity and Competitive Positioning
- 6.10 Price, Margin and Profitability Implications
Chapter 7 Global Floating Liquefied Natural Gas Market Dynamics
- 7.1 Market Growth Drivers
- 7.1.1 Demand-Side Drivers
- 7.1.2 Technology and Innovation Drivers
- 7.1.3 Infrastructure and Investment Drivers
- 7.1.4 Regulatory and Policy Drivers
- 7.2 Market Restraints
- 7.2.1 Cost and Affordability Constraints
- 7.2.2 Technology and Adoption Barriers
- 7.2.3 Supply Chain and Operational Constraints
- 7.3 Market Challenges
- 7.3.1 Competitive Pressure and Margin Erosion
- 7.3.2 Skills, Infrastructure and Implementation Gaps
- 7.4 Emerging Market Opportunities
- 7.5 Market Dynamics Impact and Time-Horizon Assessment
Chapter 8 Global Floating Liquefied Natural Gas Value Chain Analysis
- 8.1 Industry Value Chain Overview
- 8.2 Upstream Suppliers and Critical Inputs
- 8.3 Technology and Component Providers
- 8.4 Manufacturing or Service Delivery
- 8.5 Distribution, Channel Partners and Integrators
- 8.6 Downstream Applications and End Users
- 8.7 Value Addition and Profit Pools
- 8.8 Vertical Integration and Outsourcing
- 8.9 Supplier Concentration and Risk
- 8.10 Supply Chain Localization and Resilience
Chapter 9 Global Floating Liquefied Natural Gas Market Regulations and Policies
- 9.1 Relevant Laws, Standards and Compliance Frameworks
- 9.2 Product, Service, Safety and Quality Requirements
- 9.3 Government Policies, Incentives and Subsidies
- 9.4 Imports, Exports and Trade Barriers
- 9.5 Public Procurement and Local Content Requirements
- 9.6 Environmental and Sustainability Compliance
- 9.7 Upcoming Policy Changes and Market Implications
Chapter 10 Global Floating Liquefied Natural Gas Market Hotspots and Opportunities
- 10.1 Market Opportunity Mapping and Growth Hotspots
- 10.2 High-Growth Applications and Customer Groups
- 10.3 Underserved Markets and White-Space Opportunities
- 10.4 Emerging Technology and Product Opportunities
- 10.5 New Capacity and Investment Hotspots
- 10.6 Market Entry and Expansion Opportunities
- 10.7 Distribution and Partnership Opportunities
- 10.8 Near-Term and Long-Term Commercial Potential
- 10.9 Opportunity Attractiveness and Execution Risks
Chapter 11 Global Floating Liquefied Natural Gas Market Outlook, 2024-2032
- 11.1 Market Size and Analysis
- 11.1.1 Revenue (Market Measurement: 2024: USD 24.1 billion → 2032: USD 54.3 billion)
- 11.1.2 Market Volume and Quantity Sold
- 11.1.3 Historical Market Size
- 11.1.4 Base-Year Market Size, 2024
- 11.2 Market Forecast, 2024-2032
- 11.2.1 Revenue Forecast to 2032
- 11.2.2 Volume Forecast to 2032
- 11.2.3 CAGR and Year-on-Year Growth
- 11.2.4 Incremental Revenue Opportunity
- 11.3 Forecast Assumptions and Scenario Analysis
- 11.3.1 Base-Case Forecast
- 11.3.2 Optimistic and Conservative Scenarios
- 11.3.3 Technology, Pricing and Policy Sensitivities
- 11.4 Market Attractiveness and Growth Outlook
Chapter 12 Global Floating Liquefied Natural Gas Market Segmentation and Outlook
- 12.1 Segmentation Summary and Market Shares, 2024
- 12.2 Largest and Fastest-Growing Segments
- 12.3 By Capacity - Market Size and Forecast, 2024-2032
- 12.3.1 Segment Definition and Scope
- 12.3.2 Historical Market Size
- 12.3.3 Revenue Forecast, 2024-2032
- 12.3.4 Volume Forecast, 2024-2032
- 12.3.5 Base-Year Market Share, 2024
- 12.3.6 Segment CAGR and Growth Drivers
- 12.3.7 Subsegment Market Size and Forecast
- 12.3.7.1 Small/Mid-Scale
- 12.3.7.2 Large Scale
- 12.3.7.3 Others
- 12.3.8 Subsegment Pricing and Adoption Trends
- 12.3.9 Leading Suppliers and Competition
- 12.3.10 Regional Demand and Opportunities
- 12.4 By Technology - Market Size and Forecast, 2024-2032
- 12.4.1 Segment Definition and Scope
- 12.4.2 Historical Market Size
- 12.4.3 Revenue Forecast, 2024-2032
- 12.4.4 Volume Forecast, 2024-2032
- 12.4.5 Base-Year Market Share, 2024
- 12.4.6 Segment CAGR and Growth Drivers
- 12.4.7 Subsegment Market Size and Forecast
- 12.4.7.1 LNG FPSO
- 12.4.7.2 FSRU
- 12.4.7.3 Others
- 12.4.8 Subsegment Pricing and Adoption Trends
- 12.4.9 Leading Suppliers and Competition
- 12.4.10 Regional Demand and Opportunities
- 12.5 Segment Growth Comparison
- 12.6 Segment Attractiveness and Priority Matrix
Chapter 13 Global Floating Liquefied Natural Gas Geographic Market Outlook, 2024-2032
- 13.1 Regional Market Size and Share, 2024
- 13.2 Regional Market Forecast, 2024-2032
- 13.3 Regional Pricing, Production and Demand Differences
- 13.4 North America
- 13.4.1 United States
- 13.4.2 Canada
- 13.4.3 Mexico
- 13.5 Europe
- 13.5.1 Germany
- 13.5.2 France
- 13.5.3 Italy
- 13.5.4 United Kingdom
- 13.5.5 Spain
- 13.5.6 Poland
- 13.5.7 Russia
- 13.5.8 Netherlands
- 13.5.9 Belgium
- 13.5.10 Sweden
- 13.5.11 Denmark
- 13.5.12 Norway
- 13.5.13 Rest of Europe
- 13.6 Asia Pacific
- 13.6.1 China
- 13.6.2 India
- 13.6.3 Japan
- 13.6.4 South Korea
- 13.6.5 Thailand
- 13.6.6 Indonesia
- 13.6.7 Vietnam
- 13.6.8 Malaysia
- 13.6.9 Australia
- 13.6.10 Rest of Asia Pacific
- 13.7 Latin America
- 13.7.1 Brazil
- 13.7.2 Argentina
- 13.7.3 Colombia
- 13.7.4 Chile
- 13.7.5 Rest of Latin America
- 13.8 Middle East
- 13.8.1 Saudi Arabia
- 13.8.2 United Arab Emirates
- 13.8.3 Turkey
- 13.8.4 Israel
- 13.8.5 Iran
- 13.8.6 Rest of the Middle East
- 13.9 Africa
- 13.9.1 South Africa
- 13.9.2 Egypt
- 13.9.3 Nigeria
- 13.9.4 Morocco
- 13.9.5 Rest of Africa
- 13.10 Regional Investment, Policy and Supply Chain Differences
- 13.11 Regional Competitive Landscape
- 13.12 Geographic Growth Hotspots
Chapter 14 Global Floating Liquefied Natural Gas Technology, Innovation and Sustainability Outlook
- 14.1 Technology Landscape and Maturity
- 14.2 Product, Process and Service Innovation
- 14.3 AI, Automation and Digital Tools in the Industry
- 14.4 Technology Adoption and Performance Benchmarking
- 14.5 Innovation Pipeline and R&D Investment
- 14.6 Patent and Intellectual Property Trends
- 14.7 Energy Efficiency and Resource Management
- 14.8 Sustainability, Recycling and Circularity
- 14.9 Technology Roadmap, 2024-2032
- 14.10 Risks of Obsolescence and Technology Substitution
Chapter 15 Global Floating Liquefied Natural Gas Market Key Strategic Imperatives
- 15.1 Growth and Market Entry Priorities
- 15.2 High-Return Products and Segments
- 15.3 Pricing, Profitability and Cost Optimization
- 15.4 Technology Investment and Product Differentiation
- 15.5 Supply Chain Localization and Resilience
- 15.6 Distribution and Customer Acquisition
- 15.7 Partnership, Acquisition and Capacity Strategy
- 15.8 Regional Expansion Priorities
- 15.9 Short-, Medium- and Long-Term Actions
Chapter 16 Competition Outlook
- 16.1 Industry Competition Characteristics
- 16.2 Market Structure and Concentration
- 16.3 Market Share and Competitive Positioning, 2024
- 16.4 Company-Wise Revenue and Product Benchmarking
- 16.5 Production and Service Capacity Benchmarking
- 16.6 Technology, Pricing and Differentiation
- 16.7 Regional Footprint and Distribution Strength
- 16.8 Mergers, Acquisitions and Strategic Alliances
- 16.9 New Entrants and Competitive Threats
- 16.10 Porter's Five Forces and Industry Attractiveness
- 16.11 Competitive Outlook, 2024-2032
Chapter 17 Company Profiles
- 17.1 Company Coverage and Selection Criteria
- 17.2 Shell plc
- 17.2.1 Business Description
- 17.2.2 Company Ownership and Geographic Presence
- 17.2.3 Product and Service Portfolio
- 17.2.4 Manufacturing and Operating Footprint
- 17.2.5 Production Capacity and Expansion Plans
- 17.2.6 Financial Performance and Investment
- 17.2.7 Market Share and Competitive Position
- 17.2.8 Technology and Innovation Capabilities
- 17.2.9 Strategic Alliances or Partnerships
- 17.2.10 Recent Developments
- 17.2.11 Growth Strategy and Outlook
- 17.3 PETRONAS
- 17.4 Golar LNG Limited
- 17.5 Hoegh LNG
- 17.6 Excelerate Energy, Inc.
- 17.7 Woodside Energy Group Ltd
- 17.8 EXMAR
- 17.9 Eni S.p.A.
- 17.10 Mitsui O.S.K. Lines
- 17.11 ABB Ltd.
- 17.12 Other Relevant Market Participants
Note: Every listed company is profiled on the structure shown under the first company. The company list is preliminary and may change based on research findings, market developments, data availability and client requirements.
Chapter 18 Disclaimer
- 18.1 Research and Forecast Disclaimer
- 18.2 Data Source and Estimation Limitations
Note: The depth of individual sections depends on data availability for this market. Volume, capacity, trade and other unit-based metrics are included where applicable.

