Gas gains ground as crude still anchors Gulf energy value
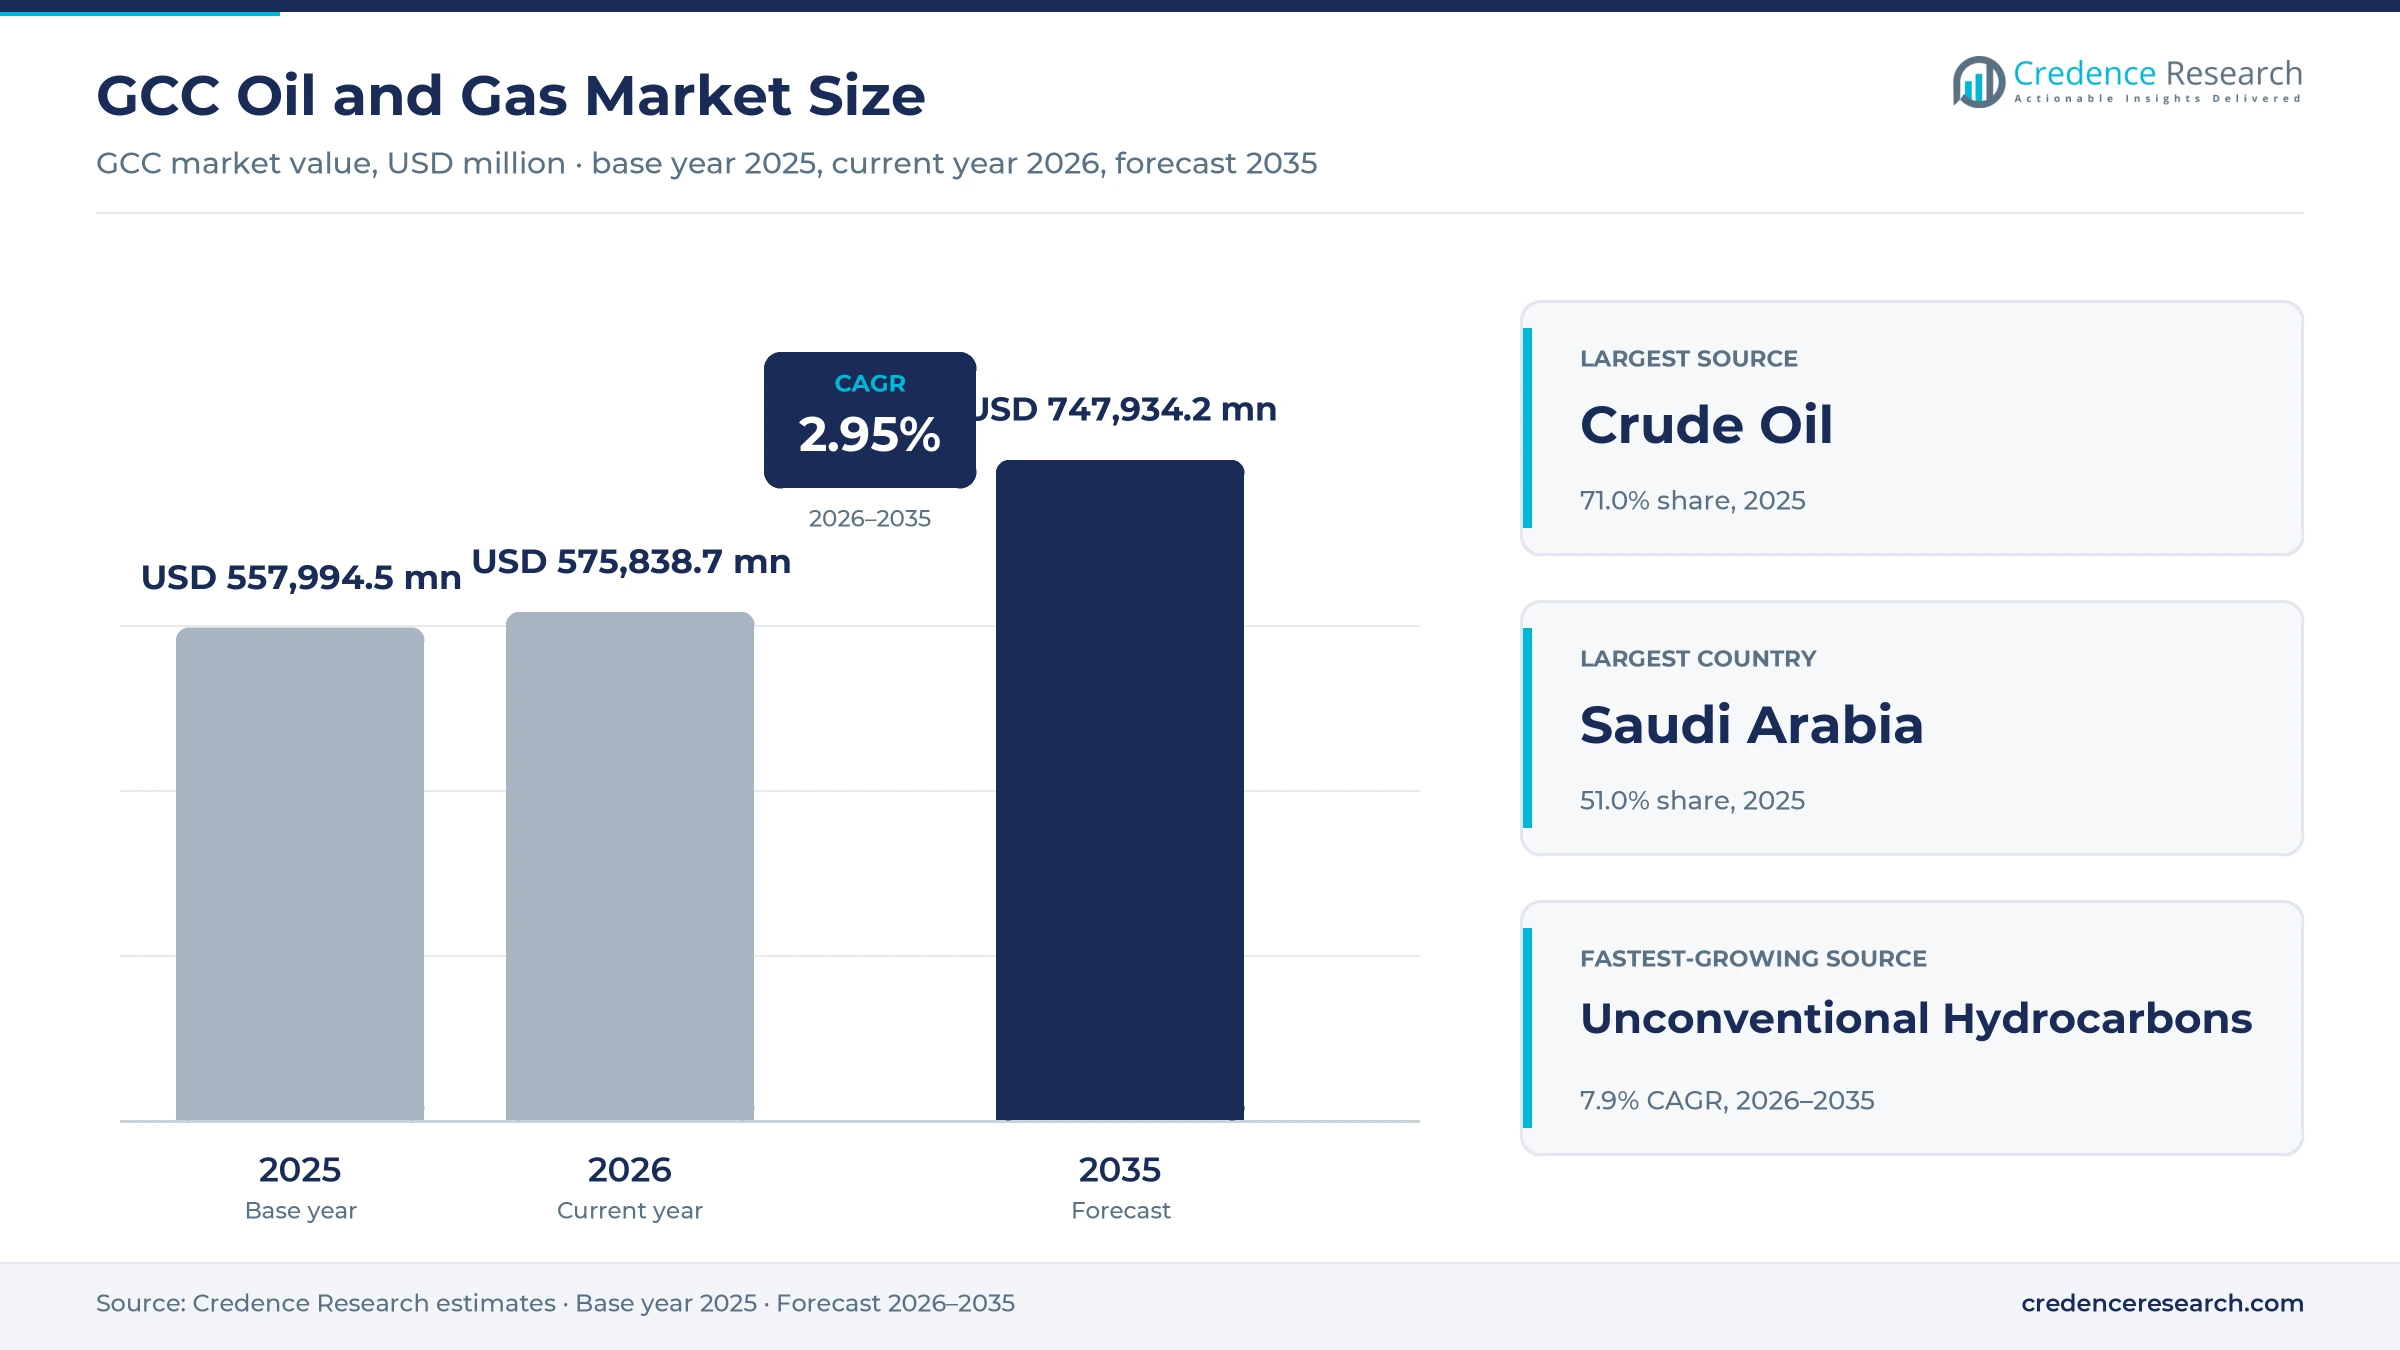
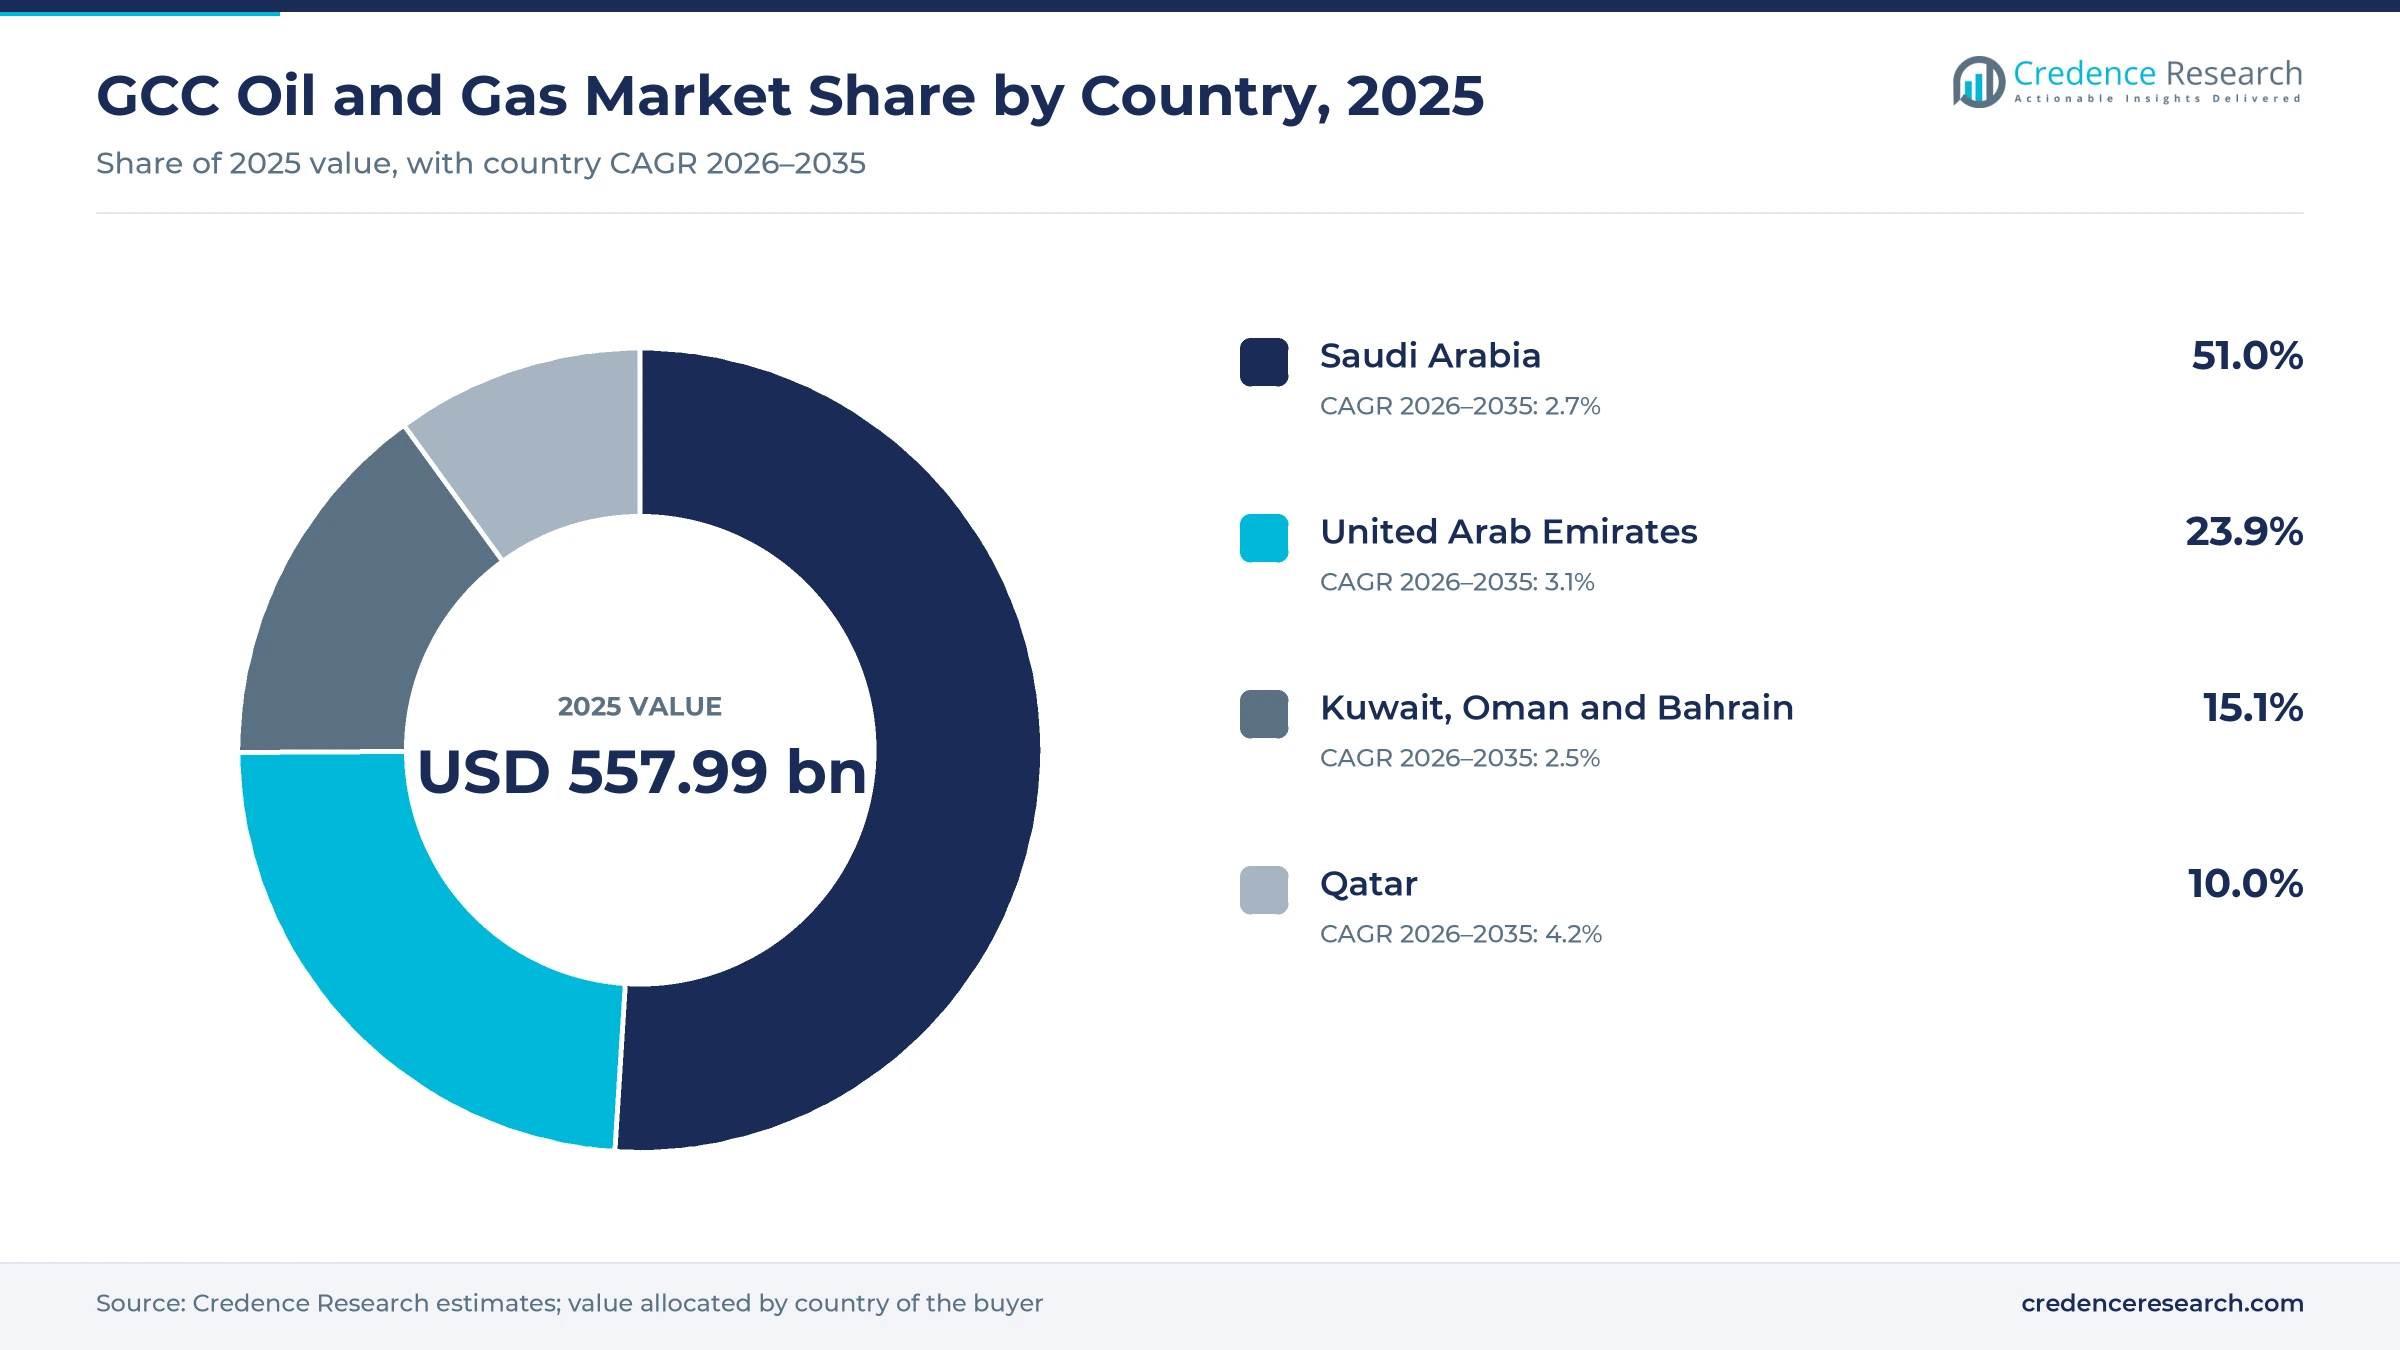
The GCC oil and gas market was valued at USD 557.99 billion in 2025 and is projected to increase from USD 575.84 billion in 2026 to USD 747.93 billion by 2035, registering a CAGR of 2.95% during 2026–2035. Value rests on crude exports from Saudi Arabia, the United Arab Emirates and Kuwait, on Qatari and Omani LNG sold mainly to Asian utilities, and on regulated sales gas that feeds Gulf power plants, refineries and petrochemical complexes. Saudi Arabia held the largest share, 51.0% in 2025, because Aramco combines the region's biggest crude base with a fast-growing sales gas network. Qatar is the fastest-growing country at 4.2% a year as the North Field expansion adds liquefaction trains once war damage at Ras Laffan is repaired. The market also changed sharply in 2026, when the conflict that began on Feb. 28 closed most Strait of Hormuz traffic and the United Arab Emirates left OPEC on May 1.
Export barrels and regulated home gas sales are both counted
The market counts the value of crude oil, natural gas and LNG, condensates and natural gas liquids, and unconventional gas produced in Saudi Arabia, the United Arab Emirates, Qatar, Kuwait, Oman and Bahrain. It includes barrels and cargoes sold abroad and the gas and crude that national companies sell to local power plants, refineries and petrochemical producers. Export sales are valued at realized benchmark-linked prices, while domestic volumes are valued at the regulated prices that governments set.
The estimate excludes refined fuels, petrochemical products, oilfield services revenue and trading margins earned on third-party cargoes. Exploration, field development, production, gas processing and liquefaction all sit inside the chain that produces the counted molecules, so contractors and equipment suppliers matter to the market without being counted in it.
GCC Oil and Gas Market Insights
- The market grows from USD 557.99 billion in 2025 to USD 747.93 billion by 2035, a 2.95% pace led by new LNG trains, Saudi sales gas and steady crude capacity investment.
- Saudi Arabia led with 51.0% of 2025 value, while Qatar grows fastest at 4.2% a year as North Field liquefaction capacity moves toward 142 million tons a year.
- Crude Oil held 71.0% of 2025 value, because GCC crude exports of 11.5 million barrels a day in 2024 still dwarf gas sales by value.
- Iranian strikes on Ras Laffan in March 2026 took 12.8 million tons a year of Qatari LNG capacity offline, about 17% of QatarEnergy export capacity, for three to five years.
- Foreign majors now enter mainly as minority partners, with Shell, BP, Mitsui and TotalEnergies each taking 10% of Ruwais LNG in July 2024 alongside ADNOC's 60% stake.
Crude exports and state operators hold most value
Why does crude dominate, and why is unconventional gas growing fastest?
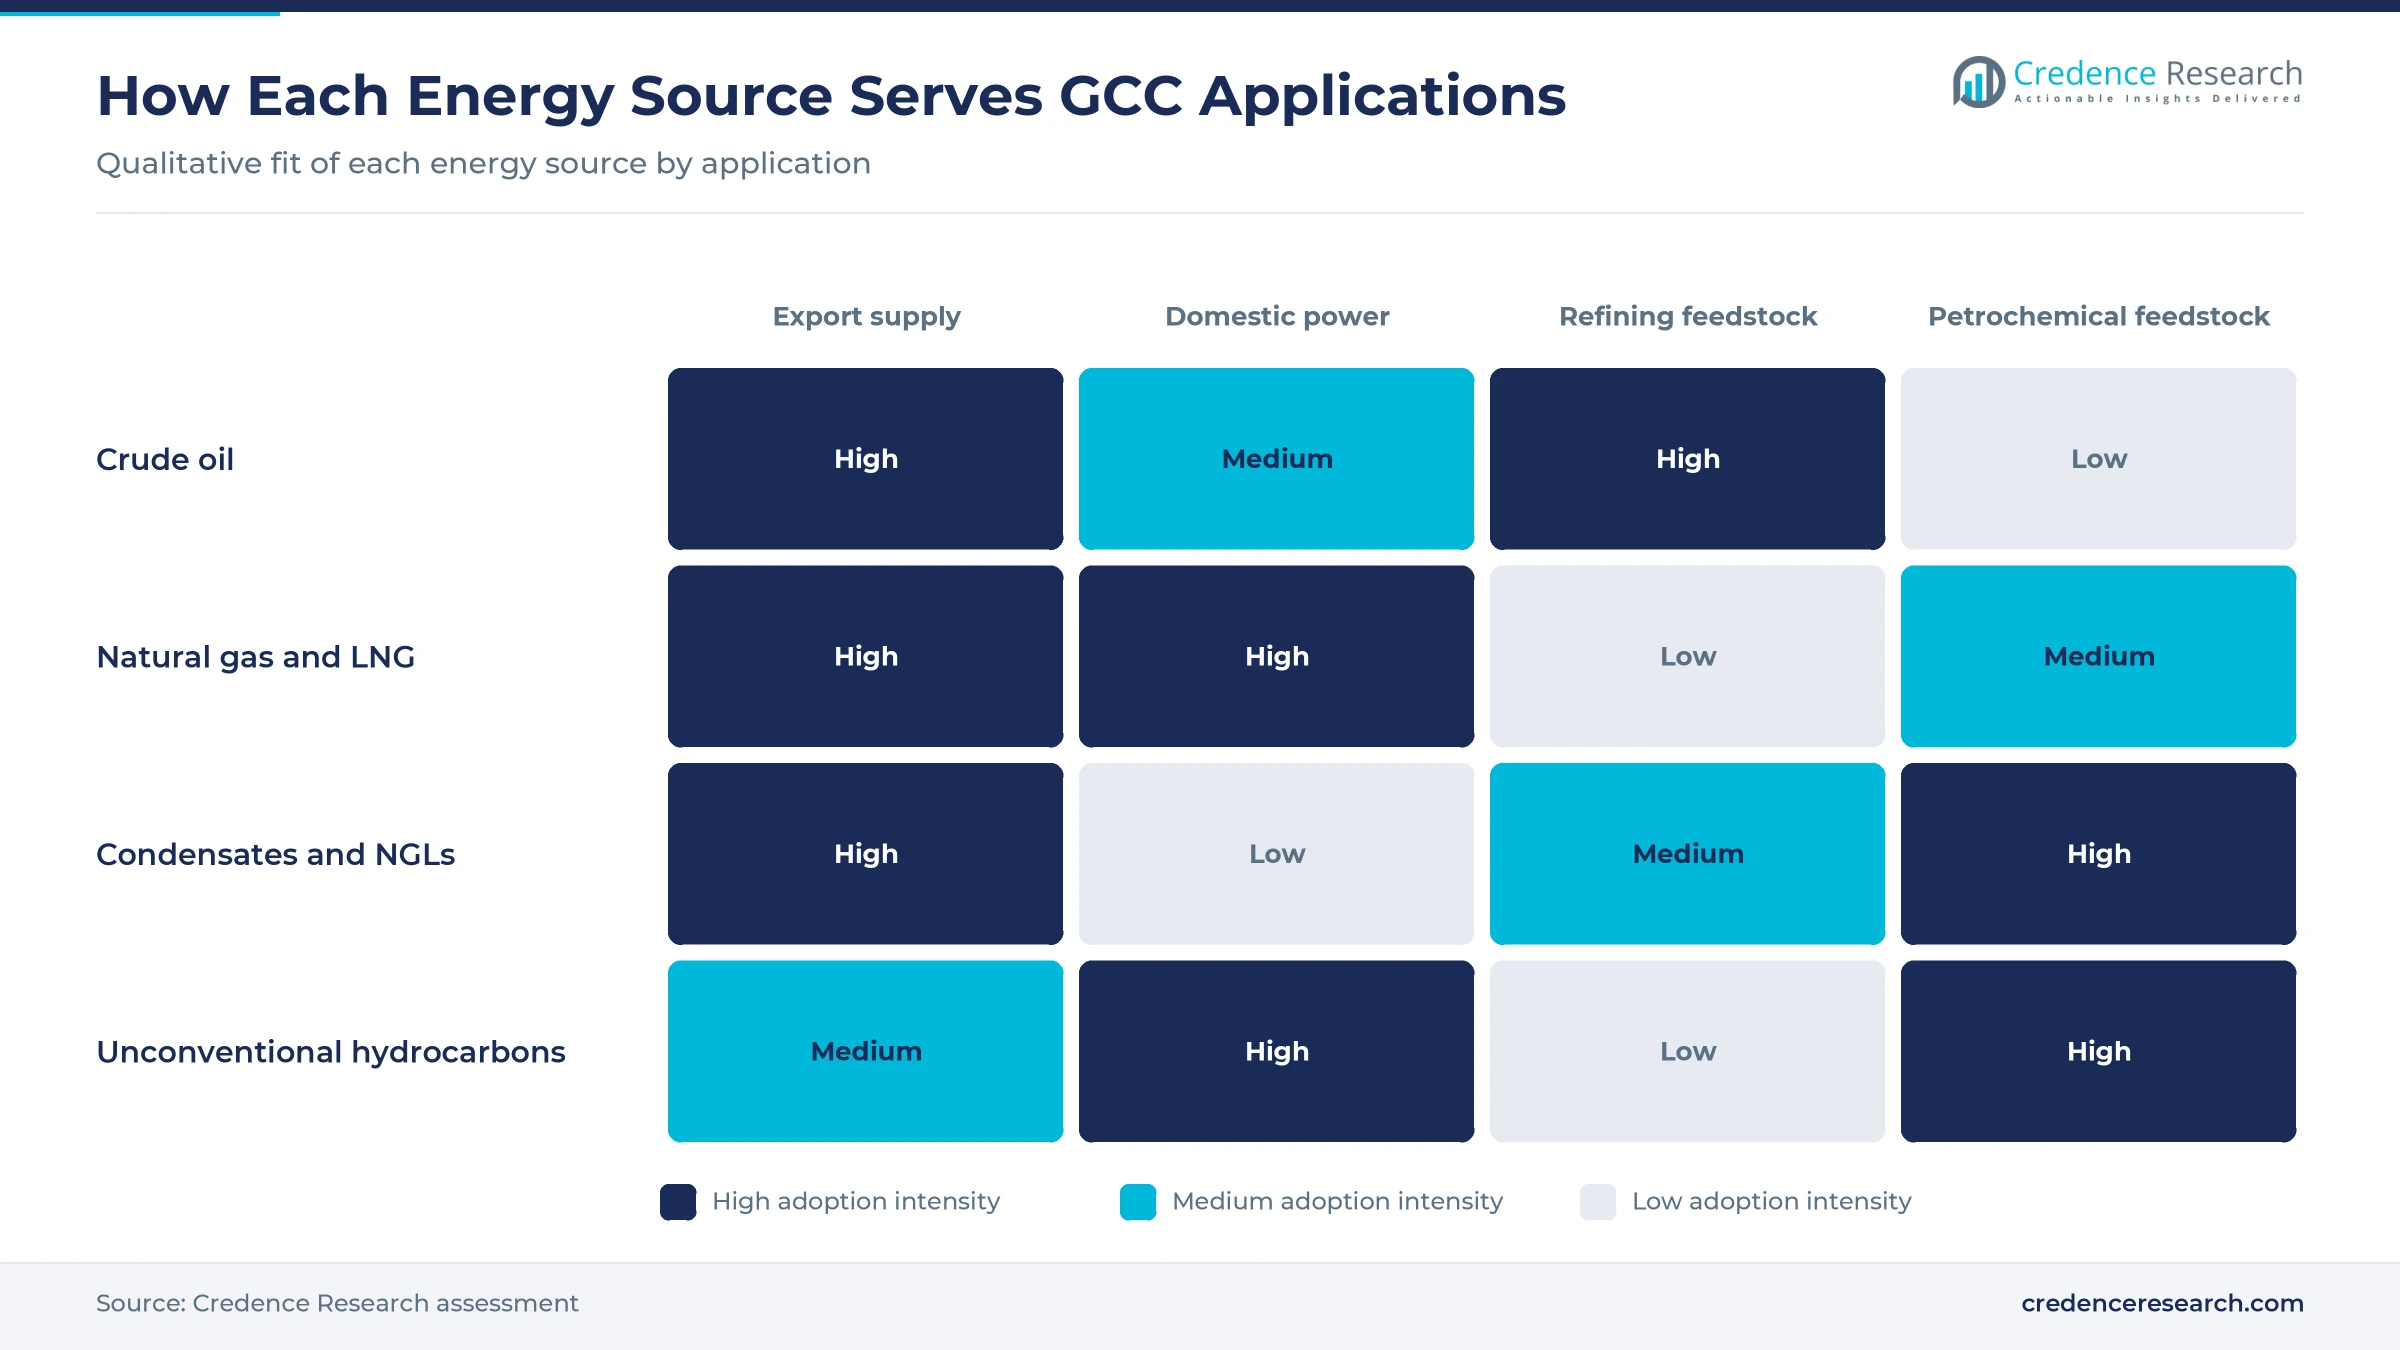
Based on energy source, the market is categorized into crude oil, natural gas and LNG, condensates and NGLs, and unconventional hydrocarbons. Crude Oil led with 71.0% of 2025 value because the region pumped 16.1 million barrels a day of crude in 2024, 21.8% of world output, according to the GCC Statistical Center. Unconventional Hydrocarbons grow fastest at 7.9% a year as Jafurah, which started production in December 2025, holds an estimated 229 trillion cubic feet of raw gas and 75 billion barrels of condensate, Aramco says. Unconventional output therefore shifts value toward liquids-rich gas over the forecast.
Why do exports lead while petrochemical feedstock grows fastest?
Based on application, the market is categorized into export supply, domestic power and utilities, refining feedstock and petrochemical and industrial feedstock. Export Supply led with 62.0% of 2025 value because GCC producers shipped 11.5 million barrels a day of crude abroad in 2024, 26.6% of world crude exports, GCC Statistical Center data show. Petrochemical and Industrial Feedstock grows fastest at 4.3% a year as Jafurah is planned to deliver about 420 million cubic feet a day of ethane by 2030, giving Saudi chemical plants new cracker feedstock supply. Producers that integrate gas processing with chemicals keep more of that value at home.
Which buyers spend the most, and which are adding volume fastest?
Based on end user, the market is categorized into national oil companies, refiners and petrochemical producers, power and utility companies, and LNG and commodity buyers. LNG and Commodity Buyers led with 58.0% of 2025 value because Qatar alone exported 81.5 million tons of LNG in 2025, 18.7% of world trade, according to the International Gas Union. Power and Utility Companies grow fastest at 3.8% a year as Gulf utilities switch from oil to gas, and Kuwait Petroleum Corporation began taking up to 3 million tons a year of Qatari LNG for power in January 2025. Saudi oil burn also fell about 100,000 barrels a day in 2025, MEES reported.
Why do state operators lead, and why are joint ventures growing fastest?
Based on ownership model, the market is categorized into state-owned operations, concession partnerships, joint ventures and international operator-led assets. State-Owned Operations led with 57.0% of 2025 value because national companies run most fields directly, and Kuwait Oil Company alone accounts for about 90% of Kuwaiti crude output, AGBI reported. Joint Ventures grow fastest at 4.4% a year as new LNG capacity is built with partners, and Shell, BP, Mitsui and TotalEnergies each took 10% of Ruwais LNG in July 2024, with ADNOC keeping 60%. Partner equity spreads construction risk while the state keeps control of the resource.
| Segment Group | Leading Sub-segment | Share, 2025 | Fastest-growing Sub-segment | CAGR, 2026–2035 |
|---|---|---|---|---|
| By Energy Source | Crude Oil | 71.0% | Unconventional Hydrocarbons | 7.9% |
| By Application | Export Supply | 62.0% | Petrochemical and Industrial Feedstock | 4.3% |
| By End User | LNG and Commodity Buyers | 58.0% | Power and Utility Companies | 3.8% |
| By Ownership Model | State-Owned Operations | 57.0% | Joint Ventures | 4.4% |
Benchmarks set export prices while Gulf states fix gas rates
Pricing in the GCC market runs on two separate tracks. Crude and most condensate exports are sold at official selling prices set each month against benchmarks, so Brent and Dubai movements pass straight into producer value. Long-term LNG contracts are mostly linked to oil, while spot cargoes follow Asian gas prices that nearly tripled from prewar levels by late September 2026. Domestic sales gas, by contrast, is priced by governments well below export parity, as the Saudi methane and ethane rates in the table show. The gap between these tracks makes every molecule displaced from local power plants worth several times more when it is exported.
| Product or benchmark | Typical price or fee | Basis |
|---|---|---|
| Brent crude benchmark, 2025 average | USD 69 per barrel | U.S. Energy Information Administration, January 2026 |
| Brent crude forecast, 2026 average | USD 91 per barrel | World Bank Commodity Markets Outlook, October 2026 |
| Asian spot LNG (JKM), 2025 average | USD 12.16 per MMBtu | International Gas Union World LNG Report 2026 |
| Saudi regulated methane | USD 2.15 per MMBtu from Jan. 1, 2025 | Aramco price change reported by S&P Global, January 2025 |
| Saudi regulated ethane feedstock | USD 3.00 per MMBtu from Jan. 1, 2025 | Aramco price change reported by S&P Global, January 2025 |
Request a Free Sample
Fill in your details and we'll send you a free sample report.
- Sample data tables & charts
- Research methodology
LNG trains, upstream capital and Asian buyers drive growth
LNG trains and sales gas growth lift gas value
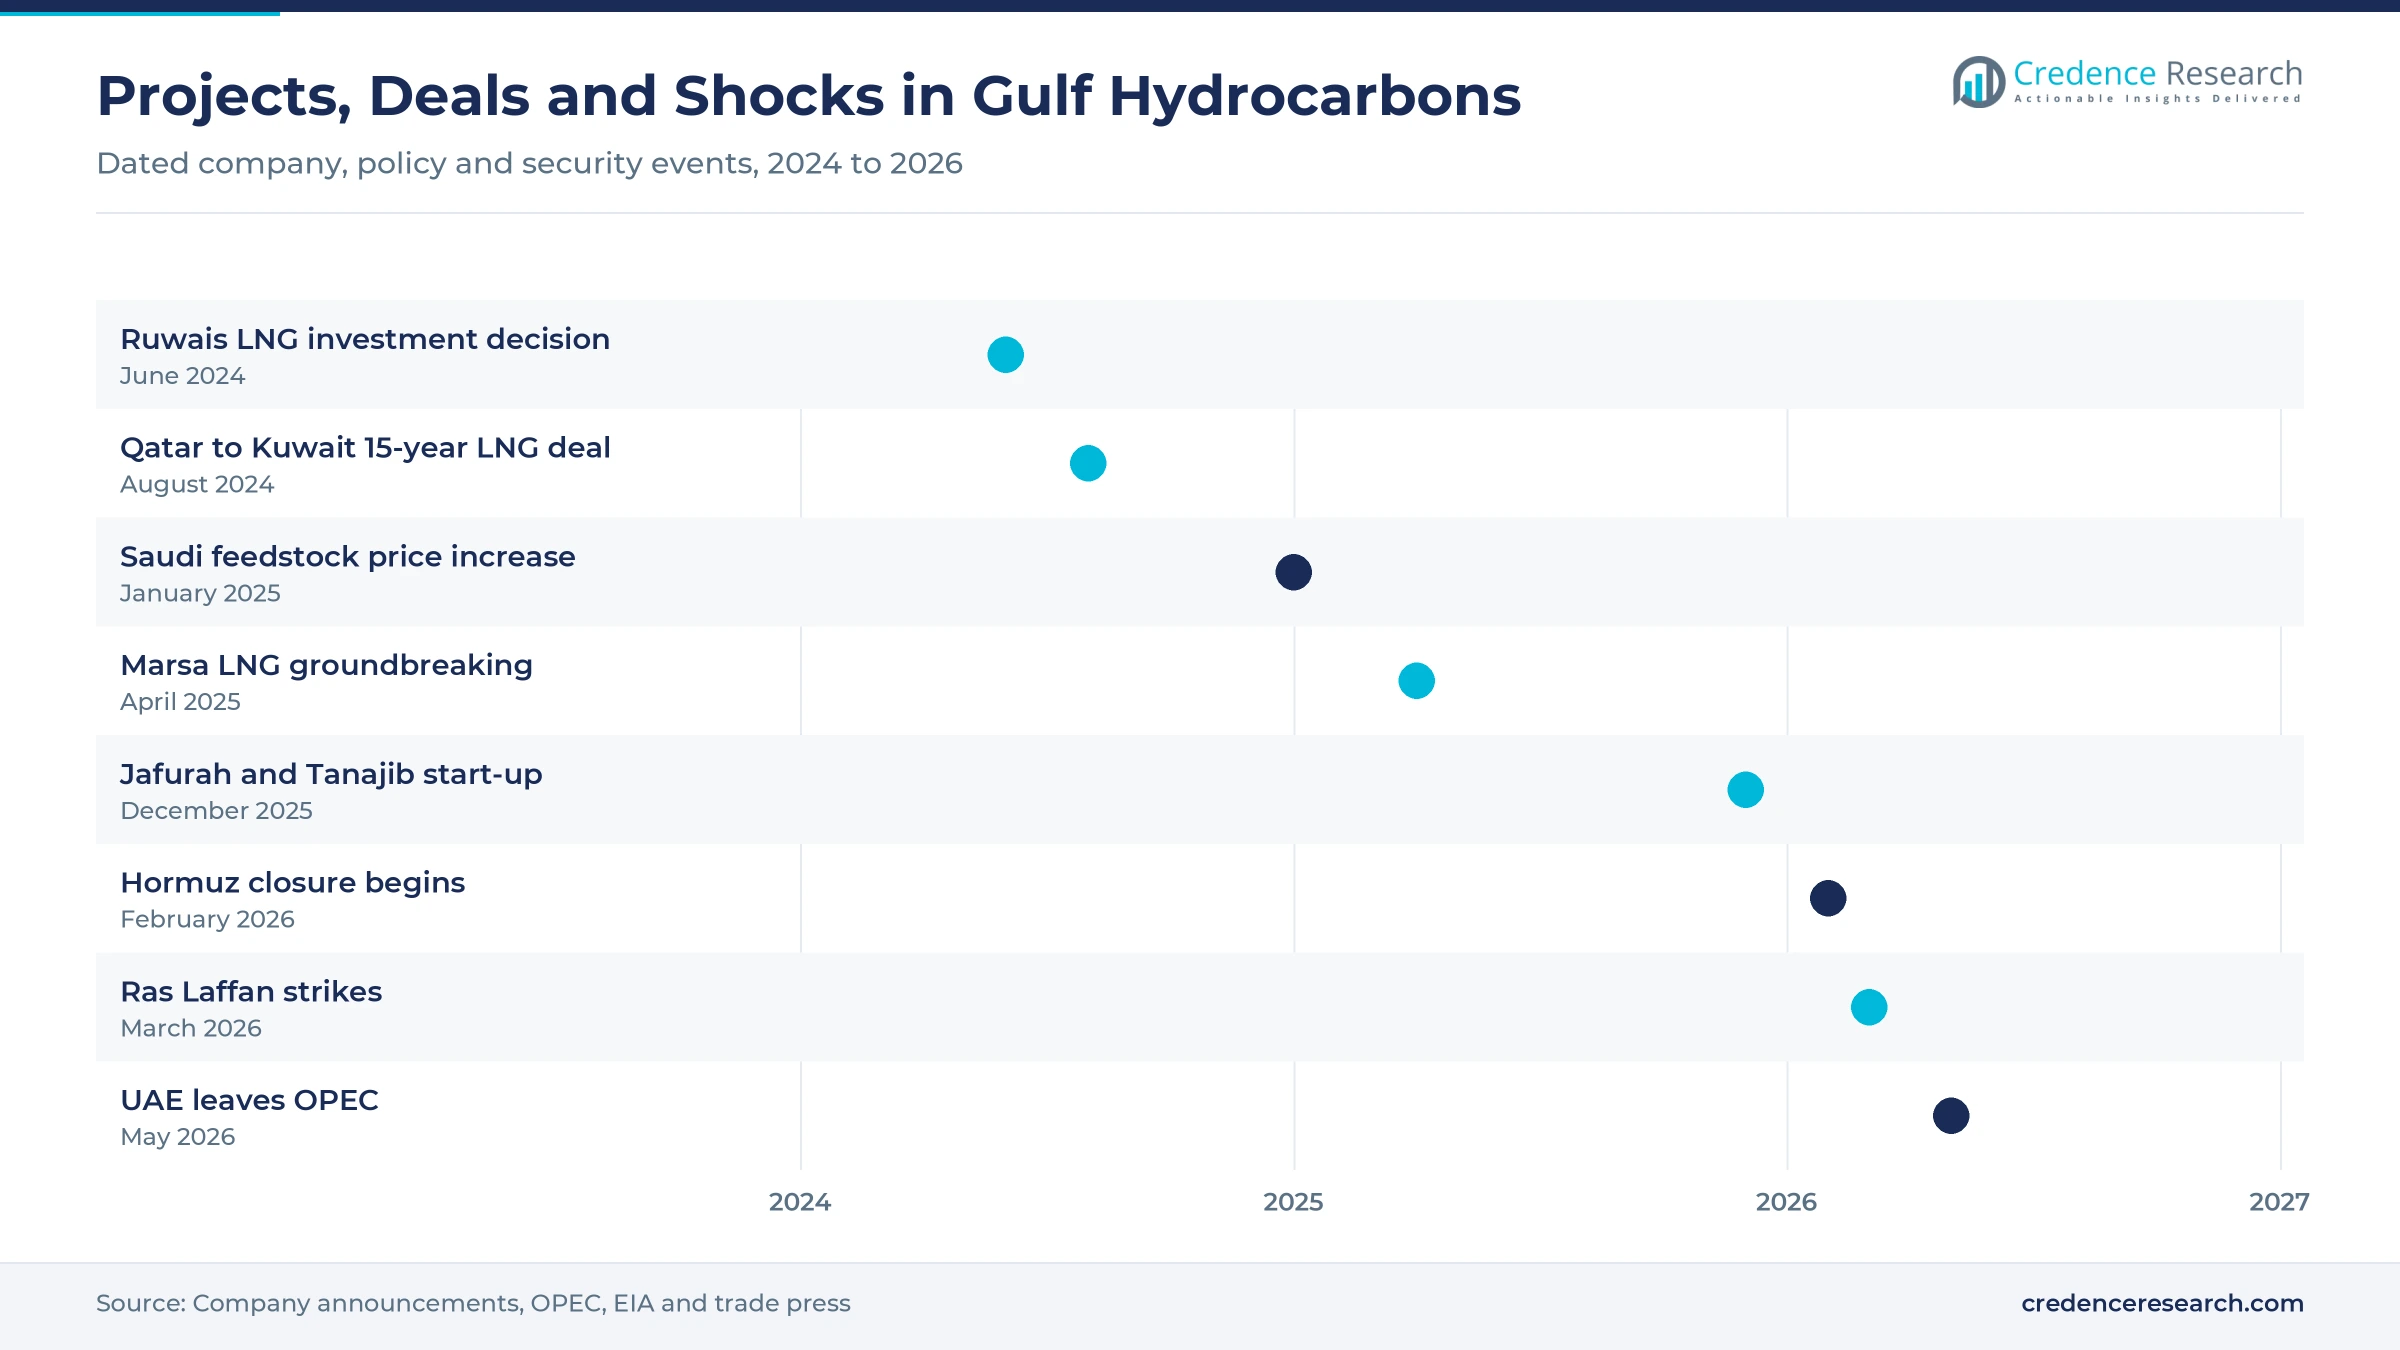
Gas is the fastest-growing source of new value because every large GCC producer is adding processing or liquefaction capacity at the same time. Aramco said in February 2026 that it aims to raise sales gas production capacity by about 80% by 2030 versus 2021, and its Tanajib plant is expected to reach 2.6 billion cubic feet a day of raw gas processing in 2026. ADNOC's two-train Ruwais LNG project, approved in June 2024, will roughly double UAE liquefaction capacity to about 15 million tons a year, The National reported. Oman exported 11.9 million tons of LNG in 2025, above its nameplate capacity, the Oman Observer reported. These additions explain why natural gas and LNG gain share from crude over the decade.
Upstream capacity programs keep capital flowing to fields
Capacity spending continues because producers want spare barrels and new gas ready when export routes and demand allow. Kuwait Petroleum Corporation plans to lift capacity from about 2.9 million barrels a day to 4 million barrels a day by 2035, AGBI reported. ADNOC secured up to USD 11 billion of financing from 20 banks in December 2025 for Hail and Ghasha, an offshore development designed for up to 1.8 billion cubic feet of gas a day, according to The National. Aramco started production at the Zuluf crude increment, the company said in its November 2026 results. This steady pipeline of mega projects keeps demand high for drilling, processing and construction work across the region.
Asian buyers anchor long-term export demand
Asian demand anchors GCC export value because buyers in the region sign long contracts that underwrite new trains. Qatar supplies nearly a third of China's LNG imports and is a major supplier to India, AGBI reported in July 2026. ADNOC said in November 2025 that it had contracted more than 8 million tons a year of Ruwais LNG's 9.6 million-ton capacity after a 15-year deal with Shell. In October 2026, ADNOC added a supply agreement of about 2 million tons with Thailand's Gulf group starting in 2027, Enterprise reported. These contracts tie Gulf producers more tightly to Asia-bound LNG trade, which is why these buyers form the largest end-user group.
Hormuz bypass pipelines protect export revenue
Export resilience has become a driver of investment because the 2026 Hormuz closure showed the value of routes that avoid the strait. Saudi Arabia's East-West pipeline reached its full 7 million barrels a day on March 28, 2026, Al Arabiya reported, with about 5 million barrels a day exported through Yanbu on the Red Sea. ADNOC said in May 2026 that it would accelerate a second line to Fujairah, doubling its bypass export capacity by 2027, The National reported. Non-Iranian Middle East oil flows rose above 24.5 million barrels a day in the week to Oct. 18, 2026, back over prewar levels, according to ship-tracking data cited by the same paper. Producers with bypass routes keep selling while rivals without them wait for the strait to reopen.
Gas price reform and overseas LNG deals reshape supply
Shift toward higher regulated gas and feedstock prices
Gulf governments are slowly raising regulated gas prices to fund new supply and reduce waste. Aramco lifted its methane price from USD 1.75 to USD 2.15 per MMBtu and its ethane price from USD 2.50 to USD 3.00 per MMBtu on Jan. 1, 2025, S&P Global reported. That was the second increase in two years, after a 2024 move ended a freeze that had lasted since 2016. Higher domestic prices narrow the gap with export value, which makes costly unconventional gas easier to justify, and Aramco plans to bring Jafurah to about 2 billion cubic feet a day of sales gas by 2030. Petrochemical producers will see their feedstock advantage narrow but not disappear.
Rise of Gulf buyers in overseas LNG portfolios
Gulf national companies are building portfolios of foreign LNG to protect customers from regional disruption. QatarEnergy signed a long-term deal for up to 3 million tons a year from Woodside's Louisiana LNG, adding to a 4 million-ton Cheniere contract agreed about a week earlier, The National reported on Oct. 29, 2026. ADNOC took an 11.7% stake in phase one of NextDecade's Rio Grande LNG in Texas in June 2024. Aramco aims to market 20 million tons a year of LNG globally and has signed a 1 million-ton offtake from Commonwealth LNG in Louisiana, Enterprise reported in October 2026. These moves turn Gulf producers into portfolio traders as well as sellers of their own molecules.
Opening in LNG bunkering and low-carbon cargoes
Low-carbon LNG and marine fuel supply offer a premium outlet for new Gulf capacity. TotalEnergies and OQ Exploration and Production broke ground in April 2025 on Marsa LNG at Sohar, a 1 million-ton-a-year plant paired with a 300 megawatt solar farm, with production due in the first quarter of 2028, TotalEnergies said. The plant targets LNG bunkering demand from ships calling in the Gulf of Oman. ADNOC says Ruwais LNG will be the first LNG export plant in the Middle East and North Africa to run on clean power, The National reported in June 2024. Buyers that track cargo emissions may pay more for such supply.
Opening in gas processing and pipeline capital
Midstream gas assets are opening to outside capital, which creates entry points for investors and contractors. Aramco's Phase III Master Gas System expansion, worth USD 8.8 billion, adds 3.1 billion cubic feet a day of transmission capacity by 2028, Enterprise reported in October 2026. A consortium led by Global Infrastructure Partners took 49% of an Aramco gas midstream lease structure in a USD 11 billion deal closed in 2025. A Hyundai-led consortium is building Jafurah phase two under a USD 2.3 billion award. Investors gain long, fee-based cash flows, while contractors gain a decade of compression, pipeline and processing work as gas volumes rise.
Hormuz closure and Ras Laffan damage test Gulf supply
How long can the Hormuz disruption cut Gulf exports?
The Strait of Hormuz closure after the conflict began on Feb. 28, 2026, is the largest supply shock the market has faced. Gulf oil exports averaged about 13 million barrels a day in August, nearly half their prewar level, the IEA said in September, and it expected full recovery only in 2027, although flows topped prewar levels by mid-October. Value holds up despite lower 2026 volume, because the World Bank expects Brent about a third above its 2025 average and bypass exports keep flowing. Kuwait and Qatar, which lack bypass pipelines, carry the heaviest losses.
What does the Ras Laffan damage mean for Qatari supply?
Missile strikes on March 18 and 19, 2026, damaged Trains 4 and 6 at Ras Laffan, removing 12.8 million tons a year of LNG capacity, about 17% of QatarEnergy's export capacity. QatarEnergy expects repairs to the two trains to take three to five years. It has extended force majeure on many cargoes to the end of December 2026, The National reported, and Bangladesh's Petrobangla said it is buying spot cargoes at a significant cost. Buyers forced into costly spot purchases may diversify away from Qatar in new contracts.
Why does price volatility complicate investment plans?
Prices swung from glut to shortage within a year, which makes project budgets hard to fix. Brent averaged USD 69 a barrel in 2025, its lowest since 2020, according to the U.S. Energy Information Administration. OPEC+ had agreed on Aug. 3, 2025, to raise quotas by 547,000 barrels a day for September, adding supply into that weak market. The World Bank now expects USD 91 in 2026 and USD 79 in 2027 as Gulf supply returns. This pressure forces producers to plan capacity for both high and low price paths.
Can domestic gas supply keep pace with local demand?
Domestic gas demand is rising faster than new supply in the smaller GCC states, which forces costly imports. Kuwait, which imports LNG through its Al-Zour terminal, does not expect the offshore Durra gas field shared with Saudi Arabia to be fully commissioned until 2029, AGBI reported. Bapco Energies said in September 2025 that it planned to buy more LNG in 2026 than in 2025, Hydrocarbon Processing reported. Imports at oil-linked prices raise power costs where tariffs remain regulated.
Saudi Arabia leads while Qatar rebounds fastest
| Country | Value, 2025 (USD billion) | Share, 2025 | CAGR, 2026–2035 |
|---|---|---|---|
| Saudi Arabia | 284.58 | 51.0% | 2.7% |
| United Arab Emirates | 133.36 | 23.9% | 3.1% |
| Kuwait, Oman and Bahrain | 84.26 | 15.1% | 2.5% |
| Qatar | 55.80 | 10.0% | 4.2% |
Saudi Arabia leads on crude scale and spare capacity
Saudi Arabia held 51.0% of 2025 value and grows at 2.7% a year. The kingdom produced about 9.3 million barrels a day of crude in 2025 against an estimated 11.6 million barrels a day of effective capacity, according to the U.S. Energy Information Administration. Growth now depends more on sales gas from Jafurah and Tanajib than on extra crude, because the gas program also frees oil for export. Saudi gas demand for power is set to rise more than 40% by 2030, according to IEA analysis cited by Enterprise.
The United Arab Emirates pairs spare oil with new LNG
The United Arab Emirates held 23.9% of 2025 value and grows at 3.1% a year. The country produced 3.4 million barrels a day in 2025 from about 4.2 million barrels a day of effective capacity, the third-largest in OPEC before its exit took effect on May 1, 2026. Leaving the group frees ADNOC to use that spare capacity once shipping normalizes. Ruwais LNG from late 2028 and Hail and Ghasha gas toward the end of the decade lift the country slightly above the regional growth rate.
Qatar grows fastest from a war-damaged base
Qatar held 10.0% of 2025 value and grows fastest at 4.2% a year from a depressed 2026 base. Ras Laffan had about 77 million tons a year of capacity before the war, and QatarEnergy plans to reach 142 million tons a year by 2030 through the North Field expansion. Exports were only 1.6 million tons in September 2026, under a quarter of the prewar average, the Oman Observer reported, and the IMF expects GDP to contract 8.6% in 2026. Recovery from this low point, rather than new demand alone, drives the fastest growth.
Kuwait, Oman and Bahrain balance crude with rising gas
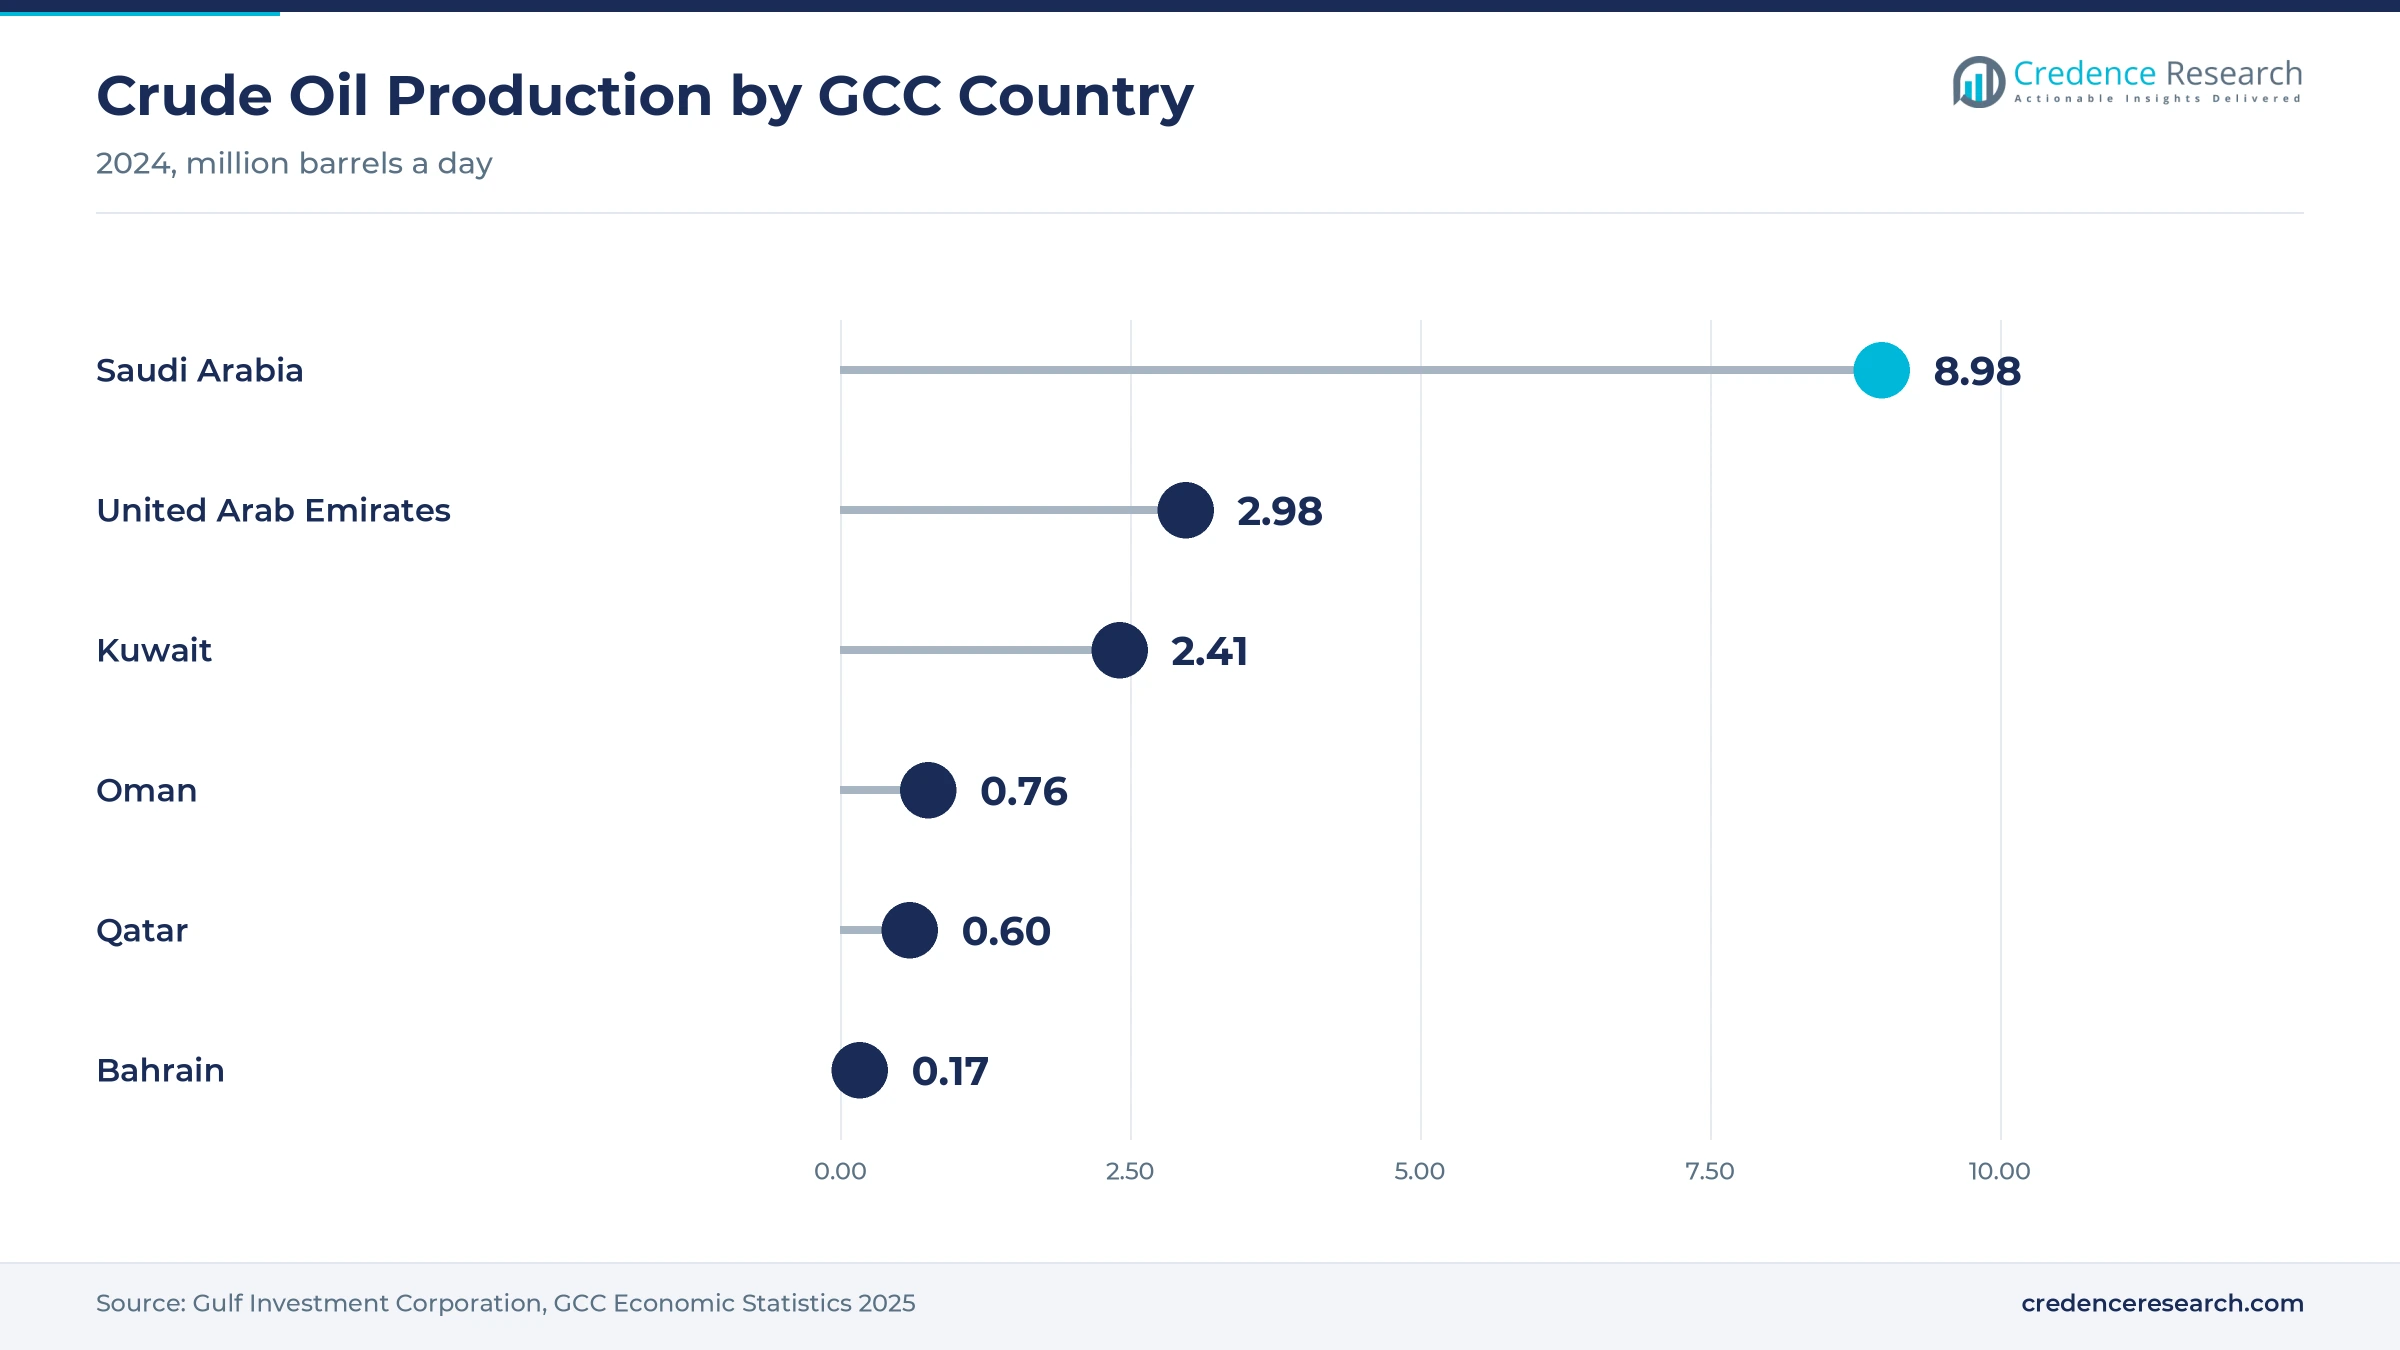
Kuwait, Oman and Bahrain held 15.1% of 2025 value and grow at 2.5% a year. Kuwait produced 2.41 million barrels a day of crude in 2024, Oman 0.76 million and Bahrain 0.17 million, Gulf Investment Corporation data show. Oman is the bright spot in the region, since its gas output hit a record 6.12 billion cubic feet a day in June 2026, MEES reported. Bahrain's Sitra refinery expansion to almost 400,000 barrels a day gives the kingdom a larger local outlet for crude.
LNG approvals, gas startups and war responses since 2024
| Development | Status and market relevance |
|---|---|
| In June 2024, ADNOC took a final investment decision on the Ruwais LNG project and awarded its construction contract to a Technip Energies, JGC and NMDC Energy venture. | Under construction; operations targeted for the fourth quarter of 2028 |
| In April 2025, TotalEnergies and OQ Exploration and Production broke ground on Marsa LNG at the Port of Sohar in Oman. | Under construction; first LNG due in early 2028 |
| In December 2025, Aramco started production at the Jafurah unconventional gas field and the Tanajib gas plant. | Ramping up toward 2030 targets |
| In December 2025, ADNOC secured structured financing for the Hail and Ghasha offshore gas development. | Financed; output planned by the end of the decade |
| In October 2026, QatarEnergy signed long-term purchase deals for U.S. LNG from Woodside and Cheniere as force majeure continued. | Signed; Woodside deliveries expected from 2030 |
Shale gas, liquefaction and bypass routes shape supply
- Unconventional drilling and completion brings tight and shale gas such as Jafurah into production, which adds liquids-rich gas that conventional fields cannot supply.
- Associated gas processing captures gas from offshore oil fields, as the Tanajib plant does for Marjan and Zuluf, instead of flaring or reinjecting it.
- Large-scale liquefaction trains convert North Field and Abu Dhabi gas into LNG cargoes, with clean grid power at Ruwais lowering emissions per ton.
- Bypass export pipelines move crude to the Red Sea and the Gulf of Oman, which kept Saudi and Emirati barrels flowing during the 2026 closure.
Need a Custom Version of This Report?
Tailor the scope, geography, or segments to your exact requirements.
- Custom geography or segment scope
- Direct access to our analyst team
State champions control reserves as majors take stakes
Competition in the GCC oil and gas market turns less on price than on access to reserves, export routes and long-term buyers. Saudi Aramco competes on scale and spare capacity, while ADNOC pairs crude growth with a fast-expanding LNG and gas portfolio. QatarEnergy holds the deepest LNG customer book but must rebuild trust after months of force majeure. Kuwait Petroleum Corporation focuses on raising crude capacity and securing gas for power. OQ and Bapco Energies are smaller integrated groups that rely on partners for capital and technology. ExxonMobil, Shell, BP, TotalEnergies and Eni compete with each other for minority stakes and offtake, and Shell holds 25% of a joint venture with QatarEnergy that owns 25% of North Field East, JPT reported in July 2022. Partners that bring buyers, capital and low-carbon technology win the best positions in new projects.
Who controls supply, and where do margins sit?
Supply is concentrated in six state champions that own reserves, set output and sell most barrels directly. Aramco, ADNOC, QatarEnergy, Kuwait Petroleum Corporation, OQ and Bapco Energies control licensing, so foreign companies enter as concession partners, joint venture shareholders or, in rare cases, operators such as BP at Oman's Block 61, which produced about 547.5 billion cubic feet of gas in 2025. Entry barriers are high because projects need state approval, export capacity and multibillion-dollar budgets. Margins sit mostly with resource owners, while engineering contractors and cryogenic tank suppliers compete for project work on thinner margins.
Which companies shape GCC oil and gas supply?
| Company | Type | Role in the market |
|---|---|---|
| Saudi Aramco | National oil company | Saudi crude, sales gas and Jafurah unconventional gas production |
| ADNOC | National oil company | Abu Dhabi crude, Hail and Ghasha gas and Ruwais LNG as 60% owner |
| QatarEnergy | National energy company | North Field gas and LNG exports from Ras Laffan |
| Kuwait Petroleum Corporation | National oil company | Kuwaiti crude through Kuwait Oil Company and LNG imports at Al-Zour |
| OQ | National energy group | Omani upstream partner, 30% of Block 61 and 20% of Marsa LNG |
| Petroleum Development Oman | National oil company | Operator of Oman's Block 6, the source of most Omani crude and gas |
| Bapco Energies | National energy company | Bahraini upstream production and the expanded Sitra refinery |
| ExxonMobil | International partner | Equity partner in the North Field East LNG expansion in Qatar |
| Shell | International partner | North Field East joint venture, 10% of Ruwais LNG and Ruwais offtake |
| BP | International operator | Operator of Oman's Block 61 Khazzan and Ghazeer gas and 10% of Ruwais LNG |
| TotalEnergies | International partner | 80% owner of Marsa LNG and 10% of Ruwais LNG |
| Eni | International partner | Hail and Ghasha partner in Abu Dhabi and North Field East partner |
Reliable export routes will decide Gulf pricing power
Credence Research's view is that the GCC market will be judged over the next decade on reliability as much as on volume. The 2026 conflict showed that reserves matter less when export routes are blocked, so producers with Red Sea and Gulf of Oman outlets will keep a premium with buyers. Gas will supply most of the incremental value, because new LNG trains and domestic sales gas grow faster than crude output. Planned North Field and Ruwais trains add about 75 million tons a year of LNG capacity by 2030, tying regional supply closer to Asian demand. Qatar should rebound fastest once Ras Laffan is repaired, but buyers will demand stronger supply guarantees in new contracts.
Output volumes and benchmark prices support the estimate
The report uses 2025 as the base year and forecasts values to 2035. Market values come from the Credence Research model, and country, energy source, application, end user and ownership splits are Credence Research estimates. The size was cross-checked against crude, condensate and NGL output multiplied by 2025 benchmark prices, LNG export volumes at contract and spot prices, and domestic gas sales at regulated prices. Evidence comes from GCC statistical agencies, international energy agencies, company announcements and filings, and trade and financial press. No interviews or surveys were conducted for the preparation of this report.
Gas and LNG carry most growth through 2035
GCC oil and gas value should reach USD 747.93 billion by 2035, up from USD 575.84 billion in 2026, as gas and LNG take a larger share of producer income. The North Field expansion, Ruwais LNG and Saudi unconventional gas should carry most of the gain, while crude volumes grow slowly. Unconventional Hydrocarbons should expand at 7.9% a year from a small base. The main risk is a lasting security premium on Gulf shipping, which would favor producers with bypass routes and push buyers toward American and African supply.
What separates the weak, base and strong paths to 2035?
The range of outcomes depends mostly on how fast Gulf shipping normalizes and how quickly new gas capacity arrives. A downside path follows if Hormuz disruption and tanker attacks run deep into 2027 and Ras Laffan repairs take the full five years. The base case assumes exports recover through 2027 and LNG projects start roughly on schedule. An upside path needs the North Field expansion, Ruwais LNG and Jafurah to reach plateau on time while Asian demand absorbs the added cargoes.
| Scenario | CAGR, 2026–2035 | Value, 2035 | What has to hold |
|---|---|---|---|
| Downside | 1.4% | USD 649.70 billion | Hormuz disruption runs deep into 2027 and Ras Laffan repairs take the full five years |
| Base | 2.95% | USD 747.93 billion | Gulf exports recover through 2027 and LNG projects start roughly on schedule |
| Upside | 4.2% | USD 830.30 billion | North Field, Ruwais LNG and Jafurah reach plateau on time and Asian demand absorbs the cargoes |
Frequently Asked Questions
How big is the GCC oil and gas market?
Which country leads the GCC oil and gas market?
Which country grows fastest?
Which energy source holds the largest share?
How did the 2026 conflict affect Gulf supply?
How are GCC gas prices set?
Which pipelines bypass the Strait of Hormuz?
Which companies are active in the market?
Table of Content
Chapter 1 Market Segmentation
- 1.1 Segmentation Framework
- 1.1.1 Product and Service Classification
- 1.1.2 Application and End-Use Classification
- 1.1.3 Technology and Solution Classification
- 1.1.4 Customer and Distribution Channel Classification
- 1.1.5 Geographic Segmentation
- 1.1.6 Market Segment Definitions and Boundaries
- 1.2 By Energy Source
- 1.2.1 Crude Oil
- 1.2.2 Natural Gas and LNG
- 1.2.3 Condensates and NGLs
- 1.2.4 Unconventional Hydrocarbons
- 1.3 By Application
- 1.3.1 Export Supply
- 1.3.2 Domestic Power and Utilities
- 1.3.3 Refining Feedstock
- 1.3.4 Petrochemical and Industrial Feedstock
- 1.4 By End User
- 1.4.1 National Oil Companies
- 1.4.2 Refiners and Petrochemical Producers
- 1.4.3 Power and Utility Companies
- 1.4.4 LNG and Commodity Buyers
- 1.5 By Ownership Model
- 1.5.1 State-Owned Operations
- 1.5.2 Concession Partnerships
- 1.5.3 Joint Ventures
- 1.5.4 International Operator-Led Assets
- 1.6 By Country
- 1.6.1 Saudi Arabia
- 1.6.2 United Arab Emirates
- 1.6.3 Qatar
- 1.6.4 Kuwait, Oman and Bahrain
Chapter 2 Introduction
- 2.1 Report Objectives and Scope
- 2.2 Product Definition and Industry Terminology
- 2.3 Market Inclusions and Exclusions
- 2.4 Research Process
- 2.4.1 Primary Research and Expert Interviews
- 2.4.2 Secondary Research and Source Review
- 2.4.3 Top-Down and Bottom-Up Estimation
- 2.4.4 Data Triangulation and Verification
- 2.5 Market Size Measurement Basis
- 2.5.1 2025: USD 557.99 billion → 2035: USD 747.93 billion
- 2.6 Historical and Forecast Reference Periods
- 2.6.1 Historical Period: 2018-2025
- 2.6.2 Base Year: 2025
- 2.6.3 Forecast Period: 2025-2035
- 2.7 Research Assumptions and Limitations
Chapter 3 Executive Summary
- 3.1 Market Snapshot and Key Findings
- 3.2 Base-Year Market Size, 2025
- 3.3 Forecast Market Size, 2035
- 3.4 Revenue and Volume Growth Outlook
- 3.5 Key Demand and Supply Indicators
- 3.6 Leading Market Segments
- 3.7 Fastest-Growing Market Opportunities
- 3.8 Regional Performance Highlights
- 3.9 Technology and Industry Transformation
- 3.10 Competitive Landscape Summary
- 3.11 Analyst View and Strategic Implications
Chapter 4 GCC Oil and Gas Market Trends and Developments
- 4.1 Historical Industry Development, 2018-2025
- 4.2 Recent Market Trends and Developments
- 4.3 Demand and Customer Behavior Trends
- 4.4 Technology and Product Innovation
- 4.5 Artificial Intelligence, Automation and Digitalization
- 4.6 Local Manufacturing and Supply Chain Realignment
- 4.7 Industry Partnerships, Mergers and Acquisitions
- 4.8 Sustainability and Circular Economy Developments
- 4.9 Government and Private Sector Investment Trends
- 4.10 Emerging Business Models and Commercialization
- 4.11 Industry Developments and Announcements
Chapter 5 GCC Oil and Gas Market Production, Supply and Demand Analysis
- 5.1 Demand Trend and Consumption Analysis, 2018-2025
- 5.2 Demand Forecast, 2025-2035
- 5.3 Production and Output Trend, 2018-2025
- 5.4 Production and Output Forecast, 2025-2035
- 5.5 Installed Capacity and Capacity Utilization
- 5.6 Company-Wise Production Plants and Statistics
- 5.6.1 Installed Production Capacity
- 5.6.2 Actual Production
- 5.6.3 Planned Capacity and Expansion Targets
- 5.7 Supply Chain Structure and Procurement Trends
- 5.8 Supply-Demand Gap and Bottlenecks
- 5.9 Import Dependence and Sourcing Structure
- 5.10 Contract Manufacturing and Outsourcing
- 5.11 Regional Supply and Demand Concentration
Chapter 6 GCC Oil and Gas Market Pricing Analysis
- 6.1 Pricing Structure and Measurement
- 6.2 Historical Pricing Trends, 2018-2025
- 6.3 Pricing Outlook, 2025-2035
- 6.4 Average Selling Price and Unit Economics
- 6.5 Pricing by Product and Market Segment
- 6.6 Geographic Pricing Differences
- 6.7 Key Input, Energy, Labor and Logistics Costs
- 6.8 Contract Pricing and Purchasing Models
- 6.9 Pricing Sensitivity and Competitive Positioning
- 6.10 Price, Margin and Profitability Implications
Chapter 7 GCC Oil and Gas Market Dynamics
- 7.1 Market Growth Drivers
- 7.1.1 Demand-Side Drivers
- 7.1.2 Technology and Innovation Drivers
- 7.1.3 Infrastructure and Investment Drivers
- 7.1.4 Regulatory and Policy Drivers
- 7.2 Market Restraints
- 7.2.1 Cost and Affordability Constraints
- 7.2.2 Technology and Adoption Barriers
- 7.2.3 Supply Chain and Operational Constraints
- 7.3 Market Challenges
- 7.3.1 Competitive Pressure and Margin Erosion
- 7.3.2 Skills, Infrastructure and Implementation Gaps
- 7.4 Emerging Market Opportunities
- 7.5 Market Dynamics Impact and Time-Horizon Assessment
Chapter 8 GCC Oil and Gas Value Chain Analysis
- 8.1 Industry Value Chain Overview
- 8.2 Upstream Suppliers and Critical Inputs
- 8.3 Technology and Component Providers
- 8.4 Manufacturing or Service Delivery
- 8.5 Distribution, Channel Partners and Integrators
- 8.6 Downstream Applications and End Users
- 8.7 Value Addition and Profit Pools
- 8.8 Vertical Integration and Outsourcing
- 8.9 Supplier Concentration and Risk
- 8.10 Supply Chain Localization and Resilience
Chapter 9 GCC Oil and Gas Market Regulations and Policies
- 9.1 Relevant Laws, Standards and Compliance Frameworks
- 9.2 Product, Service, Safety and Quality Requirements
- 9.3 Government Policies, Incentives and Subsidies
- 9.4 Imports, Exports and Trade Barriers
- 9.5 Public Procurement and Local Content Requirements
- 9.6 Environmental and Sustainability Compliance
- 9.7 Upcoming Policy Changes and Market Implications
Chapter 10 GCC Oil and Gas Market Hotspots and Opportunities
- 10.1 Market Opportunity Mapping and Growth Hotspots
- 10.2 High-Growth Applications and Customer Groups
- 10.3 Underserved Markets and White-Space Opportunities
- 10.4 Emerging Technology and Product Opportunities
- 10.5 New Capacity and Investment Hotspots
- 10.6 Market Entry and Expansion Opportunities
- 10.7 Distribution and Partnership Opportunities
- 10.8 Near-Term and Long-Term Commercial Potential
- 10.9 Opportunity Attractiveness and Execution Risks
Chapter 11 GCC Oil and Gas Market Outlook, 2025-2035
- 11.1 Market Size and Analysis
- 11.1.1 Revenue (Market Measurement: 2025: USD 557.99 billion → 2035: USD 747.93 billion)
- 11.1.2 Market Volume and Quantity Sold
- 11.1.3 Historical Market Size, 2018-2025
- 11.1.4 Base-Year Market Size, 2025
- 11.2 Market Forecast, 2025-2035
- 11.2.1 Revenue Forecast to 2035
- 11.2.2 Volume Forecast to 2035
- 11.2.3 CAGR and Year-on-Year Growth
- 11.2.4 Incremental Revenue Opportunity
- 11.3 Forecast Assumptions and Scenario Analysis
- 11.3.1 Base-Case Forecast
- 11.3.2 Optimistic and Conservative Scenarios
- 11.3.3 Technology, Pricing and Policy Sensitivities
- 11.4 Market Attractiveness and Growth Outlook
Chapter 12 GCC Oil and Gas Market Segmentation and Outlook
- 12.1 Segmentation Summary and Market Shares, 2025
- 12.2 Largest and Fastest-Growing Segments
- 12.3 By Energy Source - Market Size and Forecast, 2025-2035
- 12.3.1 Segment Definition and Scope
- 12.3.2 Historical Market Size, 2018-2025
- 12.3.3 Revenue Forecast, 2025-2035
- 12.3.4 Volume Forecast, 2025-2035
- 12.3.5 Base-Year Market Share, 2025
- 12.3.6 Segment CAGR and Growth Drivers
- 12.3.7 Subsegment Market Size and Forecast
- 12.3.7.1 Crude Oil
- 12.3.7.2 Natural Gas and LNG
- 12.3.7.3 Condensates and NGLs
- 12.3.7.4 Unconventional Hydrocarbons
- 12.3.8 Subsegment Pricing and Adoption Trends
- 12.3.9 Leading Suppliers and Competition
- 12.3.10 Regional Demand and Opportunities
- 12.4 By Application - Market Size and Forecast, 2025-2035
- 12.4.1 Segment Definition and Scope
- 12.4.2 Historical Market Size, 2018-2025
- 12.4.3 Revenue Forecast, 2025-2035
- 12.4.4 Volume Forecast, 2025-2035
- 12.4.5 Base-Year Market Share, 2025
- 12.4.6 Segment CAGR and Growth Drivers
- 12.4.7 Subsegment Market Size and Forecast
- 12.4.7.1 Export Supply
- 12.4.7.2 Domestic Power and Utilities
- 12.4.7.3 Refining Feedstock
- 12.4.7.4 Petrochemical and Industrial Feedstock
- 12.4.8 Subsegment Pricing and Adoption Trends
- 12.4.9 Leading Suppliers and Competition
- 12.4.10 Regional Demand and Opportunities
- 12.5 By End User - Market Size and Forecast, 2025-2035
- 12.5.1 Segment Definition and Scope
- 12.5.2 Historical Market Size, 2018-2025
- 12.5.3 Revenue Forecast, 2025-2035
- 12.5.4 Volume Forecast, 2025-2035
- 12.5.5 Base-Year Market Share, 2025
- 12.5.6 Segment CAGR and Growth Drivers
- 12.5.7 Subsegment Market Size and Forecast
- 12.5.7.1 National Oil Companies
- 12.5.7.2 Refiners and Petrochemical Producers
- 12.5.7.3 Power and Utility Companies
- 12.5.7.4 LNG and Commodity Buyers
- 12.5.8 Subsegment Pricing and Adoption Trends
- 12.5.9 Leading Suppliers and Competition
- 12.5.10 Regional Demand and Opportunities
- 12.6 By Ownership Model - Market Size and Forecast, 2025-2035
- 12.6.1 Segment Definition and Scope
- 12.6.2 Historical Market Size, 2018-2025
- 12.6.3 Revenue Forecast, 2025-2035
- 12.6.4 Volume Forecast, 2025-2035
- 12.6.5 Base-Year Market Share, 2025
- 12.6.6 Segment CAGR and Growth Drivers
- 12.6.7 Subsegment Market Size and Forecast
- 12.6.7.1 State-Owned Operations
- 12.6.7.2 Concession Partnerships
- 12.6.7.3 Joint Ventures
- 12.6.7.4 International Operator-Led Assets
- 12.6.8 Subsegment Pricing and Adoption Trends
- 12.6.9 Leading Suppliers and Competition
- 12.6.10 Regional Demand and Opportunities
- 12.7 By Country - Market Size and Forecast, 2025-2035
- 12.7.1 Segment Definition and Scope
- 12.7.2 Historical Market Size, 2018-2025
- 12.7.3 Revenue Forecast, 2025-2035
- 12.7.4 Volume Forecast, 2025-2035
- 12.7.5 Base-Year Market Share, 2025
- 12.7.6 Segment CAGR and Growth Drivers
- 12.7.7 Subsegment Market Size and Forecast
- 12.7.7.1 Saudi Arabia
- 12.7.7.2 United Arab Emirates
- 12.7.7.3 Qatar
- 12.7.7.4 Kuwait, Oman and Bahrain
- 12.7.8 Subsegment Pricing and Adoption Trends
- 12.7.9 Leading Suppliers and Competition
- 12.7.10 Regional Demand and Opportunities
- 12.8 Segment Growth Comparison
- 12.9 Segment Attractiveness and Priority Matrix
Chapter 13 GCC Oil and Gas End-Use and Application Market Outlook
- 13.1 End-Use Industry and Customer Demand Structure
- 13.2 Leading Applications and Customer Groups
- 13.3 End-Use Market Size, Share and Forecast
- 13.4 Major End-Use Industry Deep Dives
- 13.4.1 Customer Requirements and Use Cases
- 13.4.2 Demand and Replacement Cycles
- 13.4.3 Technical and Regulatory Considerations
- 13.4.4 Purchasing and Procurement Models
- 13.4.5 Leading Vendors and Distribution Channels
- 13.4.6 Forecast and Commercial Opportunities
- 13.5 Emerging Applications and Cross-Segment Demand
- 13.6 End-Use Industry Investment Priorities
Chapter 14 GCC Oil and Gas Geographic Market Outlook, 2025-2035
- 14.1 Regional Market Size and Country-Level Shares, 2025
- 14.2 Country Market Size Comparison, 2025
- 14.3 Country Market Forecasts, 2025-2035
- 14.4 Subregional Industrial and Demand Clusters
- 14.5 Intra-Regional Pricing and Cost Differences
- 14.6 Cross-Border Trade and Supply Networks
- 14.7 Regional Supply and Demand Balances
- 14.8 Country Opportunity Comparison and Prioritization
Note: Every listed country is covered on the structure shown under the first country.
Chapter 15 GCC Oil and Gas Technology, Innovation and Sustainability Outlook
- 15.1 Technology Landscape and Maturity
- 15.2 Product, Process and Service Innovation
- 15.3 AI, Automation and Digital Tools in the Industry
- 15.4 Technology Adoption and Performance Benchmarking
- 15.5 Innovation Pipeline and R&D Investment
- 15.6 Patent and Intellectual Property Trends
- 15.7 Energy Efficiency and Resource Management
- 15.8 Sustainability, Recycling and Circularity
- 15.9 Technology Roadmap, 2025-2035
- 15.10 Risks of Obsolescence and Technology Substitution
Chapter 16 GCC Oil and Gas Market Key Strategic Imperatives
- 16.1 Growth and Market Entry Priorities
- 16.2 High-Return Products and Segments
- 16.3 Pricing, Profitability and Cost Optimization
- 16.4 Technology Investment and Product Differentiation
- 16.5 Supply Chain Localization and Resilience
- 16.6 Distribution and Customer Acquisition
- 16.7 Partnership, Acquisition and Capacity Strategy
- 16.8 Regional Expansion Priorities
- 16.9 Short-, Medium- and Long-Term Actions
Chapter 17 Competition Outlook
- 17.1 Industry Competition Characteristics
- 17.2 Market Structure and Concentration
- 17.3 Market Share and Competitive Positioning, 2025
- 17.4 Company-Wise Revenue and Product Benchmarking
- 17.5 Production and Service Capacity Benchmarking
- 17.6 Technology, Pricing and Differentiation
- 17.7 Regional Footprint and Distribution Strength
- 17.8 Mergers, Acquisitions and Strategic Alliances
- 17.9 New Entrants and Competitive Threats
- 17.10 Porter's Five Forces and Industry Attractiveness
- 17.11 Competitive Outlook, 2025-2035
Chapter 18 Company Profiles
- 18.1 Company Coverage and Selection Criteria
- 18.2 Saudi Aramco
- 18.2.1 Business Description
- 18.2.2 Company Ownership and Geographic Presence
- 18.2.3 Product and Service Portfolio
- 18.2.4 Manufacturing and Operating Footprint
- 18.2.5 Production Capacity and Expansion Plans
- 18.2.6 Financial Performance and Investment
- 18.2.7 Market Share and Competitive Position
- 18.2.8 Technology and Innovation Capabilities
- 18.2.9 Strategic Alliances or Partnerships
- 18.2.10 Recent Developments
- 18.2.11 Growth Strategy and Outlook
- 18.3 ADNOC
- 18.4 QatarEnergy
- 18.5 Kuwait Petroleum Corporation
- 18.6 OQ
- 18.7 Petroleum Development Oman
- 18.8 Bapco Energies
- 18.9 ExxonMobil
- 18.10 Shell
- 18.11 BP
- 18.12 TotalEnergies
- 18.13 Eni
- 18.14 Other Relevant Market Participants
Note: Every listed company is profiled on the structure shown under the first company. The company list is preliminary and may change based on research findings, market developments, data availability and client requirements.
Chapter 19 Disclaimer
- 19.1 Research and Forecast Disclaimer
- 19.2 Data Source and Estimation Limitations
Note: The depth of individual sections depends on data availability for this market. Volume, capacity, trade and other unit-based metrics are included where applicable.