Market Overview:
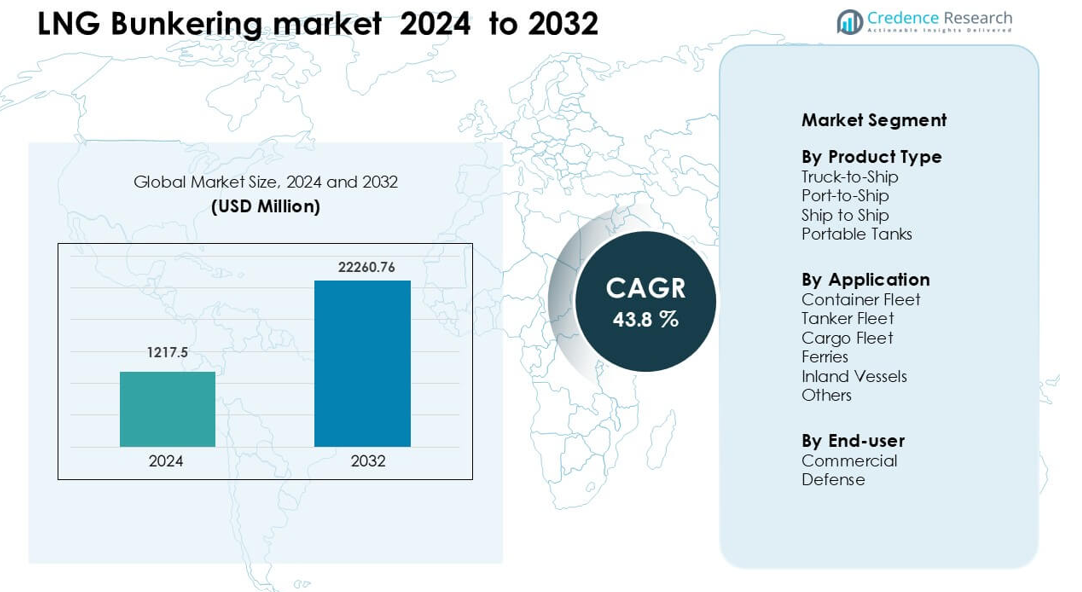
LNG Bunkering market was valued at USD 1217.5 million in 2024 and is anticipated to reach USD 22260.76 million by 2032, growing at a CAGR of 43.8 % during the forecast period.
| REPORT ATTRIBUTE |
DETAILS |
| Historical Period |
2020-2023 |
| Base Year |
2024 |
| Forecast Period |
2025-2032 |
| LNG Bunkering Market Size 2024 |
USD 1217.5 million |
| LNG Bunkering Market, CAGR |
43.8% |
| LNG Bunkering Market Size 2032 |
USD 22260.76 million |
The LNG Bunkering market is shaped by major players such as Shell, TotalEnergies, Gazprom, Wärtsilä, and Bomin Linde LNG, each expanding global fueling networks and ship-to-ship capabilities to meet rising demand for cleaner marine fuel. These companies invest in advanced bunkering vessels, port partnerships, and integrated LNG supply chains to support growing dual-fuel fleets across container, tanker, and ferry segments. Europe leads the market with about 36% share in 2024, supported by strict emission rules, mature LNG infrastructure, and high adoption of LNG-ready vessels. This regional dominance continues as ports enhance capacity and offer reliable, scalable bunkering services.
Market Insights
- The LNG Bunkering market reached USD 1217.5 Million in 2024 and is projected to reach USD 22260.76 Million by 2032, growing at a CAGR of 43.8%.
- Growth accelerates as shipping companies adopt LNG to meet IMO emission rules, with the Container Fleet segment holding about 38% share due to strong trade volumes and compliance needs.
- Trends include rapid expansion of ship-to-ship bunkering and rising interest in bio-LNG pathways as ports upgrade fueling capacity and support cleaner propulsion technologies.
- Competition strengthens as Shell, TotalEnergies, Gazprom, Wärtsilä, and Bomin Linde LNG expand global supply networks, invest in bunkering vessels, and form long-term fuel agreements with major fleet operators.
- Europe leads with about 36% share in 2024 due to mature LNG infrastructure and strict regulatory pressure, followed by Asia Pacific at 28%, while Truck-to-Ship dominates the product type segment with around 42% market share
Access crucial information at unmatched prices!
Request your sample report today & start making informed decisions powered by Credence Research Inc.!
Download Sample
Market Segmentation Analysis
By Product Type
Truck-to-Ship leads this segment with about 42% share in 2024. Ports prefer this method due to low setup cost, faster deployment, and flexibility for fleets in early LNG adoption stages. Operators choose truck fueling because it supports scalable supply without major terminal investment, making it suitable for emerging LNG hubs and medium-sized ports. Ship-to-Ship expands as large vessels shift to cleaner fuels, while Port-to-Ship grows in high-traffic regions upgrading fixed bunkering points. Portable tanks see steady use in remote or low-volume locations seeking modular fueling options.
- For instance, Elenger (an Estonian energy company) delivers LNG by road tankers from the Klaipėda LNG terminal in Lithuania to ports like Tallinn and Hanko; they operate 11 CNG/LNG stations and use truck-to-ship bunkering to supply LNG for ships in the Baltic Sea.
By Application
Container Fleet dominates this segment with nearly 38% share in 2024. The fleet adopts LNG due to rising emission rules and large global trade volumes that demand cleaner propulsion. Operators shift to LNG to comply with IMO Tier III and ECA standards, driving stronger demand for frequent bunkering cycles. Tanker and Cargo fleets increase uptake as fuel cost stability improves, while Ferries and Inland Vessels grow in controlled coastal routes where LNG supply chains are easier to standardize. Other vessel categories adopt LNG as part of long-term carbon reduction plans.
- For instance, MSC has a large order book for LNG dual-fuel ships, with deliveries spread out over several years, from late 2024 through to 2030 and beyond.
By End-User
Commercial users hold the largest share in this segment at about 86% in 2024. Shipping lines adopt LNG to reduce sulfur emissions, meet tightening CO₂ goals, and manage long-term operating costs. Fleet owners shift to LNG as major ports expand bunkering capacity and global trade lanes push cleaner energy transitions. Defense users grow at a slower pace due to longer procurement cycles, yet navies explore LNG for auxiliary vessels that need lower emissions and quieter engine profiles. Potential growth rises as governments study hybrid and LNG-based upgrades for future maritime assets.
Key Growth Drivers
Rising Global Maritime Emission Regulations
Stricter global emission rules drive rapid adoption of LNG bunkering across major shipping routes. The IMO 2020 sulfur cap and IMO Tier III NOx limits push vessel owners toward cleaner fuels that deliver measurable compliance benefits without major propulsion redesign. LNG offers up to 90% lower NOx emissions, almost zero SOx, and reduced particulate output, making it a practical transition fuel for both newbuild and retrofit vessels. Ports expand LNG bunkering to support compliance demand, especially in emission control areas with strict monitoring. Fleet operators increase LNG investments to avoid penalties and maintain access to regulated trade corridors. These regulations push LNG from an optional choice to a required fuel pathway for long-term maritime sustainability.
- For instance, Himalaya Shipping’s MV Mount Norefjell, a 210,000 dwt Newcastlemax bulk carrier, uses a dual-fuel LNG/low-sulfur oil propulsion system, which helps it meet stringent soot and sulfur limits while leveraging modern engine technology.
Growing Investment in LNG Infrastructure and Port Expansion
Ports worldwide expand LNG bunkering terminals, fueling stations, and ship-to-ship capabilities to support rising clean fuel demand. Governments and private operators invest in large-scale liquefaction, storage, and distribution systems that enhance LNG availability along global trade lanes. Expanded infrastructure reduces supply risk, increases bunker reliability, and supports stable pricing for commercial fleets. Major hubs in Europe and Asia lead adoption due to established LNG logistics networks, encouraging vessel operators to shift toward LNG-compatible engines. Shipbuilders design LNG-ready vessels in higher volumes, strengthening long-term market growth. As port infrastructure matures, operators gain confidence to transition entire fleets, making LNG bunkering a central element of next-generation maritime energy planning.
- For instance, Total Energies is deploying a new 18,600 m³ LNG bunker vessel (chartered from Ibaizabal) to expand its supply capacity in bunkering hubs, underlining its commitment to large-scale infrastructure.
Increasing Demand for Cost-Efficient and Cleaner Marine Fuel Options
Shipping companies prioritize LNG because it delivers cleaner combustion and long-term fuel cost predictability. LNG’s lower sulfur content avoids costly exhaust cleaning systems, cutting both capital and operating costs. Vessel owners view LNG as a reliable option to hedge against fluctuating oil-based bunker prices. The fuel helps fleets reduce lifecycle emissions and align with ESG standards demanded by cargo owners and regulators. LNG also enhances engine performance through cleaner burn properties, lowering maintenance frequency for high-load vessels. As maritime trade expands, operators search for sustainable fuel alternatives that balance environmental goals with economic feasibility, making LNG a preferred solution for modern fleet strategies.
Key Trend and Opportunity
Rapid Growth of Ship-to-Ship (STS) LNG Bunkering Services
Ship-to-Ship LNG bunkering emerges as a major trend as larger vessels demand high-volume fueling at sea or anchorage. STS operations expand in Europe, Singapore, and China, supported by dedicated bunkering vessels with higher capacity and flexible routing. Growing deep-sea shipping fleets require faster turnaround times, and STS offers efficient fueling without port congestion. Operators invest in dual-fuel tankers and container ships, driving sustained growth in offshore LNG fueling services. The trend also accelerates as ports streamline approval processes and standardize safety procedures. As global bunkering fleets expand, STS becomes a strategic advantage for major maritime hubs seeking to serve long-range commercial vessels.
- For instance, MOL’s “Gas Agility” one of the largest LNG bunkering vessels has a cargo capacity of 18,600 m³, enabling very high-volume STS transfers to ultra-large container ships.
Emergence of LNG Hybrid Systems and Transition Toward Bio-LNG
Shipping companies adopt hybrid LNG systems that integrate battery storage, dual-fuel engines, and onboard energy optimization. These hybrid setups reduce methane slip, improve efficiency, and support partial electrification. Bio-LNG emerges as a promising opportunity because it enables carbon-neutral fueling using existing LNG bunkering infrastructure. Ports explore pathways to blend bio-LNG with conventional LNG, helping operators meet future carbon intensity targets. Supply chains expand to include renewable methane production, giving fleets a scalable route to net-zero without major vessel redesign. This transition strengthens LNG’s long-term relevance as a bridge fuel in global maritime decarbonization.
- For instance, Wasaline’s ROPAX ferry Aurora Botnia runs on a dual-fuel power plant (LNG & biogas) plus a battery system; by early 2026, it is expected to have a total 12.6 MWh battery capacity while operating on liquid biogas (bio-LNG), making it the world’s largest marine battery hybrid system in operation.
Expansion of LNG Bunkering in Emerging Maritime Economies
Emerging shipping economies in Asia, South America, and the Middle East expand LNG bunkering as part of national clean energy mandates. Rapid port modernization projects include LNG storage, cryogenic loading systems, and new STS capacity. These regions seek to attract global carriers by offering competitive bunkering prices and compliant fuel options. Growing regional trade and coastal shipping networks create fresh demand for mid-range LNG bunkering infrastructure. Local fleet operators adopt LNG to meet national environmental goals and secure long-term operational savings. This expansion opens high-growth markets for technology suppliers, bunkering operators, and terminal developers.
Key Challenge
High Initial Infrastructure and Vessel Conversion Costs
Building LNG terminals, cryogenic tanks, and bunkering systems requires heavy capital investment, slowing adoption in developing port regions. Vessel conversions to LNG-compatible engines also involve significant costs, limiting upgrades for small and medium shipping companies. Operators must justify long-term fuel savings against high upfront spending, making decision cycles longer. Financing remains difficult in markets with uncertain LNG demand forecasts. Ports struggle to allocate budget for LNG infrastructure when competing with container handling and modernization priorities. These cost barriers hinder widespread LNG bunkering expansion despite strong regulatory momentum.
Methane Slip Concerns and Evolving Alternative Fuel Competition
Methane slip remains a key environmental challenge, raising questions about LNG’s long-term climate impact. Critics highlight methane’s higher global warming potential compared with CO₂, which affects LNG’s position as a transitional fuel. Regulatory agencies consider stricter methane emissions rules, creating uncertainty for future LNG investments. At the same time, alternative marine fuels such as green methanol, ammonia, and hydrogen gain traction, supported by heavy R&D funding. This competitive landscape forces LNG suppliers to innovate cleaner combustion technologies and better leak-control systems. The uncertainty complicates fleet investment planning and slows multi-year LNG bunkering commitments.
Regional Analysis
North America
North America holds about 29% share in 2024, driven by strong LNG marine fuel adoption across the U.S. and Canada. Major ports such as Jacksonville, Port Canaveral, and Vancouver expand bunkering capacity with new storage tanks and ship-to-ship capabilities. Fleet operators choose LNG to meet emission rules along coastal routes and support long-haul container traffic. Growing investment in LNG liquefaction plants improves supply security and reduces bunker delivery costs. The U.S. Gulf Coast strengthens its position through integrated LNG export terminals that enable scalable bunkering infrastructure and attract global shipping lines seeking compliant fueling options.
Europe
Europe leads the market with about 36% share in 2024, supported by strict environmental rules and established LNG supply chains. Key ports in the Netherlands, Norway, Spain, and Belgium maintain advanced bunkering networks with frequent ship-to-ship operations. The region benefits from early adoption of LNG-ready vessels across container, ferry, and tanker segments. Strong incentives for low-emission marine fuels accelerate demand, while the Baltic and North Sea ECAs reinforce LNG investment. Shipowners expand dual-fuel fleets to comply with carbon intensity targets, making Europe the most mature and integrated LNG bunkering hub globally.
Asia Pacific
Asia Pacific accounts for nearly 28% share in 2024, driven by rapid port expansion in China, South Korea, Japan, and Singapore. Major maritime hubs invest heavily in LNG storage, fueling vessels, and offshore bunkering to support rising trans-Pacific trade. Singapore strengthens its leadership in global bunkering through high-frequency ship-to-ship operations and an expanding LNG bunkering fleet. China accelerates LNG adoption for inland vessels and coastal shipping lines as part of national clean energy plans. The region’s strong shipbuilding base, including extensive dual-fuel vessel orders, further boosts long-term LNG bunkering growth.
Middle East & Africa
The Middle East & Africa region holds around 5% share in 2024 but shows steady growth as ports modernize to support cleaner marine fuels. Key hubs such as Dubai, Fujairah, and Oman develop LNG bunkering facilities to serve heavy tanker traffic through major trade corridors. Regional fleet operators evaluate LNG to meet emission rules while maintaining cost efficiency. Africa adopts LNG slowly due to limited infrastructure, though South Africa and Morocco initiate pilot projects. Rising LNG export capacity in Qatar and the UAE improves supply availability, positioning the region for long-term bunkering expansion.
South America
South America captures nearly 2% share in 2024, reflecting early-stage LNG bunkering development. Brazil leads regional adoption through port expansions in Rio de Janeiro and Santos, supported by growing LNG import terminals. Coastal shipping routes adopt LNG gradually as operators pursue cleaner propulsion for ferries and cargo vessels. Chile and Argentina explore LNG bunkering to support energy diversification and compliance with emerging emission rules. Although infrastructure remains limited, rising regional trade and offshore activities create long-term opportunities for LNG fueling services. Investment commitments grow as governments encourage clean maritime operations.
Market Segmentations:
By Product Type
- Truck-to-Ship
- Port-to-Ship
- Ship to Ship
- Portable Tanks
By Application
- Container Fleet
- Tanker Fleet
- Cargo Fleet
- Ferries
- Inland Vessels
- Others
By End-user
By Geography
- North America
- Europe
- Germany
- France
- U.K.
- Italy
- Spain
- Rest of Europe
- Asia Pacific
- China
- Japan
- India
- South Korea
- South-east Asia
- Rest of Asia Pacific
- Latin America
- Brazil
- Argentina
- Rest of Latin America
- Middle East & Africa
- GCC Countries
- South Africa
- Rest of the Middle East and Africa
Competitive Landscape
The LNG bunkering market features strong competition among global players that expand infrastructure, enhance supply capacity, and develop advanced bunkering vessels to meet rising fuel demand. Key companies such as Shell, TotalEnergies, Gazprom, Wärtsilä, and Bomin Linde LNG strengthen their portfolios through large-scale liquefaction integration, optimized ship-to-ship operations, and multi-port fueling networks. These operators focus on expanding bunkering corridors across Europe, Asia Pacific, and North America to support the growing fleet of LNG-powered vessels. Partnerships with port authorities and shipping lines help secure long-term fuel supply agreements and accelerate capacity additions. Companies invest in methane-reduction technologies, safety systems, and digital monitoring tools to improve operational efficiency and environmental performance. As competition intensifies, vendors differentiate through pricing stability, flexible delivery models, and availability of bio-LNG pathways, positioning themselves to support the maritime sector’s shift toward cleaner propulsion.
Shape Your Report to Specific Countries or Regions & Enjoy 30% Off!
Key Player Analysis
Recent Developments
- In May 2024, Equinor ASA Equinor agreed a renewed long-term LNG bunkering supply deal with Gasum. Gasum will keep fueling Equinor-chartered dual-fuel vessels in the North and Baltic Seas.
- In November-2023, SHV Energy, through its new business unit Futuria Fuels, signed a partnership agreement for the international development of solutions for bio-LPG production routes. The collaboration, with Japanese partners Furukawa Electric Co., Ltd. and Astomos Energy Corporation, will focus on leveraging a proprietary process and catalysts to convert carbon dioxide and methane from livestock manure into millions of tons of renewable bio-LPG.
- In October 2022, Trelleborg Group finalized the acquisition of the US-based company, Minnesota Rubber & Plastics, for USD 950 million on a cash and debt free basis. The company was currently a strong and well-established company in North America operating in several fast-growing industries such as medical equipment, water management and food & beverage, as well as in several industrial applications. The company is a leading manufacturer of engineered polymer and thermoplastic components and a system provider for technically demanding applications
Report Coverage
The research report offers an in-depth analysis based on Product Type, Application, End-User and Geography. It details leading market players, providing an overview of their business, product offerings, investments, revenue streams, and key applications. Additionally, the report includes insights into the competitive environment, SWOT analysis, current market trends, as well as the primary drivers and constraints. Furthermore, it discusses various factors that have driven market expansion in recent years. The report also explores market dynamics, regulatory scenarios, and technological advancements that are shaping the industry. It assesses the impact of external factors and global economic changes on market growth. Lastly, it provides strategic recommendations for new entrants and established companies to navigate the complexities of the market.
Future Outlook
- LNG bunkering demand will rise as global emission rules tighten across major shipping corridors.
- Ship-to-ship fueling capacity will expand as large vessels adopt high-volume LNG systems.
- More ports will invest in dedicated LNG storage tanks, pipelines, and hybrid fueling platforms.
- Bio-LNG adoption will grow as operators seek lower-carbon pathways using existing LNG networks.
- Dual-fuel vessel orders will increase as shipbuilders standardize LNG-ready designs.
- Digital monitoring tools will enhance safety, efficiency, and methane-slip control in bunkering operations.
- Price stability will improve as LNG supply chains mature and regional liquefaction capacity grows.
- Emerging maritime economies will strengthen LNG bunkering hubs through port modernization programs.
- Fleet operators will integrate LNG with battery-hybrid systems to boost fuel efficiency.
- Long-term adoption will expand as global shipping aligns LNG usage with net-zero decarbonization targets


