Market Overview
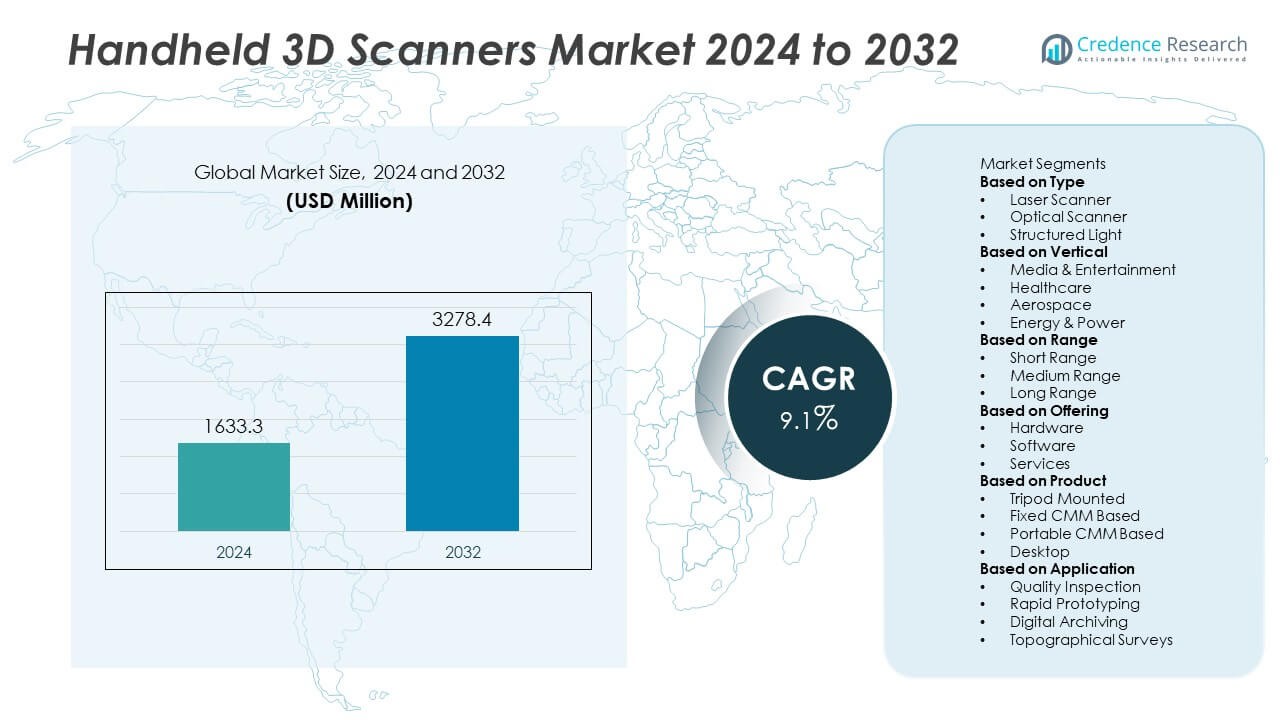
The Handheld 3D Scanners market was valued at USD 1,633.3 million in 2024 and is projected to reach USD 3,278.4 million by 2032, registering a CAGR of 9.1% during the forecast period.
| REPORT ATTRIBUTE | DETAILS |
|---|---|
| Historical Period | 2020-2024 |
| Base Year | 2024 |
| Forecast Period | 2025-2032 |
| Handheld 3D Scanners Market Size 2024 | USD 1,633.3 Million |
| Handheld 3D Scanners Market, CAGR | 9.1% |
| Handheld 3D Scanners Market Size 2032 | USD 3,278.4 Million |
The Handheld 3D Scanners market grows on the back of rising demand for precision measurement in manufacturing, healthcare, and construction, supported by advancements in portability, accuracy, and integration with CAD and BIM platforms. Key trends include the integration of AI and machine learning for automated defect detection, the shift toward wireless and cloud-connected solutions for real-time collaboration.
North America leads the Handheld 3D Scanners market due to strong adoption in aerospace, automotive, and healthcare sectors, supported by advanced R&D capabilities and the presence of major technology providers. Europe follows closely, driven by its established manufacturing base, heritage preservation initiatives, and Industry 4.0 integration across Germany, France, and the UK. Asia-Pacific shows rapid growth, with China, Japan, and South Korea investing in precision inspection for automotive, electronics. Latin America and the Middle East & Africa are gradually expanding adoption, fueled by industrial modernization and construction development. Key players shaping the market include Faro Technologies Inc., Hexagon AB, and Creaform Inc. (Ametek Inc.), known for their diverse product portfolios and advanced scanning technologies, that enable them to serve both industrial and creative sectors efficiently.
Market Insights
- The Handheld 3D Scanners market was valued at USD 1,633.3 million in 2024 and is projected to reach USD 3,278.4 million by 2032, registering a CAGR of 9.1% during the forecast period.
- The market expands due to rising demand for high-precision measurement in manufacturing, healthcare, and construction, supported by integration with CAD, reverse engineering, and BIM platforms.
- Key trends include the adoption of AI and machine learning for automated defect detection, wireless and cloud connectivity for real-time collaboration, and growing use in consumer applications such as virtual reality, gaming, and e-commerce.
- The competitive landscape features global players such as Faro Technologies Inc., Hexagon AB, Creaform Inc. (Ametek Inc.), and KEYENCE Corp., competing through product innovation, ergonomic designs, and software integration capabilities.
- High acquisition costs, complex operational requirements, and the need for skilled operators act as restraints, particularly limiting adoption among small and medium-sized enterprises.
- North America dominates due to strong industrial applications and R&D investments, Europe maintains a significant presence with heritage preservation and Industry 4.0 initiatives, and Asia-Pacific grows rapidly through industrial expansion in China, Japan, and South Korea.
- Latin America and the Middle East & Africa show gradual growth, driven by construction development, oil and gas applications, and cultural heritage projects, supported by declining hardware costs and expanding local distribution channels.
Market Drivers
Rising Demand for Precision in Manufacturing and Quality Control
The Handheld 3D Scanners market benefits from increasing requirements for high-precision measurements in manufacturing and quality inspection. Industries such as automotive, aerospace, and electronics rely on accurate 3D data to reduce errors and improve product performance. It enables rapid detection of deviations in prototypes and production runs. The portability of these devices allows technicians to conduct inspections directly on the shop floor. Integration with CAD and reverse engineering software supports faster design validation. This capability shortens development cycles and ensures consistent compliance with stringent quality standards.
- For instance, FARO’s Leap ST delivers accuracy up to 0.020 mm, enabling highly repeatable measurements in demanding shop‑floor environments.
Expanding Adoption in Healthcare and Medical Applications
Healthcare sectors increasingly incorporate handheld 3D scanning for applications in orthotics, prosthetics, and surgical planning. It provides detailed anatomical data for personalized medical solutions without invasive procedures. Dental professionals use 3D scans to create accurate crowns, aligners, and implants. The technology supports pre-operative planning, improving patient outcomes and reducing surgical times. Orthopedic specialists benefit from the ability to produce customized braces and supports based on precise body scans. The growing emphasis on patient-specific treatment continues to expand opportunities in medical imaging and device production.
- For instance, Creaform’s HandySCAN 3D | BLACK Elite offers single‑point accuracy of 0.025 mm with high-speed acquisition up to 1,300,000 points per second, ideal for capturing intricate anatomical details
Growth in Architecture, Heritage Preservation, and Cultural Documentation
Architects and cultural heritage professionals adopt handheld 3D scanners for their ability to capture detailed structural and surface data. It enables accurate restoration planning and preservation of historic sites without physical contact. In construction, the devices assist in verifying as-built structures against design specifications. Surveying teams gain the ability to document complex geometries in challenging environments. Museums employ the technology to digitize artifacts for virtual exhibitions and research archives. These applications extend the relevance of 3D scanning beyond industrial use into cultural and creative sectors.
Technological Advancements Enhancing Accessibility and Performance
Ongoing innovations in sensor technology, scanning speed, and software algorithms strengthen the capabilities of handheld 3D scanners. It supports real-time data capture with improved resolution and reduced processing times. Wireless connectivity and lightweight designs increase field usability for varied industries. AI-driven post-processing tools simplify mesh generation and error correction. Compatibility with cloud-based platforms allows collaborative access to scanned data across locations. These advancements lower operational barriers, making the technology viable for small and medium-sized enterprises alongside large corporations.
Market Trends
Integration with Artificial Intelligence and Machine Learning
The Handheld 3D Scanners market is witnessing a strong shift toward AI and ML-enabled scanning systems. It allows automated feature recognition, defect detection, and adaptive scanning paths for greater efficiency. AI algorithms improve mesh reconstruction accuracy, reducing the need for manual post-processing. Machine learning models enhance predictive maintenance for scanning devices, ensuring optimal performance. These capabilities enable industries to achieve faster throughput without compromising on detail quality. The trend supports the growing demand for intelligent, automated inspection workflows in manufacturing and design.
- For instance, Artec’s Eva handheld scanner leverages AI-powered HD Mode to double its resolution to 0.2 mm and process 35 million points per second, significantly elevating detail capture ability
Rising Popularity of Wireless and Cloud-Connected Solutions
Wireless connectivity and cloud integration are becoming standard in handheld 3D scanning solutions. It allows professionals to upload, process, and share 3D models instantly from the field. Cloud-based platforms facilitate remote collaboration among design teams, contractors, and clients. This trend eliminates the limitations of on-premise storage and speeds up project delivery timelines. Wireless designs improve mobility, enabling scans in hard-to-reach areas. The convenience and efficiency of connected workflows continue to attract adoption across industries from construction to healthcare.
- For instance, Revopoint’s Range 2 scanner offers single‑frame precision of 0.1 mm, allowing users to capture accurate models swiftly and wirelessly, enhancing flexibility in dynamic scanning scenarios
Expansion into Non-Industrial and Consumer Applications
The adoption of handheld 3D scanners is extending beyond industrial sectors into consumer and creative domains. It supports applications in fashion, gaming, virtual reality, and custom product design. Designers use scanning to create personalized products such as footwear, eyewear, and sports equipment. In the gaming and film industries, 3D scanners enable realistic character modeling and environment capture. Educational institutions incorporate scanning technology into STEM programs for hands-on learning. The broadening application base is diversifying revenue streams for manufacturers.
Advancements in Portability and Ergonomic Design
Manufacturers are focusing on developing lighter, more ergonomic handheld 3D scanners to improve usability. It helps reduce operator fatigue during prolonged use in field environments. Compact designs allow easier operation in confined spaces without sacrificing accuracy. Improvements in battery life extend uninterrupted scanning sessions. Adjustable grip options and balanced weight distribution enhance comfort for various user preferences. This trend aligns with the demand for field-ready tools that deliver high precision while remaining easy to operate.
Market Challenges Analysis
High Acquisition Costs and Limited Accessibility for SMEs
The Handheld 3D Scanners market faces challenges from high upfront costs, which restrict adoption among small and medium-sized enterprises. It often requires significant investment not only in hardware but also in compatible software and training. Budget constraints make it difficult for smaller businesses to justify the expense despite the long-term benefits. In some regions, the absence of leasing or rental options further limits market penetration. The cost factor is compounded by the need for periodic calibration and maintenance. These financial barriers slow down the widespread deployment of handheld scanning solutions in cost-sensitive industries.
Operational Complexity and Skill Gaps in End-User Industries
Many industries face difficulties in integrating handheld 3D scanners into existing workflows due to operational complexity. It demands skilled operators who can manage scanning parameters, data processing, and software integration. A lack of standardized training programs leads to inconsistent results across projects. Inaccurate scanning caused by operator error can result in costly rework. Compatibility issues with existing CAD or manufacturing systems can delay implementation timelines. These challenges highlight the importance of specialized training and user-friendly design to drive broader adoption.
Market Opportunities
Emerging Demand in Virtual Reality, Gaming, and E-Commerce
The Handheld 3D Scanners market has strong potential in sectors such as virtual reality, gaming, and e-commerce. It enables the creation of realistic 3D models for immersive gaming environments and digital product showcases. Retailers can leverage 3D scans to offer virtual try-on experiences, enhancing customer engagement and reducing return rates. The growing popularity of digital twins in online retail supports this trend. Entertainment companies benefit from faster asset creation for films and interactive media. These applications expand revenue opportunities beyond traditional industrial use cases.
Adoption in Infrastructure Development and Smart City Projects
Infrastructure and urban development projects present significant growth opportunities for handheld 3D scanners. It supports accurate surveying, site mapping, and structural monitoring in real time. Governments and contractors can use 3D scanning for efficient planning, reducing errors in large-scale construction. Integration with Building Information Modeling (BIM) platforms improves project coordination across stakeholders. Heritage preservation within smart city plans benefits from non-invasive scanning of historical structures. Expanding investments in infrastructure worldwide create a strong demand base for advanced scanning technologies.
Market Segmentation Analysis:
By Type
The Handheld 3D Scanners market divides into laser-based scanners, structured-light scanners, and other emerging technologies. Laser-based scanners dominate due to their high accuracy, long-range capabilities, and suitability for industrial-grade applications such as aerospace inspection and automotive quality control. Structured-light scanners gain traction in healthcare, heritage preservation, and consumer applications for their portability and ease of use. It offers faster capture speeds and high-resolution outputs, making them ideal for capturing complex geometries. Hybrid models that combine multiple scanning technologies are emerging to address diverse industry needs. The availability of varied scanner types allows businesses to match performance requirements with budget constraints.
- For instance, Artec’s Space Spider delivers a 3D resolution of 0.1 mm and point accuracy of 0.05 mm, enabling clinicians and conservationists to capture minute geometries with confidence
By Vertical
Adoption spans industries including manufacturing, healthcare, architecture and construction, media and entertainment, and education. Manufacturing leads the segment due to its reliance on precise measurements for product design, reverse engineering, and quality inspection. Healthcare applications such as prosthetics, dental restoration, and surgical planning show robust growth, driven by the need for patient-specific solutions. Architecture and construction benefit from accurate as-built documentation and Building Information Modeling (BIM) integration. In media and entertainment, handheld scanners are used for character modeling and prop replication. Education integrates the technology into STEM programs, preparing students for careers in advanced manufacturing and design.
- For instance, FARO’s Freestyle 2 handheld scanner delivers 3D point accuracy of 0.5 mm at a range of up to 5 meters, enabling construction engineers to capture detailed site conditions and educators to demonstrate real-world scanning workflows
By Range
The market categorizes range capabilities into short-range, medium-range, and long-range scanners. Short-range devices are popular in dental, medical, and small-scale manufacturing applications where detail precision is critical. Medium-range scanners serve industrial inspection, automotive prototyping, and mid-size construction projects. Long-range handheld scanners address needs in aerospace, shipbuilding, and large infrastructure documentation, where extended reach without sacrificing accuracy is essential. It allows operators to capture large objects or spaces in fewer passes, improving efficiency in field operations. Advancements in battery life, data processing, and wireless transmission further enhance the usability of scanners across all range categories.
Segments:
Based on Type
- Laser Scanner
- Optical Scanner
- Structured Light
Based on Vertical
- Media & Entertainment
- Healthcare
- Aerospace
- Energy & Power
Based on Range
- Short Range
- Medium Range
- Long Range
Based on Offering
- Hardware
- Software
- Services
Based on Product
- Tripod Mounted
- Fixed CMM Based
- Portable CMM Based
- Desktop
Based on Application
- Quality Inspection
- Rapid Prototyping
- Digital Archiving
- Topographical Surveys
Based on the Geography:
- North America
- U.S.
- Canada
- Mexico
- Europe
- UK
- France
- Germany
- Italy
- Spain
- Russia
- Belgium
- Netherlands
- Austria
- Sweden
- Poland
- Denmark
- Switzerland
- Rest of Europe
- Asia Pacific
- China
- Japan
- South Korea
- India
- Australia
- Thailand
- Indonesia
- Vietnam
- Malaysia
- Philippines
- Taiwan
- Rest of Asia Pacific
- Latin America
- Brazil
- Argentina
- Peru
- Chile
- Colombia
- Rest of Latin America
- Middle East
- UAE
- KSA
- Israel
- Turkey
- Iran
- Rest of Middle East
- Africa
- Egypt
- Nigeria
- Algeria
- Morocco
- Rest of Africa
Regional Analysis
North America
North America holds the largest share of the Handheld 3D Scanners market, accounting for 38% of the global revenue. The region benefits from strong demand in aerospace, automotive, and healthcare sectors, where high-precision inspection and modeling are critical. It sees widespread adoption of advanced scanning solutions driven by a mature industrial base and a high rate of technological innovation. The United States leads with extensive use in quality control, reverse engineering, and defense applications. Canada contributes through its growing adoption in healthcare and manufacturing, supported by research investments in 3D imaging technologies. Strong presence of key market players and robust R&D initiatives maintain North America’s leadership in the global market.
Europe
Europe accounts for 29% of the market, driven by its well-established automotive, aerospace, and cultural heritage sectors. Germany, France, and the United Kingdom are primary markets, leveraging 3D scanning for manufacturing optimization, digital preservation, and construction validation. It benefits from strict industrial quality regulations that encourage adoption of precise measurement tools. The cultural heritage preservation segment is particularly active, with European institutions using handheld scanners for artifact digitization and restoration planning. The rise of Industry 4.0 initiatives across the continent supports the integration of portable 3D scanning into production environments. Strategic partnerships between scanner manufacturers and industrial firms further enhance technology penetration.
Asia-Pacific
Asia-Pacific holds 22% of the global market share, reflecting rapid industrial growth and increasing technology adoption across multiple sectors. China, Japan, and South Korea are leading adopters, integrating handheld 3D scanners into automotive manufacturing, consumer electronics production, and healthcare applications. It benefits from expanding infrastructure projects, where accurate site surveys and construction monitoring are essential. The region’s electronics and semiconductor industries also drive demand for precision inspection tools. Government-backed technology development programs and growing local manufacturing capabilities support market expansion. Increasing affordability of scanning devices in emerging economies like India and Southeast Asian nations broadens the adoption base.
Latin America
Latin America represents 6% of the global market, with Brazil and Mexico leading regional adoption. Industrial modernization efforts in automotive, mining, and manufacturing are boosting demand for handheld 3D scanning technologies. It finds growing use in oil and gas facility inspections, construction quality assessment, and heritage site documentation. Educational institutions in the region are introducing scanning technologies into engineering and design curricula, creating long-term adoption potential. The market still faces challenges from limited high-tech infrastructure in certain areas, but declining hardware costs and local distribution partnerships are helping expand access.
Middle East & Africa
The Middle East & Africa account for 5% of the global market, supported by infrastructure development, oil and gas industry applications, and cultural preservation projects. The United Arab Emirates and Saudi Arabia lead adoption, using handheld scanners in large-scale construction and smart city initiatives. It also supports restoration projects for UNESCO heritage sites in the region. Mining and energy industries use 3D scanning for equipment inspection and asset management. While overall adoption remains in early stages compared to other regions, ongoing diversification of economies and investments in technology are expected to drive future growth.
Key Player Analysis
- Faro Technologies Inc.
- Renishaw
- Creaform Inc. (Ametek Inc.)
- Nikon Metrology
- Hexagon AB
- Carl Zeiss Optotechnik GmbH
- KEYENCE Corp.
- Trimble Navigation Ltd.
- Autodesk Inc.
- Topcon Corporation
Competitive Analysis
Leading players in the Handheld 3D Scanners market include Faro Technologies Inc., Hexagon AB, Creaform Inc. (Ametek Inc.), KEYENCE Corp., Nikon Metrology, Carl Zeiss Optotechnik GmbH, Trimble Navigation Ltd., Autodesk Inc., Topcon Corporation, and Renishaw, all competing through innovation, product diversification, and global distribution networks. These companies focus on delivering advanced scanning solutions with high accuracy, portability, and seamless integration with CAD, BIM, and reverse engineering software to meet industry-specific demands. Faro Technologies Inc. emphasizes precision and ease of use for manufacturing and construction, while Hexagon AB leverages metrology expertise for industrial inspection. Creaform Inc. excels in ergonomic, fast-scanning designs suited for both field and lab environments, and KEYENCE Corp. targets automation-ready, high-speed solutions. Nikon Metrology and Carl Zeiss Optotechnik GmbH specialize in optical and laser scanning for aerospace and high-end manufacturing. Continuous R&D investments, strategic partnerships, and acquisitions strengthen their competitive positioning and global market reach.
Recent Developments
- In August 2025, Renishaw announced its latest third-generation NC4+ Blue laser tool setter models (F100 and F100‑10C), debuting at EMO Hannover 2025 and setting a new standard in tool-setting technology for CNC machine tools.
- In January 2025, FARO Technologies released the FARO Leap ST®, a handheld 3D metrology scanner featuring five operating modes and designed for accuracy and portability. This scanner is compact and versatile, making it suitable for various applications across different industries, including aerospace, automotive, and manufacturing.
- In November 2024, Nikon divested its laser scanning and Focus Inspection software business to LK Metrology
Market Concentration & Characteristics
The Handheld 3D Scanners market exhibits a moderately concentrated structure, with a mix of established global manufacturers and specialized niche players competing on technology innovation, application diversity, and service capabilities. It is characterized by continuous advancements in scanning accuracy, portability, and integration with CAD, BIM, and reverse engineering platforms to address evolving industry needs. Leading companies maintain strong competitive positions through extensive product portfolios, global distribution networks, and sustained R&D investments. The market serves a broad range of verticals, including manufacturing, healthcare, construction, cultural heritage, and consumer applications, each demanding tailored performance and usability features. Pricing structures vary widely depending on resolution, range, and software capabilities, creating opportunities for both premium and cost-effective solutions. Strategic partnerships, product launches, and acquisitions play a critical role in expanding geographic reach and enhancing technology portfolios. The industry’s growth trajectory is supported by the increasing shift toward digitization, precision engineering, and real-time collaboration across sectors.
Report Coverage
The research report offers an in-depth analysis based on Type, Vertical, Range, Offering, Product, Application and Geography. It details leading market players, providing an overview of their business, product offerings, investments, revenue streams, and key applications. Additionally, the report includes insights into the competitive environment, SWOT analysis, current market trends, as well as the primary drivers and constraints. Furthermore, it discusses various factors that have driven market expansion in recent years. The report also explores market dynamics, regulatory scenarios, and technological advancements that are shaping the industry. It assesses the impact of external factors and global economic changes on market growth. Lastly, it provides strategic recommendations for new entrants and established companies to navigate the complexities of the market.
Future Outlook
- The market will see rising adoption across manufacturing, healthcare, and construction due to growing demand for high-precision measurement.
- AI and machine learning integration will enhance automated defect detection and data processing.
- Wireless and cloud-connected scanners will gain prominence for enabling real-time collaboration.
- Consumer applications such as gaming, virtual reality, and e-commerce will expand adoption beyond industrial sectors.
- Ergonomic and lightweight designs will improve user comfort and field usability.
- Emerging markets in Asia-Pacific, Latin America, and the Middle East will drive new growth opportunities.
- Integration with digital twin and Industry 4.0 platforms will strengthen operational efficiency.
- Increased affordability and availability of entry-level models will attract small and medium-sized enterprises.
- Strategic partnerships between hardware manufacturers and software developers will accelerate innovation.
- Sustainability-focused designs and energy-efficient components will become key differentiators in product development.

Request a Free Sample
Fill in your details and we'll send you a free sample report.
- Sample data tables & charts
- Research methodology
Market Dynamics
Rising Demand for Precision in Manufacturing and Quality Control
Industries such as automotive, aerospace, and electronics require highly accurate 3D data for error reduction and product optimization. Handheld 3D scanners enable rapid, on-site inspections and seamless integration with CAD and reverse engineering tools, shortening development cycles and ensuring compliance with strict quality standards.
Expanding Adoption in Healthcare and Medical Applications
Healthcare providers increasingly use handheld 3D scanners for orthotics, prosthetics, dental restoration, and surgical planning, as they offer detailed, non-invasive anatomical data. This supports personalized treatment, improves patient outcomes, and streamlines the production of custom medical devices.
Growth in Architecture, Heritage Preservation, and Cultural Documentation
Handheld 3D scanners are widely adopted for capturing detailed structural and surface data in architecture, construction, and heritage preservation. They enable accurate restoration planning, as-built verification, and artifact digitization, extending the technology’s relevance beyond industrial use.
Technological Advancements Enhancing Accessibility and Performance
Continuous improvements in sensor technology, scanning speed, wireless connectivity, and AI-driven software are making handheld 3D scanners more accessible and user-friendly. These advancements reduce operational barriers, increase field usability, and attract adoption among small and medium-sized enterprises.
Integration with AI, Machine Learning, and Cloud Connectivity
The incorporation of AI and machine learning enables automated defect detection and efficient data processing, while wireless and cloud-connected solutions facilitate real-time collaboration and remote access to 3D models. This trend is driving adoption across industries seeking intelligent, connected inspection workflows.
Need a Custom Version of This Report?
Tailor the scope, geography, or segments to your exact requirements.
- Custom geography or segment scope
- Direct access to our analyst team
Frequently Asked Questions
What is the current market size for Handheld 3D Scanners, and what is its projected size in 2032?
At what Compound Annual Growth Rate is the Handheld 3D Scanners market projected to grow between 2025 and 2032?
Which Handheld 3D Scanners market segment held the largest share in 2024?
What are the primary factors fueling the growth of the Handheld 3D Scanners market?
Who are the leading companies in the Handheld 3D Scanners market?
Which region commanded the largest share of the Handheld 3D Scanners market in 2024?
Table of Content
Chapter 1 Market Segmentation
- 1.1 Segmentation Framework
- 1.1.1 Product and Service Classification
- 1.1.2 Application and End-Use Classification
- 1.1.3 Technology and Solution Classification
- 1.1.4 Customer and Distribution Channel Classification
- 1.1.5 Geographic Segmentation
- 1.1.6 Market Segment Definitions and Boundaries
- 1.2 By Type
- 1.2.1 Laser Scanner
- 1.2.2 Optical Scanner
- 1.2.3 Structured Light
- 1.3 By Range
- 1.3.1 Short Range
- 1.3.2 Medium Range
- 1.3.3 Long Range
- 1.4 By Vertical
- 1.4.1 Media & Entertainment
- 1.4.2 Healthcare
- 1.4.3 Aerospace
- 1.4.4 Energy & Power
- 1.5 By Application
- 1.5.1 Quality Inspection
- 1.5.2 Rapid Prototyping
- 1.5.3 Digital Archiving
- 1.5.4 Topographical Surveys
Chapter 2 Introduction
- 2.1 Report Objectives and Scope
- 2.2 Product Definition and Industry Terminology
- 2.3 Market Inclusions and Exclusions
- 2.4 Research Process
- 2.4.1 Primary Research and Expert Interviews
- 2.4.2 Secondary Research and Source Review
- 2.4.3 Top-Down and Bottom-Up Estimation
- 2.4.4 Data Triangulation and Verification
- 2.5 Market Size Measurement Basis
- 2.5.1 2024: USD 1,633.3 million → 2032: USD 3,278.4 million
- 2.6 Historical and Forecast Reference Periods
- 2.6.1 Base Year: 2024
- 2.6.2 Forecast Period: 2024-2032
- 2.7 Research Assumptions and Limitations
Chapter 3 Executive Summary
- 3.1 Market Snapshot and Key Findings
- 3.2 Base-Year Market Size, 2024
- 3.3 Forecast Market Size, 2032
- 3.4 Revenue and Volume Growth Outlook
- 3.5 Key Demand and Supply Indicators
- 3.6 Leading Market Segments
- 3.7 Fastest-Growing Market Opportunities
- 3.8 Regional Performance Highlights
- 3.9 Technology and Industry Transformation
- 3.10 Competitive Landscape Summary
- 3.11 Analyst View and Strategic Implications
Chapter 4 Global Handheld 3D Scanners Market Trends and Developments
- 4.1 Historical Industry Development
- 4.2 Recent Market Trends and Developments
- 4.3 Demand and Customer Behavior Trends
- 4.4 Technology and Product Innovation
- 4.5 Artificial Intelligence, Automation and Digitalization
- 4.6 Local Manufacturing and Supply Chain Realignment
- 4.7 Industry Partnerships, Mergers and Acquisitions
- 4.8 Sustainability and Circular Economy Developments
- 4.9 Government and Private Sector Investment Trends
- 4.10 Emerging Business Models and Commercialization
- 4.11 Industry Developments and Announcements
Chapter 5 Global Handheld 3D Scanners Market Production, Supply and Demand Analysis
- 5.1 Demand Trend and Consumption Analysis
- 5.2 Demand Forecast, 2024-2032
- 5.3 Production and Output Trend
- 5.4 Production and Output Forecast, 2024-2032
- 5.5 Installed Capacity and Capacity Utilization
- 5.6 Company-Wise Production Plants and Statistics
- 5.6.1 Installed Production Capacity
- 5.6.2 Actual Production
- 5.6.3 Planned Capacity and Expansion Targets
- 5.7 Supply Chain Structure and Procurement Trends
- 5.8 Supply-Demand Gap and Bottlenecks
- 5.9 Import Dependence and Sourcing Structure
- 5.10 Contract Manufacturing and Outsourcing
- 5.11 Regional Supply and Demand Concentration
Chapter 6 Global Handheld 3D Scanners Market Pricing Analysis
- 6.1 Pricing Structure and Measurement
- 6.2 Historical Pricing Trends
- 6.3 Pricing Outlook, 2024-2032
- 6.4 Average Selling Price and Unit Economics
- 6.5 Pricing by Product and Market Segment
- 6.6 Geographic Pricing Differences
- 6.7 Key Input, Energy, Labor and Logistics Costs
- 6.8 Contract Pricing and Purchasing Models
- 6.9 Pricing Sensitivity and Competitive Positioning
- 6.10 Price, Margin and Profitability Implications
Chapter 7 Global Handheld 3D Scanners Market Dynamics
- 7.1 Market Growth Drivers
- 7.1.1 Demand-Side Drivers
- 7.1.2 Technology and Innovation Drivers
- 7.1.3 Infrastructure and Investment Drivers
- 7.1.4 Regulatory and Policy Drivers
- 7.2 Market Restraints
- 7.2.1 Cost and Affordability Constraints
- 7.2.2 Technology and Adoption Barriers
- 7.2.3 Supply Chain and Operational Constraints
- 7.3 Market Challenges
- 7.3.1 Competitive Pressure and Margin Erosion
- 7.3.2 Skills, Infrastructure and Implementation Gaps
- 7.4 Emerging Market Opportunities
- 7.5 Market Dynamics Impact and Time-Horizon Assessment
Chapter 8 Global Handheld 3D Scanners Value Chain Analysis
- 8.1 Industry Value Chain Overview
- 8.2 Upstream Suppliers and Critical Inputs
- 8.3 Technology and Component Providers
- 8.4 Manufacturing or Service Delivery
- 8.5 Distribution, Channel Partners and Integrators
- 8.6 Downstream Applications and End Users
- 8.7 Value Addition and Profit Pools
- 8.8 Vertical Integration and Outsourcing
- 8.9 Supplier Concentration and Risk
- 8.10 Supply Chain Localization and Resilience
Chapter 9 Global Handheld 3D Scanners Market Regulations and Policies
- 9.1 Relevant Laws, Standards and Compliance Frameworks
- 9.2 Product, Service, Safety and Quality Requirements
- 9.3 Government Policies, Incentives and Subsidies
- 9.4 Imports, Exports and Trade Barriers
- 9.5 Public Procurement and Local Content Requirements
- 9.6 Environmental and Sustainability Compliance
- 9.7 Upcoming Policy Changes and Market Implications
Chapter 10 Global Handheld 3D Scanners Market Hotspots and Opportunities
- 10.1 Market Opportunity Mapping and Growth Hotspots
- 10.2 High-Growth Applications and Customer Groups
- 10.3 Underserved Markets and White-Space Opportunities
- 10.4 Emerging Technology and Product Opportunities
- 10.5 New Capacity and Investment Hotspots
- 10.6 Market Entry and Expansion Opportunities
- 10.7 Distribution and Partnership Opportunities
- 10.8 Near-Term and Long-Term Commercial Potential
- 10.9 Opportunity Attractiveness and Execution Risks
Chapter 11 Global Handheld 3D Scanners Market Outlook, 2024-2032
- 11.1 Market Size and Analysis
- 11.1.1 Revenue (Market Measurement: 2024: USD 1,633.3 million → 2032: USD 3,278.4 million)
- 11.1.2 Market Volume and Quantity Sold
- 11.1.3 Historical Market Size
- 11.1.4 Base-Year Market Size, 2024
- 11.2 Market Forecast, 2024-2032
- 11.2.1 Revenue Forecast to 2032
- 11.2.2 Volume Forecast to 2032
- 11.2.3 CAGR and Year-on-Year Growth
- 11.2.4 Incremental Revenue Opportunity
- 11.3 Forecast Assumptions and Scenario Analysis
- 11.3.1 Base-Case Forecast
- 11.3.2 Optimistic and Conservative Scenarios
- 11.3.3 Technology, Pricing and Policy Sensitivities
- 11.4 Market Attractiveness and Growth Outlook
Chapter 12 Global Handheld 3D Scanners Market Segmentation and Outlook
- 12.1 Segmentation Summary and Market Shares, 2024
- 12.2 Largest and Fastest-Growing Segments
- 12.3 By Type - Market Size and Forecast, 2024-2032
- 12.3.1 Segment Definition and Scope
- 12.3.2 Historical Market Size
- 12.3.3 Revenue Forecast, 2024-2032
- 12.3.4 Volume Forecast, 2024-2032
- 12.3.5 Base-Year Market Share, 2024
- 12.3.6 Segment CAGR and Growth Drivers
- 12.3.7 Subsegment Market Size and Forecast
- 12.3.7.1 Laser Scanner
- 12.3.7.2 Optical Scanner
- 12.3.7.3 Structured Light
- 12.3.8 Subsegment Pricing and Adoption Trends
- 12.3.9 Leading Suppliers and Competition
- 12.3.10 Regional Demand and Opportunities
- 12.4 By Range - Market Size and Forecast, 2024-2032
- 12.4.1 Segment Definition and Scope
- 12.4.2 Historical Market Size
- 12.4.3 Revenue Forecast, 2024-2032
- 12.4.4 Volume Forecast, 2024-2032
- 12.4.5 Base-Year Market Share, 2024
- 12.4.6 Segment CAGR and Growth Drivers
- 12.4.7 Subsegment Market Size and Forecast
- 12.4.7.1 Short Range
- 12.4.7.2 Medium Range
- 12.4.7.3 Long Range
- 12.4.8 Subsegment Pricing and Adoption Trends
- 12.4.9 Leading Suppliers and Competition
- 12.4.10 Regional Demand and Opportunities
- 12.5 By Vertical - Market Size and Forecast, 2024-2032
- 12.5.1 Segment Definition and Scope
- 12.5.2 Historical Market Size
- 12.5.3 Revenue Forecast, 2024-2032
- 12.5.4 Volume Forecast, 2024-2032
- 12.5.5 Base-Year Market Share, 2024
- 12.5.6 Segment CAGR and Growth Drivers
- 12.5.7 Subsegment Market Size and Forecast
- 12.5.7.1 Media & Entertainment
- 12.5.7.2 Healthcare
- 12.5.7.3 Aerospace
- 12.5.7.4 Energy & Power
- 12.5.8 Subsegment Pricing and Adoption Trends
- 12.5.9 Leading Suppliers and Competition
- 12.5.10 Regional Demand and Opportunities
- 12.6 By Application - Market Size and Forecast, 2024-2032
- 12.6.1 Segment Definition and Scope
- 12.6.2 Historical Market Size
- 12.6.3 Revenue Forecast, 2024-2032
- 12.6.4 Volume Forecast, 2024-2032
- 12.6.5 Base-Year Market Share, 2024
- 12.6.6 Segment CAGR and Growth Drivers
- 12.6.7 Subsegment Market Size and Forecast
- 12.6.7.1 Quality Inspection
- 12.6.7.2 Rapid Prototyping
- 12.6.7.3 Digital Archiving
- 12.6.7.4 Topographical Surveys
- 12.6.8 Subsegment Pricing and Adoption Trends
- 12.6.9 Leading Suppliers and Competition
- 12.6.10 Regional Demand and Opportunities
- 12.7 Segment Growth Comparison
- 12.8 Segment Attractiveness and Priority Matrix
Chapter 13 Global Handheld 3D Scanners End-Use and Application Market Outlook
- 13.1 End-Use Industry and Customer Demand Structure
- 13.2 Leading Applications and Customer Groups
- 13.3 End-Use Market Size, Share and Forecast
- 13.4 Major End-Use Industry Deep Dives
- 13.4.1 Customer Requirements and Use Cases
- 13.4.2 Demand and Replacement Cycles
- 13.4.3 Technical and Regulatory Considerations
- 13.4.4 Purchasing and Procurement Models
- 13.4.5 Leading Vendors and Distribution Channels
- 13.4.6 Forecast and Commercial Opportunities
- 13.5 Emerging Applications and Cross-Segment Demand
- 13.6 End-Use Industry Investment Priorities
Chapter 14 Global Handheld 3D Scanners Geographic Market Outlook, 2024-2032
- 14.1 Regional Market Size and Share, 2024
- 14.2 Regional Market Forecast, 2024-2032
- 14.3 Regional Pricing, Production and Demand Differences
- 14.4 North America
- 14.4.1 United States
- 14.4.2 Canada
- 14.4.3 Mexico
- 14.5 Europe
- 14.5.1 Germany
- 14.5.2 France
- 14.5.3 Italy
- 14.5.4 United Kingdom
- 14.5.5 Spain
- 14.5.6 Poland
- 14.5.7 Russia
- 14.5.8 Netherlands
- 14.5.9 Belgium
- 14.5.10 Sweden
- 14.5.11 Denmark
- 14.5.12 Norway
- 14.5.13 Rest of Europe
- 14.6 Asia Pacific
- 14.6.1 China
- 14.6.2 India
- 14.6.3 Japan
- 14.6.4 South Korea
- 14.6.5 Thailand
- 14.6.6 Indonesia
- 14.6.7 Vietnam
- 14.6.8 Malaysia
- 14.6.9 Australia
- 14.6.10 Rest of Asia Pacific
- 14.7 Latin America
- 14.7.1 Brazil
- 14.7.2 Argentina
- 14.7.3 Colombia
- 14.7.4 Chile
- 14.7.5 Rest of Latin America
- 14.8 Middle East
- 14.8.1 Saudi Arabia
- 14.8.2 United Arab Emirates
- 14.8.3 Turkey
- 14.8.4 Israel
- 14.8.5 Iran
- 14.8.6 Rest of the Middle East
- 14.9 Africa
- 14.9.1 South Africa
- 14.9.2 Egypt
- 14.9.3 Nigeria
- 14.9.4 Morocco
- 14.9.5 Rest of Africa
- 14.10 Regional Investment, Policy and Supply Chain Differences
- 14.11 Regional Competitive Landscape
- 14.12 Geographic Growth Hotspots
Chapter 15 Global Handheld 3D Scanners Technology, Innovation and Sustainability Outlook
- 15.1 Technology Landscape and Maturity
- 15.2 Product, Process and Service Innovation
- 15.3 AI, Automation and Digital Tools in the Industry
- 15.4 Technology Adoption and Performance Benchmarking
- 15.5 Innovation Pipeline and R&D Investment
- 15.6 Patent and Intellectual Property Trends
- 15.7 Energy Efficiency and Resource Management
- 15.8 Sustainability, Recycling and Circularity
- 15.9 Technology Roadmap, 2024-2032
- 15.10 Risks of Obsolescence and Technology Substitution
Chapter 16 Global Handheld 3D Scanners Market Key Strategic Imperatives
- 16.1 Growth and Market Entry Priorities
- 16.2 High-Return Products and Segments
- 16.3 Pricing, Profitability and Cost Optimization
- 16.4 Technology Investment and Product Differentiation
- 16.5 Supply Chain Localization and Resilience
- 16.6 Distribution and Customer Acquisition
- 16.7 Partnership, Acquisition and Capacity Strategy
- 16.8 Regional Expansion Priorities
- 16.9 Short-, Medium- and Long-Term Actions
Chapter 17 Competition Outlook
- 17.1 Industry Competition Characteristics
- 17.2 Market Structure and Concentration
- 17.3 Market Share and Competitive Positioning, 2024
- 17.4 Company-Wise Revenue and Product Benchmarking
- 17.5 Production and Service Capacity Benchmarking
- 17.6 Technology, Pricing and Differentiation
- 17.7 Regional Footprint and Distribution Strength
- 17.8 Mergers, Acquisitions and Strategic Alliances
- 17.9 New Entrants and Competitive Threats
- 17.10 Porter's Five Forces and Industry Attractiveness
- 17.11 Competitive Outlook, 2024-2032
Chapter 18 Company Profiles
- 18.1 Company Coverage and Selection Criteria
- 18.2 Faro Technologies Inc.
- 18.2.1 Business Description
- 18.2.2 Company Ownership and Geographic Presence
- 18.2.3 Product and Service Portfolio
- 18.2.4 Manufacturing and Operating Footprint
- 18.2.5 Production Capacity and Expansion Plans
- 18.2.6 Financial Performance and Investment
- 18.2.7 Market Share and Competitive Position
- 18.2.8 Technology and Innovation Capabilities
- 18.2.9 Strategic Alliances or Partnerships
- 18.2.10 Recent Developments
- 18.2.11 Growth Strategy and Outlook
- 18.3 Hexagon AB
- 18.4 Creaform Inc. (Ametek Inc.)
- 18.5 KEYENCE Corp.
- 18.6 Nikon Metrology
- 18.7 Carl Zeiss Optotechnik GmbH
- 18.8 Trimble Navigation Ltd.
- 18.9 Autodesk Inc.
- 18.10 Topcon Corporation
- 18.11 Renishaw
- 18.12 Other Relevant Market Participants
Note: Every listed company is profiled on the structure shown under the first company. The company list is preliminary and may change based on research findings, market developments, data availability and client requirements.
Chapter 19 Disclaimer
- 19.1 Research and Forecast Disclaimer
- 19.2 Data Source and Estimation Limitations
Note: The depth of individual sections depends on data availability for this market. Volume, capacity, trade and other unit-based metrics are included where applicable.