
Branded packaged water is China’s largest drink category
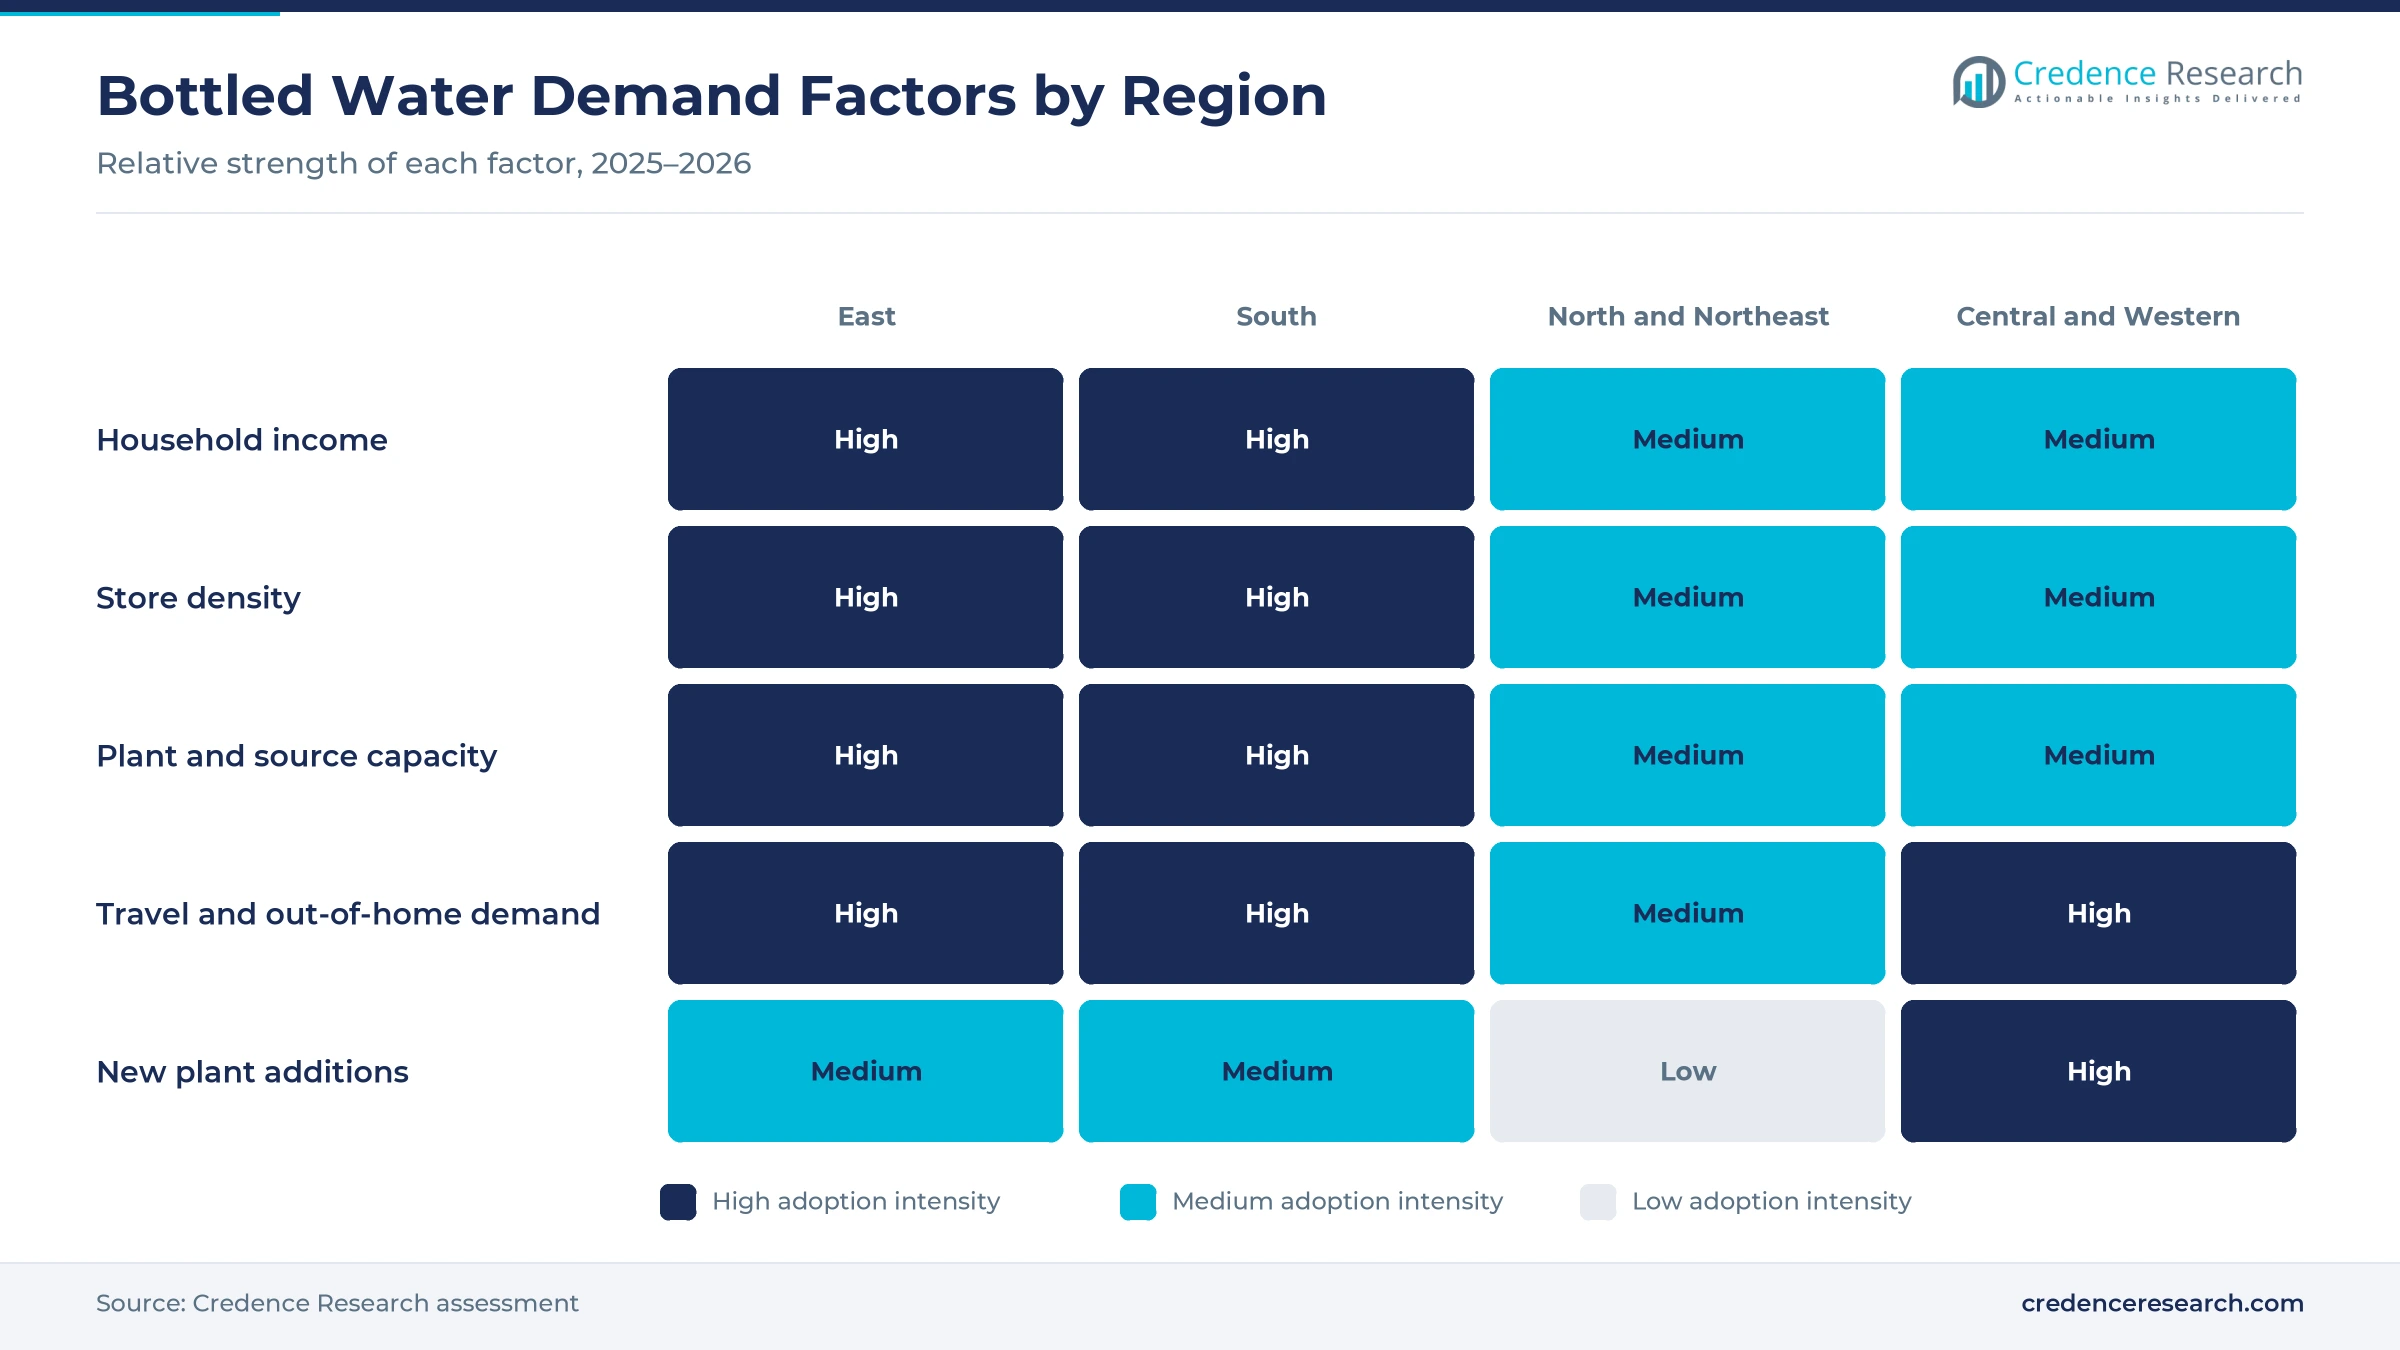
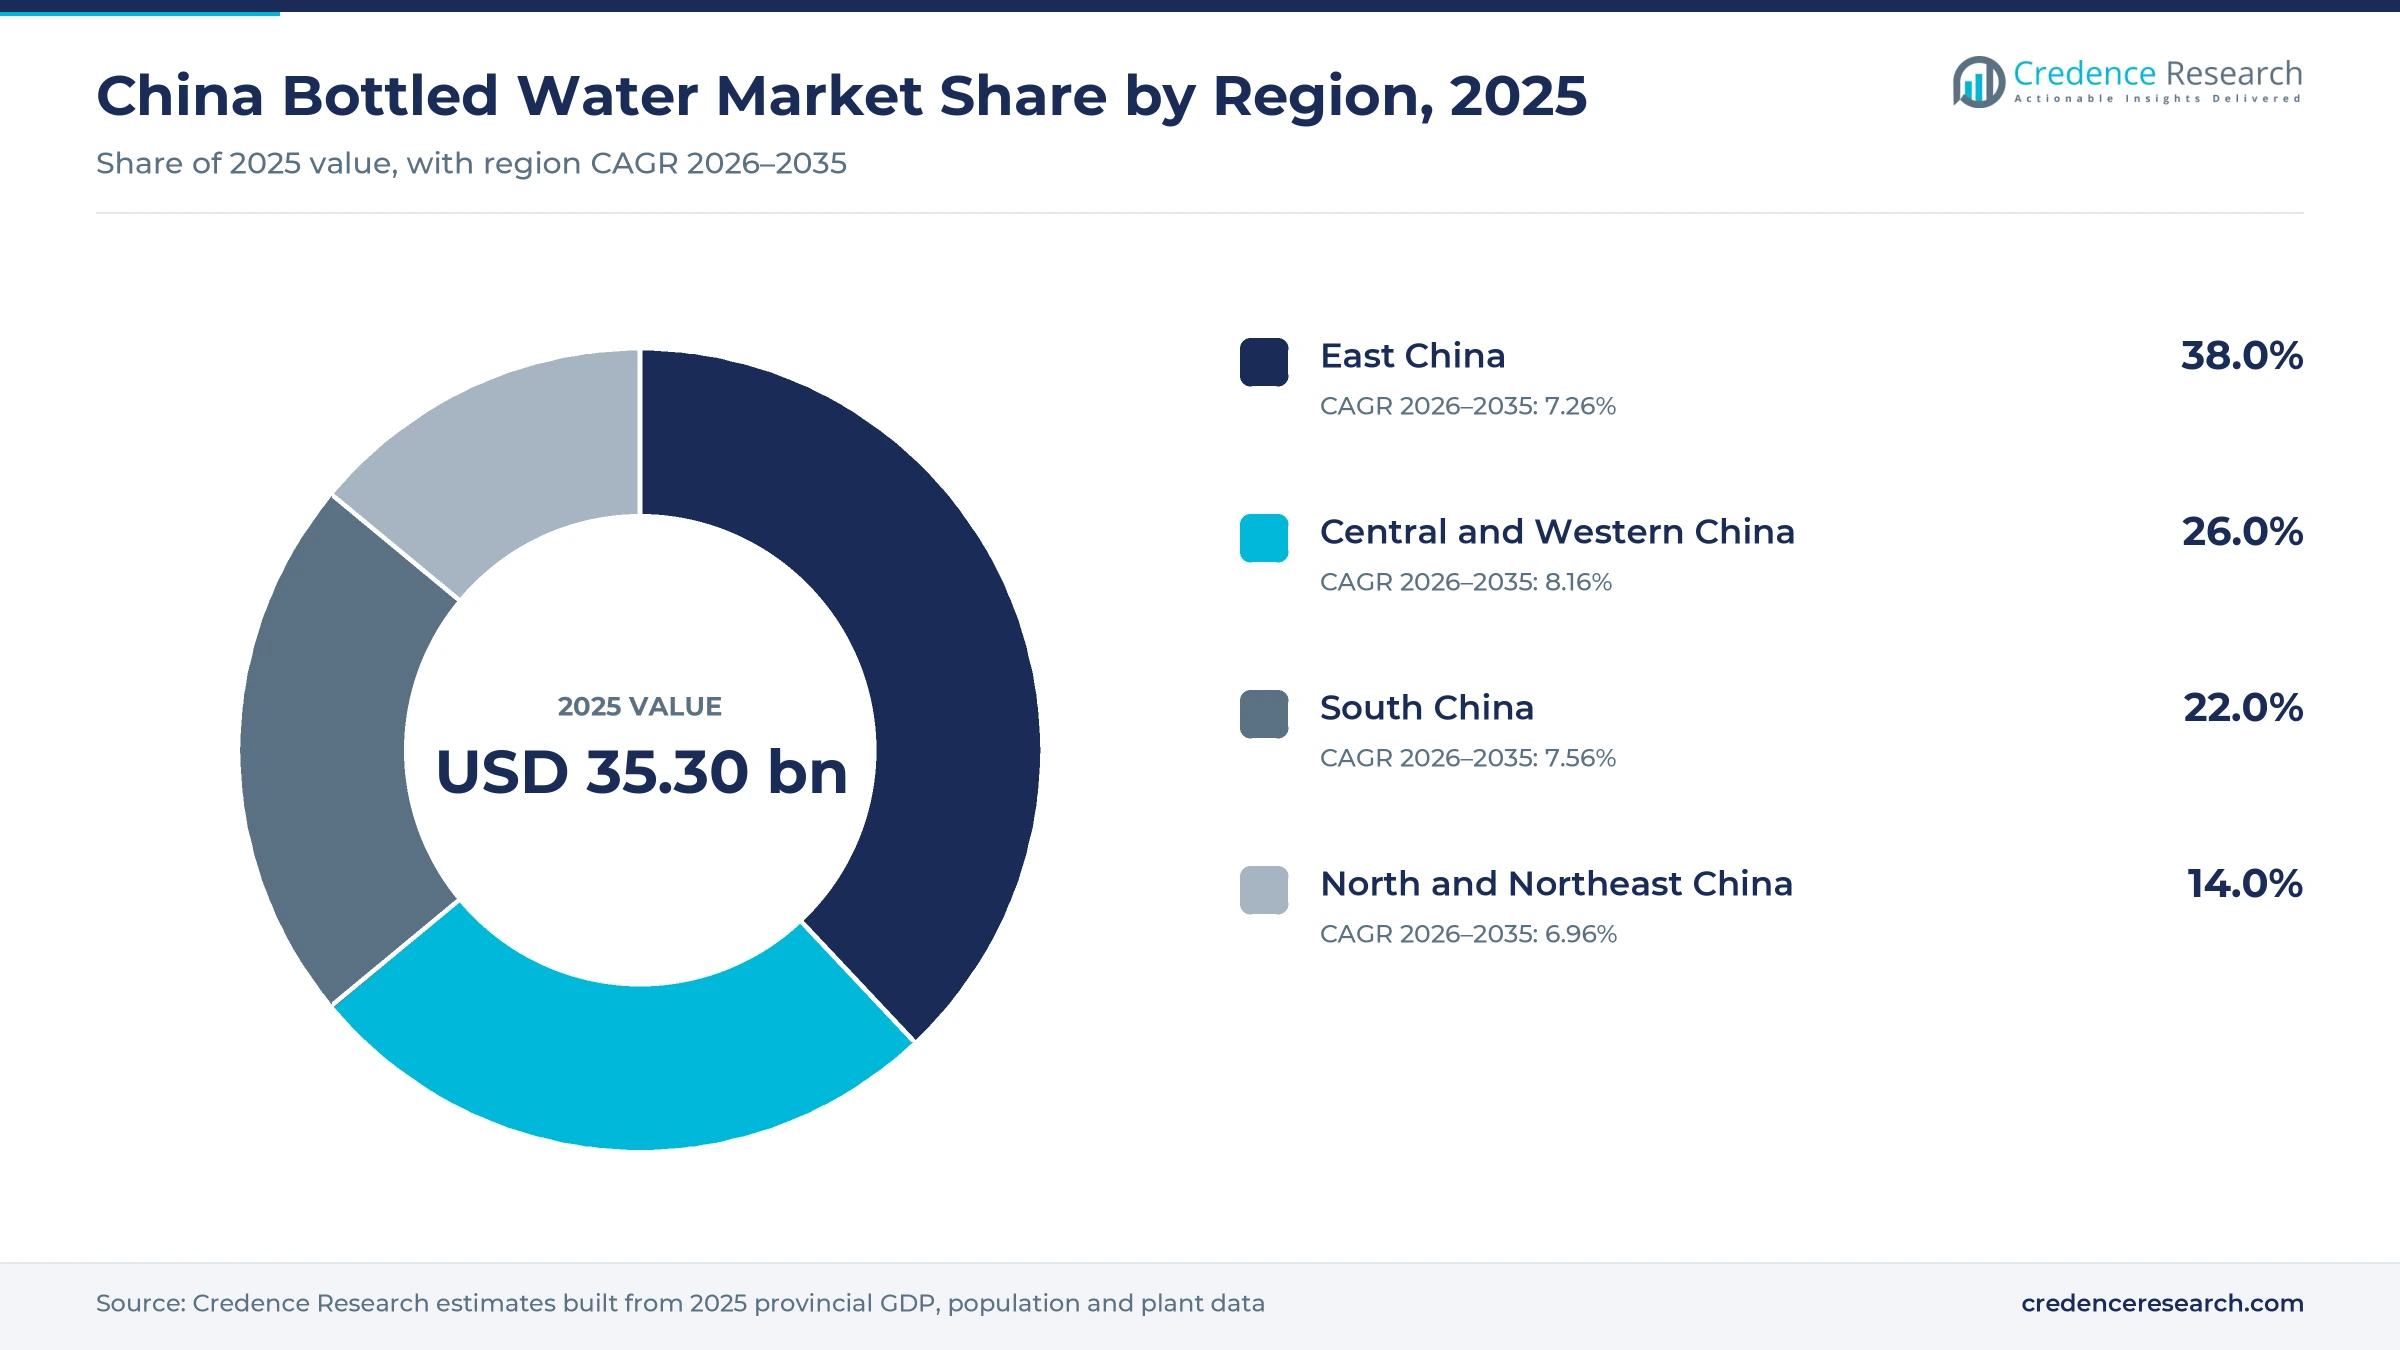
The China bottled water market was valued at USD 35.30 billion in 2025 and is projected to increase from USD 37.96 billion in 2026 to USD 72.89 billion by 2035, registering a CAGR of 7.52% during 2026–2035. Demand comes from urban households that buy branded packaged water for daily drinking, from offices and homes that use barreled water, and from travelers who buy single-serve bottles on the move. East China held the largest regional share, 38.0% in 2025, because Jiangsu, Zhejiang, Shandong and Shanghai combine high incomes with dense store networks. Central and Western China is the fastest-growing region at 8.2% a year, as new plants in Henan, Sichuan and Chongqing bring supply closer to inland buyers. The main commercial change is a price war that began in early 2024 and pushed the standard small bottle toward 1 yuan. As a result, leading bottlers now compete on owned water sources, larger packs and natural mineral water rather than on list price.
Which products and buyers does the China estimate cover?
The estimate measures the retail value of bottled water in China, including purified, natural and natural mineral water in still, flavored, functional and sparkling forms. It counts bottles, cans and barreled water sold through supermarkets, convenience stores, small shops, online platforms and hotels, restaurants and caterers in mainland China.
The estimate excludes tap water, home and office purifiers, dispenser equipment and exports to Hong Kong and Macao. The value chain runs from protected springs and municipal supply through filling plants and regional distributors to retailers, delivery platforms and the households, offices and travelers that drink the water.
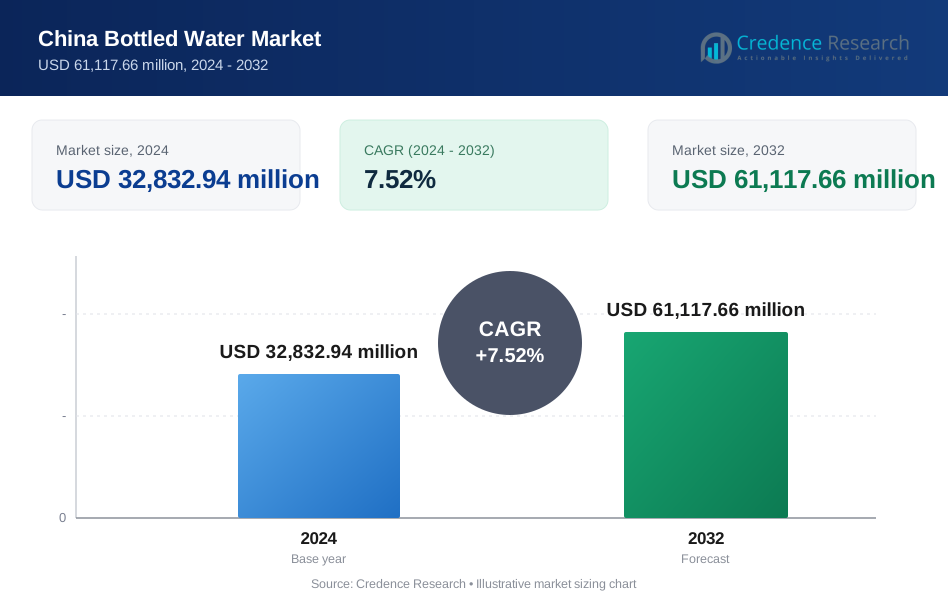
China Bottled Water Market Insights
- The China bottled water market was valued at USD 35.30 billion in 2025 and is projected to reach USD 72.89 billion by 2035, registering a CAGR of 7.52% during 2026–2035.
- East China held a 38.0% share of 2025 value, because Jiangsu, Zhejiang, Shandong and Shanghai together produced more than 39 trillion yuan of GDP in 2025.
- Purified water led sources with a 55.0% share of 2025 value, while natural mineral water grows fastest at 8.5% a year to 2035.
- A price war that began in early 2024 pushed small bottles toward 1 yuan, and Haoxianglai launched a 0.6-yuan natural water in May 2025.
- Nongfu Spring had 15 major water sources after adding three mountain sources in the first half of 2025, as leaders build plants close to buyers.
Purified water leads as mineral water grows fastest
Why does plain still water hold most of the value?
Based on product type, the market is categorized into unflavored still water, flavored and functional water, and sparkling water. Unflavored Still Water led with 84.0% of 2025 value, because the low-cost purified and natural bottles that fill store shelves are plain still water. China Resources Yibao alone sold more than 14.6 billion bottles of purified water in 2023, according to SIAL China. Flavored and Functional Water grows fastest at 8.9% a year, as buyers move toward traditional Chinese health waters, according to 36Kr. Genki Forest set up a red bean planting base in Heilongjiang to supply its Zizai Water line, the same 36Kr report said.
How does purified water keep the largest source share?
Based on source, the market is categorized into purified water, natural water and natural mineral water. Purified Water led with 55.0% of 2025 value, because GB 19298-2014, in force since May 24, 2015, sets one national rule for purified water that plants near any large city can meet. China Resources Yibao held 32.7% of purified water retail sales in 2023, according to SIAL China. Natural Mineral Water grows fastest at 8.5% a year, as Quan Yangquan sold 1.0357 million tons of mineral water in the first half of 2026, up 33.03%, according to 36Kr. Yibao also launched its 2-yuan Benyou natural mineral water in 2023.
Which pack sizes carry most bottled sales?
Based on packaging, the market is categorized into bottles up to 1 L, bottles above 1 L, bulk and barreled water, and cans. Bottles Up to 1 L led with 58.0% of 2025 value, because the 550 ml bottle is the standard single-serve format, including the green Nongfu Spring bottle launched at 2 yuan on April 23, 2024. Bottles Above 1 L grow fastest at 8.4% a year, as 1.5 to 2 liter bottles cost only 1 to 2 yuan more than small bottles, according to 36Kr. The USDA Beijing Agricultural Trade Office also reported a growing preference for 600 to 1,250 ml packs in its 2025 beverage report.
Where do Chinese buyers purchase packaged water?
Based on sales channel, the market is categorized into modern trade, traditional trade, online retail and HORECA. Modern Trade led with 41.0% of 2025 value, because supermarkets, convenience stores and membership warehouse chains carry case packs and private-label water. Offline outlets handled 90.6% of beverage sales in 2024, according to the USDA Beijing Agricultural Trade Office. Online Retail grows fastest at 9.2% a year, as online beverage sales grow at a 14% compound rate, the same report said. Online retail of physical goods also reached 26.1% of consumer goods sales in 2025.
| Segment Group | Leading Sub-segment | Share, 2025 | Fastest-growing Sub-segment | CAGR, 2026–2035 |
|---|---|---|---|---|
| By Product Type | Unflavored Still Water | 84.0% | Flavored and Functional Water | 8.9% |
| By Source | Purified Water | 55.0% | Natural Mineral Water | 8.5% |
| By Packaging | Bottles Up to 1 L | 58.0% | Bottles Above 1 L | 8.4% |
| By Sales Channel | Modern Trade | 41.0% | Online Retail | 9.2% |
Request a Free Sample
Fill in your details and we'll send you a free sample report.
- Sample data tables & charts
- Research methodology
Standards, new sources and travel lift water demand
How do national standards and city living lift branded demand?
Urban households rely on branded packaged water for daily drinking, because one national standard and large brands give buyers a consistent product. GB 19298-2014, which took effect on May 24, 2015, unified the rules for all packaged drinking water except natural mineral water, according to ChemLinked. China's urbanization rate reached 67.89% at the end of 2025, up 0.89 percentage points, according to the National Bureau of Statistics. China Resources Yibao sold more than 14.6 billion bottles of purified water in 2023, according to SIAL China. As a result, unflavored still water kept the largest product share, and purified water remained the leading source in 2025.
Why do new water sources and plants widen supply?
Leading bottlers are adding water sources and plants across provinces, which cuts freight costs and puts fresh stock closer to buyers. Nongfu Spring added the Badagong, Longmen and Nyenchen Tanglha mountain sources in the first half of 2025, giving it 15 major sources, according to its interim results. China Resources Beverage began production at a Wuyi Mountain source in Fujian in the first quarter of 2025, according to The Bamboo Works. Swire Coca-Cola started a beverage plant with one million tons of planned annual capacity in Zhengzhou in October 2025, according to Yicai Global. In turn, Central and Western China gains local supply and grows faster than the national market.
How does record domestic travel raise out-of-home sales?
Travel and dining away from home lift single-serve sales at stations, scenic sites, hotels and restaurants. Chinese residents made 6.52 billion domestic trips in 2025, up 16.2%, according to the Ministry of Culture and Tourism as reported by the Henan provincial government. Domestic tourist spending rose 9.5% to about 6.3 trillion yuan in the same year, the National Bureau of Statistics reported. Wahaha planned to focus on placing store freezers in 2024 to win more chilled point-of-sale purchases, according to SIAL China. As a result, HORECA buyers hold a steady share of value, and bottles up to 1 L led packaging with 58.0% of 2025 value.
Why do higher incomes support natural and mineral water?
Rising incomes let more households pay a small premium for natural and mineral water over the cheapest purified bottles. Per capita disposable income rose 5.0% to 43,377 yuan in 2025, and urban residents reached 56,502 yuan, according to the National Bureau of Statistics. Red-bottle natural water made up about 80% of Nongfu Spring's water sales in the first half of 2025, up from 70% in the second half of 2024, according to The Bamboo Works. Quan Yangquan's mineral water volume also rose 33.03% in the first half of 2026, according to 36Kr. In turn, natural water and natural mineral water both gain share from purified water through 2035.
One-yuan bottles, family packs and premium sources
How is the shift to 1-yuan pricing reshaping the shelf?
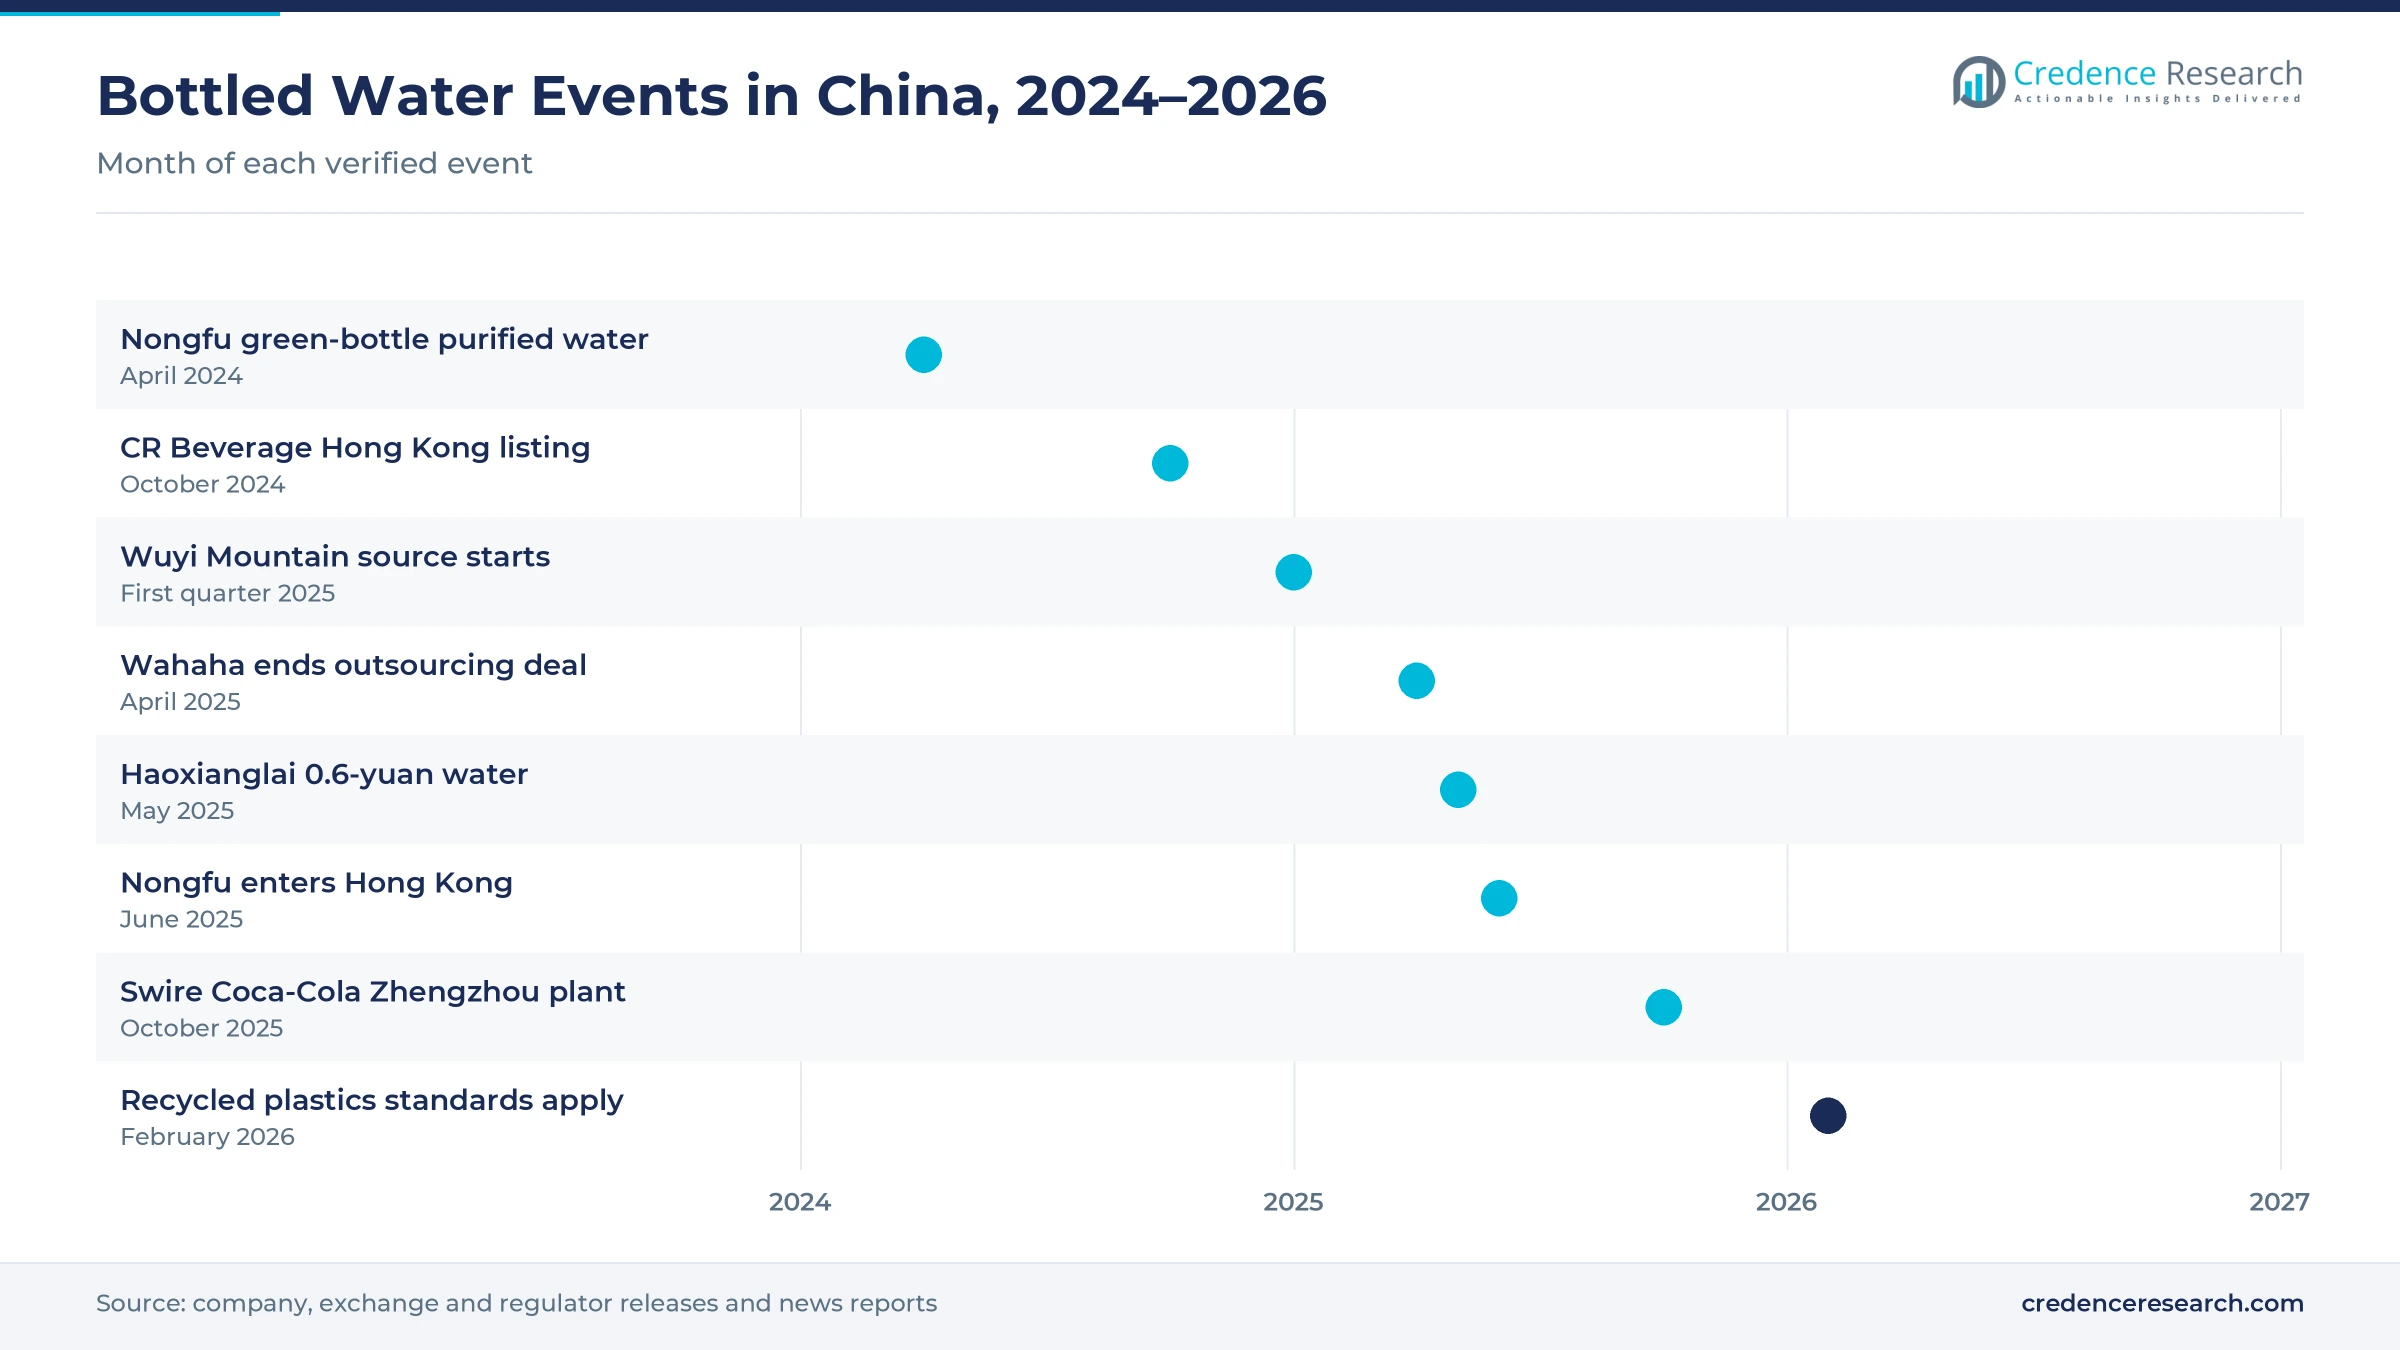
A price war that began in early 2024 has shifted the standard small bottle toward 1 yuan, which compresses value per liter across the category. Nongfu Spring sold its green-bottle purified water at 9.9 yuan for 12 bottles, about 1.21 yuan each, against a typical 2 yuan for C'estbon, according to The Bamboo Works. Haoxianglai launched a 0.6-yuan natural water in May 2025 and sold more than 120 million bottles by the end of 2025, according to 36Kr. Nongfu Spring's packaged water sales rose only 2.10% in the first half of 2026, the same report said. As a result, brands now compete on cost, freight and source stories rather than on list price.
Why is the rise of larger family packs notable?
Households are moving toward larger packs that lower the cost per liter and reduce plastic per serving. The USDA Beijing Agricultural Trade Office reported a growing preference for 600 to 1,250 ml packs, driven by value and lower plastic use, in its 2025 beverage market report. Bottles of 1.5 to 2 liters now cost only 1 to 2 yuan more than small bottles, according to 36Kr. Membership warehouse chains also stock private-label water in multipacks, the same USDA report said. In turn, bottles above 1 L grow fastest by packaging, while bulk and barreled water serves offices and home dispensers in large cities.
Can high-altitude mineral sources open a premium niche?
Protected mineral and glacier sources give brands a way out of the 1-yuan contest, which opens room for premium bottles above the mass shelf. Nongfu Spring added a Nyenchen Tanglha Mountain source in Xizang in the first half of 2025, according to its interim results. 5100 Xizang Glacier, a Tibetan glacier water bottler, returned to profit in 2025 after a loss in 2024, according to its annual results reported by Tiger Brokers on April 1, 2026. Chinese rules for natural mineral water also set stricter chemical limits than French rules, Yicai Global reported in February 2024. As a result, brands that own certified sources can price well above purified water.
Is fast delivery an opening for case and barreled sales?
Fast delivery opens a new route for heavy case packs and barreled water, which many buyers prefer not to carry home. Online retail sales of physical goods reached 13.09 trillion yuan in 2025, or 26.1% of consumer goods retail, according to the National Bureau of Statistics. Express parcels totaled 199.0 billion in 2025, the same communique showed. Online channels hold less than 10% of beverage sales but grow at a 14% compound rate, and Douyin beverage sales rose 65.2% in 2024, according to the USDA Beijing Agricultural Trade Office. In turn, online retail grows fastest by channel at 9.2% a year through 2035.
Price war margins, plastic rules and trust incidents
How does the price war squeeze bottler margins?
Nongfu Spring's water margin slipped to 33.78% in the first half of 2026 from 35.44% a year earlier, according to 36Kr, after 1-yuan bottles became the norm. Because Wahaha and Nongfu Spring both cut some bottles below 1 yuan, smaller regional bottlers face strong pressure and have little room to raise prices. As a result, many shift spending toward ready-to-drink tea and other higher-margin drinks. Leaders protect returns by owning sources and building plants near their buyers.
Why do new recycled plastics standards raise packaging costs?
The State Administration for Market Regulation issued nine recycled plastics standards, including rPET design and identification rules, that took effect on Feb. 1, 2026, according to Argus Media. Because the rules push bottlers to cut labels and adhesives and redesign bottle necks, packaging lines need new molds and testing. However, the standards may not cover food-contact use in the short term, so recycled PET cannot yet replace virgin resin in drinking bottles at scale, which limits savings.
How do quality and outsourcing incidents hurt brand trust?
Wahaha confirmed on May 15, 2025, that Jinmailang Foods had produced some of its purified water, and said the deal ended in April 2025 after quality control failures, according to Dao Insights. A Weibo topic on the response drew 63.16 million views within days. Because buyers pay for brand assurance, such incidents push them toward rivals with owned plants. As a result, leading bottlers now promote their own sources and factories on labels and in stores.
Why does flat beverage spending cap volume growth?
Retail sales of beverages by larger enterprises rose only 1.0% in 2025, according to the National Bureau of Statistics, while total consumer goods sales grew 3.7%. China's soft drink output also fell about 4.7% to roughly 179 million metric tons in 2025, MarketScreener reported from the same agency's data. Because the population declined by 3.39 million in 2025, the drinking base is no longer growing. In turn, bottlers must win share through value-added formats rather than volume alone.
East China leads as Central and Western China gains
| Region | Value, 2025 (USD billion) | Share, 2025 | CAGR, 2026–2035 |
|---|---|---|---|
| East China | 13.41 | 38.0% | 7.3% |
| Central and Western China | 9.18 | 26.0% | 8.2% |
| South China | 7.77 | 22.0% | 7.6% |
| North and Northeast China | 4.94 | 14.0% | 7.0% |
How do Jiangsu, Zhejiang and Shandong keep East China first?
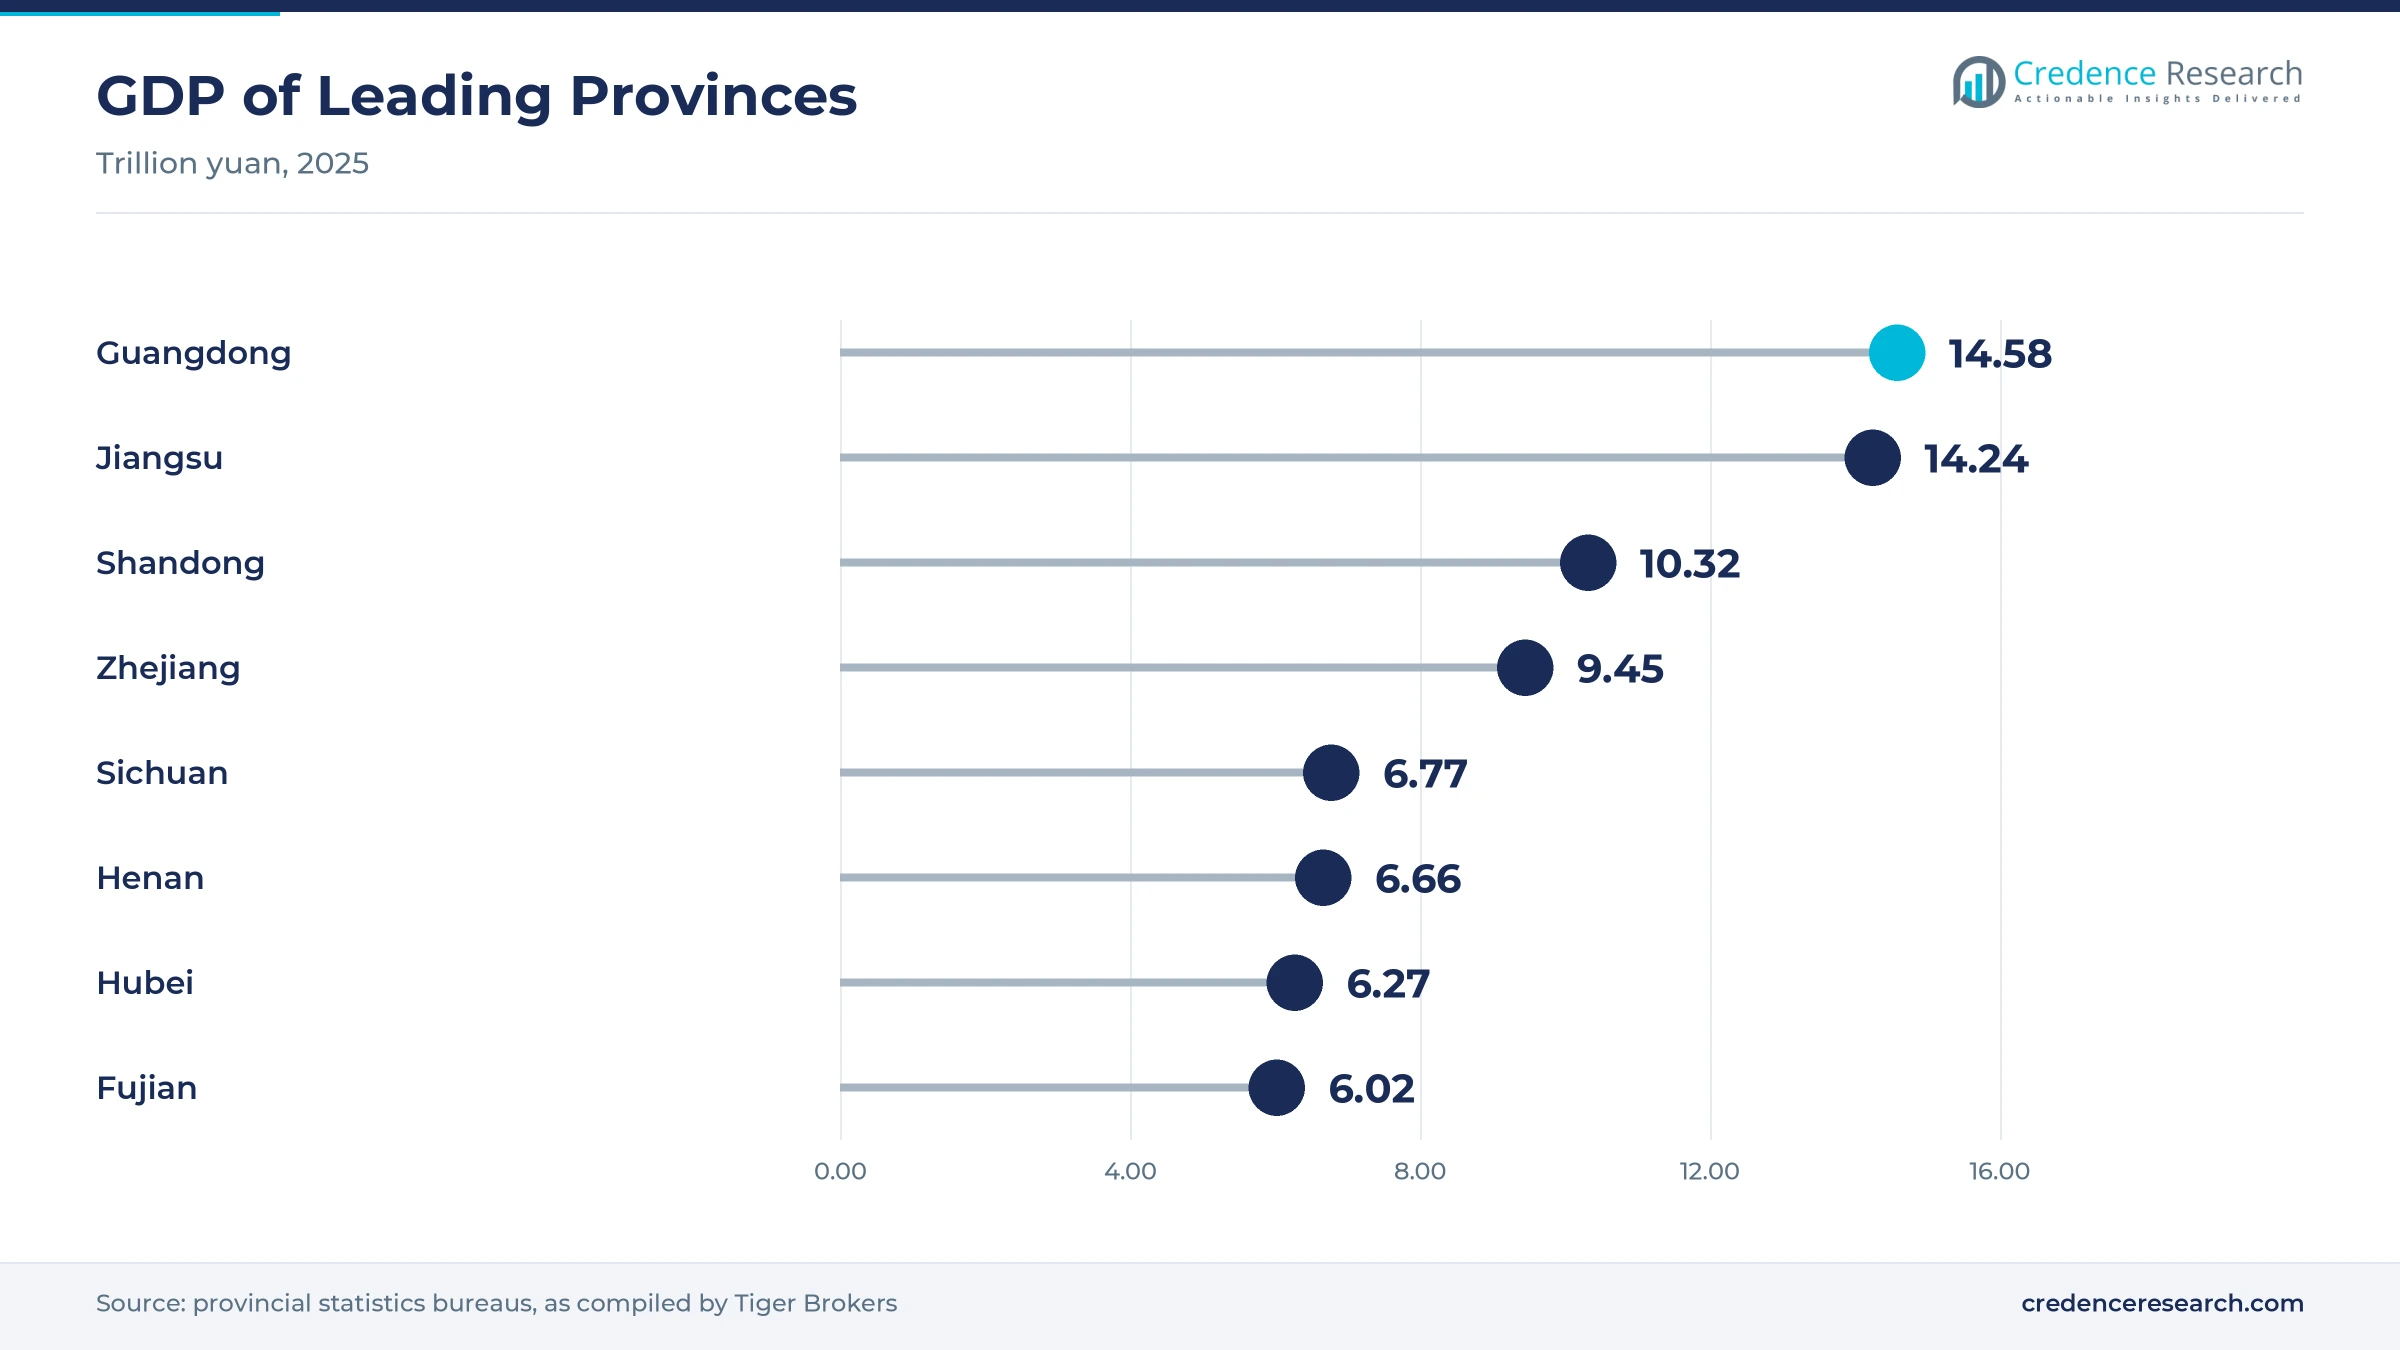
East China held 38.0% of 2025 value and grows at 7.3% a year, because Jiangsu, Shandong, Zhejiang and Shanghai produced about 14.24, 10.32, 9.45 and 5.67 trillion yuan of GDP in 2025, according to provincial statistics bureaus. Nongfu Spring plans a 5 billion yuan production base in Zhejiang, according to MarketScreener in May 2026. China Resources Beverage also scheduled its own Zhejiang factory to start in the fourth quarter of 2025. As a result, the zone has the densest supply of fresh stock and the strongest sales of premium natural water.
Why do Central and Western provinces grow fastest?
Central and Western China held 26.0% of 2025 value and grows fastest at 8.2% a year, because Sichuan, Henan and Hubei each produced between 6.2 and 6.8 trillion yuan of GDP in 2025, according to provincial statistics bureaus. Swire Coca-Cola opened its Zhengzhou plant in Henan in October 2025. China Resources Yibao also plans a one-million-ton drinking water plant in Chongqing, with construction from 2025 to 2028, and Jingtian planned a 500,000-ton project near Chengdu, according to SIAL China. In turn, inland cities gain local supply and shorter delivery routes.
How does Guangdong anchor South China demand?
South China held 22.0% of 2025 value and grows at 7.6% a year, because Guangdong was the largest provincial economy in 2025 at about 14.58 trillion yuan of GDP, according to provincial statistics bureaus. Nongfu Spring opened a Daming Mountain plant in Guangxi in 2023 with annual capacity above 500,000 tons, serving Guangxi, Guangdong, Guizhou and Yunnan, according to Asia Food Beverages. Swire Coca-Cola also expected its 1.3 billion yuan Guangzhou base to begin production in 2026, according to Yicai Global.
Why does North and Northeast China trail the national rate?
North and Northeast China held 14.0% of 2025 value and grows at 7.0% a year, because Beijing and Tianjin combine high incomes with large office populations that buy barreled water for dispensers. However, China's population fell by 3.39 million in 2025, according to the National Bureau of Statistics, and slower growth in the three northeastern provinces holds the zone below the national rate. Heilongjiang also supplies ingredients for flavored waters, as Genki Forest set up a red bean planting base there for its Zizai Water line.
Price cuts, listings and new plants, 2024 to 2025
| Development | Status and market relevance |
|---|---|
| In April 2024, Nongfu Spring launched a green-bottle purified water in 550 ml bottles at a retail price of 2 yuan. | Opened the low-price contest in purified water |
| In October 2024, China Resources Beverage, owner of the C'estbon brand, listed on the Hong Kong stock exchange. | Funds new plants and water sources |
| In May 2025, Haoxianglai launched a 0.6-yuan natural water for the mass market. | More than 120 million bottles sold by the end of 2025 |
| In June 2025, Nongfu Spring launched its natural drinking water in Hong Kong across more than 3,500 outlets. | First step beyond the mainland |
| In October 2025, Swire Coca-Cola opened its Zhengzhou plant, the first project under a 12 billion yuan investment plan. | One million tons of planned annual capacity |
Purification, source bottling and lighter PET bottles
- Multi-stage filtration and reverse osmosis turn municipal supply into purified water that meets GB 19298-2014, which is why purified plants can sit near large cities.
- Source-side bottling fills natural and mineral water at protected springs, which is why leaders open plants beside new mountain sources.
- Lightweight PET preforms cut resin per bottle and freight weight, which links bottlers closely to the wider liquid packaging supply chain.
- High-speed blow-fill-cap lines form, fill and seal bottles in one closed run, which lowers cost per unit in the 1-yuan price tier.
- Barrel washing and refill systems clean and reuse large barrels for offices and homes, which keeps delivered water costs low.
Need a Custom Version of This Report?
Tailor the scope, geography, or segments to your exact requirements.
- Custom geography or segment scope
- Direct access to our analyst team
Owned sources and plant networks separate the leaders
Competition centers on owned water sources, plant networks close to buyers, distributor reach and price, because most products sell for 1 to 2 yuan a bottle. Nongfu Spring is the largest seller and had 15 major water sources in 2025, while China Resources Beverage ranks second with its C'estbon brand and 13 plants plus 31 partner factories at its 2024 listing. Wahaha held a 16.79% share of the bottled water market as of January 2025, according to Dao Insights. Master Kong has sold boiled drinking water since April 2020, and Swire Coca-Cola is adding beverage plants in Henan and Guangdong. Quan Yangquan and 5100 Xizang Glacier compete in mineral and glacier water, Genki Forest popularized sparkling water before more than 30 brands followed, and Tsingtao Brewery Group bought the Nestle China water business in 2020. As a result, companies that own sources and run their own plants win the most shelf space.
Companies profiled and their roles in this market
| Company | Type | Role in the market |
|---|---|---|
| Nongfu Spring | Natural water bottler | 15 major water sources; green-bottle purified water launched in April 2024 |
| China Resources Beverage (C’estbon) | Purified water bottler | Hong Kong listing in October 2024; Wuyi Mountain source in 2025 |
| Hangzhou Wahaha Group | Purified water bottler | 16.79% share as of January 2025; ended outsourcing in April 2025 |
| Master Kong (Tingyi Holding Corp.) | Beverage group | Boiled drinking water line since April 2020 |
| Swire Coca-Cola | Bottler | Zhengzhou plant opened in October 2025; Guangzhou base due in 2026 |
| 5100 Xizang Glacier (Tibet Water Resources Ltd.) | Glacier water bottler | Returned to profit in 2025 |
| Quan Yangquan | Mineral water bottler | 1.0357 million tons sold in the first half of 2026 |
| Genki Forest | Sparkling and functional drinks | Five production bases; Zizai Water red bean line |
| Jinmailang Foods | Own-brand and contract bottler | Liangbaikai boiled drinking water under its own brand, plus contract bottling |
| Tsingtao Brewery Group | Brewer and water owner | Bought the Nestle China water business in 2020 |
Credence Research view on Chinese packaged water
Credence Research's view is that the China bottled water market will keep adding value even as the 1-yuan bottle sets the mass price, because buyers trade up to natural and mineral water and larger packs. Purified water keeps the largest source share, while natural mineral water gains ground through 2035. East China stays the largest zone, while Central and Western China grows fastest as new plants open inland. Companies that own protected sources, run plants near buyers and keep quality incidents away from their brands should win the most share.
Official statistics and company data anchor the model
The report uses 2025 as the base year on a calendar basis, and market values come from the Credence Research model. The 2025 value updates the earlier 2024 estimate with the model growth rate and is checked against category retail data, company volumes and typical shelf prices. Segment splits and zone shares and growth rates are Credence Research estimates. Sources used are National Bureau of Statistics data, government and regulator releases, stock exchange filings, company releases and news reports, and no interviews or surveys were used.
Mineral water and larger packs carry value to 2035
The China bottled water market is expected to reach USD 72.89 billion by 2035, a 7.52% CAGR during 2026–2035, as natural mineral water, larger packs and online delivery add value beyond the 1-yuan bottle. Growth should hold through 2028 as new plants in Henan, Chongqing and Zhejiang start up and cut delivery costs. After that, premium sources and recycled packaging rules will set the pace. A longer price war would slow value growth, while clear rPET food-contact rules would lower packaging costs for bottlers.
Frequently Asked Questions
How big is the China bottled water market?
Which source type leads bottled water in China?
Which region leads the China market?
What is Nongfu Spring's position in China's bottled water market?
Which Chinese bottled water brands lead the market?
How has the price war changed bottle prices?
Is there a premium bottled water segment in China?
What are the main challenges for the market?
Table of Content
Chapter 1 Market Segmentation
- 1.1 Segmentation Framework
- 1.1.1 Product and Service Classification
- 1.1.2 Application and End-Use Classification
- 1.1.3 Technology and Solution Classification
- 1.1.4 Customer and Distribution Channel Classification
- 1.1.5 Geographic Segmentation
- 1.1.6 Market Segment Definitions and Boundaries
- 1.2 By Product Type
- 1.2.1 Unflavored Still Water
- 1.2.2 Flavored and Functional Water
- 1.2.3 Sparkling Water
- 1.3 By Source
- 1.3.1 Purified Water
- 1.3.2 Natural Water
- 1.3.3 Natural Mineral Water
- 1.4 By Packaging
- 1.4.1 Bottles Up to 1 L
- 1.4.2 Bottles Above 1 L
- 1.4.3 Bulk and Barreled Water
- 1.4.4 Cans
- 1.5 By Sales Channel
- 1.5.1 Modern Trade
- 1.5.2 Traditional Trade
- 1.5.3 Online Retail
- 1.5.4 HORECA
Chapter 2 Introduction
- 2.1 Report Objectives and Scope
- 2.2 Product Definition and Industry Terminology
- 2.3 Market Inclusions and Exclusions
- 2.4 Research Process
- 2.4.1 Primary Research and Expert Interviews
- 2.4.2 Secondary Research and Source Review
- 2.4.3 Top-Down and Bottom-Up Estimation
- 2.4.4 Data Triangulation and Verification
- 2.5 Market Size Measurement Basis
- 2.5.1 2025: USD 35.30 billion → 2035: USD 72.89 billion
- 2.6 Historical and Forecast Reference Periods
- 2.6.1 Historical Period: 2018-2025
- 2.6.2 Base Year: 2025
- 2.6.3 Forecast Period: 2025-2035
- 2.7 Research Assumptions and Limitations
Chapter 3 Executive Summary
- 3.1 Market Snapshot and Key Findings
- 3.2 Base-Year Market Size, 2025
- 3.3 Forecast Market Size, 2035
- 3.4 Revenue and Volume Growth Outlook
- 3.5 Key Demand and Supply Indicators
- 3.6 Leading Market Segments
- 3.7 Fastest-Growing Market Opportunities
- 3.8 Regional Performance Highlights
- 3.9 Technology and Industry Transformation
- 3.10 Competitive Landscape Summary
- 3.11 Analyst View and Strategic Implications
Chapter 4 China Bottled Water Market Trends and Developments
- 4.1 Historical Industry Development, 2018-2025
- 4.2 Recent Market Trends and Developments
- 4.3 Demand and Customer Behavior Trends
- 4.4 Technology and Product Innovation
- 4.5 Artificial Intelligence, Automation and Digitalization
- 4.6 Local Manufacturing and Supply Chain Realignment
- 4.7 Industry Partnerships, Mergers and Acquisitions
- 4.8 Sustainability and Circular Economy Developments
- 4.9 Government and Private Sector Investment Trends
- 4.10 Emerging Business Models and Commercialization
- 4.11 Industry Developments and Announcements
Chapter 5 China Bottled Water Market Production, Supply and Demand Analysis
- 5.1 Demand Trend and Consumption Analysis, 2018-2025
- 5.2 Demand Forecast, 2025-2035
- 5.3 Production and Output Trend, 2018-2025
- 5.4 Production and Output Forecast, 2025-2035
- 5.5 Installed Capacity and Capacity Utilization
- 5.6 Company-Wise Production Plants and Statistics
- 5.6.1 Installed Production Capacity
- 5.6.2 Actual Production
- 5.6.3 Planned Capacity and Expansion Targets
- 5.7 Supply Chain Structure and Procurement Trends
- 5.8 Supply-Demand Gap and Bottlenecks
- 5.9 Import Dependence and Sourcing Structure
- 5.10 Contract Manufacturing and Outsourcing
- 5.11 Regional Supply and Demand Concentration
Chapter 6 China Bottled Water Market Pricing Analysis
- 6.1 Pricing Structure and Measurement
- 6.2 Historical Pricing Trends, 2018-2025
- 6.3 Pricing Outlook, 2025-2035
- 6.4 Average Selling Price and Unit Economics
- 6.5 Pricing by Product and Market Segment
- 6.6 Geographic Pricing Differences
- 6.7 Key Input, Energy, Labor and Logistics Costs
- 6.8 Contract Pricing and Purchasing Models
- 6.9 Pricing Sensitivity and Competitive Positioning
- 6.10 Price, Margin and Profitability Implications
Chapter 7 China Bottled Water Market Dynamics
- 7.1 Market Growth Drivers
- 7.1.1 Demand-Side Drivers
- 7.1.2 Technology and Innovation Drivers
- 7.1.3 Infrastructure and Investment Drivers
- 7.1.4 Regulatory and Policy Drivers
- 7.2 Market Restraints
- 7.2.1 Cost and Affordability Constraints
- 7.2.2 Technology and Adoption Barriers
- 7.2.3 Supply Chain and Operational Constraints
- 7.3 Market Challenges
- 7.3.1 Competitive Pressure and Margin Erosion
- 7.3.2 Skills, Infrastructure and Implementation Gaps
- 7.4 Emerging Market Opportunities
- 7.5 Market Dynamics Impact and Time-Horizon Assessment
Chapter 8 China Bottled Water Value Chain Analysis
- 8.1 Industry Value Chain Overview
- 8.2 Upstream Suppliers and Critical Inputs
- 8.3 Technology and Component Providers
- 8.4 Manufacturing or Service Delivery
- 8.5 Distribution, Channel Partners and Integrators
- 8.6 Downstream Applications and End Users
- 8.7 Value Addition and Profit Pools
- 8.8 Vertical Integration and Outsourcing
- 8.9 Supplier Concentration and Risk
- 8.10 Supply Chain Localization and Resilience
Chapter 9 China Bottled Water Market Regulations and Policies
- 9.1 Relevant Laws, Standards and Compliance Frameworks
- 9.2 Product, Service, Safety and Quality Requirements
- 9.3 Government Policies, Incentives and Subsidies
- 9.4 Imports, Exports and Trade Barriers
- 9.5 Public Procurement and Local Content Requirements
- 9.6 Environmental and Sustainability Compliance
- 9.7 Upcoming Policy Changes and Market Implications
Chapter 10 China Bottled Water Market Hotspots and Opportunities
- 10.1 Market Opportunity Mapping and Growth Hotspots
- 10.2 High-Growth Applications and Customer Groups
- 10.3 Underserved Markets and White-Space Opportunities
- 10.4 Emerging Technology and Product Opportunities
- 10.5 New Capacity and Investment Hotspots
- 10.6 Market Entry and Expansion Opportunities
- 10.7 Distribution and Partnership Opportunities
- 10.8 Near-Term and Long-Term Commercial Potential
- 10.9 Opportunity Attractiveness and Execution Risks
Chapter 11 China Bottled Water Market Outlook, 2025-2035
- 11.1 Market Size and Analysis
- 11.1.1 Revenue (Market Measurement: 2025: USD 35.30 billion → 2035: USD 72.89 billion)
- 11.1.2 Market Volume and Quantity Sold
- 11.1.3 Historical Market Size, 2018-2025
- 11.1.4 Base-Year Market Size, 2025
- 11.2 Market Forecast, 2025-2035
- 11.2.1 Revenue Forecast to 2035
- 11.2.2 Volume Forecast to 2035
- 11.2.3 CAGR and Year-on-Year Growth
- 11.2.4 Incremental Revenue Opportunity
- 11.3 Forecast Assumptions and Scenario Analysis
- 11.3.1 Base-Case Forecast
- 11.3.2 Optimistic and Conservative Scenarios
- 11.3.3 Technology, Pricing and Policy Sensitivities
- 11.4 Market Attractiveness and Growth Outlook
Chapter 12 China Bottled Water Market Segmentation and Outlook
- 12.1 Segmentation Summary and Market Shares, 2025
- 12.2 Largest and Fastest-Growing Segments
- 12.3 By Product Type - Market Size and Forecast, 2025-2035
- 12.3.1 Segment Definition and Scope
- 12.3.2 Historical Market Size, 2018-2025
- 12.3.3 Revenue Forecast, 2025-2035
- 12.3.4 Volume Forecast, 2025-2035
- 12.3.5 Base-Year Market Share, 2025
- 12.3.6 Segment CAGR and Growth Drivers
- 12.3.7 Subsegment Market Size and Forecast
- 12.3.7.1 Unflavored Still Water
- 12.3.7.2 Flavored and Functional Water
- 12.3.7.3 Sparkling Water
- 12.3.8 Subsegment Pricing and Adoption Trends
- 12.3.9 Leading Suppliers and Competition
- 12.3.10 Regional Demand and Opportunities
- 12.4 By Source - Market Size and Forecast, 2025-2035
- 12.4.1 Segment Definition and Scope
- 12.4.2 Historical Market Size, 2018-2025
- 12.4.3 Revenue Forecast, 2025-2035
- 12.4.4 Volume Forecast, 2025-2035
- 12.4.5 Base-Year Market Share, 2025
- 12.4.6 Segment CAGR and Growth Drivers
- 12.4.7 Subsegment Market Size and Forecast
- 12.4.7.1 Purified Water
- 12.4.7.2 Natural Water
- 12.4.7.3 Natural Mineral Water
- 12.4.8 Subsegment Pricing and Adoption Trends
- 12.4.9 Leading Suppliers and Competition
- 12.4.10 Regional Demand and Opportunities
- 12.5 By Packaging - Market Size and Forecast, 2025-2035
- 12.5.1 Segment Definition and Scope
- 12.5.2 Historical Market Size, 2018-2025
- 12.5.3 Revenue Forecast, 2025-2035
- 12.5.4 Volume Forecast, 2025-2035
- 12.5.5 Base-Year Market Share, 2025
- 12.5.6 Segment CAGR and Growth Drivers
- 12.5.7 Subsegment Market Size and Forecast
- 12.5.7.1 Bottles Up to 1 L
- 12.5.7.2 Bottles Above 1 L
- 12.5.7.3 Bulk and Barreled Water
- 12.5.7.4 Cans
- 12.5.8 Subsegment Pricing and Adoption Trends
- 12.5.9 Leading Suppliers and Competition
- 12.5.10 Regional Demand and Opportunities
- 12.6 By Sales Channel - Market Size and Forecast, 2025-2035
- 12.6.1 Segment Definition and Scope
- 12.6.2 Historical Market Size, 2018-2025
- 12.6.3 Revenue Forecast, 2025-2035
- 12.6.4 Volume Forecast, 2025-2035
- 12.6.5 Base-Year Market Share, 2025
- 12.6.6 Segment CAGR and Growth Drivers
- 12.6.7 Subsegment Market Size and Forecast
- 12.6.7.1 Modern Trade
- 12.6.7.2 Traditional Trade
- 12.6.7.3 Online Retail
- 12.6.7.4 HORECA
- 12.6.8 Subsegment Pricing and Adoption Trends
- 12.6.9 Leading Suppliers and Competition
- 12.6.10 Regional Demand and Opportunities
- 12.7 Segment Growth Comparison
- 12.8 Segment Attractiveness and Priority Matrix
Chapter 13 China Bottled Water Geographic Market Outlook, 2025-2035
- 13.1 Domestic Market Distribution and Demand Clusters
- 13.2 State- or Province-Wise Market Size and Forecast, 2025-2035
- 13.3 City and Metropolitan Market Outlook
- 13.4 Industrial, Manufacturing and Commercial Clusters
- 13.5 Geographic Concentration of Key End Users
- 13.6 Local Pricing and Purchasing Differences
- 13.7 Domestic Production Facilities and Capacity Map
- 13.8 Local Infrastructure and Project Pipeline
- 13.9 State-Level Policy and Incentive Differences
- 13.10 Subnational Investment Hotspots and Opportunities
- 13.11 Distribution and Logistics Networks
- 13.12 Domestic Competitive Footprint
Chapter 14 China Bottled Water Technology, Innovation and Sustainability Outlook
- 14.1 Technology Landscape and Maturity
- 14.2 Product, Process and Service Innovation
- 14.3 AI, Automation and Digital Tools in the Industry
- 14.4 Technology Adoption and Performance Benchmarking
- 14.5 Innovation Pipeline and R&D Investment
- 14.6 Patent and Intellectual Property Trends
- 14.7 Energy Efficiency and Resource Management
- 14.8 Sustainability, Recycling and Circularity
- 14.9 Technology Roadmap, 2025-2035
- 14.10 Risks of Obsolescence and Technology Substitution
Chapter 15 China Bottled Water Market Key Strategic Imperatives
- 15.1 Growth and Market Entry Priorities
- 15.2 High-Return Products and Segments
- 15.3 Pricing, Profitability and Cost Optimization
- 15.4 Technology Investment and Product Differentiation
- 15.5 Supply Chain Localization and Resilience
- 15.6 Distribution and Customer Acquisition
- 15.7 Partnership, Acquisition and Capacity Strategy
- 15.8 Regional Expansion Priorities
- 15.9 Short-, Medium- and Long-Term Actions
Chapter 16 Competition Outlook
- 16.1 Industry Competition Characteristics
- 16.2 Market Structure and Concentration
- 16.3 Market Share and Competitive Positioning, 2025
- 16.4 Company-Wise Revenue and Product Benchmarking
- 16.5 Production and Service Capacity Benchmarking
- 16.6 Technology, Pricing and Differentiation
- 16.7 Regional Footprint and Distribution Strength
- 16.8 Mergers, Acquisitions and Strategic Alliances
- 16.9 New Entrants and Competitive Threats
- 16.10 Porter's Five Forces and Industry Attractiveness
- 16.11 Competitive Outlook, 2025-2035
Chapter 17 Company Profiles
- 17.1 Company Coverage and Selection Criteria
- 17.2 Nongfu Spring
- 17.2.1 Business Description
- 17.2.2 Company Ownership and Geographic Presence
- 17.2.3 Product and Service Portfolio
- 17.2.4 Manufacturing and Operating Footprint
- 17.2.5 Production Capacity and Expansion Plans
- 17.2.6 Financial Performance and Investment
- 17.2.7 Market Share and Competitive Position
- 17.2.8 Technology and Innovation Capabilities
- 17.2.9 Strategic Alliances or Partnerships
- 17.2.10 Recent Developments
- 17.2.11 Growth Strategy and Outlook
- 17.3 China Resources Beverage (C’estbon)
- 17.4 Hangzhou Wahaha Group
- 17.5 Master Kong (Tingyi Holding Corp.)
- 17.6 Swire Coca-Cola
- 17.7 5100 Xizang Glacier (Tibet Water Resources Ltd.)
- 17.8 Quan Yangquan
- 17.9 Genki Forest
- 17.10 Jinmailang Foods
- 17.11 Tsingtao Brewery Group
- 17.12 Other Relevant Market Participants
Note: Every listed company is profiled on the structure shown under the first company. The company list is preliminary and may change based on research findings, market developments, data availability and client requirements.
Chapter 18 Disclaimer
- 18.1 Research and Forecast Disclaimer
- 18.2 Data Source and Estimation Limitations
Note: The depth of individual sections depends on data availability for this market. Volume, capacity, trade and other unit-based metrics are included where applicable.

