Collectible culture turns surprise packs into a global habit
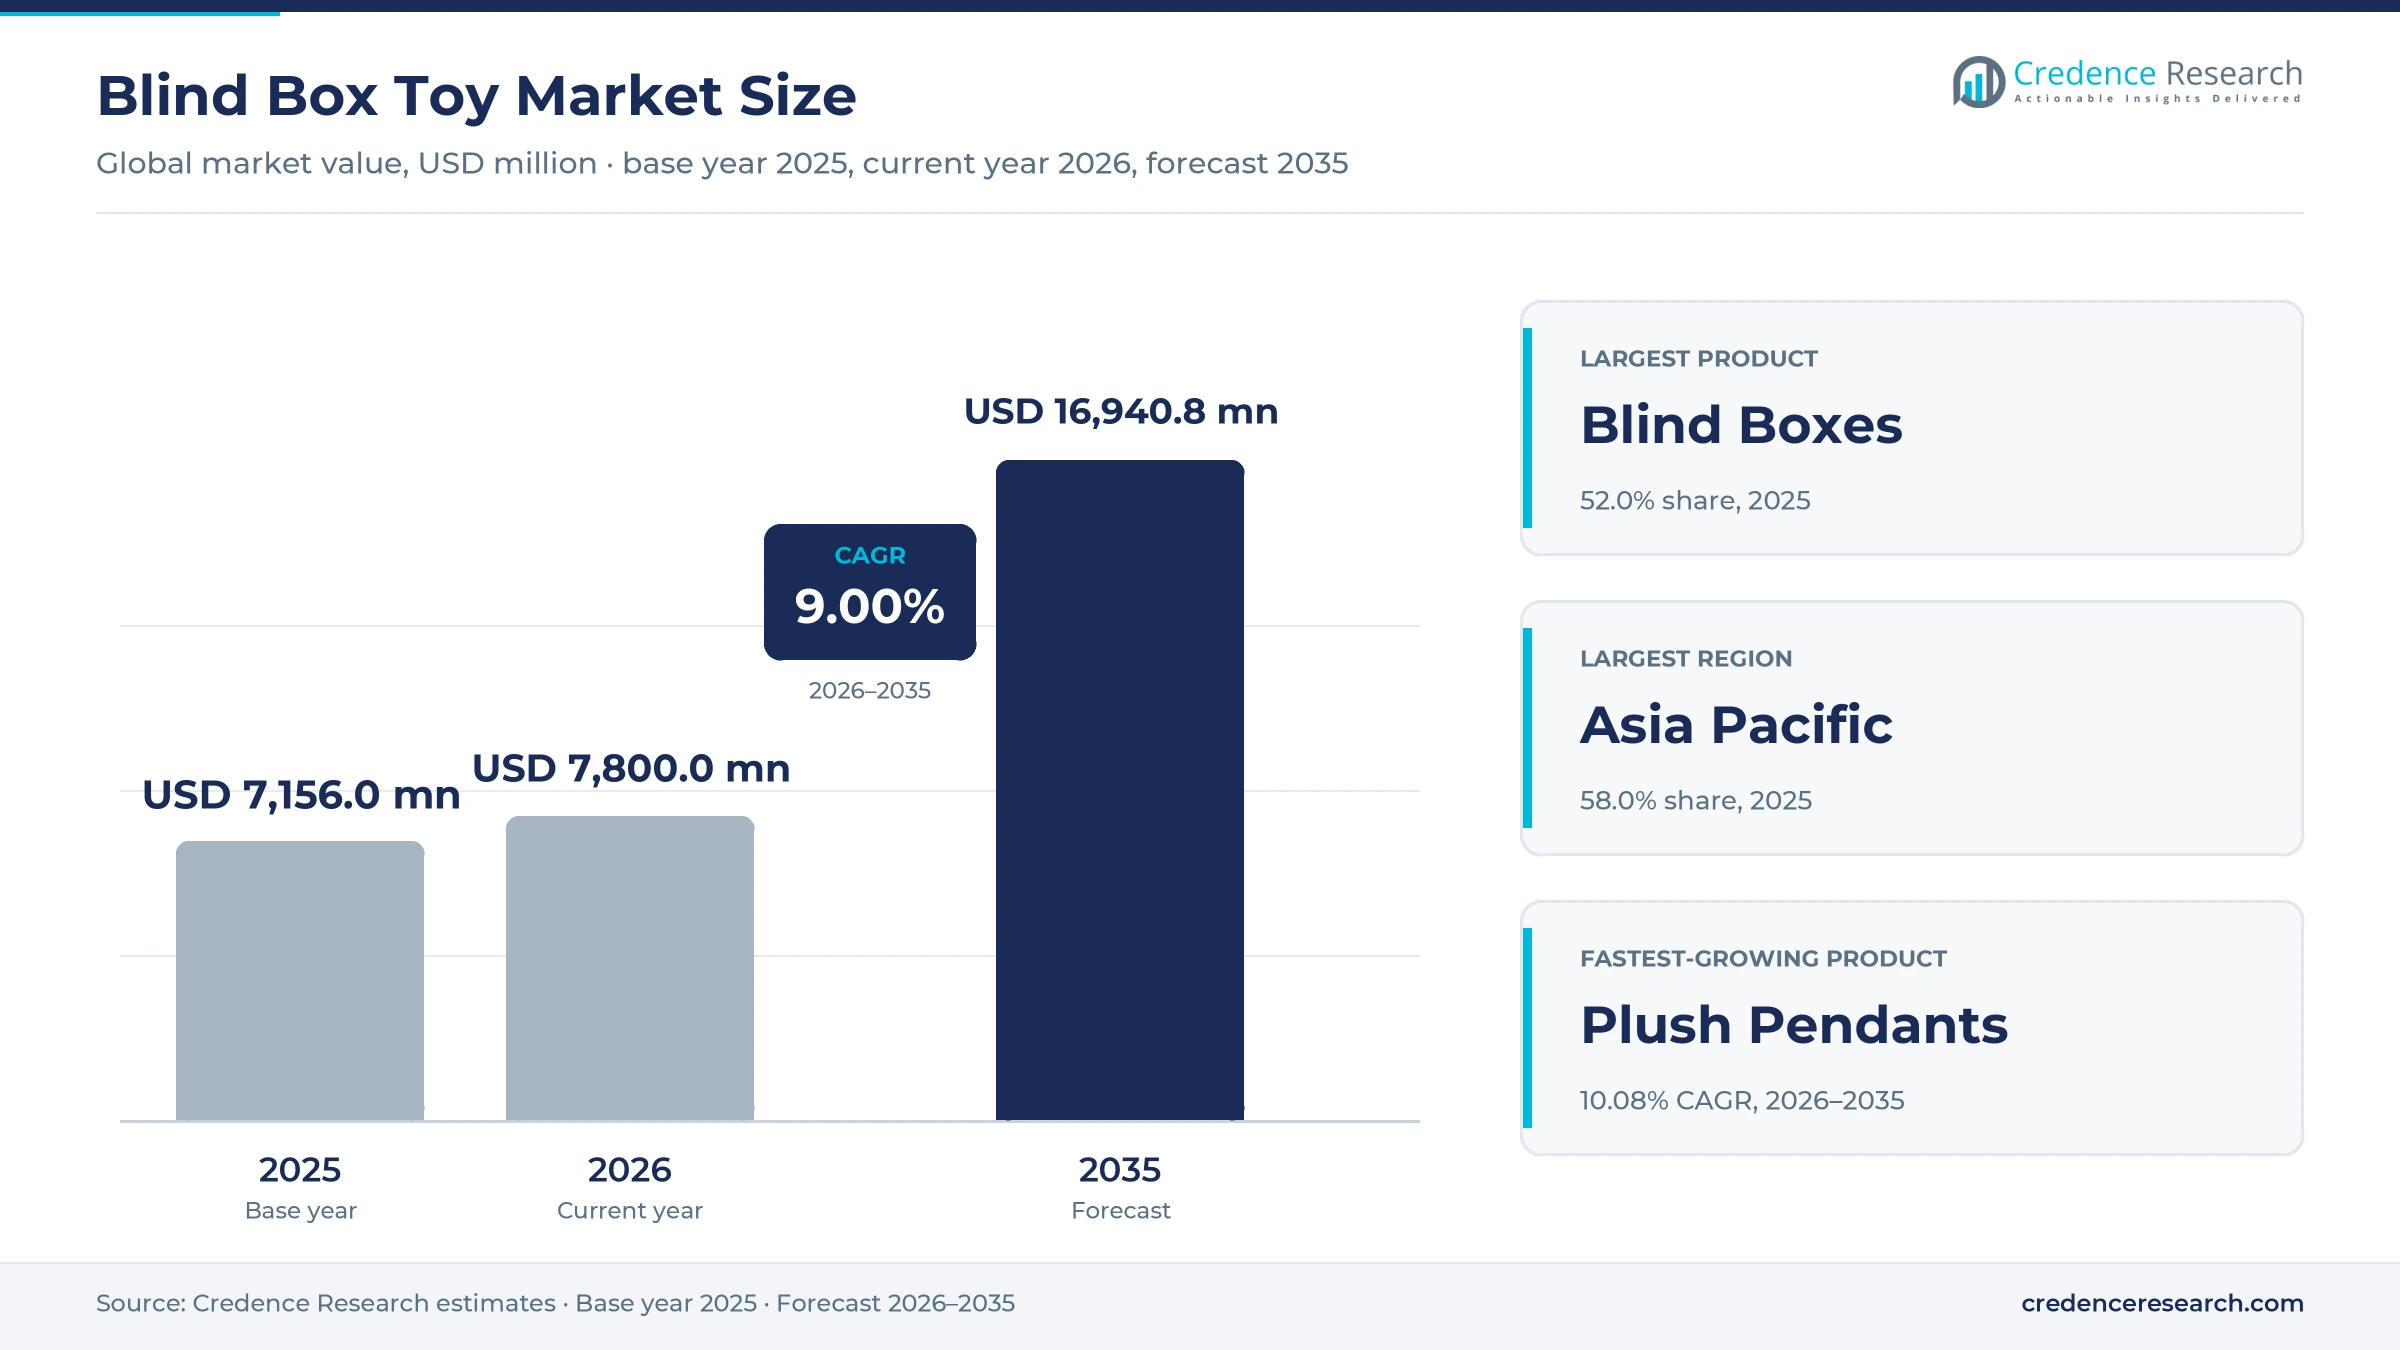
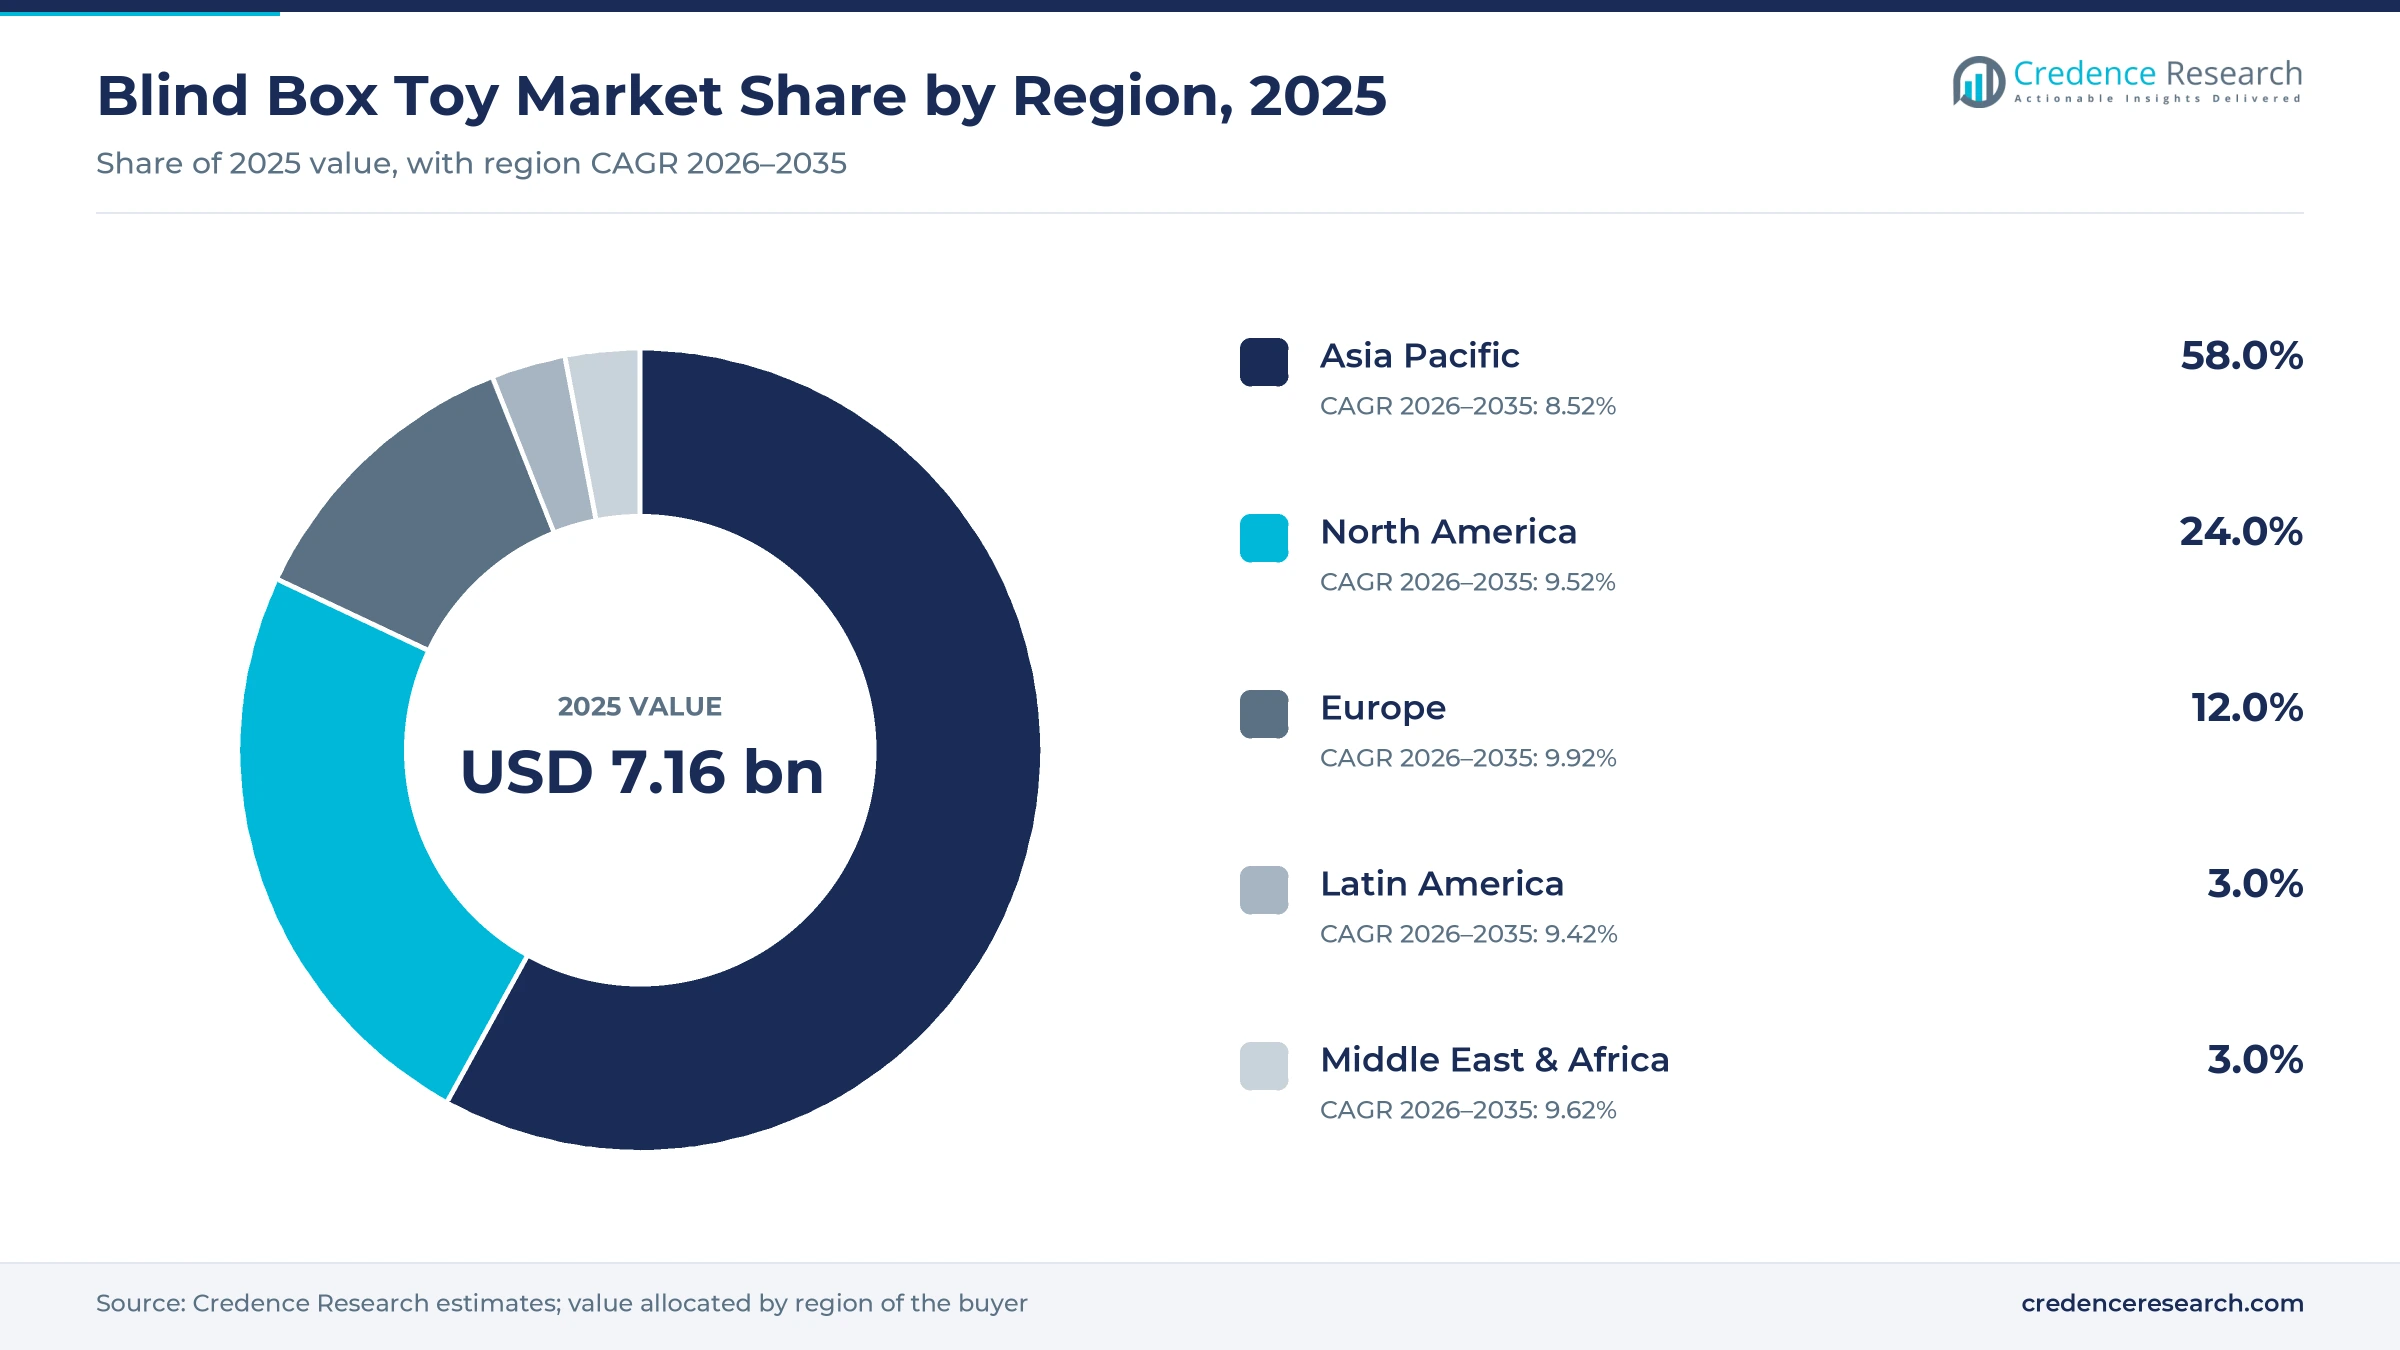
The global blind box toy market was valued at USD 7.16 billion in 2025 and is projected to increase from USD 7.80 billion in 2026 to USD 16.94 billion by 2035, registering a CAGR of 9.00% during 2026–2035. Demand comes from teenage and adult collectors who buy sealed packs to chase secret editions, share unboxing videos and trade duplicates, and from licensed character series that turn film, anime and game fans into repeat buyers. Asia Pacific held the largest regional share, 58.0% in 2025, because China and Japan host the deepest retail networks for designer figures and capsule machines. Europe is the fastest-growing region at 9.92% a year, as brand-owned stores and robot kiosks spread through major shopping streets. On the commercial side, the format has moved from boxed vinyl figures toward plush pendants worn on bags, which lifts average spending per collector and pushes makers to add production outside China.
What does the blind box toy market include and how is it sold?
The market covers sealed collectible packs in which the buyer does not know which design of a series is inside, including vinyl figure boxes, plush pendants and bag charms, capsule toys sold through machines and small figures in surprise packaging. Value is counted at retail across brand-owned stores, partner shops, vending robots and online storefronts.
The scope excludes large open-box statues, model kits, trading cards and digital blind boxes sold as virtual items. The value chain runs from IP owners and designers through contract factories to brand stores, licensed retailers and resale platforms, where secret editions often trade above their shelf price.
Blind Box Toy Market Insights
- The market grows from USD 7.16 billion in 2025 to USD 16.94 billion by 2035 at a 9.00% CAGR, as collectors move from single figures to complete series and plush pendants.
- Asia Pacific held 58.0% of 2025 value, supported by China, Japan and Southeast Asia, where designer figures and capsule machines have the widest retail coverage.
- Blind Boxes led with 52.0% of 2025 value, as twelve-design series with hidden secret editions remain the core purchase for long-term collectors.
- In January 2026, Pop Mart added manufacturing capacity in Mexico, Cambodia and Indonesia, which shows how the format is shifting production closer to overseas buyers.
- Competition centers on character IP and store reach, with Pop Mart, TOP TOY, 52TOYS, Bandai Namco and Dreams Inc. each adding licensed series, flagship stores or machine-dense shops.
Vinyl blind boxes lead while plush pendants grow fastest
Why do vinyl blind boxes still lead product sales?
Based on product, the market is categorized into blind boxes, plush pendants and figures. Blind Boxes led with 52.0% of 2025 value because the series model keeps collectors buying until a set is complete, and Dreams Inc. still issues Sonny Angel series of 12 regular designs plus secret versions, according to Tokyo Weekender in March 2025. Plush Pendants grow fastest at 10.08% a year, as Pop Mart said in its March 2026 results that plush toys and bag charms from THE MONSTERS, Molly and Crybaby drove its 2025 growth. Figures keep a smaller share among buyers who also collect larger action figures.
How do stores, robots and online shops split sales?
Based on channel, the market is categorized into retail stores, vending robots and online. Retail Stores led with 55.0% of 2025 value because collectors want to shake boxes, see secret editions and join launch-day queues, and Pop Mart ran more than 500 stores in 30 countries by March 2026, according to FFXnow. Online grows fastest at 9.83% a year, as YouNet ECI counted 293,000 Labubu and Baby Three units sold by the top 30 Shopee and TikTok Shop sellers in Vietnam in the second quarter of 2024. Vending robots extend reach into malls, stations and other transit hubs.
Which national markets carry the most collector spending?
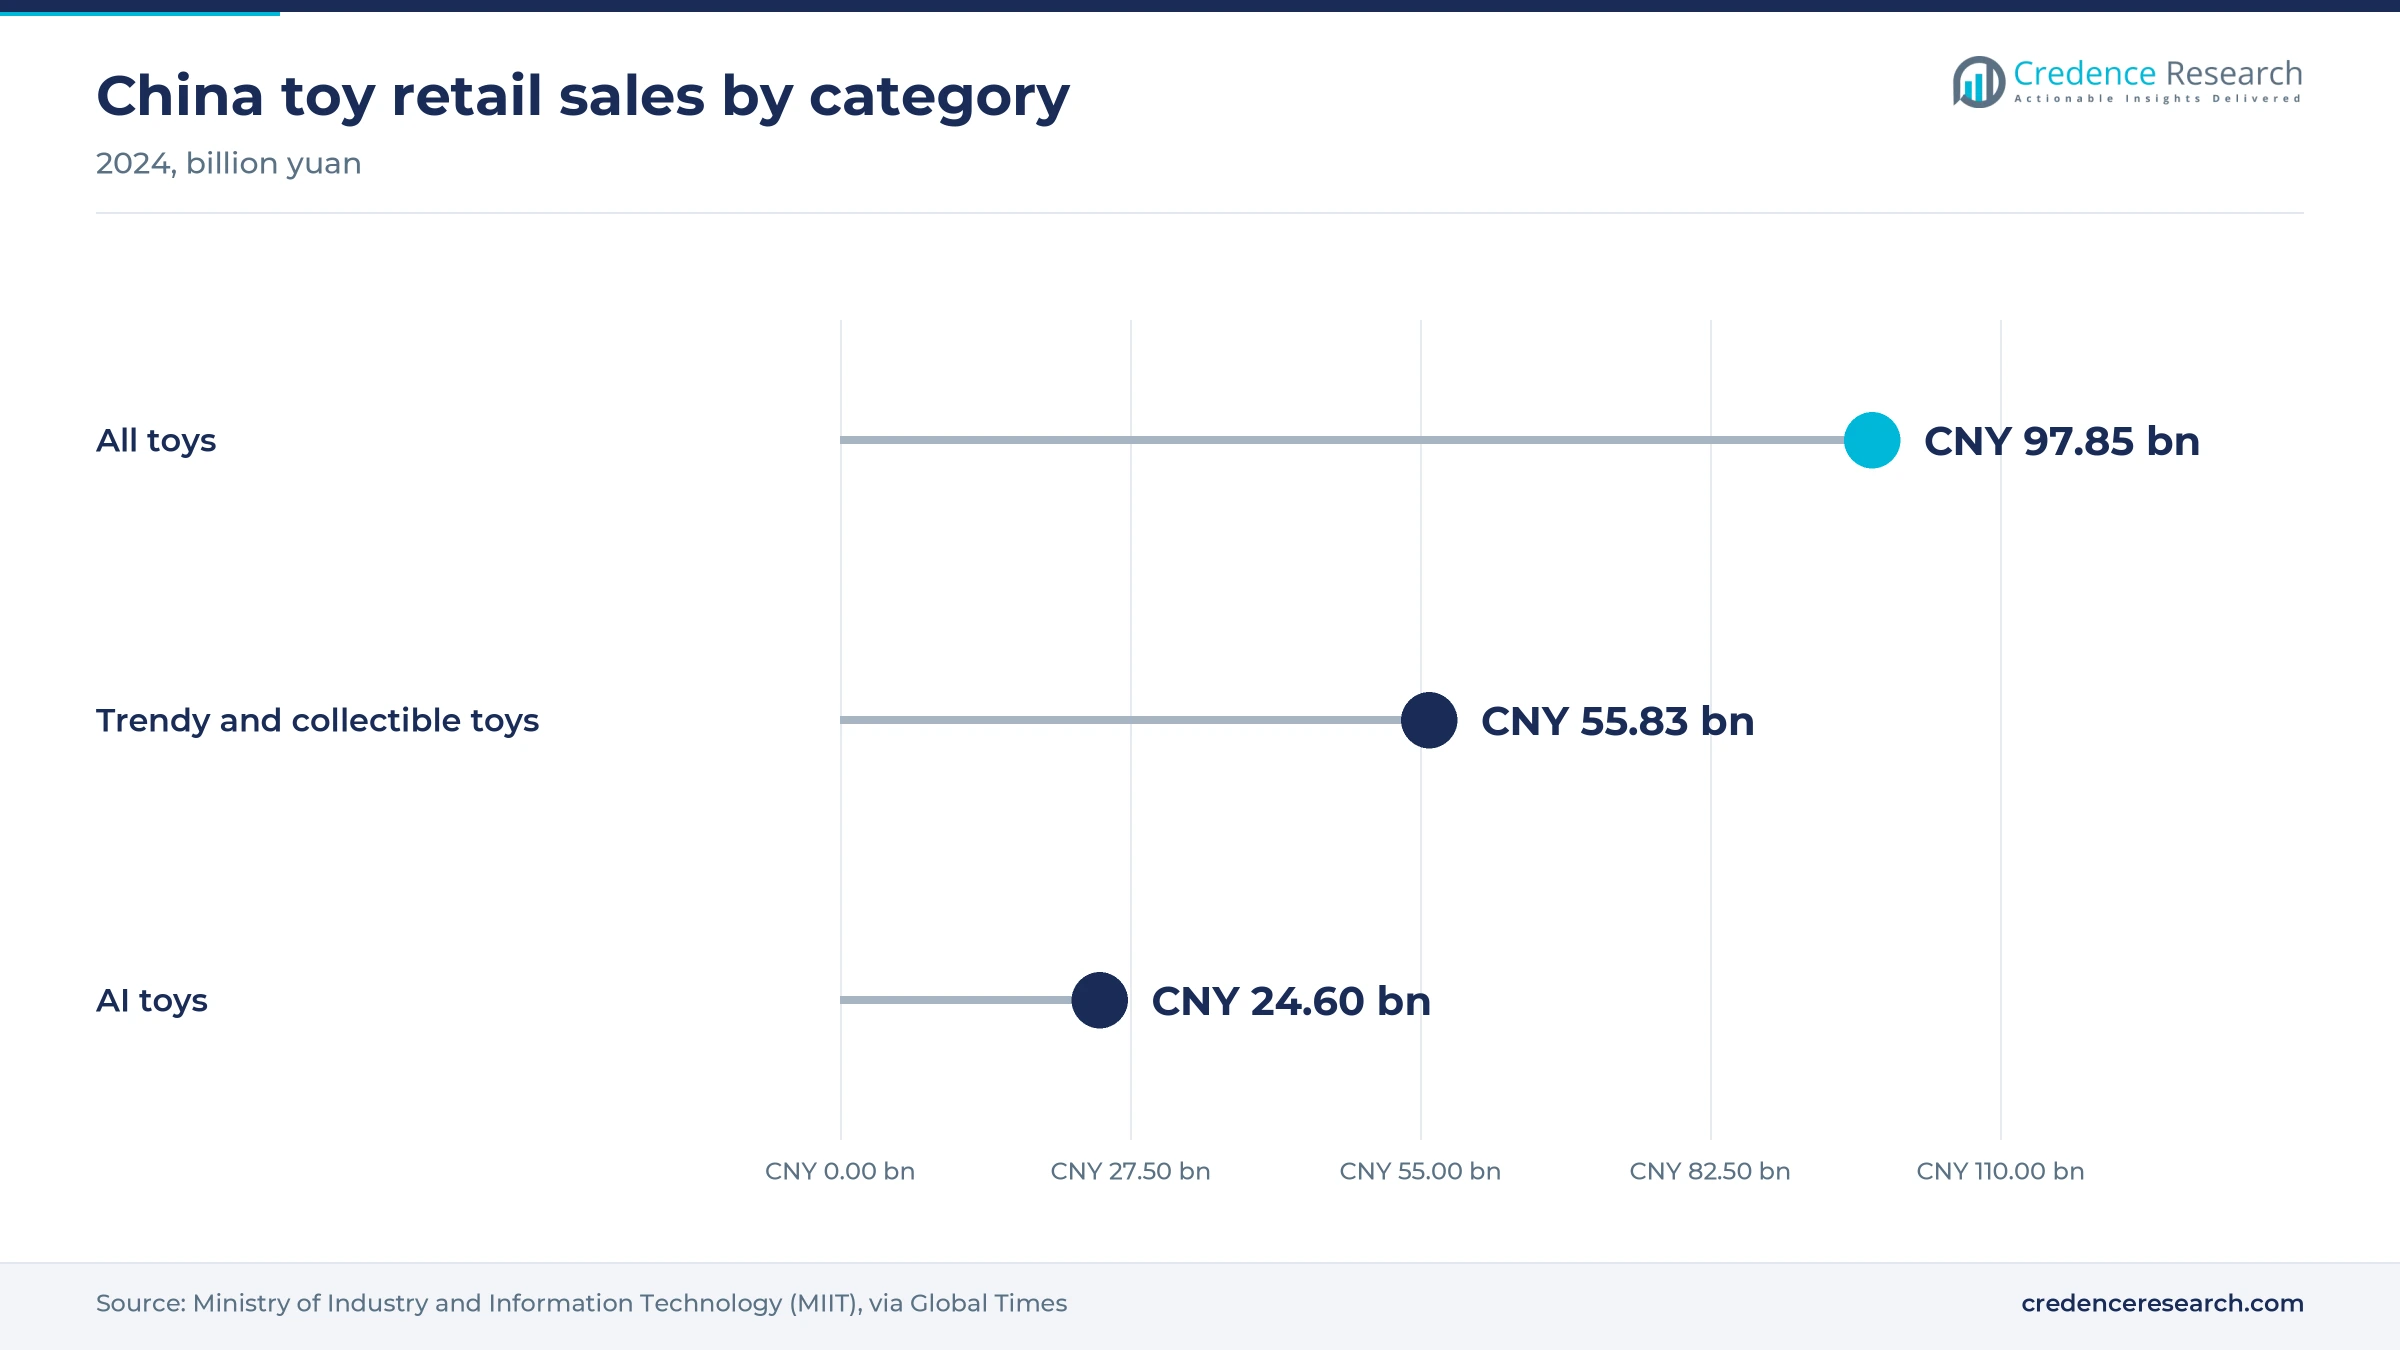
Based on key market, the market is categorized into China, Southeast Asia, U.S. and Europe, and rest of world. China led with 35.0% of 2025 value because the Ministry of Industry and Information Technology put 2024 retail sales of trendy and collectible toys and related goods at 55.83 billion yuan, according to Global Times. U.S. and Europe grows fastest at 9.85% a year, as Pop Mart opened its first permanent U.S. store at American Dream in September 2023 and has since chosen London for its European headquarters. Japan, with its dense capsule machine network, anchors the rest of world.
| Segment Group | Leading Sub-segment | Share, 2025 | Fastest-growing Sub-segment | CAGR, 2026–2035 |
|---|---|---|---|---|
| By Product | Blind Boxes | 52.0% | Plush Pendants | 10.08% |
| By Channel | Retail Stores | 55.0% | Online | 9.83% |
| By Key Market | China | 35.0% | U.S. and Europe | 9.85% |
Request a Free Sample
Fill in your details and we'll send you a free sample report.
- Sample data tables & charts
- Research methodology
Social sharing, licensed IP and robot shops lift sales
Collectible culture and social sharing lift purchases
Collecting has become a social activity, because each unboxing produces a reveal that buyers post, compare and trade online. According to China's Ministry of Industry and Information Technology, 2024 retail sales of trendy and collectible toys and related merchandise reached 55.83 billion yuan, out of 97.85 billion yuan in total toy retail sales. The same habit has spread abroad, as YouNet ECI recorded 293,000 Labubu and Baby Three units sold through the top 30 Shopee and TikTok Shop sellers in Vietnam in the second quarter of 2024. Scarcity sharpens the pull, because the April 25, 2025, Big Into Energy series listed a 1-in-72 chance of the secret edition, according to Bagaholicboy. In the Credence Research model this adds about 3.3 percentage points to annual growth to 2035.
Licensed character collaborations widen the buyer base
Licensed characters bring film, anime and game fans into the format, which widens the buyer base beyond designer-toy collectors. Beijing-based 52TOYS sells 80 licensed product lines, including Crayon Shin-chan and properties from Disney and Warner Bros., alongside 35 proprietary lines, according to Bamboo Works. Bandai Namco opened a pop-up at Hamleys on Regent Street in London on Dec. 1, 2025, with more than 100 GASHAPON machines and a Dragon Ball and One Piece area made with Toei Animation, according to Anime News Network. Original characters now travel the other way, as Pop Mart is developing a Labubu film with Sony Pictures. In the Credence Research model this adds about 2.4 percentage points to annual growth to 2035.
Pop-up retail and robot kiosks expand distribution
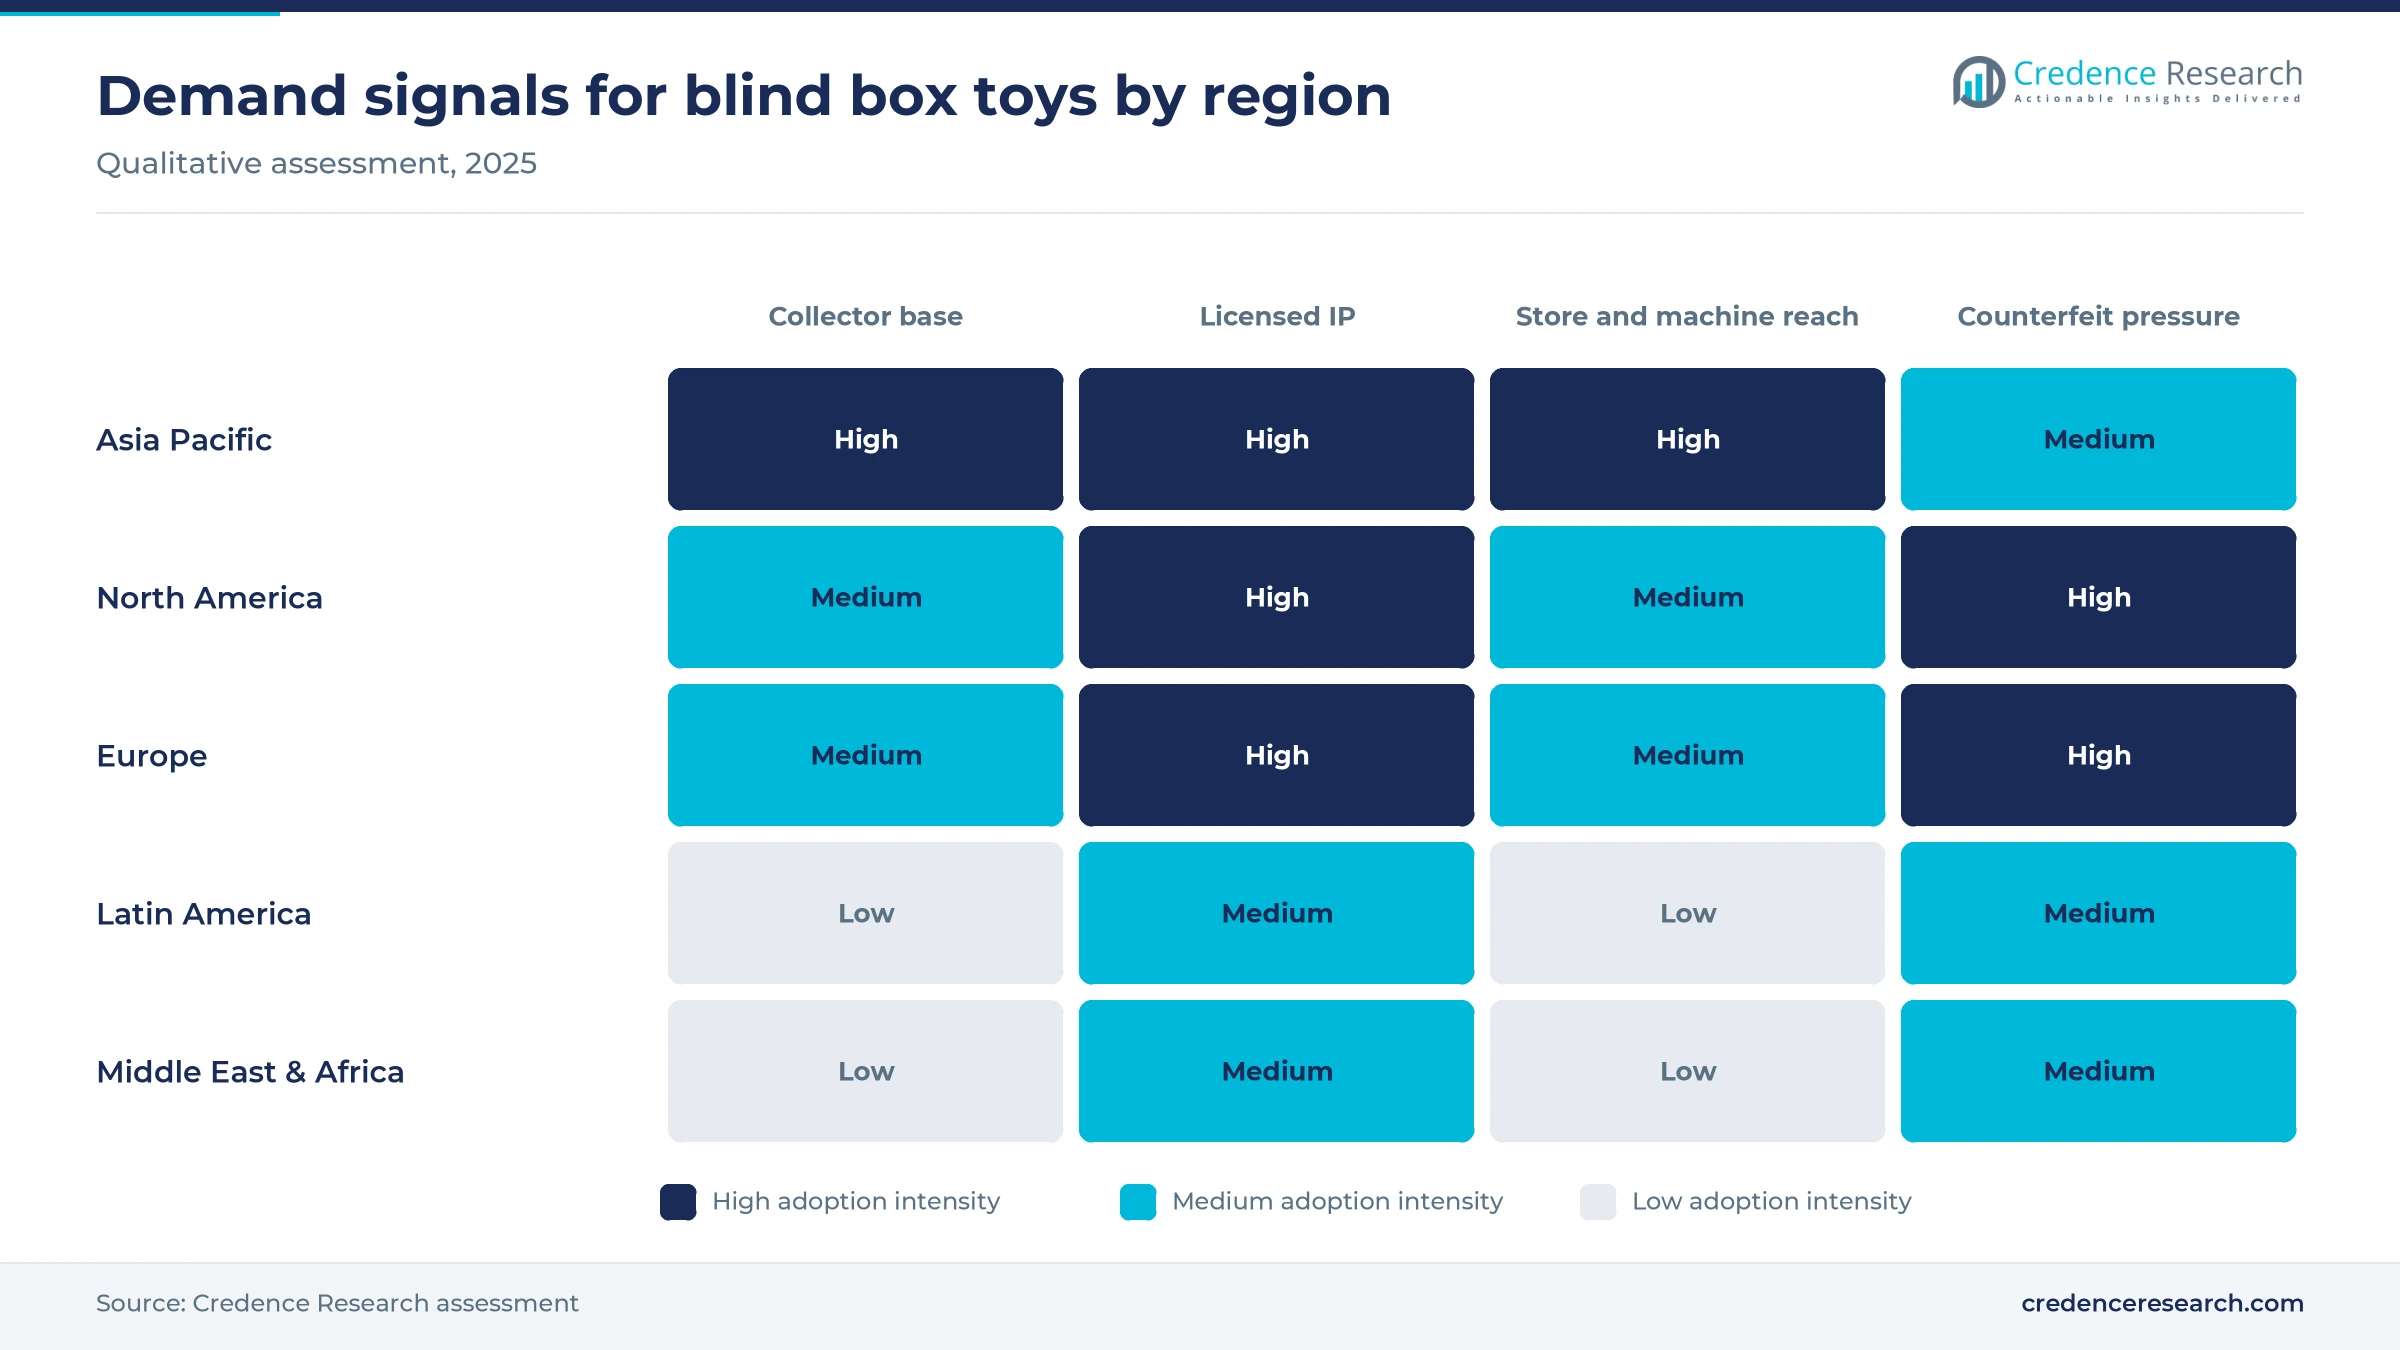
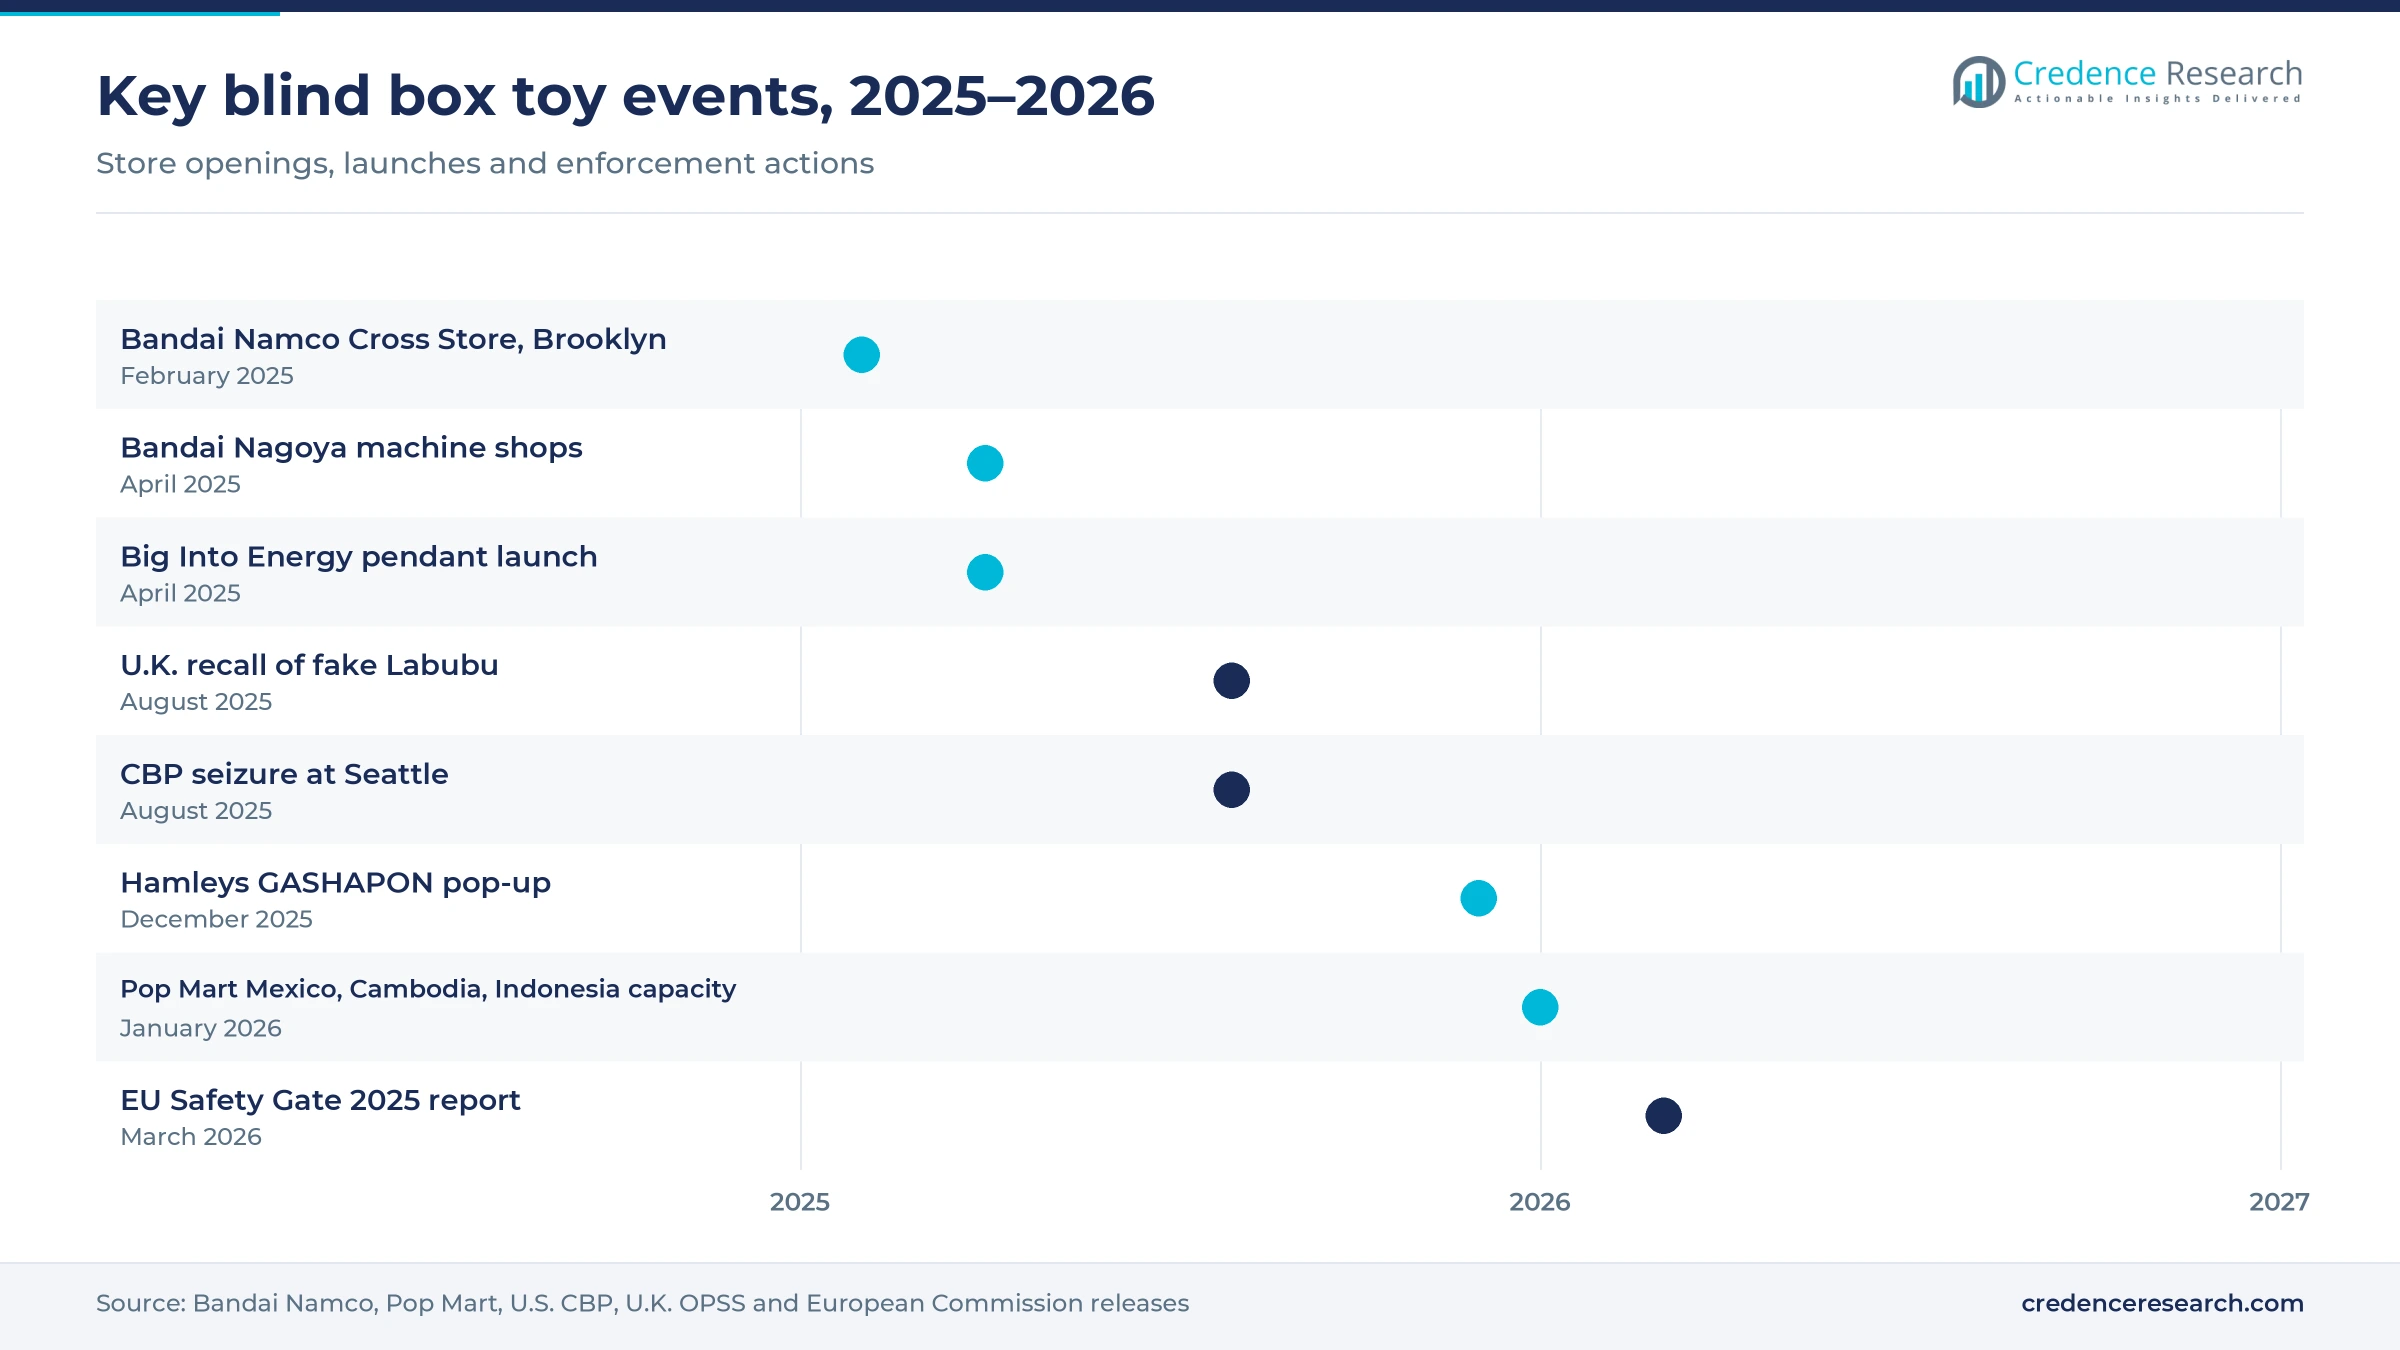
Distribution has moved from specialist shops into malls, stations and streets, which puts packs in front of casual shoppers who were never collectors. Pop Mart operated more than 500 stores and 2,300 Robo Shops across 30 countries by March 2026, according to FFXnow, and planned a store at Tysons Corner Center in Virginia for the fourth quarter. Bandai opened two adjacent shops with about 1,000 capsule machines at mozo Wonder City in Nagoya on April 24, 2025, according to Essential Japan. Bandai Namco then opened its first U.S. Cross Store in Brooklyn on Feb. 28, 2025, with a Gashapon Bandai Official Shop among ten branded counters. In the Credence Research model this adds about 1.8 percentage points to annual growth.
Adult capsule toy demand in Japan stays strong
Japan shows that surprise collectibles can sustain adult demand for decades, which supports long-run spending in Asia Pacific. The Japan Capsule Toy Association put fiscal 2024 capsule toy shipments at 141 billion yen, up 22.6% from the previous year, according to its annual trend survey. Sonny Angel, created in 2005 by Toru Soeya at Tokyo-based Dreams Inc., enjoyed quiet success in Japan for nearly two decades before its recent global rise, according to Tokyo Weekender. The machine format also travels, as Gashapon Bandai opened a 300-machine store at NEX in Singapore on May 25, 2023, with plays from S$4. As a result, Asia Pacific keeps the largest regional share of spending.
Bag-charm plush and blind-bag promotions reshape demand
Shift from boxed vinyl to plush pendants worn as bag charms
The product mix is shifting from boxed vinyl figures kept on shelves to plush pendants clipped onto bags, which turns a collectible into a fashion accessory seen in public. The Big Into Energy series, released worldwide on April 25, 2025, is a 17 cm vinyl plush pendant priced at SGD 24.90 per pack in Singapore, according to Bagaholicboy. Demand for the pendant format also draws fakes, as U.S. Customs and Border Protection seized 11,134 counterfeit Labubu dolls worth about $513,938 at Seattle on Aug. 26, 2025. Because of this shift, plush pendants grow at 10.08% a year, the fastest product segment, while blind boxes still hold 52.0% of 2025 value.
Rise of blind-bag mechanics in food, drink and retail
The surprise mechanic is spreading beyond toy shops into cafes and general retail, which brings in buyers who first meet the format with a drink or a purchase. In Vietnam, Gong Cha and The Alley added surprise gifts to combo orders, Cheese Coffee ran a Limited Edition Blind Bag campaign and Katinat launched a blind bag gift program, according to VOV in February 2025. More than 50,000 companies in China sell pop toys and other collectibles, with 3,100 added during 2025, according to Tianyancha data cited by Bamboo Works. Miniso's TOP TOY unit reached a valuation of about $1.3 billion after a Temasek investment in August 2025, according to DealStreetAsia.
Overseas production and stores open western demand
Western markets offer the largest opening, because brand-owned stores and nearby supply can shorten waits for new series. Pop Mart added manufacturing capacity in Mexico, Cambodia and Indonesia in January 2026 and plans to make London its European headquarters, according to Reuters. The company had 140 overseas stores in August 2025 and expected more than 200 by the end of that year, according to EqualOcean. In the U.S., its first permanent store opened at American Dream in New Jersey in September 2023, followed by Pentagon City in Virginia. As a result, Europe and North America grow fastest, and the U.S. and Europe key market grows at 9.85%.
Authorized retail in the Gulf is an untapped opening
The Gulf states offer a clear opening for authorized stores, because collectors already pay high resale prices to reach the format. The United Arab Emirates had no standalone Pop Mart store in August 2025, and Labubu plush packs that retail for about Dh79 sold for Dh350 or more through some resellers, according to The National. Pop Mart, which ran 140 overseas stores in August 2025, planned its first Middle East store in Doha, Qatar, for the second half of 2025, according to EqualOcean. Founder Wang Ning also named the Middle East, Central Europe and Central and South America as possible expansion markets. As a result, Middle East & Africa grows at 9.62% a year to 2035.
Counterfeits, sales rules and tariffs test the model
Counterfeit pendants raise safety and brand risks
Counterfeits are the most visible risk, because cheap copies of hit pendants reach buyers who cannot tell them apart. The U.K. Office for Product Safety and Standards recalled fake Pop Mart Labubu plush toys on Aug. 18, 2025, after feet, hands and eyes detached with minimum force. In the EU, Safety Gate recorded 4,671 alerts on dangerous products in 2025, with toys and cosmetics making up over half. Brand owners respond with holographic stickers and QR codes on genuine packs.
Rules on minors and odds disclosure limit some sales
Sales rules limit how the format can be marketed to children, which narrows part of the buyer base in China. The State Administration for Market Regulation issued a guideline on June 15, 2023 that bans blind box sales to children under eight and asks sellers to publish odds and drawing rules. Vendors are also urged to limit spending and the number of purchases per shopper. As a result, brands shift marketing toward adult collectors and publish odds on packs.
U.S. tariffs disrupt imports of made-in-China packs
Trade policy raises landed costs for packs made in China, which is the main source of supply for U.S. stores. The Toy Association reported on Aug. 12, 2025 that U.S. toy imports from China fell 45% in May and 47% in June from a year earlier. Total U.S. toy imports fell 28% and 31% in those months, with no sign that other countries were filling the gap. In turn, brand owners add factories in Mexico and Southeast Asia, which takes time and capital.
Dependence on a few hit characters adds volatility
Reliance on a few hit characters makes the market sensitive to shifts in collector taste, which can arrive quickly. Pop Mart shares closed 22.5% lower on March 25, 2026, their biggest one-day drop in nearly a year, after investors questioned the durability of top characters, according to RTE. A slower season for one hit line therefore affects stores, licensees and resale prices together. Brand owners respond by adding new characters, licensing deals, theme parks and a planned Labubu film to spread the risk.
Asia Pacific leads as Europe and North America gain fastest
| Region | Value, 2025 (USD billion) | Share, 2025 | CAGR, 2026–2035 |
|---|---|---|---|
| Asia Pacific | 4.15 | 58.0% | 8.52% |
| North America | 1.72 | 24.0% | 9.52% |
| Europe | 0.86 | 12.0% | 9.92% |
| Latin America | 0.21 | 3.0% | 9.42% |
| Middle East & Africa | 0.21 | 3.0% | 9.62% |
Asia Pacific leads on China, Japan and Southeast Asia
Asia Pacific held 58.0% of 2025 value and grows at 8.52% a year, because China, Japan and Southeast Asia have the densest store and machine networks. China's 2024 retail sales of trendy and collectible toys reached 55.83 billion yuan, according to the Ministry of Industry and Information Technology. Japan, home of many anime figure series, recorded capsule toy shipments of 141 billion yen in fiscal 2024, according to the Japan Capsule Toy Association. In Vietnam, cafes and online sellers have adopted blind bags, so the region keeps its lead even as growth slows from a high base.
North America grows on new brand stores
North America held 24.0% of 2025 value and grows at 9.52% a year, as brand-owned stores replace reseller channels. Pop Mart opened its first permanent U.S. store at American Dream in September 2023 and plans a Tysons Corner Center store for the fourth quarter of 2026. Bandai Namco opened its first U.S. Cross Store in Brooklyn in February 2025. However, U.S. Customs and Border Protection seized 11,134 counterfeit Labubu dolls at Seattle in August 2025, which shows how strong demand also invites fakes.
Europe is the fastest-growing region to 2035
Europe held 12.0% of 2025 value and grows fastest at 9.92% a year, because brand owners are building European bases and flagship shops. Pop Mart plans to make London its European headquarters, according to Reuters in March 2026. Bandai Namco opened a pop-up at Hamleys in London on Dec. 1, 2025, with more than 100 GASHAPON machines. However, U.K. product safety officers recalled counterfeit Labubu plush toys in August 2025, so enforcement against fakes remains part of the growth story in the region.
Latin America gains from Mexican production
Latin America held 3.0% of 2025 value and grows at 9.42% a year, from a small base of licensed retailers and importers. Pop Mart added manufacturing capacity in Mexico in January 2026, according to Reuters, which shortens supply routes into the Americas. Founder Wang Ning has named Central and South America among possible expansion markets, according to The National in August 2025. As a result, more authorized stores could replace parallel imports in Mexico, Brazil and Chile over the forecast period.
Middle East & Africa moves from resale to stores
Middle East & Africa held 3.0% of 2025 value and grows at 9.62% a year, as authorized stores begin to replace resellers. The United Arab Emirates had no standalone Pop Mart store in August 2025, and Labubu packs priced at about Dh79 resold for Dh350 or more, according to The National. Pop Mart planned its first Middle East store in Doha for the second half of 2025, according to EqualOcean. Africa remains a minor market served mostly through online imports.
Store openings, a pendant launch and fake seizures in 2025
| Development | Status and market relevance |
|---|---|
| In February 2025, Bandai Namco opened its first U.S. Cross Store at Industry City in Brooklyn, with a Gashapon Bandai Official Shop among ten branded counters. | Opened Feb. 28, 2025; adds a capsule machine outlet in a key U.S. city |
| In April 2025, Bandai opened two adjacent shops with about 1,000 capsule machines at mozo Wonder City in Nagoya. | Opened April 24, 2025; one of the largest machine-dense sites in Japan |
| In April 2025, Pop Mart released THE MONSTERS Big Into Energy vinyl plush pendant series worldwide, with six regular designs and one secret edition. | Released April 25, 2025; marks the shift toward plush pendants |
| In August 2025, U.S. Customs and Border Protection seized 11,134 counterfeit Labubu dolls at Seattle air cargo in a shipment labeled as LED bulbs. | Seized Aug. 26, 2025; highlights counterfeit pressure on hit series |
| In January 2026, Pop Mart added manufacturing capacity in Mexico, Cambodia and Indonesia to support demand and supply-chain resilience. | Announced January 2026; moves supply closer to overseas buyers |
Random packs, authentication codes and robot kiosks
- Randomized series packaging hides one of six to twelve regular designs plus a rare secret edition in each sealed pack, and published odds such as 1 in 72 tell buyers how hard a set will be to finish.
- Holographic stickers and QR codes let buyers check that a pack is genuine, which matters after U.S. and U.K. regulators warned in August 2025 about fakes that break into small parts.
- Robot kiosks and capsule machines sell packs without staff in malls, stations and campuses, so a brand can test a location before it commits to a full store.
- Social commerce storefronts on platforms such as Shopee and TikTok Shop combine live unboxing with checkout, which turns a single video into immediate sales.
Need a Custom Version of This Report?
Tailor the scope, geography, or segments to your exact requirements.
- Custom geography or segment scope
- Direct access to our analyst team
IP owners and capsule makers race to widen their reach
Competition centers on character IP, store reach and the speed of new series. Pop Mart leads with owned characters such as THE MONSTERS, Molly and Crybaby, more than 500 stores and 2,300 Robo Shops in 30 countries, and new factories outside China. TOP TOY, the toy unit of Miniso, uses its parent's store network and gained Temasek as an investor in 2025, while 52TOYS relies on licensed lines such as Crayon Shin-chan alongside its own designs. Bandai Namco competes through GASHAPON machines and official shops in Japan, Singapore, the U.S. and the U.K. Dreams Inc. keeps Sonny Angel series in steady release. Smaller Chinese and Southeast Asian studios compete on price and local characters, while counterfeiters target the most popular pendants, so authentication and fast restocking have become competitive tools.
Companies profiled and their roles in this market
| Company | Type | Role in the market |
|---|---|---|
| Pop Mart | IP owner and retailer | Owns THE MONSTERS, Molly and Crybaby; runs stores and Robo Shops in 30 countries |
| TOP TOY (Miniso) | Retailer and brand | Sells own and licensed collectibles through a store network backed by Miniso |
| 52TOYS | Designer and licensee | Makes 80 licensed product lines and 35 proprietary lines from Beijing |
| Bandai Namco (Gashapon) | Capsule maker and operator | Runs GASHAPON machines and official shops in Japan and abroad |
| Dreams Inc. (Sonny Angel) | IP owner | Issues Sonny Angel series with 12 regular designs and secret versions |
Growth depends on refreshing hit characters every year
Credence Research's view is that the market will keep growing near its forecast pace only if brand owners refresh their hit characters every year and keep fakes off the shelf. The shift to plush pendants has widened the audience, but it also ties demand to fashion cycles that can turn quickly, as the 22.5% drop in Pop Mart shares in March 2026 showed. Licensed series from film and anime spread that risk across more fan bases. Overseas factories, authorized Gulf and European stores and stronger authentication will decide which brands hold share by 2035.
Model built from company, regulator and customs data
The report uses 2025 as the base year and forecasts to 2035. Market values come from the Credence Research model, which combines company disclosures on stores, machines and production with official statistics from China's Ministry of Industry and Information Technology, U.S. trade data reported by The Toy Association, Japanese capsule toy shipments and regulator notices from the U.S., the U.K., the EU and China. Regional, product, channel and key market splits are Credence Research estimates based on store counts, machine networks and published sales mix. No interviews or surveys were used for this edition of the report.
Overseas stores and new IP carry the market to 2035
The market is projected to reach USD 16.94 billion by 2035, growing at a 9.00% CAGR from USD 7.80 billion in 2026. Plush pendants and online sales will carry much of the gain, while blind boxes remain the largest product type. Europe and North America will grow fastest as Pop Mart, Bandai Namco and TOP TOY add stores and machines, and Mexican and Southeast Asian factories reduce exposure to U.S. tariffs on Chinese goods. Asia Pacific will stay the largest region because of China and Japan. Counterfeit enforcement and sales rules for minors will shape how fast new series can reach mass retail.
Frequently Asked Questions
How big is the blind box toy market?
Which region leads the blind box toy market?
Which region grows fastest?
Which product leads the market?
Why are plush pendants growing so quickly?
How do rules in China affect blind box sales?
Why are counterfeits a concern?
Who are the main companies in the blind box toy market?
Table of Content
Chapter 1 Market Segmentation
- 1.1 Segmentation Framework
- 1.1.1 Product and Service Classification
- 1.1.2 Application and End-Use Classification
- 1.1.3 Technology and Solution Classification
- 1.1.4 Customer and Distribution Channel Classification
- 1.1.5 Geographic Segmentation
- 1.1.6 Market Segment Definitions and Boundaries
- 1.2 By Product
- 1.2.1 Blind Boxes
- 1.2.2 Plush Pendants
- 1.2.3 Figures
- 1.3 By Channel
- 1.3.1 Retail Stores
- 1.3.2 Vending Robots
- 1.3.3 Online
- 1.4 By Key Market
- 1.4.1 China
- 1.4.2 Southeast Asia
- 1.4.3 US and Europe
- 1.4.4 Rest of World
Chapter 2 Introduction
- 2.1 Report Objectives and Scope
- 2.2 Product Definition and Industry Terminology
- 2.3 Market Inclusions and Exclusions
- 2.4 Research Process
- 2.4.1 Primary Research and Expert Interviews
- 2.4.2 Secondary Research and Source Review
- 2.4.3 Top-Down and Bottom-Up Estimation
- 2.4.4 Data Triangulation and Verification
- 2.5 Market Size Measurement Basis
- 2.5.1 2025: USD 7.16 billion → 2035: USD 16.94 billion
- 2.6 Historical and Forecast Reference Periods
- 2.6.1 Historical Period: 2018-2025
- 2.6.2 Base Year: 2025
- 2.6.3 Forecast Period: 2025-2035
- 2.7 Research Assumptions and Limitations
Chapter 3 Executive Summary
- 3.1 Market Snapshot and Key Findings
- 3.2 Base-Year Market Size, 2025
- 3.3 Forecast Market Size, 2035
- 3.4 Revenue and Volume Growth Outlook
- 3.5 Key Demand and Supply Indicators
- 3.6 Leading Market Segments
- 3.7 Fastest-Growing Market Opportunities
- 3.8 Regional Performance Highlights
- 3.9 Technology and Industry Transformation
- 3.10 Competitive Landscape Summary
- 3.11 Analyst View and Strategic Implications
Chapter 4 Global Blind Box Toy Market Trends and Developments
- 4.1 Historical Industry Development, 2018-2025
- 4.2 Recent Market Trends and Developments
- 4.3 Demand and Customer Behavior Trends
- 4.4 Technology and Product Innovation
- 4.5 Artificial Intelligence, Automation and Digitalization
- 4.6 Local Manufacturing and Supply Chain Realignment
- 4.7 Industry Partnerships, Mergers and Acquisitions
- 4.8 Sustainability and Circular Economy Developments
- 4.9 Government and Private Sector Investment Trends
- 4.10 Emerging Business Models and Commercialization
- 4.11 Industry Developments and Announcements
Chapter 5 Global Blind Box Toy Market Production, Supply and Demand Analysis
- 5.1 Demand Trend and Consumption Analysis, 2018-2025
- 5.2 Demand Forecast, 2025-2035
- 5.3 Production and Output Trend, 2018-2025
- 5.4 Production and Output Forecast, 2025-2035
- 5.5 Installed Capacity and Capacity Utilization
- 5.6 Company-Wise Production Plants and Statistics
- 5.6.1 Installed Production Capacity
- 5.6.2 Actual Production
- 5.6.3 Planned Capacity and Expansion Targets
- 5.7 Supply Chain Structure and Procurement Trends
- 5.8 Supply-Demand Gap and Bottlenecks
- 5.9 Import Dependence and Sourcing Structure
- 5.10 Contract Manufacturing and Outsourcing
- 5.11 Regional Supply and Demand Concentration
Chapter 6 Global Blind Box Toy Market Pricing Analysis
- 6.1 Pricing Structure and Measurement
- 6.2 Historical Pricing Trends, 2018-2025
- 6.3 Pricing Outlook, 2025-2035
- 6.4 Average Selling Price and Unit Economics
- 6.5 Pricing by Product and Market Segment
- 6.6 Geographic Pricing Differences
- 6.7 Key Input, Energy, Labor and Logistics Costs
- 6.8 Contract Pricing and Purchasing Models
- 6.9 Pricing Sensitivity and Competitive Positioning
- 6.10 Price, Margin and Profitability Implications
Chapter 7 Global Blind Box Toy Market Dynamics
- 7.1 Market Growth Drivers
- 7.1.1 Demand-Side Drivers
- 7.1.2 Technology and Innovation Drivers
- 7.1.3 Infrastructure and Investment Drivers
- 7.1.4 Regulatory and Policy Drivers
- 7.2 Market Restraints
- 7.2.1 Cost and Affordability Constraints
- 7.2.2 Technology and Adoption Barriers
- 7.2.3 Supply Chain and Operational Constraints
- 7.3 Market Challenges
- 7.3.1 Competitive Pressure and Margin Erosion
- 7.3.2 Skills, Infrastructure and Implementation Gaps
- 7.4 Emerging Market Opportunities
- 7.5 Market Dynamics Impact and Time-Horizon Assessment
Chapter 8 Global Blind Box Toy Value Chain Analysis
- 8.1 Industry Value Chain Overview
- 8.2 Upstream Suppliers and Critical Inputs
- 8.3 Technology and Component Providers
- 8.4 Manufacturing or Service Delivery
- 8.5 Distribution, Channel Partners and Integrators
- 8.6 Downstream Applications and End Users
- 8.7 Value Addition and Profit Pools
- 8.8 Vertical Integration and Outsourcing
- 8.9 Supplier Concentration and Risk
- 8.10 Supply Chain Localization and Resilience
Chapter 9 Global Blind Box Toy Market Regulations and Policies
- 9.1 Relevant Laws, Standards and Compliance Frameworks
- 9.2 Product, Service, Safety and Quality Requirements
- 9.3 Government Policies, Incentives and Subsidies
- 9.4 Imports, Exports and Trade Barriers
- 9.5 Public Procurement and Local Content Requirements
- 9.6 Environmental and Sustainability Compliance
- 9.7 Upcoming Policy Changes and Market Implications
Chapter 10 Global Blind Box Toy Market Hotspots and Opportunities
- 10.1 Market Opportunity Mapping and Growth Hotspots
- 10.2 High-Growth Applications and Customer Groups
- 10.3 Underserved Markets and White-Space Opportunities
- 10.4 Emerging Technology and Product Opportunities
- 10.5 New Capacity and Investment Hotspots
- 10.6 Market Entry and Expansion Opportunities
- 10.7 Distribution and Partnership Opportunities
- 10.8 Near-Term and Long-Term Commercial Potential
- 10.9 Opportunity Attractiveness and Execution Risks
Chapter 11 Global Blind Box Toy Market Outlook, 2025-2035
- 11.1 Market Size and Analysis
- 11.1.1 Revenue (Market Measurement: 2025: USD 7.16 billion → 2035: USD 16.94 billion)
- 11.1.2 Market Volume and Quantity Sold
- 11.1.3 Historical Market Size, 2018-2025
- 11.1.4 Base-Year Market Size, 2025
- 11.2 Market Forecast, 2025-2035
- 11.2.1 Revenue Forecast to 2035
- 11.2.2 Volume Forecast to 2035
- 11.2.3 CAGR and Year-on-Year Growth
- 11.2.4 Incremental Revenue Opportunity
- 11.3 Forecast Assumptions and Scenario Analysis
- 11.3.1 Base-Case Forecast
- 11.3.2 Optimistic and Conservative Scenarios
- 11.3.3 Technology, Pricing and Policy Sensitivities
- 11.4 Market Attractiveness and Growth Outlook
Chapter 12 Global Blind Box Toy Market Segmentation and Outlook
- 12.1 Segmentation Summary and Market Shares, 2025
- 12.2 Largest and Fastest-Growing Segments
- 12.3 By Product - Market Size and Forecast, 2025-2035
- 12.3.1 Segment Definition and Scope
- 12.3.2 Historical Market Size, 2018-2025
- 12.3.3 Revenue Forecast, 2025-2035
- 12.3.4 Volume Forecast, 2025-2035
- 12.3.5 Base-Year Market Share, 2025
- 12.3.6 Segment CAGR and Growth Drivers
- 12.3.7 Subsegment Market Size and Forecast
- 12.3.7.1 Blind Boxes
- 12.3.7.2 Plush Pendants
- 12.3.7.3 Figures
- 12.3.8 Subsegment Pricing and Adoption Trends
- 12.3.9 Leading Suppliers and Competition
- 12.3.10 Regional Demand and Opportunities
- 12.4 By Channel - Market Size and Forecast, 2025-2035
- 12.4.1 Segment Definition and Scope
- 12.4.2 Historical Market Size, 2018-2025
- 12.4.3 Revenue Forecast, 2025-2035
- 12.4.4 Volume Forecast, 2025-2035
- 12.4.5 Base-Year Market Share, 2025
- 12.4.6 Segment CAGR and Growth Drivers
- 12.4.7 Subsegment Market Size and Forecast
- 12.4.7.1 Retail Stores
- 12.4.7.2 Vending Robots
- 12.4.7.3 Online
- 12.4.8 Subsegment Pricing and Adoption Trends
- 12.4.9 Leading Suppliers and Competition
- 12.4.10 Regional Demand and Opportunities
- 12.5 By Key Market - Market Size and Forecast, 2025-2035
- 12.5.1 Segment Definition and Scope
- 12.5.2 Historical Market Size, 2018-2025
- 12.5.3 Revenue Forecast, 2025-2035
- 12.5.4 Volume Forecast, 2025-2035
- 12.5.5 Base-Year Market Share, 2025
- 12.5.6 Segment CAGR and Growth Drivers
- 12.5.7 Subsegment Market Size and Forecast
- 12.5.7.1 China
- 12.5.7.2 Southeast Asia
- 12.5.7.3 US and Europe
- 12.5.7.4 Rest of World
- 12.5.8 Subsegment Pricing and Adoption Trends
- 12.5.9 Leading Suppliers and Competition
- 12.5.10 Regional Demand and Opportunities
- 12.6 Segment Growth Comparison
- 12.7 Segment Attractiveness and Priority Matrix
Chapter 13 Global Blind Box Toy Geographic Market Outlook, 2025-2035
- 13.1 Regional Market Size and Share, 2025
- 13.2 Regional Market Forecast, 2025-2035
- 13.3 Regional Pricing, Production and Demand Differences
- 13.4 North America
- 13.4.1 United States
- 13.4.2 Canada
- 13.4.3 Mexico
- 13.5 Europe
- 13.5.1 Germany
- 13.5.2 France
- 13.5.3 Italy
- 13.5.4 United Kingdom
- 13.5.5 Spain
- 13.5.6 Poland
- 13.5.7 Russia
- 13.5.8 Netherlands
- 13.5.9 Belgium
- 13.5.10 Sweden
- 13.5.11 Denmark
- 13.5.12 Norway
- 13.5.13 Rest of Europe
- 13.6 Asia Pacific
- 13.6.1 China
- 13.6.2 India
- 13.6.3 Japan
- 13.6.4 South Korea
- 13.6.5 Thailand
- 13.6.6 Indonesia
- 13.6.7 Vietnam
- 13.6.8 Malaysia
- 13.6.9 Australia
- 13.6.10 Rest of Asia Pacific
- 13.7 Latin America
- 13.7.1 Brazil
- 13.7.2 Argentina
- 13.7.3 Colombia
- 13.7.4 Chile
- 13.7.5 Rest of Latin America
- 13.8 Middle East
- 13.8.1 Saudi Arabia
- 13.8.2 United Arab Emirates
- 13.8.3 Turkey
- 13.8.4 Israel
- 13.8.5 Iran
- 13.8.6 Rest of the Middle East
- 13.9 Africa
- 13.9.1 South Africa
- 13.9.2 Egypt
- 13.9.3 Nigeria
- 13.9.4 Morocco
- 13.9.5 Rest of Africa
- 13.10 Regional Investment, Policy and Supply Chain Differences
- 13.11 Regional Competitive Landscape
- 13.12 Geographic Growth Hotspots
Chapter 14 Global Blind Box Toy Technology, Innovation and Sustainability Outlook
- 14.1 Technology Landscape and Maturity
- 14.2 Product, Process and Service Innovation
- 14.3 AI, Automation and Digital Tools in the Industry
- 14.4 Technology Adoption and Performance Benchmarking
- 14.5 Innovation Pipeline and R&D Investment
- 14.6 Patent and Intellectual Property Trends
- 14.7 Energy Efficiency and Resource Management
- 14.8 Sustainability, Recycling and Circularity
- 14.9 Technology Roadmap, 2025-2035
- 14.10 Risks of Obsolescence and Technology Substitution
Chapter 15 Global Blind Box Toy Market Key Strategic Imperatives
- 15.1 Growth and Market Entry Priorities
- 15.2 High-Return Products and Segments
- 15.3 Pricing, Profitability and Cost Optimization
- 15.4 Technology Investment and Product Differentiation
- 15.5 Supply Chain Localization and Resilience
- 15.6 Distribution and Customer Acquisition
- 15.7 Partnership, Acquisition and Capacity Strategy
- 15.8 Regional Expansion Priorities
- 15.9 Short-, Medium- and Long-Term Actions
Chapter 16 Competition Outlook
- 16.1 Industry Competition Characteristics
- 16.2 Market Structure and Concentration
- 16.3 Market Share and Competitive Positioning, 2025
- 16.4 Company-Wise Revenue and Product Benchmarking
- 16.5 Production and Service Capacity Benchmarking
- 16.6 Technology, Pricing and Differentiation
- 16.7 Regional Footprint and Distribution Strength
- 16.8 Mergers, Acquisitions and Strategic Alliances
- 16.9 New Entrants and Competitive Threats
- 16.10 Porter's Five Forces and Industry Attractiveness
- 16.11 Competitive Outlook, 2025-2035
Chapter 17 Company Profiles
- 17.1 Company Coverage and Selection Criteria
- 17.2 Pop Mart
- 17.2.1 Business Description
- 17.2.2 Company Ownership and Geographic Presence
- 17.2.3 Product and Service Portfolio
- 17.2.4 Manufacturing and Operating Footprint
- 17.2.5 Production Capacity and Expansion Plans
- 17.2.6 Financial Performance and Investment
- 17.2.7 Market Share and Competitive Position
- 17.2.8 Technology and Innovation Capabilities
- 17.2.9 Strategic Alliances or Partnerships
- 17.2.10 Recent Developments
- 17.2.11 Growth Strategy and Outlook
- 17.3 52TOYS
- 17.4 TOP TOY (Miniso)
- 17.5 Bandai Namco (Gashapon)
- 17.6 Dreams Inc. (Sonny Angel)
- 17.7 Other Relevant Market Participants
Note: Every listed company is profiled on the structure shown under the first company. The company list is preliminary and may change based on research findings, market developments, data availability and client requirements.
Chapter 18 Disclaimer
- 18.1 Research and Forecast Disclaimer
- 18.2 Data Source and Estimation Limitations
Note: The depth of individual sections depends on data availability for this market. Volume, capacity, trade and other unit-based metrics are included where applicable.