HIV care and long-acting prevention anchor antiviral demand
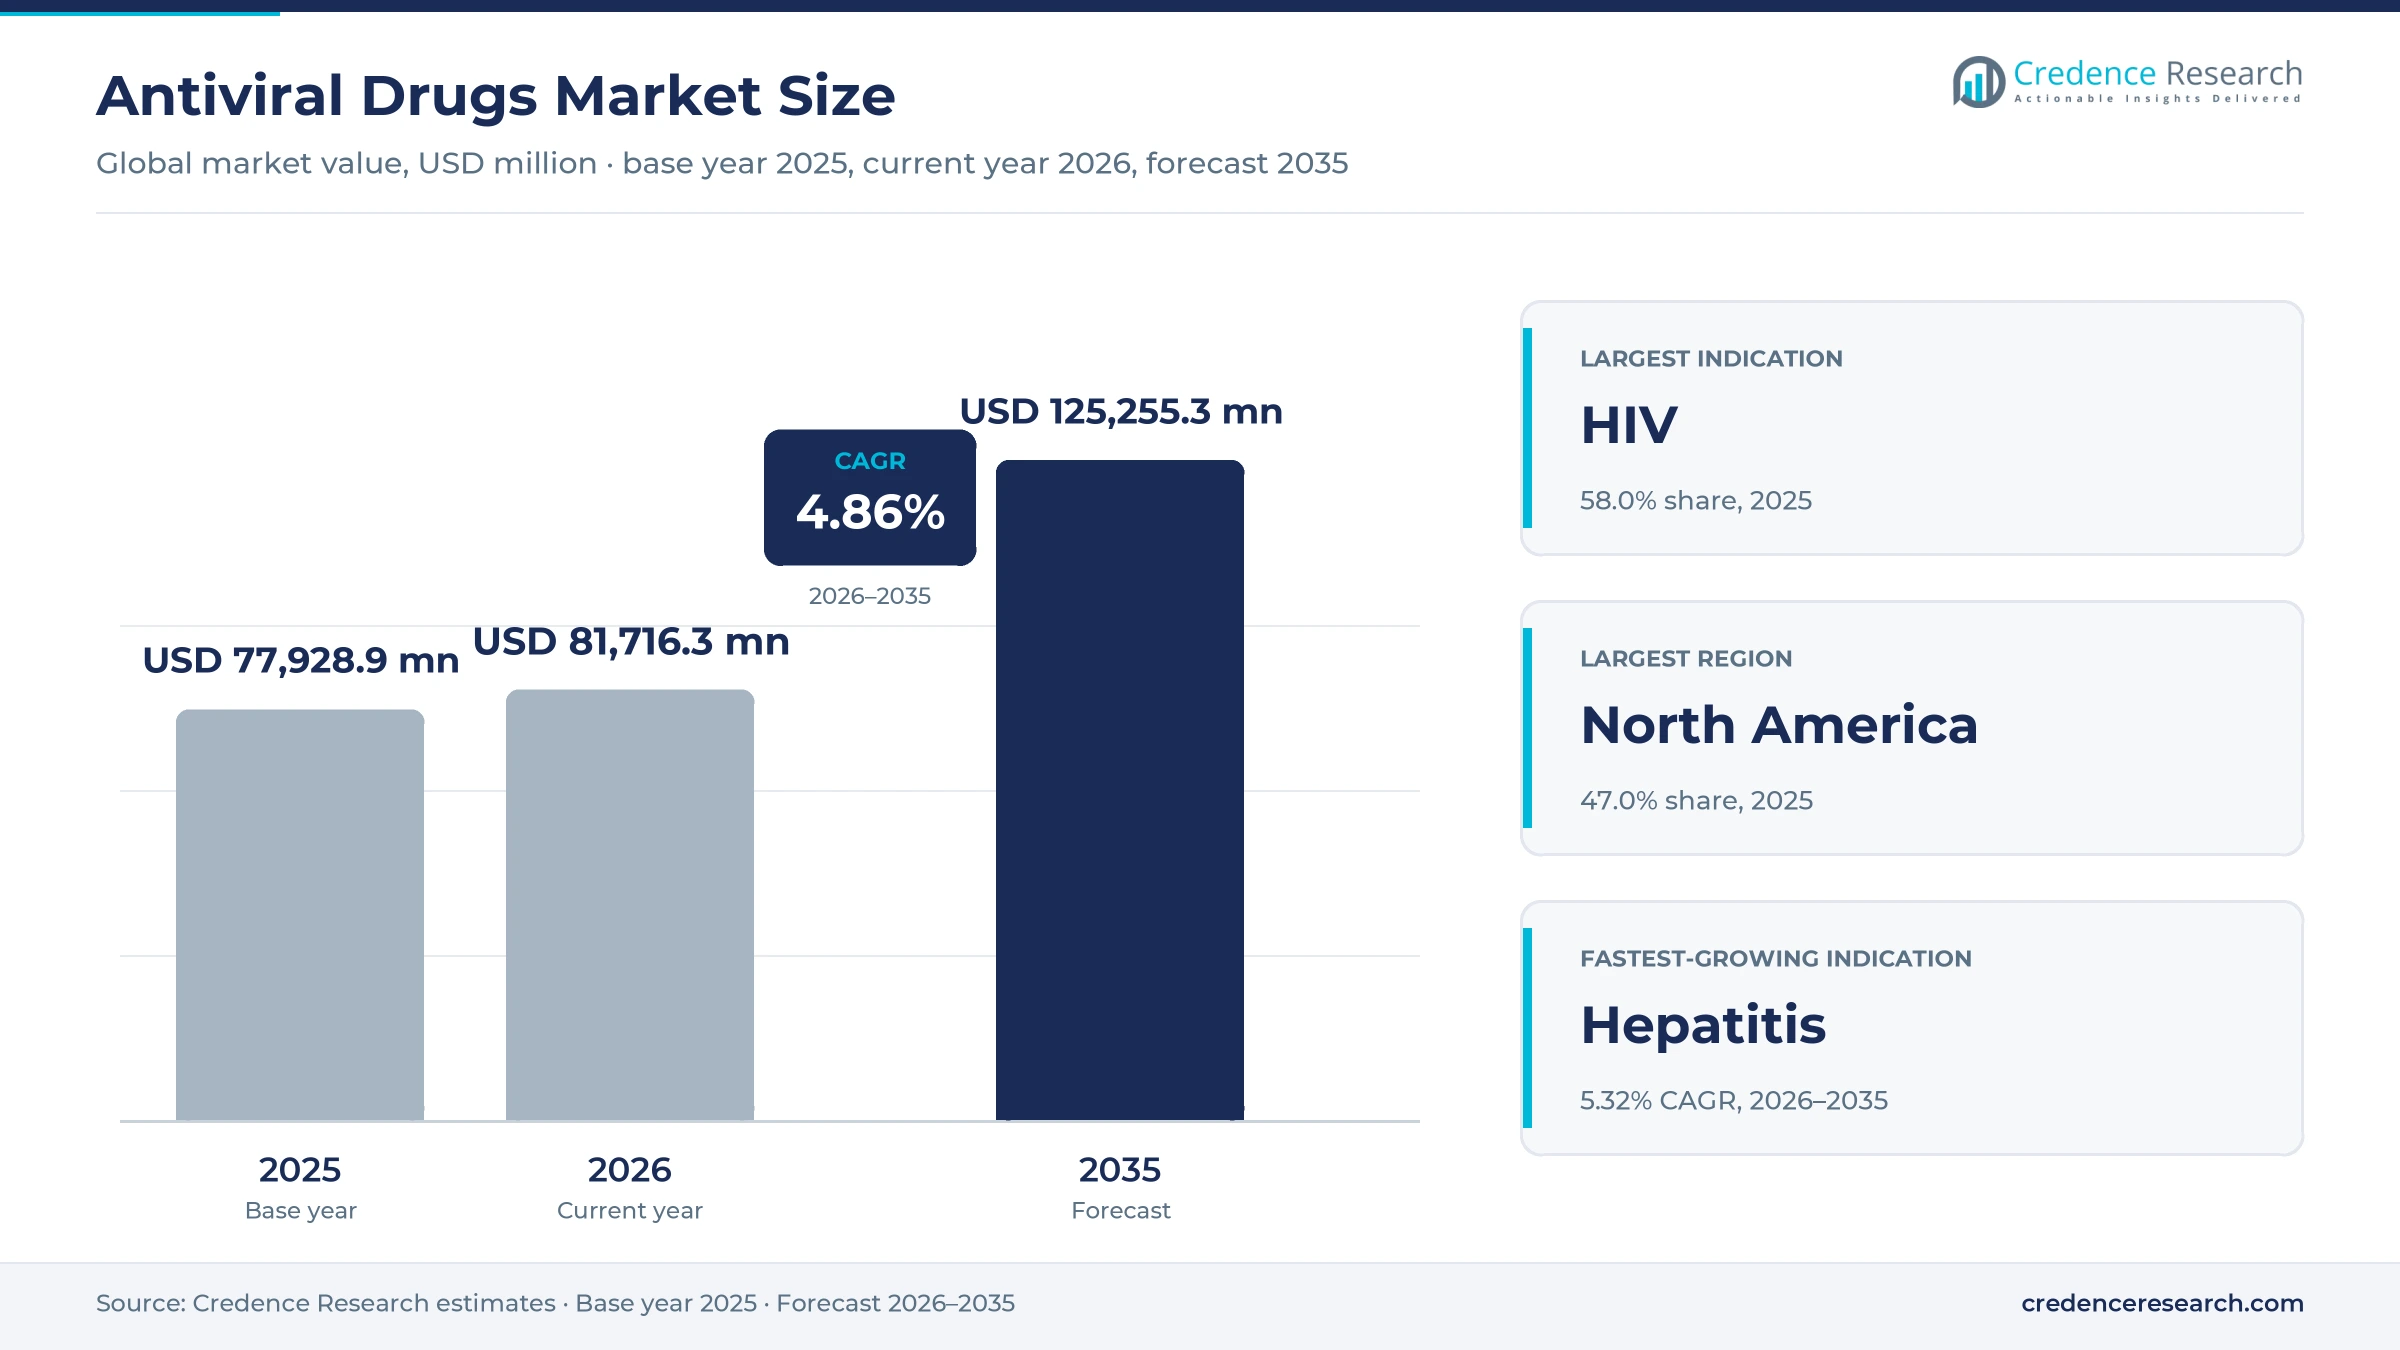
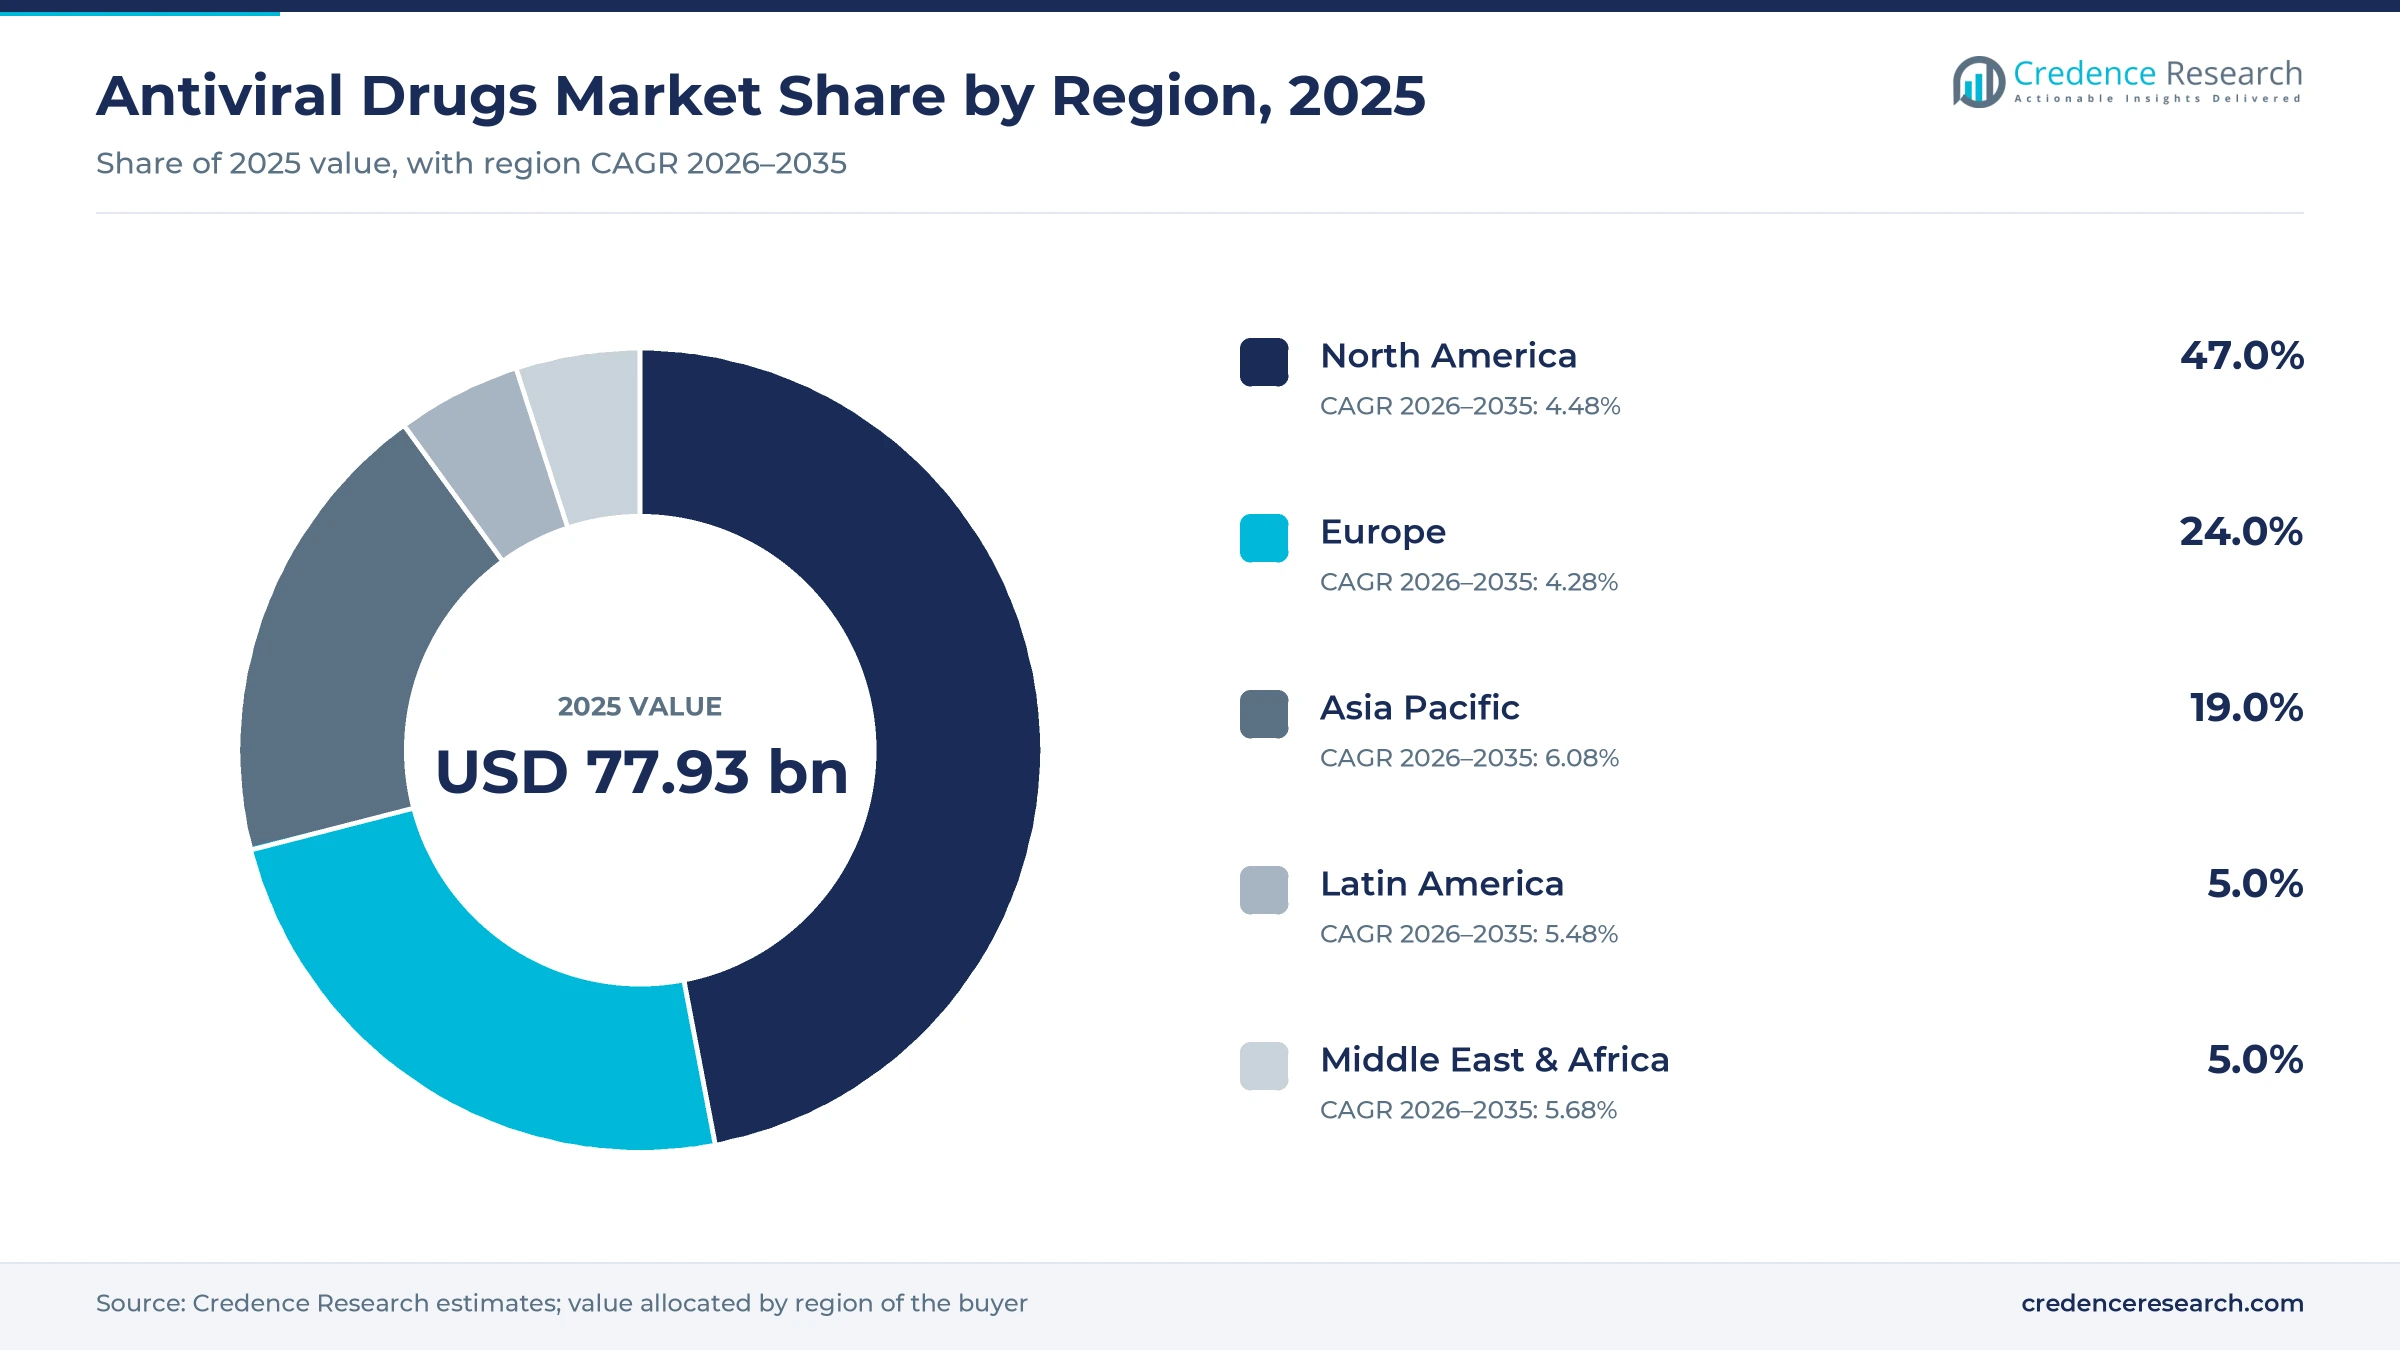
The global antiviral drugs market was valued at USD 77.93 billion in 2025 and is projected to increase from USD 81.72 billion in 2026 to USD 125.26 billion by 2035, registering a CAGR of 4.86% during 2026–2035. Demand rests on lifelong antiretroviral therapy for HIV, chronic hepatitis B and C treatment, seasonal influenza courses and herpes suppression, which together keep prescriptions moving every year. North America held the largest regional share, 47.0% in 2025, because branded HIV regimens and prevention products sell at the highest net prices there. Asia Pacific is the fastest-growing region at 6.08% a year, as hepatitis screening widens and generic makers in India expand supply. The commercial picture changed in 2025 and 2026, when U.S. regulators cleared a twice-yearly HIV prevention injection, a two-drug HIV tablet without an integrase inhibitor and the first oral pill for COVID-19 prevention after exposure. As a result, value is tilting toward long-acting and preventive antivirals.
Which antiviral medicines and buyers does this analysis cover?
The analysis counts prescription antivirals used to treat or prevent HIV, hepatitis B and C, herpes viruses, influenza, COVID-19 and other viral infections in people, valued at manufacturer selling prices. Retail and specialty pharmacies dispense most oral regimens against prescriptions, while hospitals buy intravenous agents and long-acting injectables through formularies and tenders. HIV medicines are counted for both treatment and pre-exposure prophylaxis, because the same originators and generic suppliers serve both uses.
Vaccines, monoclonal antibodies used only for passive immunization and diagnostic tests sit outside the scope of this analysis. The value chain runs from active ingredient producers in India and China through originator brands and generic formulators to wholesalers, pharmacies, national programs and donors that fund treatment in lower-income countries.
Antiviral Drugs Market Insights
- The antiviral drugs market grows from USD 77.93 billion in 2025 to USD 125.26 billion by 2035, a 4.86% CAGR built on lifelong HIV therapy, hepatitis treatment and long-acting prevention.
- North America held 47.0% of global antiviral value in 2025, supported by branded HIV regimens, prevention injections and higher net prices.
- HIV led indications with 58.0% of 2025 value, while hepatitis grows fastest at 5.32% a year as screening and new hepatitis B approaches expand.
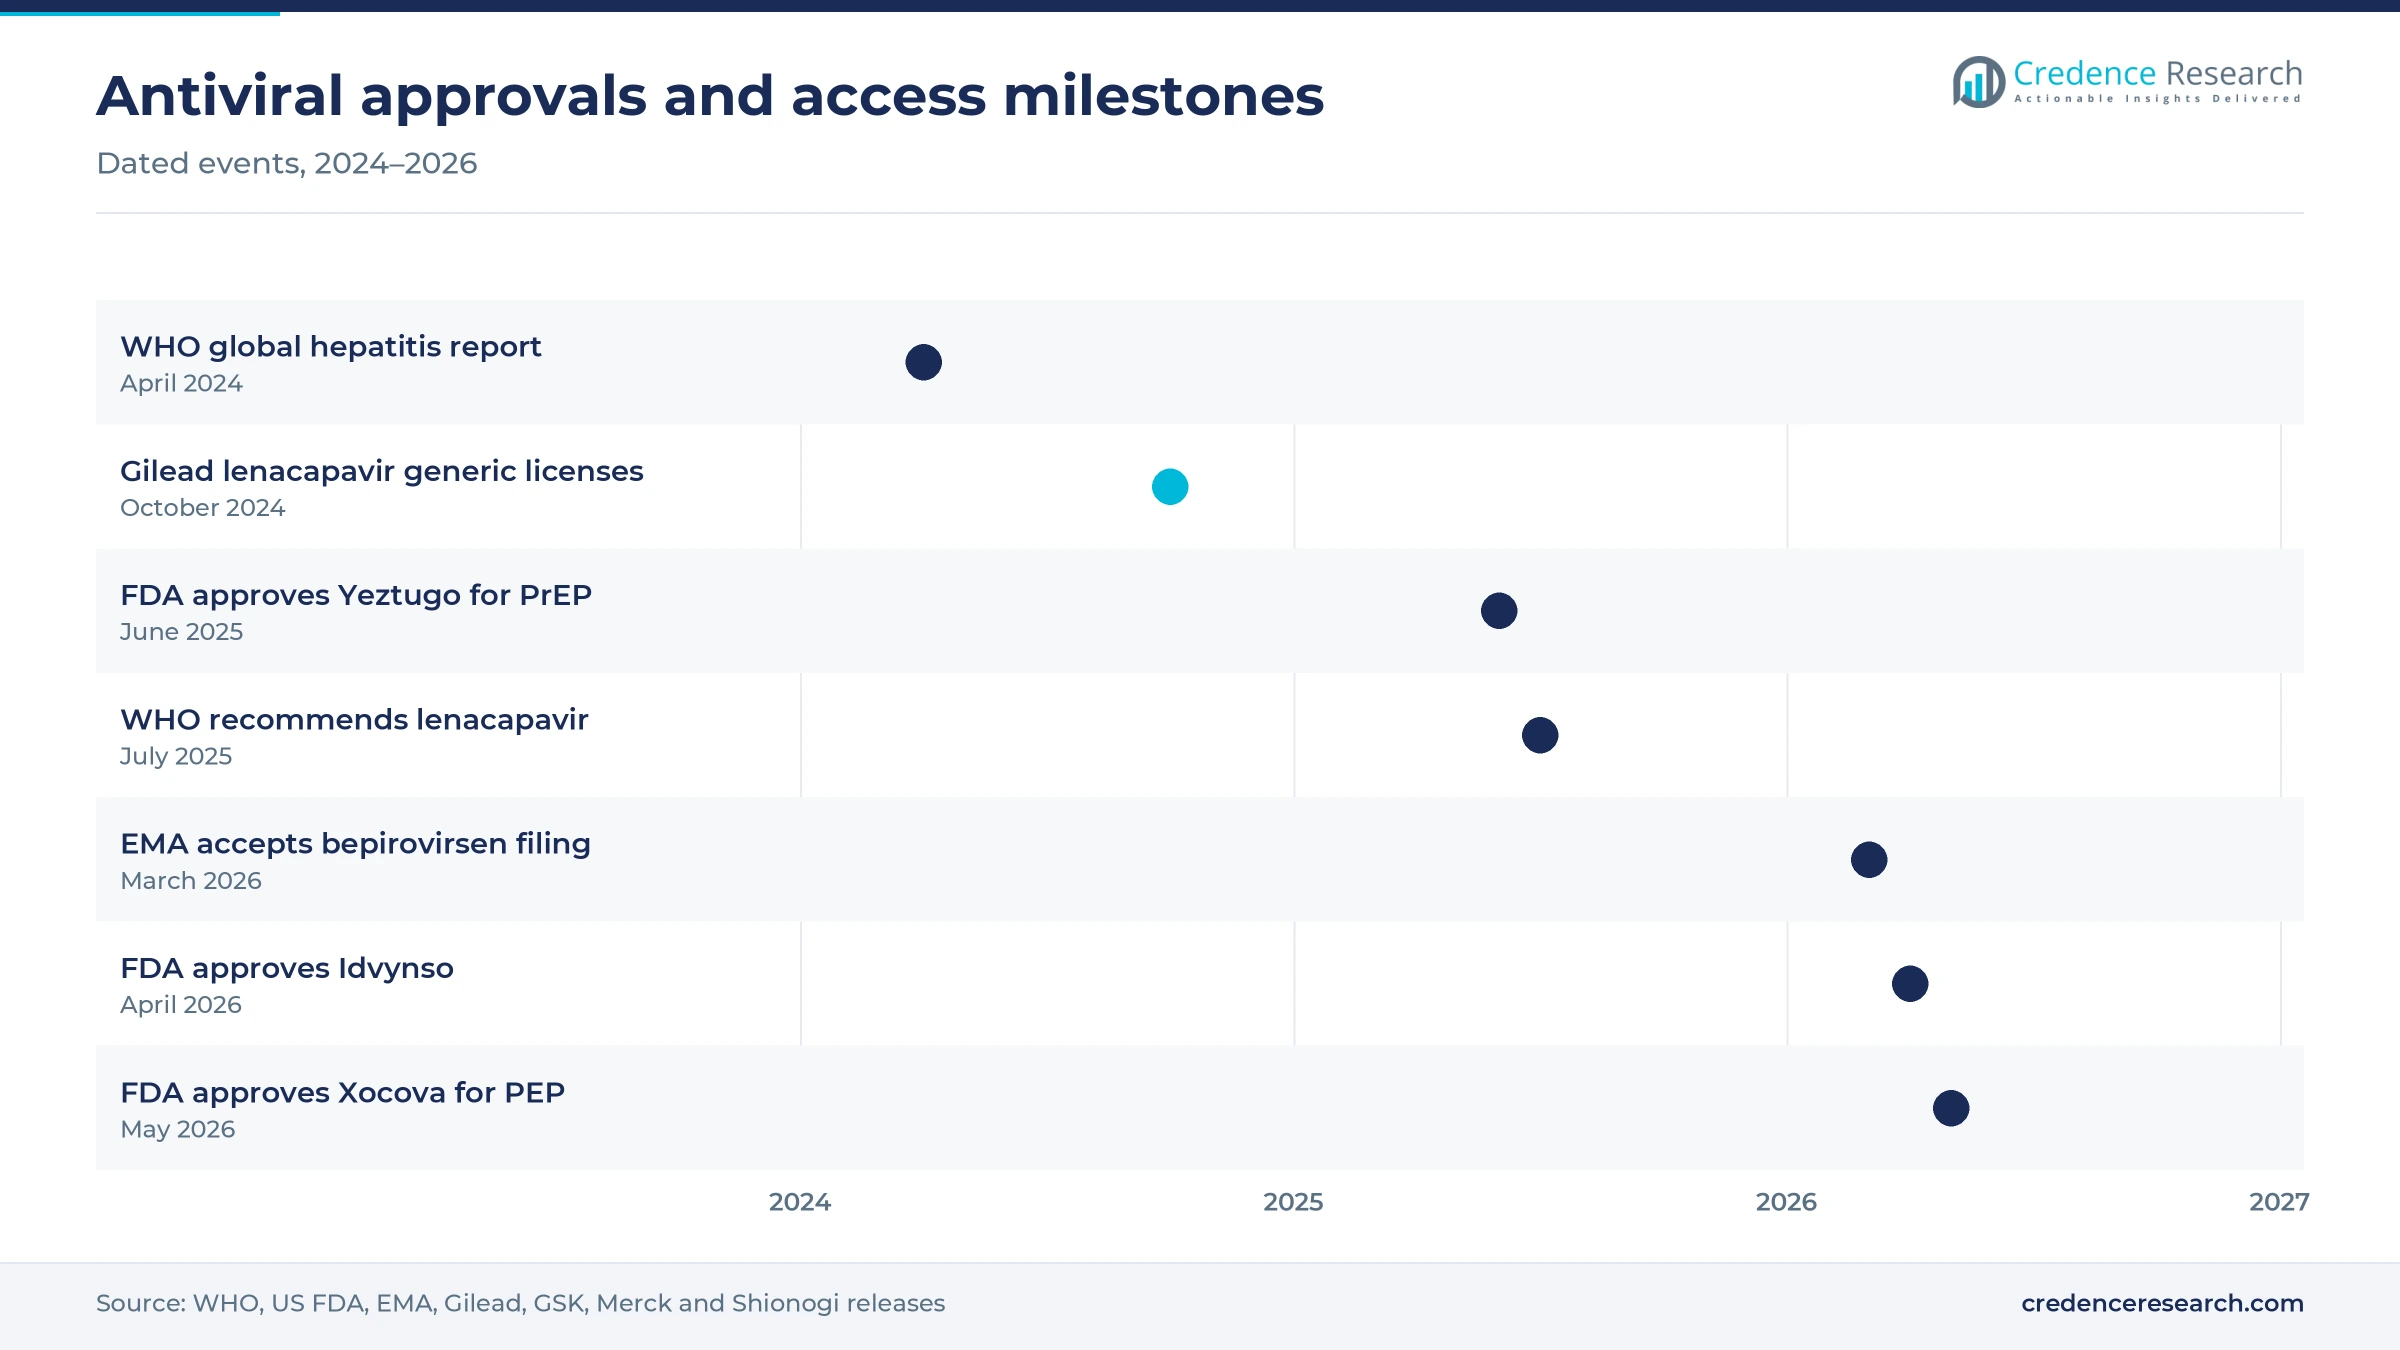
- In April 2026, U.S. regulators approved Merck's Idvynso, a once-daily two-drug HIV tablet combining doravirine with islatravir for virologically suppressed adults.
- Gilead's royalty-free lenacapavir licenses with six generic makers, signed in October 2024, pair premium pricing in rich countries with low-cost supply in 120 countries.
Combination regimens lead while hepatitis care gains pace
Why do combination regimens hold the largest therapy share?
Based on type of therapy, the market is categorized into monotherapy and combination therapy. Combination Therapy led with a 62.0% share of 2025 value, because HIV and hepatitis C are treated with single tablets that combine two or more agents. Monotherapy grows fastest at 5.23% a year, since twice-yearly prevention injections and single-agent influenza and COVID-19 pills reach new patients. This shift keeps both formats relevant for originators and generic suppliers.
How is the mechanism mix moving beyond older drug classes?
Based on mechanism of action, the market is categorized into fusion inhibitors, DNA polymerase inhibitors, protease inhibitors, reverse transcriptase inhibitors and others. Reverse Transcriptase Inhibitors led with a 40.0% share of 2025 value, because nucleoside and non-nucleoside agents form the backbone of most HIV and hepatitis B regimens. Others grow fastest at 5.76% a year, a group that includes integrase inhibitors, capsid inhibitors and endonuclease inhibitors. Fusion inhibitors remain a small niche for heavily treated HIV patients.
Which viral infections account for the most spending?
Based on indication, the market is categorized into HIV, hepatitis, herpes, influenza and others. HIV led with a 58.0% share of 2025 value, because patients take antiretroviral therapy every day for life. Hepatitis grows fastest at 5.32% a year, as screening programs find more people with chronic hepatitis B and C. In turn, demand for hepatitis C treatment rises in Asia and Africa, where most undiagnosed patients live.
Where do patients and programs obtain these medicines?
Based on distribution channel, the market is categorized into hospital pharmacy, retail pharmacy, online pharmacy and others. Retail Pharmacy led with a 46.0% share of 2025 value, because oral HIV, hepatitis and herpes medicines are refilled in the community. Online Pharmacy grows fastest at 6.45% a year, as mail-order HIV refills and telehealth prescribing for influenza move volume online. Hospital pharmacies keep a large share through intravenous agents and clinic-administered injections.
| Segment Group | Leading Sub-segment | Share, 2025 | Fastest-growing Sub-segment | CAGR, 2026–2035 |
|---|---|---|---|---|
| By Type of Therapy | Combination Therapy | 62.0% | Monotherapy | 5.23% |
| By Mechanism of Action | Reverse Transcriptase Inhibitors | 40.0% | Others | 5.76% |
| By Indication | HIV | 58.0% | Hepatitis | 5.32% |
| By Distribution Channel | Retail Pharmacy | 46.0% | Online Pharmacy | 6.45% |
Request a Free Sample
Fill in your details and we'll send you a free sample report.
- Sample data tables & charts
- Research methodology
HIV treatment gaps and hepatitis burden lift demand
Why does the HIV treatment gap keep demand rising?
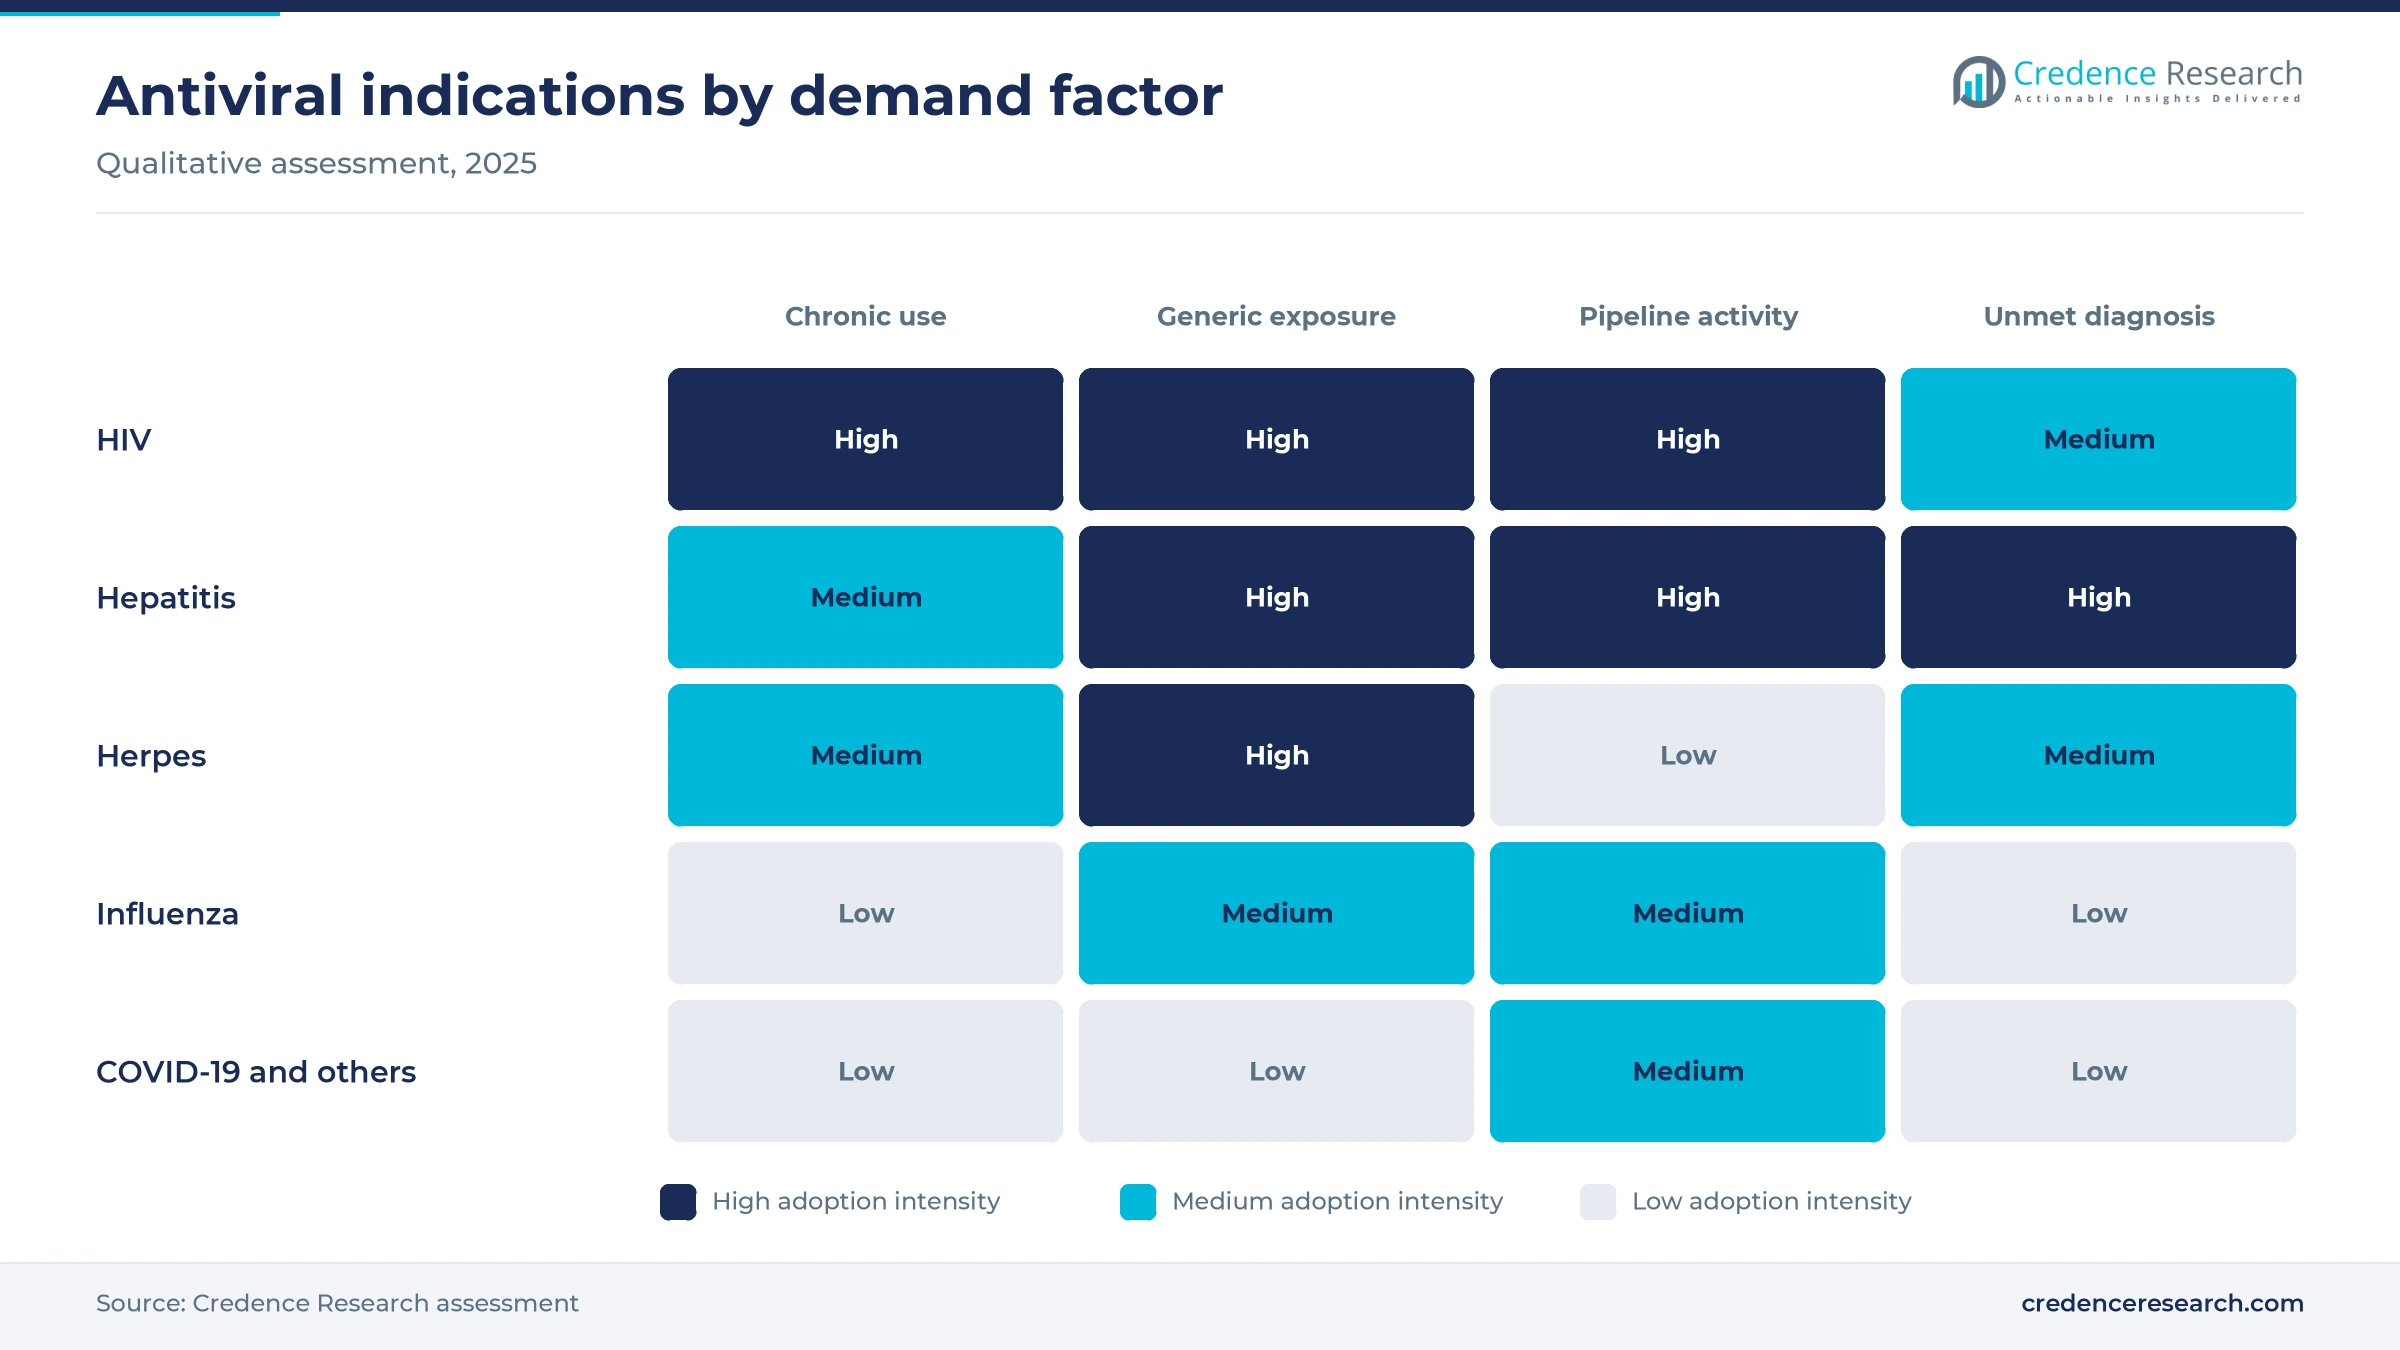
HIV forms the largest recurring demand base, because people living with HIV take antiretroviral medicines every day for life. According to the UNAIDS global HIV fact sheet, 41.0 million people were living with HIV in 2025 and 32.1 million were accessing antiretroviral therapy. This leaves close to nine million people outside treatment, and national programs and donors aim to close that gap. As a result, generic fixed-dose combinations expand volume in Africa and Asia, while branded regimens hold value in high-income countries.
How does the hepatitis burden widen the treatment pool?
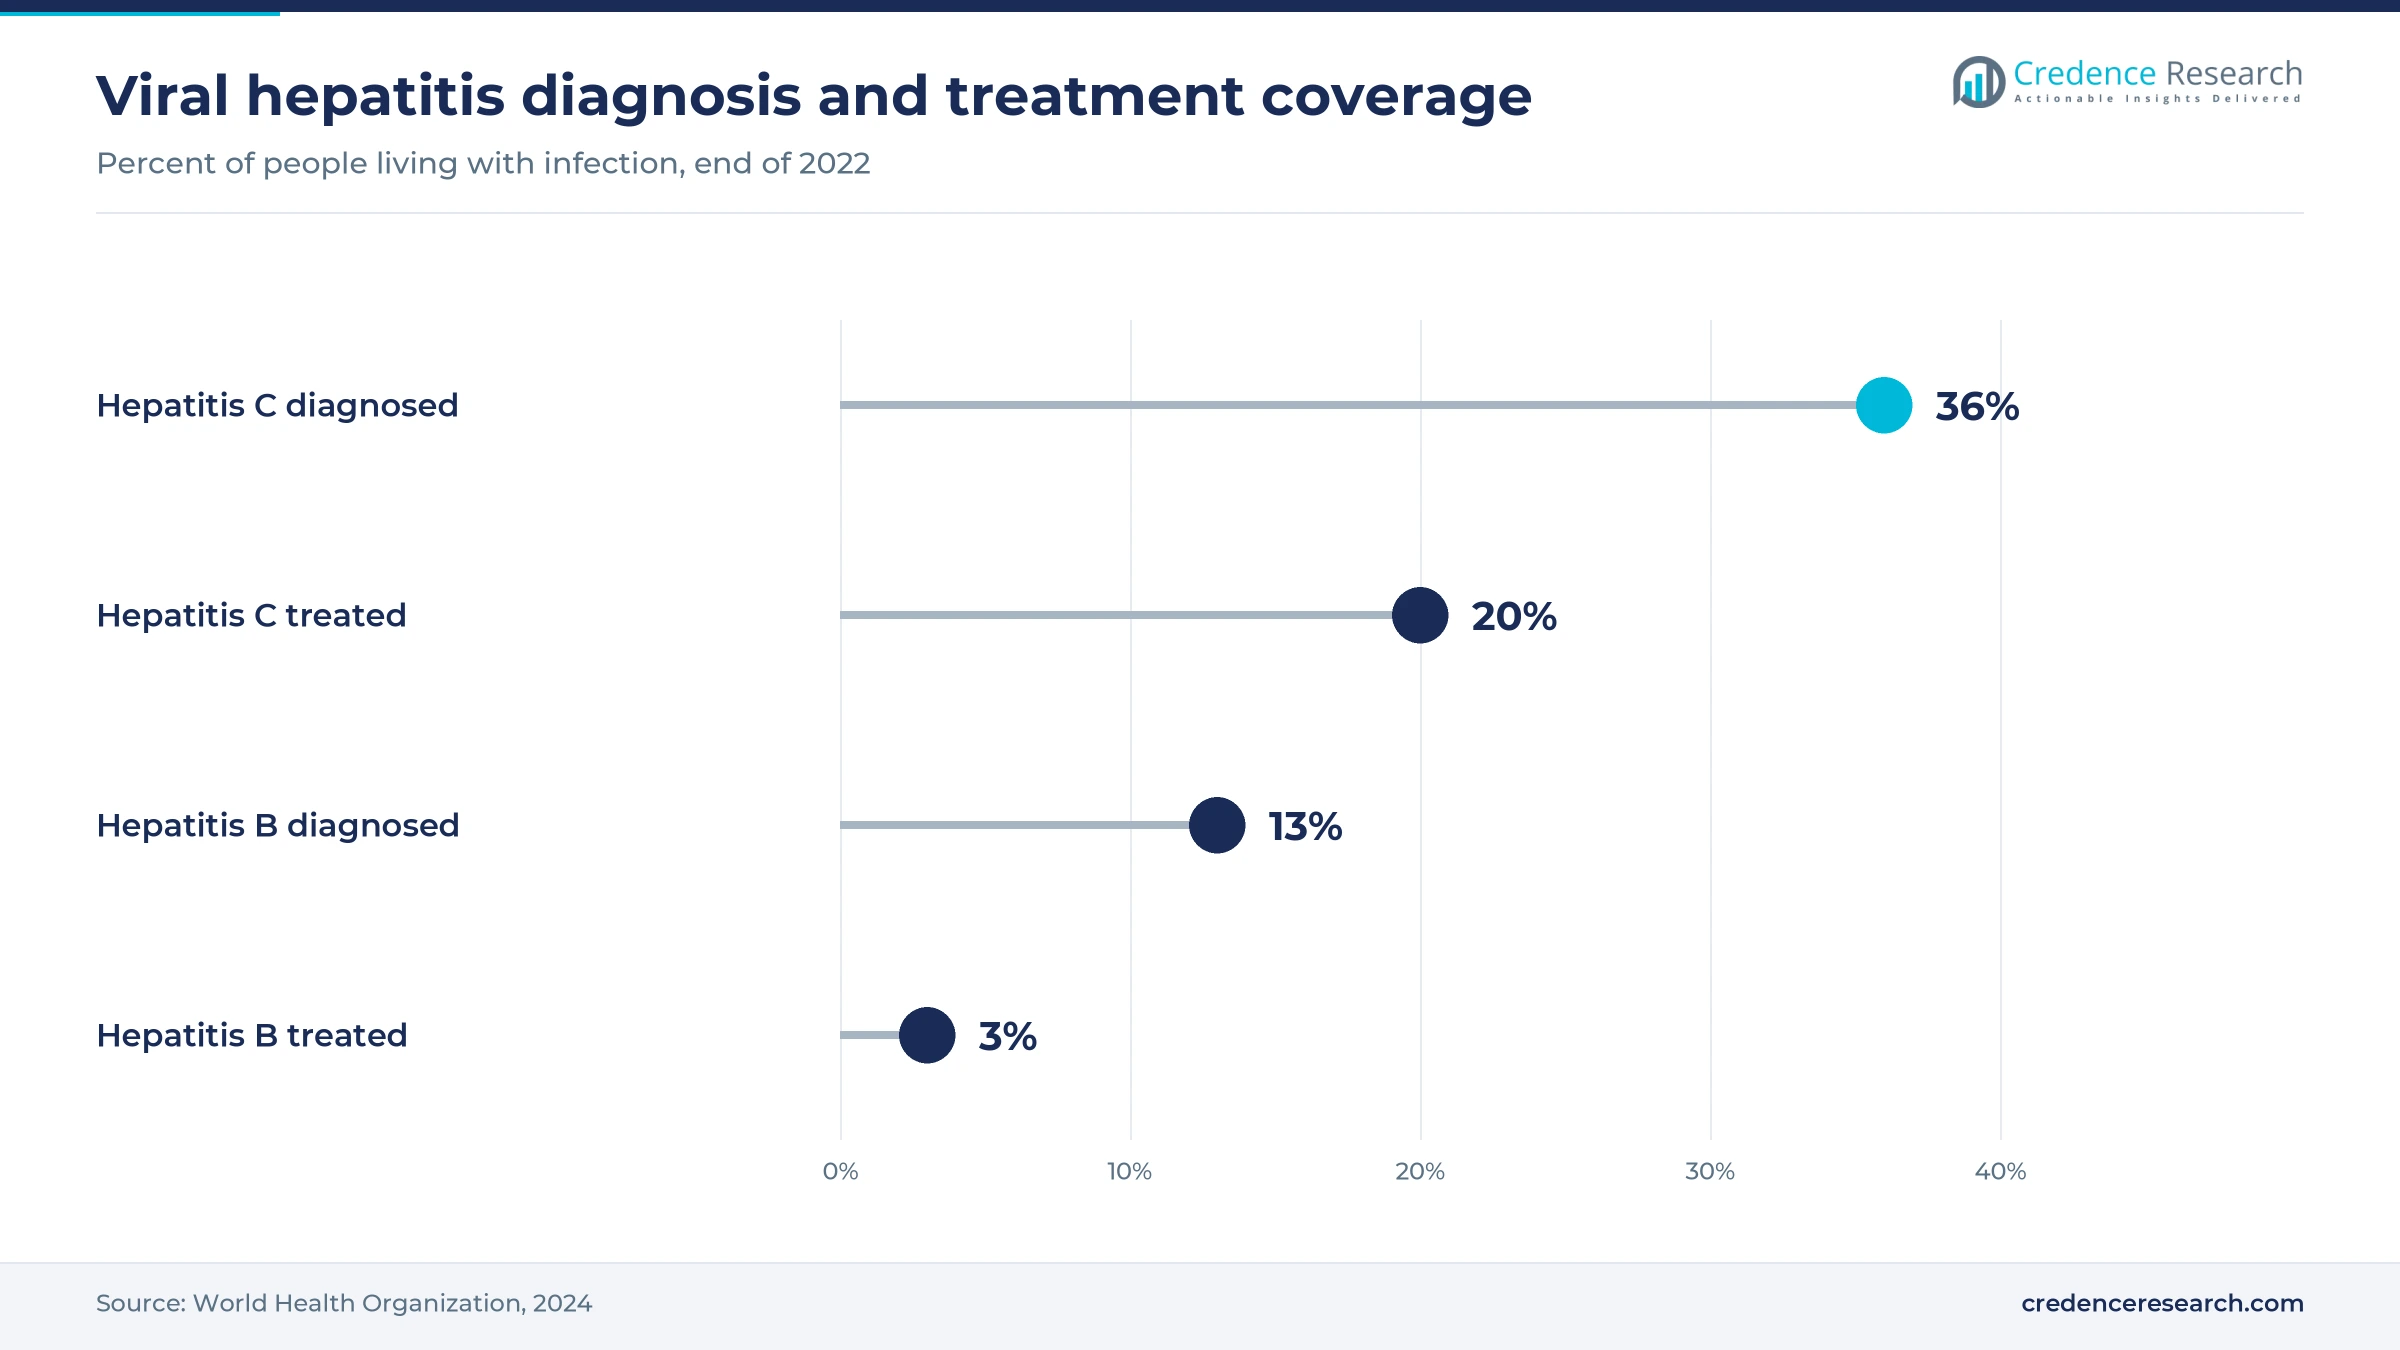
Chronic viral hepatitis is a large and underserved pool of patients, because most people with the disease have never been diagnosed. The World Health Organization reported in April 2024 that 254 million people lived with hepatitis B and 50 million with hepatitis C in 2022, and that viral hepatitis causes 1.3 million deaths a year. Only 3% of people with chronic hepatitis B had received antiviral therapy by the end of 2022. This gap means that each expansion of screening adds patients who need long-term or curative treatment.
How is long-acting prevention adding new patients?
Prevention is turning healthy people at risk into antiviral users, which widens the market beyond those already infected. In June 2025, the U.S. Food and Drug Administration approved Gilead's Yeztugo (lenacapavir) as a twice-yearly injection for HIV pre-exposure prophylaxis in adults and adolescents. The World Health Organization then recommended injectable lenacapavir as an additional prevention option in July 2025. Because each dose protects for six months, adherence improves and programs can reach people who struggle with daily pills.
Why do respiratory viruses keep seasonal demand steady?
Respiratory viruses create recurring seasonal demand, because influenza and COVID-19 return every winter in both hemispheres. Older adults, people with chronic illness and households with exposed contacts account for most prescriptions written in clinics and pharmacies. In May 2026, U.S. regulators approved Shionogi's Xocova (ensitrelvir) as the first oral option for COVID-19 prevention after exposure in people aged 12 and older. In turn, demand for influenza therapeutics and COVID-19 pills stays tied to season severity.
Twice-yearly dosing and two-drug regimens reshape therapy
Is twice-yearly dosing shifting the HIV prevention mix?
Long-acting dosing is the clearest shift in antiviral prescribing, because it removes the daily pill burden that limits adherence. The rise of twice-yearly lenacapavir moves value toward clinic-administered injections and specialty pharmacies. This shift also changes how programs buy medicines, since two injections a year replace monthly pill refills for people on pre-exposure prophylaxis. As a result, hospital and clinic channels gain share in prevention, while retail pharmacies keep most daily oral treatment volume.
Are two-drug regimens emerging as a new HIV standard?
Two-drug regimens are emerging as an alternative to three-drug therapy, because fewer agents can mean fewer long-term side effects. In April 2026, the U.S. Food and Drug Administration approved Merck's Idvynso (doravirine and islatravir) as a once-daily tablet for adults with virologically suppressed HIV-1. It is the first approved regimen that contains neither an integrase inhibitor nor tenofovir. This rise of new combinations gives prescribers more choice for switching patients, and it intensifies competition among HIV originators.
Where can generic makers capture growth in HIV prevention access?
Licensed generic lenacapavir is an opportunity for Indian and Egyptian manufacturers, because donors buy prevention products in very large volumes. In October 2024, Gilead signed royalty-free licenses with six generic makers, including Dr. Reddy's Laboratories, to supply lenacapavir in 120 countries. This model gives Indian producers, which already supply a large share of donor-funded HIV-1 therapies, a route into long-acting products. In turn, suppliers that win Global Fund and national tenders can offset thin unit margins with multi-year prevention volumes.
Can functional cure approaches open a hepatitis B opportunity?
Hepatitis B offers an opening for companies that can move beyond lifelong suppression toward a functional cure. In March 2026, the European Medicines Agency accepted GSK's marketing application for bepirovirsen, an antisense medicine for chronic hepatitis B, after two phase III trials. Because current nucleoside analogs require years of daily use, a finite-duration therapy could command premium prices in Asia, Europe and North America. As a result, hepatitis can grow faster than the overall market if such products reach approval and reimbursement.
Generic erosion and diagnosis gaps restrain value growth
How does generic price erosion limit value growth?
Generic tenofovir, lamivudine, dolutegravir and sofosbuvir bought by public programs cost a small fraction of originator prices, because many manufacturers bid for the same public contracts. Indian producers such as Cipla, Aurobindo Pharma and Sun Pharmaceutical supply low-cost versions to public programs in Africa, Asia and Latin America. This pressure means that rising patient numbers do not translate into proportional value growth. As a result, originators offset erosion with long-acting formulations, new combinations and pediatric versions that carry better margins.
Why do diagnosis gaps hold back hepatitis treatment?
Low diagnosis rates are the main barrier in hepatitis, because patients who are never tested never receive treatment. The World Health Organization found that only 13% of people with chronic hepatitis B and 36% of people with hepatitis C had been diagnosed by the end of 2022. Treatment coverage was lower still, at 3% for hepatitis B and 20% for hepatitis C. In turn, growth depends on screening budgets and simplified care models in high-burden countries.
Does seasonal volatility make respiratory sales unpredictable?
Seasonal volatility makes influenza and COVID-19 sales hard to forecast, because demand rises and falls with the severity of each winter. A mild season can leave pharmacies and government stockpiles with excess inventory, which depresses orders in the following year. Pfizer and Shionogi face this pattern in their respiratory portfolios, while governments adjust stockpiling budgets after each pandemic review. However, steady prevention use among high-risk groups provides a partial floor under respiratory antiviral demand.
Why does drug resistance complicate long-term therapy?
Drug resistance complicates long-term therapy, because viruses that replicate under incomplete suppression can escape older agents. Patients who miss doses or receive weak regimens may need costlier second-line or salvage treatment, which strains program budgets in lower-income countries. This risk keeps resistance testing and adherence support central to HIV and hepatitis B care. As a result, prescribers favor high-barrier regimens, and developers must show activity against resistant strains to win formulary listings.
North America leads as Asia Pacific expands access
| Region | Value, 2025 (USD billion) | Share, 2025 | CAGR, 2026–2035 |
|---|---|---|---|
| North America | 36.63 | 47.0% | 4.48% |
| Europe | 18.70 | 24.0% | 4.28% |
| Asia Pacific | 14.81 | 19.0% | 6.08% |
| Latin America | 3.90 | 5.0% | 5.48% |
| Middle East & Africa | 3.90 | 5.0% | 5.68% |
Why does North America hold the largest regional share?
North America held a 47.0% share of 2025 value and grows at 4.48% a year through 2035. The United States drives this position, because branded HIV regimens, long-acting prevention and respiratory antivirals sell at the highest net prices in the world. Recent U.S. approvals for HIV prevention, two-drug HIV therapy and COVID-19 prevention reach this region first. However, generic entry for older HIV agents and pharmacy benefit managers pushing for lower net prices hold regional growth under the worldwide pace.
How fast is Asia Pacific catching up?
Asia Pacific held a 19.0% share of 2025 value and is the fastest-growing region at 6.08% a year. China and India carry the largest hepatitis B and C burdens in the world, and expanding insurance coverage lifts the number of patients treated. India is also a leading supplier of generic antiretrovirals and hepatitis medicines, giving Cipla, Aurobindo Pharma and Sun Pharmaceutical scale at home and abroad. Japan adds a high-value market for influenza and COVID-19 pills developed by Shionogi.
What shapes demand across Europe?
Europe held a 24.0% share of 2025 value and grows at 4.28% a year, the slowest pace of the five regions. Centralized pricing and tenders hold down prices across Germany, France, Italy and Spain, and most diagnosed HIV patients in Western Europe are already on therapy. However, hepatitis C elimination programs and long-acting HIV injections add new value. A potential hepatitis B functional cure would also reach European patients early, given the regulatory review under way since March 2026.
Where is Latin America adding demand?
Latin America held a 5.0% share of 2025 value and grows at 5.48% a year through 2035. Brazil and Mexico lead regional demand, supported by public HIV programs that buy antiretrovirals centrally and by hepatitis C treatment campaigns. Budget limits slow the adoption of premium long-acting products, so generic supply dominates volumes in most countries.
What limits growth in the Middle East and Africa?
The Middle East and Africa held a 5.0% share of 2025 value and grows at 5.68% a year through 2035. Sub-Saharan Africa carries the largest HIV burden in the world, but donor-funded generics keep spending per patient low. Generic lenacapavir supply under the 2024 licenses is expected to widen prevention access across the region.
Approvals and licensing deals redraw viral disease care
| Development | Status and market relevance |
|---|---|
| In October 2024, Gilead signed royalty-free voluntary licensing agreements with six generic manufacturers, including Dr. Reddy's Laboratories, for lenacapavir in 120 countries. | Licenses in place; sets the access model for long-acting HIV prevention in lower-income countries |
| In June 2025, Gilead announced U.S. Food and Drug Administration approval of Yeztugo (lenacapavir) for HIV pre-exposure prophylaxis. | Approved in the U.S.; first twice-yearly HIV prevention option |
| In March 2026, the European Medicines Agency accepted GSK's marketing application for bepirovirsen in chronic hepatitis B. | Under review in Europe; potential first-in-class functional cure approach |
| In April 2026, Merck announced U.S. Food and Drug Administration approval of Idvynso (doravirine and islatravir) for virologically suppressed HIV-1. | Approved in the U.S.; first regimen without an integrase inhibitor or tenofovir |
| In May 2026, Shionogi announced U.S. Food and Drug Administration approval of Xocova (ensitrelvir) for COVID-19 prevention after exposure. | Approved in the U.S.; first oral post-exposure option for COVID-19 |
Capsid inhibitors and new mechanisms shape the pipeline
- Capsid inhibitors such as lenacapavir disrupt several stages of the HIV life cycle and allow dosing every six months, which reduces adherence gaps.
- Nucleoside reverse transcriptase translocation inhibitors such as islatravir block viral DNA synthesis through a distinct mechanism, which enables new two-drug combinations.
- Antisense oligonucleotides such as bepirovirsen target hepatitis B viral RNA, which aims to suppress surface antigen and achieve a functional cure after finite treatment.
- Protease and endonuclease inhibitors used in oral COVID-19 and influenza pills stop viral replication early, which supports treatment and prevention after exposure.
Need a Custom Version of This Report?
Tailor the scope, geography, or segments to your exact requirements.
- Custom geography or segment scope
- Direct access to our analyst team
HIV originators and Indian generic makers split the field
Competition splits between originators that hold patented HIV, hepatitis and respiratory franchises and generic manufacturers that supply most volume. Gilead Sciences leads HIV treatment and prevention, while GlaxoSmithKline competes through ViiV Healthcare and its hepatitis B pipeline. Merck & Co. is rebuilding its HIV position with two-drug regimens, and Pfizer and Shionogi hold leading oral COVID-19 and influenza products. Sanofi maintains a presence in viral disease care, while Cipla, Aurobindo Pharma, Dr. Reddy's Laboratories and Sun Pharmaceutical compete on price in generic antiretrovirals and hepatitis medicines. These Indian producers increasingly win donor tenders in Africa and Asia. Originators differentiate through dosing intervals, resistance barriers and fewer agents per regimen, while generic makers win on cost and tender reliability. However, patent expiries on older HIV agents keep pressure on originators to move patients to newer regimens.
Companies profiled and their roles in this market
| Company | Type | Role in the market |
|---|---|---|
| Gilead Sciences, Inc. | Originator | HIV treatment and twice-yearly lenacapavir prevention |
| GlaxoSmithKline plc | Originator | HIV through ViiV Healthcare and bepirovirsen for hepatitis B |
| Merck & Co. | Originator | HIV two-drug regimens and CMV antivirals |
| Pfizer Inc. | Originator | Oral COVID-19 antivirals |
| Shionogi | Originator | Influenza and COVID-19 oral antivirals |
| Sanofi | Originator | Viral disease care portfolio |
| Cipla Inc. | Generics | Generic antiretrovirals and hepatitis medicines |
| Aurobindo Pharma | Generics | Generic antiretrovirals for donor programs |
| Dr. Reddy's Laboratories Ltd. | Generics | Generic antivirals and lenacapavir licensee |
| Sun Pharmaceutical Limited | Generics | Generic antivirals in India and emerging markets |
Value moves toward long-acting and curative approaches
Credence Research's view is that value in antivirals will concentrate in two places through 2035, long-acting HIV medicines and finite-duration hepatitis B therapy. Both segments command premium prices, because they solve problems that daily generic pills cannot solve, namely poor adherence and lifelong dependence on suppression. While the overall market grows at 4.86% a year, generic antiretrovirals will keep growing in volume across Asia Pacific and Africa, but their value share will drift lower as tender prices fall. The originators best placed for 2035 are those whose six-month or finite-duration products also reach donor programs through licensing.
How Credence Research sized antiviral medicine spending
Antiviral values in this edition use 2025 as the base year and 2026 to 2035 as the forecast window. Market values come from the Credence Research model, which adds up spending by type of therapy, mechanism of action, indication and distribution channel. Regional and segment splits are Credence Research estimates informed by regulator approvals, World Health Organization and UNAIDS surveillance data, and company press releases. No primary interviews or surveys were used in preparing this edition of the report.
Viral disease treatment spending outlook to 2035
By 2035, the antiviral drugs market is projected to reach USD 125.26 billion, with growth tilted toward HIV prevention, hepatitis and respiratory virus prevention. Long-acting injectables should take a larger share of HIV spending as prevention programs scale in Africa, Asia and Latin America. Hepatitis treatment should gain as screening expands and new approaches aim for a functional cure. Asia Pacific should add the largest number of new patients, while North America keeps the highest value per patient. As a result, the strongest positions will belong to companies that pair long-acting or curative products with low-cost supply for public programs.
Frequently Asked Questions
How big is the global antiviral drugs market?
Which indication leads antiviral spending?
Which region leads the antiviral drugs market?
What is changing in HIV prevention?
Which mechanism of action holds the largest share?
How large is the hepatitis treatment gap?
Who are the leading antiviral companies?
What restrains growth in antivirals?
Table of Content
Chapter 1 Market Segmentation
- 1.1 Segmentation Framework
- 1.1.1 Product and Service Classification
- 1.1.2 Application and End-Use Classification
- 1.1.3 Technology and Solution Classification
- 1.1.4 Customer and Distribution Channel Classification
- 1.1.5 Geographic Segmentation
- 1.1.6 Market Segment Definitions and Boundaries
- 1.2 By Type of Therapy
- 1.2.1 Monotherapy
- 1.2.2 Combination Therapy
- 1.3 By Mechanism of Action
- 1.3.1 Reverse Transcriptase Inhibitors
- 1.3.2 Protease Inhibitors
- 1.3.3 DNA Polymerase Inhibitors
- 1.3.4 Fusion Inhibitors
- 1.3.5 Others
- 1.4 By Indication
- 1.4.1 HIV
- 1.4.2 Hepatitis
- 1.4.3 Herpes
- 1.4.4 Influenza
- 1.4.5 Others
Chapter 2 Introduction
- 2.1 Report Objectives and Scope
- 2.2 Product Definition and Industry Terminology
- 2.3 Market Inclusions and Exclusions
- 2.4 Research Process
- 2.4.1 Primary Research and Expert Interviews
- 2.4.2 Secondary Research and Source Review
- 2.4.3 Top-Down and Bottom-Up Estimation
- 2.4.4 Data Triangulation and Verification
- 2.5 Market Size Measurement Basis
- 2.5.1 2025: USD 77.93 billion → 2035: USD 125.26 billion
- 2.6 Historical and Forecast Reference Periods
- 2.6.1 Historical Period: 2018-2025
- 2.6.2 Base Year: 2025
- 2.6.3 Forecast Period: 2025-2035
- 2.7 Research Assumptions and Limitations
Chapter 3 Executive Summary
- 3.1 Market Snapshot and Key Findings
- 3.2 Base-Year Market Size, 2025
- 3.3 Forecast Market Size, 2035
- 3.4 Revenue and Volume Growth Outlook
- 3.5 Key Demand and Supply Indicators
- 3.6 Leading Market Segments
- 3.7 Fastest-Growing Market Opportunities
- 3.8 Regional Performance Highlights
- 3.9 Technology and Industry Transformation
- 3.10 Competitive Landscape Summary
- 3.11 Analyst View and Strategic Implications
Chapter 4 Global Antiviral Drugs Market Trends and Developments
- 4.1 Historical Industry Development, 2018-2025
- 4.2 Recent Market Trends and Developments
- 4.3 Demand and Customer Behavior Trends
- 4.4 Technology and Product Innovation
- 4.5 Artificial Intelligence, Automation and Digitalization
- 4.6 Local Manufacturing and Supply Chain Realignment
- 4.7 Industry Partnerships, Mergers and Acquisitions
- 4.8 Sustainability and Circular Economy Developments
- 4.9 Government and Private Sector Investment Trends
- 4.10 Emerging Business Models and Commercialization
- 4.11 Industry Developments and Announcements
Chapter 5 Global Antiviral Drugs Market Production, Supply and Demand Analysis
- 5.1 Demand Trend and Consumption Analysis, 2018-2025
- 5.2 Demand Forecast, 2025-2035
- 5.3 Production and Output Trend, 2018-2025
- 5.4 Production and Output Forecast, 2025-2035
- 5.5 Installed Capacity and Capacity Utilization
- 5.6 Company-Wise Production Plants and Statistics
- 5.6.1 Installed Production Capacity
- 5.6.2 Actual Production
- 5.6.3 Planned Capacity and Expansion Targets
- 5.7 Supply Chain Structure and Procurement Trends
- 5.8 Supply-Demand Gap and Bottlenecks
- 5.9 Import Dependence and Sourcing Structure
- 5.10 Contract Manufacturing and Outsourcing
- 5.11 Regional Supply and Demand Concentration
Chapter 6 Global Antiviral Drugs Market Pricing Analysis
- 6.1 Pricing Structure and Measurement
- 6.2 Historical Pricing Trends, 2018-2025
- 6.3 Pricing Outlook, 2025-2035
- 6.4 Average Selling Price and Unit Economics
- 6.5 Pricing by Product and Market Segment
- 6.6 Geographic Pricing Differences
- 6.7 Key Input, Energy, Labor and Logistics Costs
- 6.8 Contract Pricing and Purchasing Models
- 6.9 Pricing Sensitivity and Competitive Positioning
- 6.10 Price, Margin and Profitability Implications
Chapter 7 Global Antiviral Drugs Market Dynamics
- 7.1 Market Growth Drivers
- 7.1.1 Demand-Side Drivers
- 7.1.2 Technology and Innovation Drivers
- 7.1.3 Infrastructure and Investment Drivers
- 7.1.4 Regulatory and Policy Drivers
- 7.2 Market Restraints
- 7.2.1 Cost and Affordability Constraints
- 7.2.2 Technology and Adoption Barriers
- 7.2.3 Supply Chain and Operational Constraints
- 7.3 Market Challenges
- 7.3.1 Competitive Pressure and Margin Erosion
- 7.3.2 Skills, Infrastructure and Implementation Gaps
- 7.4 Emerging Market Opportunities
- 7.5 Market Dynamics Impact and Time-Horizon Assessment
Chapter 8 Global Antiviral Drugs Value Chain Analysis
- 8.1 Industry Value Chain Overview
- 8.2 Upstream Suppliers and Critical Inputs
- 8.3 Technology and Component Providers
- 8.4 Manufacturing or Service Delivery
- 8.5 Distribution, Channel Partners and Integrators
- 8.6 Downstream Applications and End Users
- 8.7 Value Addition and Profit Pools
- 8.8 Vertical Integration and Outsourcing
- 8.9 Supplier Concentration and Risk
- 8.10 Supply Chain Localization and Resilience
Chapter 9 Global Antiviral Drugs Market Regulations and Policies
- 9.1 Relevant Laws, Standards and Compliance Frameworks
- 9.2 Product, Service, Safety and Quality Requirements
- 9.3 Government Policies, Incentives and Subsidies
- 9.4 Imports, Exports and Trade Barriers
- 9.5 Public Procurement and Local Content Requirements
- 9.6 Environmental and Sustainability Compliance
- 9.7 Upcoming Policy Changes and Market Implications
Chapter 10 Global Antiviral Drugs Market Hotspots and Opportunities
- 10.1 Market Opportunity Mapping and Growth Hotspots
- 10.2 High-Growth Applications and Customer Groups
- 10.3 Underserved Markets and White-Space Opportunities
- 10.4 Emerging Technology and Product Opportunities
- 10.5 New Capacity and Investment Hotspots
- 10.6 Market Entry and Expansion Opportunities
- 10.7 Distribution and Partnership Opportunities
- 10.8 Near-Term and Long-Term Commercial Potential
- 10.9 Opportunity Attractiveness and Execution Risks
Chapter 11 Global Antiviral Drugs Market Outlook, 2025-2035
- 11.1 Market Size and Analysis
- 11.1.1 Revenue (Market Measurement: 2025: USD 77.93 billion → 2035: USD 125.26 billion)
- 11.1.2 Market Volume and Quantity Sold
- 11.1.3 Historical Market Size, 2018-2025
- 11.1.4 Base-Year Market Size, 2025
- 11.2 Market Forecast, 2025-2035
- 11.2.1 Revenue Forecast to 2035
- 11.2.2 Volume Forecast to 2035
- 11.2.3 CAGR and Year-on-Year Growth
- 11.2.4 Incremental Revenue Opportunity
- 11.3 Forecast Assumptions and Scenario Analysis
- 11.3.1 Base-Case Forecast
- 11.3.2 Optimistic and Conservative Scenarios
- 11.3.3 Technology, Pricing and Policy Sensitivities
- 11.4 Market Attractiveness and Growth Outlook
Chapter 12 Global Antiviral Drugs Market Segmentation and Outlook
- 12.1 Segmentation Summary and Market Shares, 2025
- 12.2 Largest and Fastest-Growing Segments
- 12.3 By Type of Therapy - Market Size and Forecast, 2025-2035
- 12.3.1 Segment Definition and Scope
- 12.3.2 Historical Market Size, 2018-2025
- 12.3.3 Revenue Forecast, 2025-2035
- 12.3.4 Volume Forecast, 2025-2035
- 12.3.5 Base-Year Market Share, 2025
- 12.3.6 Segment CAGR and Growth Drivers
- 12.3.7 Subsegment Market Size and Forecast
- 12.3.7.1 Monotherapy
- 12.3.7.2 Combination Therapy
- 12.3.8 Subsegment Pricing and Adoption Trends
- 12.3.9 Leading Suppliers and Competition
- 12.3.10 Regional Demand and Opportunities
- 12.4 By Mechanism of Action - Market Size and Forecast, 2025-2035
- 12.4.1 Segment Definition and Scope
- 12.4.2 Historical Market Size, 2018-2025
- 12.4.3 Revenue Forecast, 2025-2035
- 12.4.4 Volume Forecast, 2025-2035
- 12.4.5 Base-Year Market Share, 2025
- 12.4.6 Segment CAGR and Growth Drivers
- 12.4.7 Subsegment Market Size and Forecast
- 12.4.7.1 Reverse Transcriptase Inhibitors
- 12.4.7.2 Protease Inhibitors
- 12.4.7.3 DNA Polymerase Inhibitors
- 12.4.7.4 Fusion Inhibitors
- 12.4.7.5 Others
- 12.4.8 Subsegment Pricing and Adoption Trends
- 12.4.9 Leading Suppliers and Competition
- 12.4.10 Regional Demand and Opportunities
- 12.5 By Indication - Market Size and Forecast, 2025-2035
- 12.5.1 Segment Definition and Scope
- 12.5.2 Historical Market Size, 2018-2025
- 12.5.3 Revenue Forecast, 2025-2035
- 12.5.4 Volume Forecast, 2025-2035
- 12.5.5 Base-Year Market Share, 2025
- 12.5.6 Segment CAGR and Growth Drivers
- 12.5.7 Subsegment Market Size and Forecast
- 12.5.7.1 HIV
- 12.5.7.2 Hepatitis
- 12.5.7.3 Herpes
- 12.5.7.4 Influenza
- 12.5.7.5 Others
- 12.5.8 Subsegment Pricing and Adoption Trends
- 12.5.9 Leading Suppliers and Competition
- 12.5.10 Regional Demand and Opportunities
- 12.6 Segment Growth Comparison
- 12.7 Segment Attractiveness and Priority Matrix
Chapter 13 Global Antiviral Drugs Geographic Market Outlook, 2025-2035
- 13.1 Regional Market Size and Share, 2025
- 13.2 Regional Market Forecast, 2025-2035
- 13.3 Regional Pricing, Production and Demand Differences
- 13.4 North America
- 13.4.1 United States
- 13.4.2 Canada
- 13.4.3 Mexico
- 13.5 Europe
- 13.5.1 Germany
- 13.5.2 France
- 13.5.3 Italy
- 13.5.4 United Kingdom
- 13.5.5 Spain
- 13.5.6 Poland
- 13.5.7 Russia
- 13.5.8 Netherlands
- 13.5.9 Belgium
- 13.5.10 Sweden
- 13.5.11 Denmark
- 13.5.12 Norway
- 13.5.13 Rest of Europe
- 13.6 Asia Pacific
- 13.6.1 China
- 13.6.2 India
- 13.6.3 Japan
- 13.6.4 South Korea
- 13.6.5 Thailand
- 13.6.6 Indonesia
- 13.6.7 Vietnam
- 13.6.8 Malaysia
- 13.6.9 Australia
- 13.6.10 Rest of Asia Pacific
- 13.7 Latin America
- 13.7.1 Brazil
- 13.7.2 Argentina
- 13.7.3 Colombia
- 13.7.4 Chile
- 13.7.5 Rest of Latin America
- 13.8 Middle East
- 13.8.1 Saudi Arabia
- 13.8.2 United Arab Emirates
- 13.8.3 Turkey
- 13.8.4 Israel
- 13.8.5 Iran
- 13.8.6 Rest of the Middle East
- 13.9 Africa
- 13.9.1 South Africa
- 13.9.2 Egypt
- 13.9.3 Nigeria
- 13.9.4 Morocco
- 13.9.5 Rest of Africa
- 13.10 Regional Investment, Policy and Supply Chain Differences
- 13.11 Regional Competitive Landscape
- 13.12 Geographic Growth Hotspots
Chapter 14 Global Antiviral Drugs Technology, Innovation and Sustainability Outlook
- 14.1 Technology Landscape and Maturity
- 14.2 Product, Process and Service Innovation
- 14.3 AI, Automation and Digital Tools in the Industry
- 14.4 Technology Adoption and Performance Benchmarking
- 14.5 Innovation Pipeline and R&D Investment
- 14.6 Patent and Intellectual Property Trends
- 14.7 Energy Efficiency and Resource Management
- 14.8 Sustainability, Recycling and Circularity
- 14.9 Technology Roadmap, 2025-2035
- 14.10 Risks of Obsolescence and Technology Substitution
Chapter 15 Global Antiviral Drugs Market Key Strategic Imperatives
- 15.1 Growth and Market Entry Priorities
- 15.2 High-Return Products and Segments
- 15.3 Pricing, Profitability and Cost Optimization
- 15.4 Technology Investment and Product Differentiation
- 15.5 Supply Chain Localization and Resilience
- 15.6 Distribution and Customer Acquisition
- 15.7 Partnership, Acquisition and Capacity Strategy
- 15.8 Regional Expansion Priorities
- 15.9 Short-, Medium- and Long-Term Actions
Chapter 16 Competition Outlook
- 16.1 Industry Competition Characteristics
- 16.2 Market Structure and Concentration
- 16.3 Market Share and Competitive Positioning, 2025
- 16.4 Company-Wise Revenue and Product Benchmarking
- 16.5 Production and Service Capacity Benchmarking
- 16.6 Technology, Pricing and Differentiation
- 16.7 Regional Footprint and Distribution Strength
- 16.8 Mergers, Acquisitions and Strategic Alliances
- 16.9 New Entrants and Competitive Threats
- 16.10 Porter's Five Forces and Industry Attractiveness
- 16.11 Competitive Outlook, 2025-2035
Chapter 17 Company Profiles
- 17.1 Company Coverage and Selection Criteria
- 17.2 Gilead Sciences, Inc.
- 17.2.1 Business Description
- 17.2.2 Company Ownership and Geographic Presence
- 17.2.3 Product and Service Portfolio
- 17.2.4 Manufacturing and Operating Footprint
- 17.2.5 Production Capacity and Expansion Plans
- 17.2.6 Financial Performance and Investment
- 17.2.7 Market Share and Competitive Position
- 17.2.8 Technology and Innovation Capabilities
- 17.2.9 Strategic Alliances or Partnerships
- 17.2.10 Recent Developments
- 17.2.11 Growth Strategy and Outlook
- 17.3 GlaxoSmithKline plc
- 17.4 Cipla Inc.
- 17.5 Aurobindo Pharma
- 17.6 Dr. Reddy's Laboratories Ltd.
- 17.7 Sun Pharmaceutical Limited
- 17.8 Merck & Co.
- 17.9 Pfizer Inc.
- 17.10 Shionogi
- 17.11 Sanofi
- 17.12 Other Relevant Market Participants
Note: Every listed company is profiled on the structure shown under the first company. The company list is preliminary and may change based on research findings, market developments, data availability and client requirements.
Chapter 18 Disclaimer
- 18.1 Research and Forecast Disclaimer
- 18.2 Data Source and Estimation Limitations
Note: The depth of individual sections depends on data availability for this market. Volume, capacity, trade and other unit-based metrics are included where applicable.