
App-booked blood draws move lab testing to the doorstep
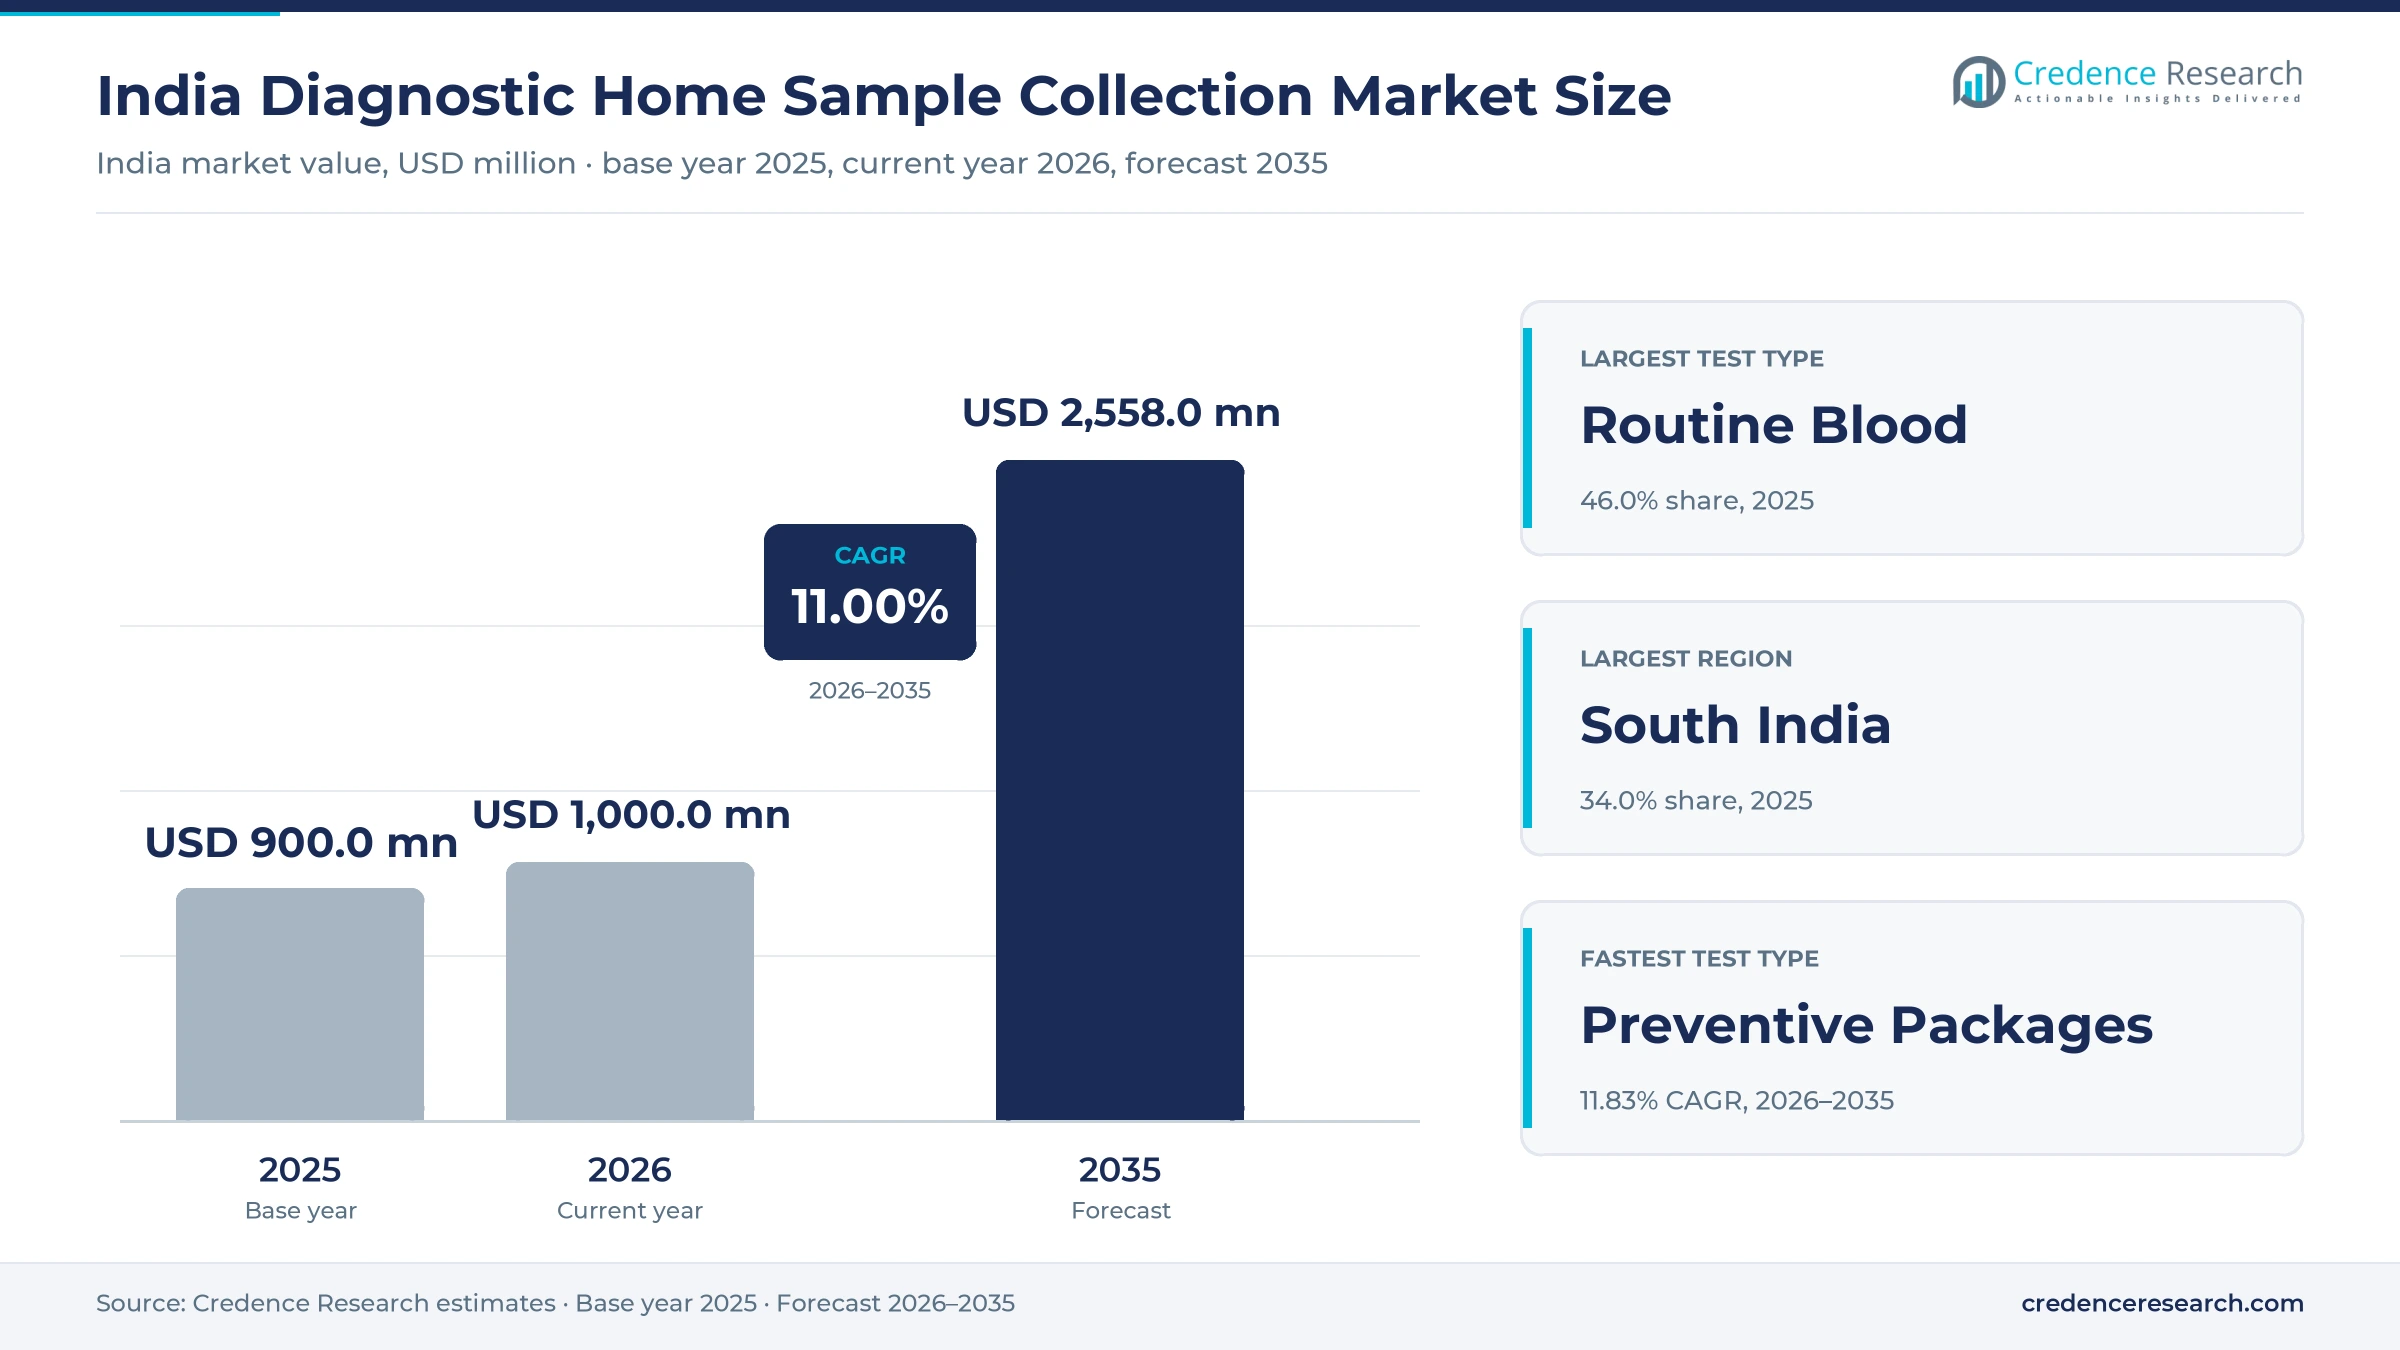
The India diagnostic home sample collection market was valued at USD 900.0 million in 2025 and is projected to increase from USD 1.00 billion in 2026 to USD 2.56 billion by 2035, registering a CAGR of 11.00% during 2026–2035. Demand comes from households booking routine blood work and preventive packages through apps, and from employers and insurers that buy annual checks for staff and policyholders. South India held the largest regional share, 34.0% in 2025, because Bengaluru and Hyderabad host dense app-led networks, including Orange Health Labs, which began in Bengaluru. Northeast India is the fastest-growing region at 12.06% a year, starting from a small base of organized labs. Thyrocare reported almost 1,900 phlebotomists in its June 2025 quarter release, which shows how large field teams have become. Regulation is also tightening, because Mint reported on Sept. 18, 2025, that the Directorate General of Health Services was preparing minimum standards for sample collection and transport, a change that favors operators with trained staff.
What does home sample collection revenue in India include?
The market counts the value of laboratory tests whose blood, urine or swab samples are drawn at a patient's home or workplace by a trained phlebotomist, together with any visit fee charged for that collection. Orders are booked through apps, websites, call centers, pharmacy platforms, employers and insurers, and the sample then travels to a processing lab.
The market excludes self-test kits and glucose meters used without a phlebotomist, tests on samples given at walk-in collection centers, imaging and inpatient hospital testing. Value flows from patients and corporate buyers to lab chains and platforms, which then pay field staff, logistics partners, consumables suppliers and partner labs.
India Diagnostic Home Sample Collection Market Insights
- Home collection value rises from USD 900.0 million in 2025 to USD 2.56 billion by 2035 at an 11.00% CAGR, as preventive bundles and app bookings bring more tests to the doorstep.
- South India held 34.0% of 2025 value, because Bengaluru and Hyderabad host app-first networks and the highest diabetes rates in the country.
- Routine Blood tests accounted for 46.0% of 2025 value, as single sugar, thyroid and blood count orders still make up most home visits.
- Amazon entered home testing in June 2025 with Orange Health Labs, covering more than 450 PIN codes in six cities with 60-minute collection.
- Redcliffe Labs reported in July 2025 that more than 70% of its volumes came from tier-2 cities and smaller towns, showing where new demand sits.
Routine blood, B2C and metro orders hold the largest shares
Routine blood tests lead while preventive bundles grow fastest
Based on test, the market is categorized into routine blood, preventive packages and specialized tests. Routine Blood tests led with 46.0% of 2025 value because single blood counts, sugar and thyroid checks make up most home orders, and Thyrocare processed 46.9 million tests in its June 2025 quarter at an average of about Rs 37 per test. Preventive Packages grow fastest at 11.83% a year as bundles gain buyers, as IBEF reported in June 2025 that preventive testing held a 12% share of the diagnostics industry and was expected to rise. Specialized samples add value per visit, since Thyrocare put its average histopathology test near Rs 250.
Individual households lead while corporate buyers grow faster
Based on customer, the market is categorized into B2C and corporate. B2C orders led with 76.0% of 2025 value because most home visits are booked by individuals on apps, and Orange Health Labs told YourStory in June 2026 that about 70% of its business came directly from consumers through its app and website. Corporate buyers grow fastest at 11.68% a year as employers, insurers and platforms route annual checks to home providers, a channel that supplied the other 30% of Orange orders. Thyrocare said partners can reach more than 300 cities through a single API integration, which makes bulk programs easier to run.
Metro cities lead while smaller towns add volume
Based on city tier, the market is categorized into metro and tier-2/3. Metro cities led with 64.0% of 2025 value because urban markets generate more than 70% of diagnostic revenue, according to CareEdge Ratings in November 2025, and app-first providers such as Orange Health Labs still operate mainly in Bengaluru, Delhi, Mumbai and Hyderabad. Tier-2/3 cities grow fastest at 11.88% a year as chains move outward, with Redcliffe Labs reporting in July 2025 that it processed more than 1.8 million samples from tier-2 and smaller cities in FY25. Healthians said in July 2025 that it served more than 300 cities through 22 labs.
| Segment Group | Leading Sub-segment | Share, 2025 | Fastest-growing Sub-segment | CAGR, 2026–2035 |
|---|---|---|---|---|
| By Test | Routine Blood | 46.0% | Preventive Packages | 11.83% |
| By Customer | B2C | 76.0% | Corporate | 11.68% |
| By City Tier | Metro | 64.0% | Tier-2/3 | 11.88% |
Request a Free Sample
Fill in your details and we'll send you a free sample report.
- Sample data tables & charts
- Research methodology
Checkups, field teams and repeat plans lift visit volume
Preventive testing lifts home blood collection demand
Preventive check-ups suit home collection because fasting samples are easiest to draw at the door early in the morning. CareEdge Ratings found in November 2025 that wellness and preventive revenue at the seven diagnostic companies in its sample grew at more than 25% a year over the four years to FY25. IBEF reported in June 2025 that preventive testing held a 12% share of the diagnostics industry and was expected to rise. Dr Lal PathLabs confirmed on its July 31, 2025, call that its SwasthFit range covers 385 predefined panels, which gives home collectors a fixed menu to sell. In the Credence Research model this driver adds about 4.29 percentage points to annual growth to 2035.
Phlebotomist networks and app bookings widen reach
Large field teams and app bookings turn home collection from a premium extra into a standard way to buy tests. Thyrocare reported almost 1,900 phlebotomists in its June 2025 quarter release, while Orange Health Labs employs about 750 eMedics, each holding a laboratory technology diploma or degree. Amazon entered the segment with Orange Health Labs as its lab partner, and IBEF reported on June 23, 2025 that the service covered more than 450 PIN codes in six cities with collection within 60 minutes. Healthians said in July 2025 that its network spanned 22 labs and more than 300 cities. These networks let a booking made on a phone reach a trained collector the same morning. In the Credence Research model this adds about 3.08 percentage points to annual growth to 2035.
Subscription health checks raise repeat test volumes
Recurring plans give providers a reason to return to the same household several times a year. Ultrahuman extended its Blood Vision service through Tata 1mg to more than 60 cities and 2,000 PIN codes in November 2025, with tiers from Rs 999 and a 60-biomarker plan at Rs 1,999, according to Outlook Business. A technician collects each sample at home, and results feed the Ultrahuman app so users can track markers over time. Dr Lal PathLabs said tests per patient rose to 3.07 from 2.92 in the June 2025 quarter, which shows wider panels per visit. These plans resemble laboratory testing sold direct to consumers abroad. In the Credence Research model this adds about 1.87 percentage points to annual growth to 2035.
High diabetes and hypertension burden sustains monitoring
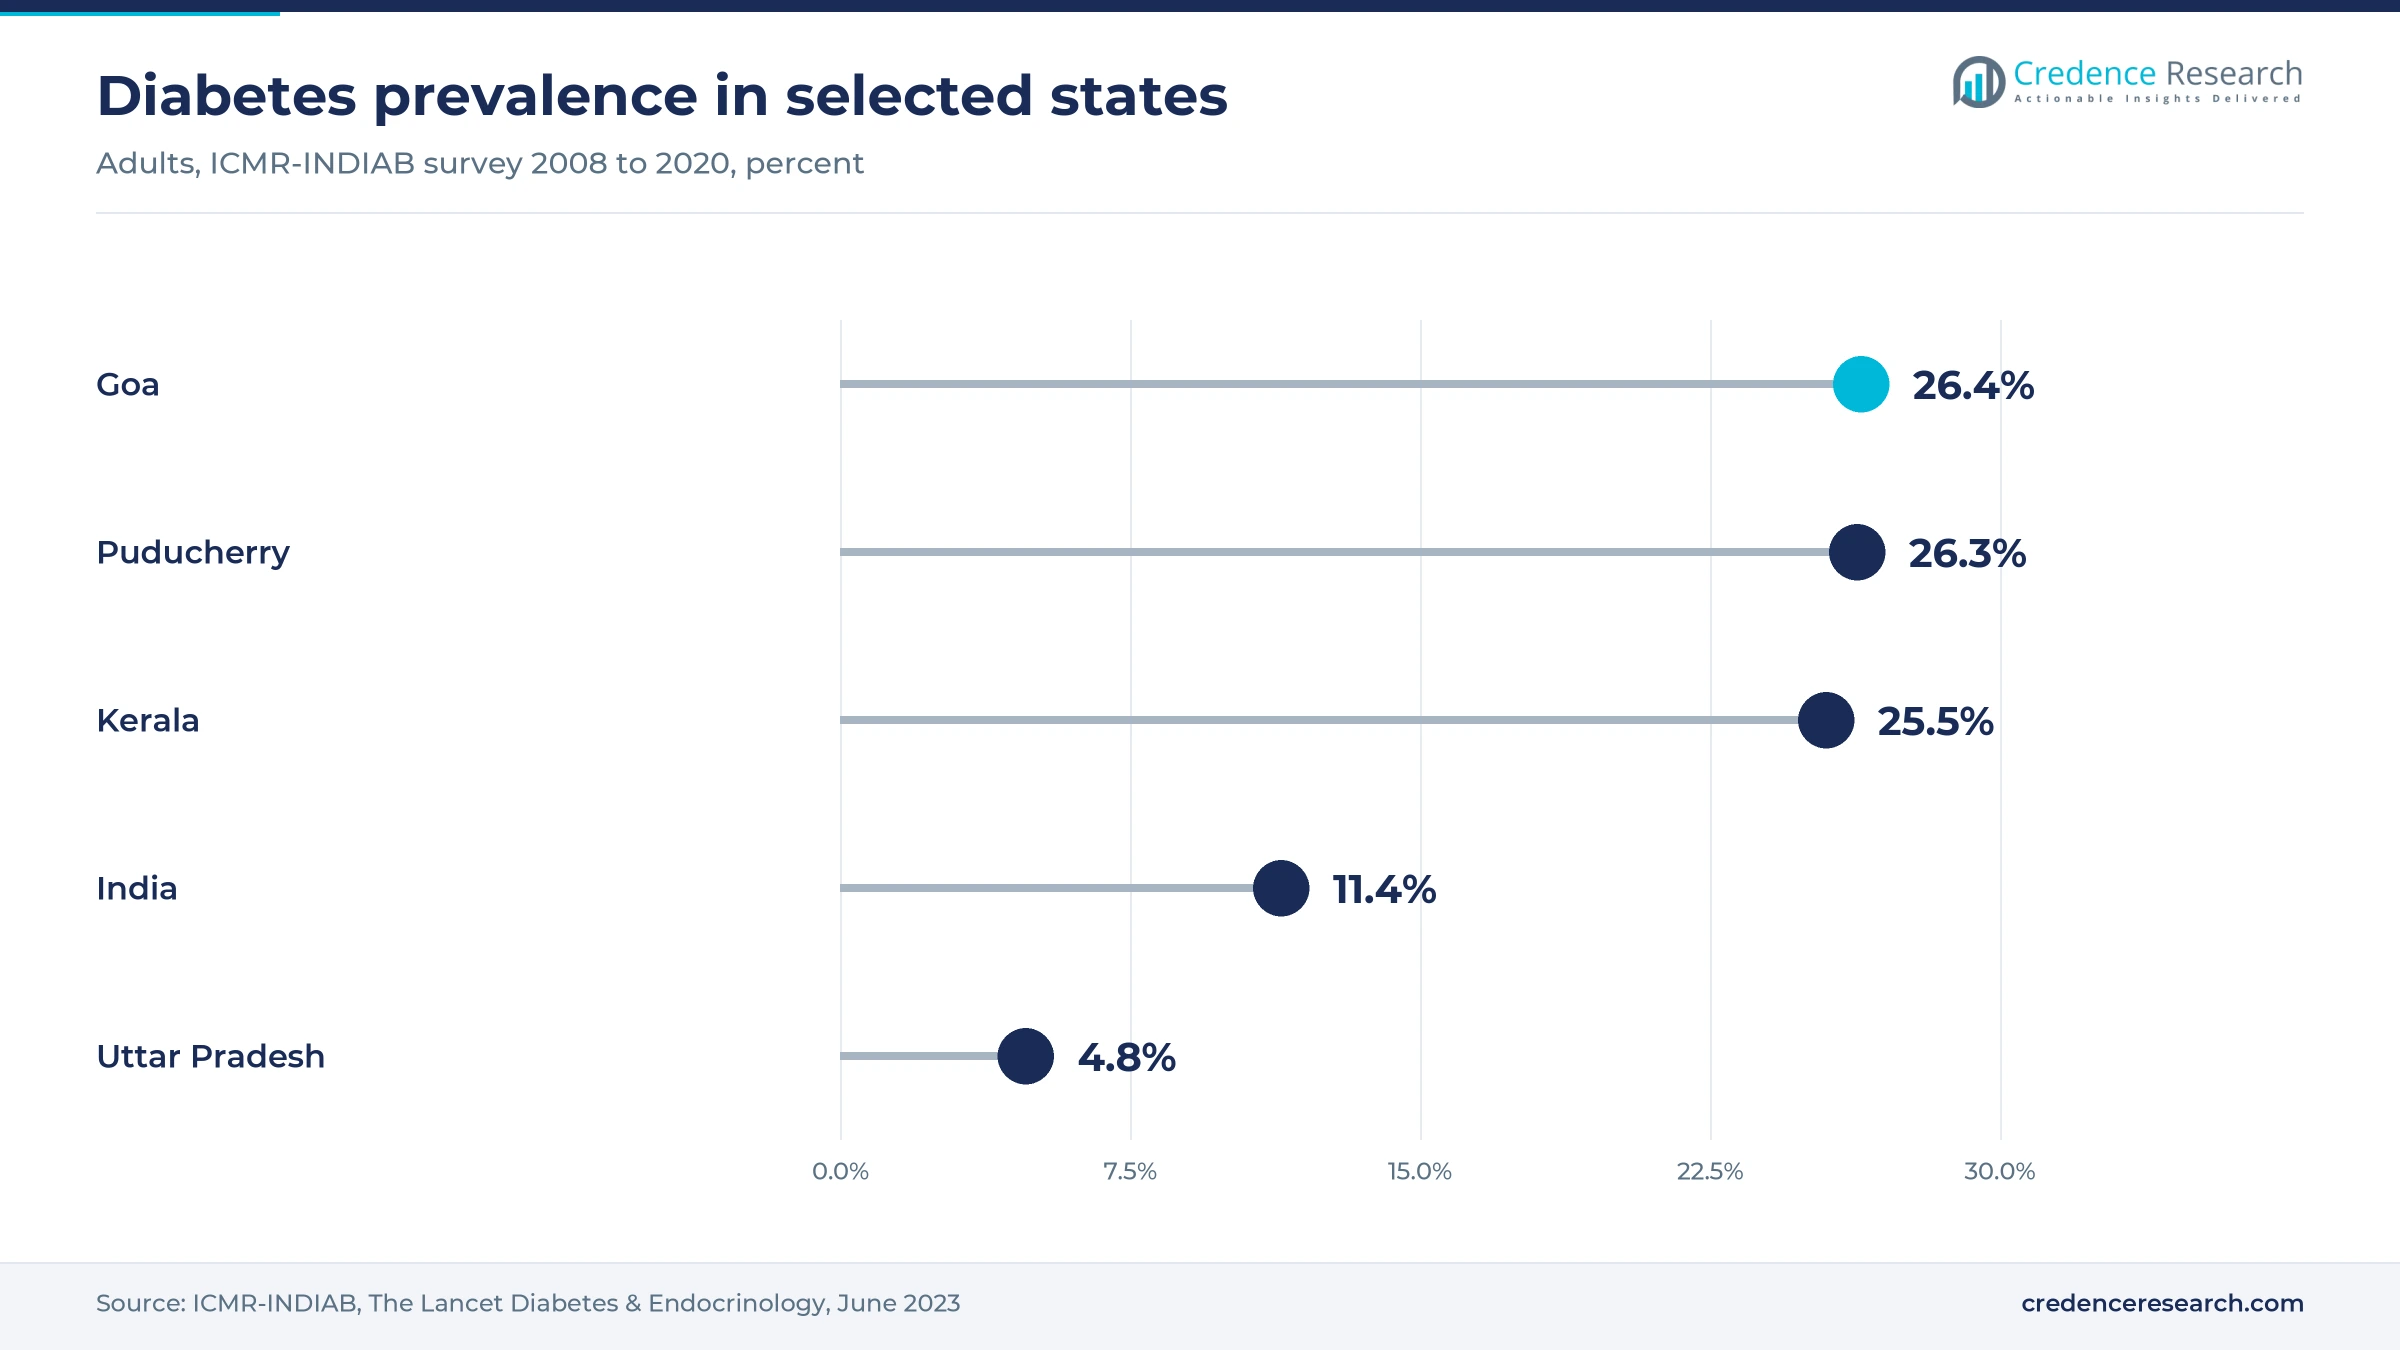
Chronic metabolic disease creates steady demand for repeat blood tests that patients prefer to give at home. The ICMR-INDIAB national study in The Lancet Diabetes & Endocrinology found diabetes prevalence of 11.4%, prediabetes of 15.3% and hypertension of 35.5% among adults. Patients with these conditions need HbA1c, lipid and kidney panels several times a year, which suits scheduled visits. Public screening also feeds the funnel, since a Rajya Sabha reply dated Aug. 12, 2025, put diabetes cases diagnosed and under treatment from January to June 2025 at 6,411,051. Prevalence is highest in the south, with Kerala at 25.5% and Puducherry at 26.3%, which supports steady monitoring demand across South India.
Faster windows and small-town hubs are reshaping service
Shift toward 30-minute collection and same-day reports
Providers now compete on time, which pushes home collection toward quick-commerce service levels. Orange Health Labs promises an eMedic within 30 minutes of the booked slot and delivers 98% of reports within six hours, YourStory reported in June 2026. Amazon's service with the same partner sets a 60-minute collection window and routine reports in as little as six hours. Thyrocare reported an average turnaround of 3.35 hours from sample arrival in its June 2025 quarter, supported by two central labs with combined capacity of 130,000 samples a day. These standards raise expectations for every operator, including the Metro networks that held 64.0% of 2025 value, and they reward dense routing over wide coverage.
Rise of hub-and-spoke lab networks in smaller towns
Chains are moving collection and processing capacity into smaller towns, where organized labs were scarce. Redcliffe Labs reported in July 2025 that it ran more than 80 labs and 2,000 collection centers, processed more than 1.8 million samples from tier-2 and smaller cities in FY25, and targets 150 labs and 300 cities by FY28. Dr Lal PathLabs added 18 labs in FY25 and expected a similar number in FY26, management said on July 31, 2025. Thyrocare opened partner labs in Roorkee and Kashmir and started a regional lab in Bhagalpur in the June 2025 quarter. Shorter travel to a lab keeps samples stable for home visits in these towns. As a result, Tier-2/3 cities grow at 11.88% a year in the Credence Research model.
Opening in home ECG and specialized test add-ons
Adding non-blood services to each visit offers an opening to lift value per household without adding trips. Thyrocare completed its purchase of Think Health Diagnostics on Feb. 27, 2024, according to Business Standard, and YourStory reported that Think Health brought at-home ECG and phlebotomy services across 10 cities. Thyrocare said in its June 2025 quarter release that ECG at home was live across the country after the deal. Specialized samples also carry higher prices, with its average histopathology test about seven times the overall average per test. Ultrahuman's premium Blood Vision tier analyzes more than 100 indicators across cardiovascular, metabolic and hormonal areas. Providers that bundle such services can raise ticket size, which helps cover the fixed cost of each home visit.
Opening in corporate, insurer and platform channels
Bulk buyers offer an opening because one contract can fill many collection slots in a single morning. Orange Health Labs said about 30% of its business came from corporate, insurer and platform partners in June 2026. Thyrocare's exclusive tie-up with PharmEasy, an online pharmacy platform, is growing again, with management citing 30-40% diagnostics growth in the June 2025 quarter. Tata 1mg runs 19 NABL-accredited labs serving 70 cities, YourStory reported in May 2026, which gives employers a single national vendor. Redcliffe Labs raised USD 42 million in a Series C round on Sept. 17, 2024, partly to expand home collection, BioSpectrum reported. As a result, Corporate buyers grow at 11.68% a year in the Credence Research model.
Sample rules, flat prices and free public tests test margins
New sample transport standards raise compliance costs
Sample integrity rules are tightening, which adds training and logistics costs for small operators. Mint reported on Sept. 18, 2025, that the Directorate General of Health Services would notify minimum standards for collecting and transporting blood, urine and swab samples after a Delhi High Court order. CareEdge Ratings counted more than 130,000 laboratories in November 2025, many without trained field staff. Operators will need qualified collectors and temperature-controlled carriers, which favors chains such as Orange Health Labs that train each eMedic for about 100 hours.
Flat test prices squeeze home visit economics
Test prices barely move, while each home visit carries fixed travel and staff costs. Thyrocare told analysts in its June 2025 quarter that price increases were 1.5-2% at most, with average realization of about Rs 37 per test. Dr Lal PathLabs said on July 31, 2025, that it had taken no price increase in the quarter. Low tickets make single-test home orders hard to serve profitably, so operators push bundles and minimum order values to cover the trip and protect the collector's daily route economics.
Fragmented local labs compete on visit fees
The market remains crowded with small labs that offer free home visits to nearby patients. CareEdge Ratings estimated in November 2025 that organized chains hold only about a fifth to a quarter of diagnostics and that more than 130,000 laboratories operate in the country. Many local labs waive collection fees, which caps what national brands can charge for a visit. Quality also varies widely, and patients rarely compare accreditation, so organized operators must spend on brand, NABL status and digital reports to win share.
Free public diagnostics limit paid demand in villages
Public programs now offer more free tests near rural homes, which limits paid demand outside the cities. The Ministry of Health and Family Welfare reported 180,906 Ayushman Arogya Mandirs by Oct. 31, 2025, with an essential list of 63 diagnostics at PHC-level centers. ICMR's draft National Essential Diagnostics List of January 2025 raised the count for primary health centers to 74 tests from 64. Private operators therefore compete on convenience, speed and wider panels in tier-2/3 towns rather than on basic tests.
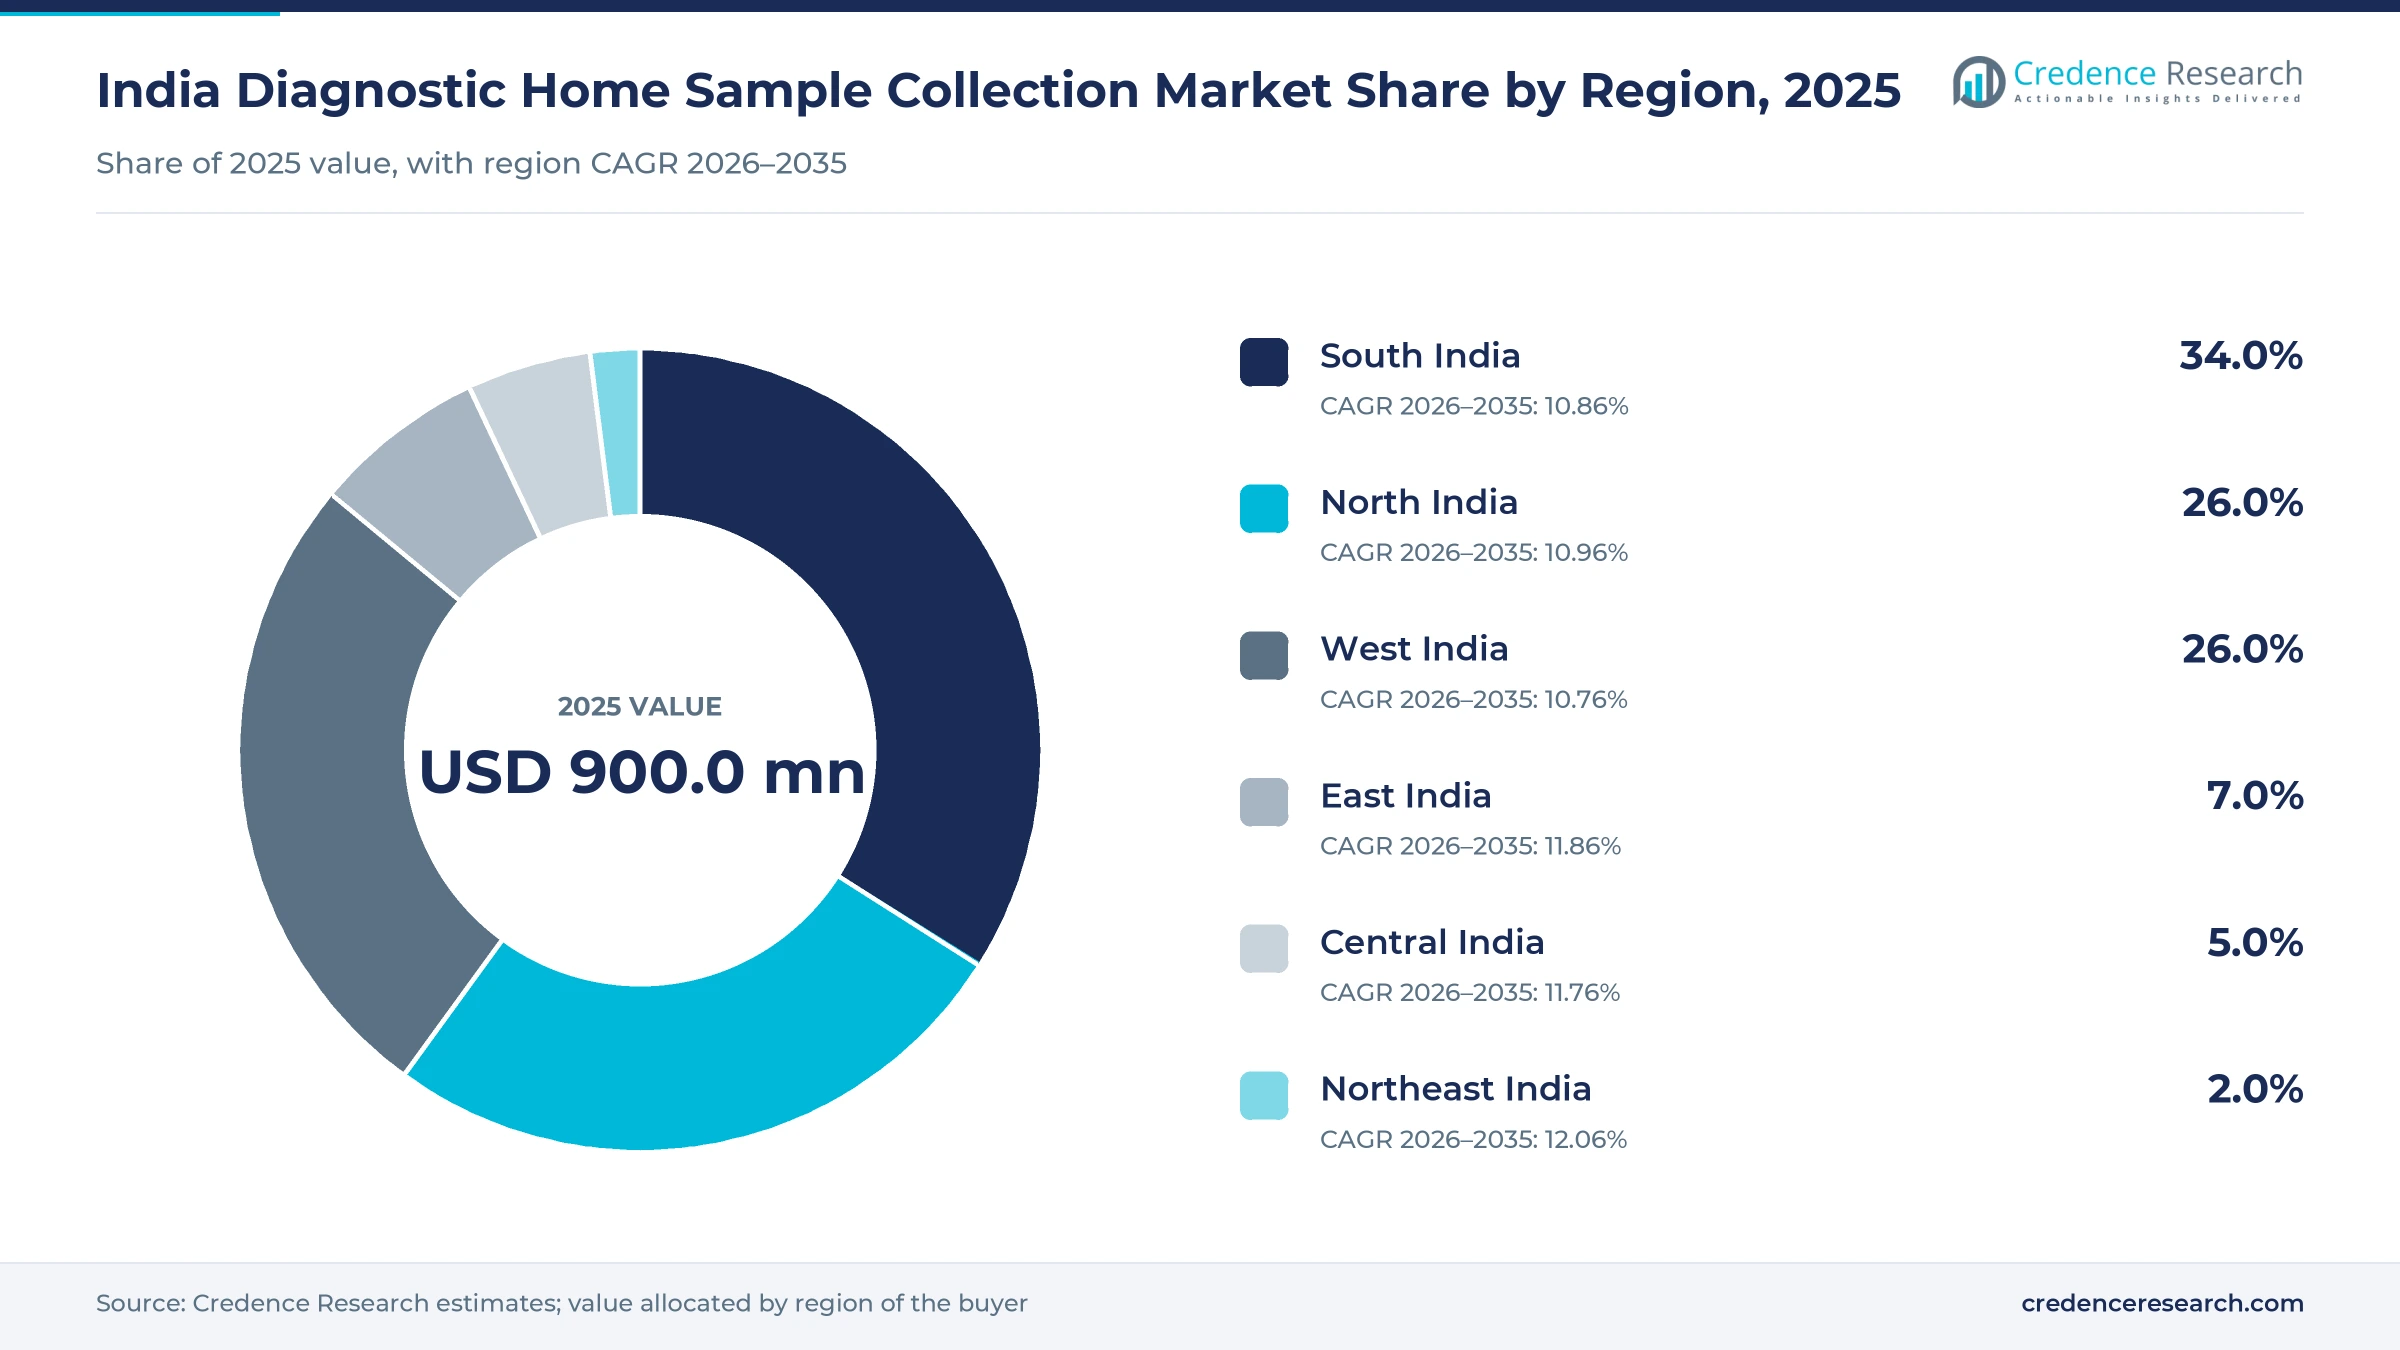
South India leads and the Northeast grows fastest
| Region | Value, 2025 (USD million) | Share, 2025 | CAGR, 2026–2035 |
|---|---|---|---|
| South India | 306.0 | 34.0% | 10.86% |
| North India | 234.0 | 26.0% | 10.96% |
| West India | 234.0 | 26.0% | 10.76% |
| East India | 63.0 | 7.0% | 11.86% |
| Central India | 45.0 | 5.0% | 11.76% |
| Northeast India | 18.0 | 2.0% | 12.06% |
South India leads on app-first networks and diabetes burden
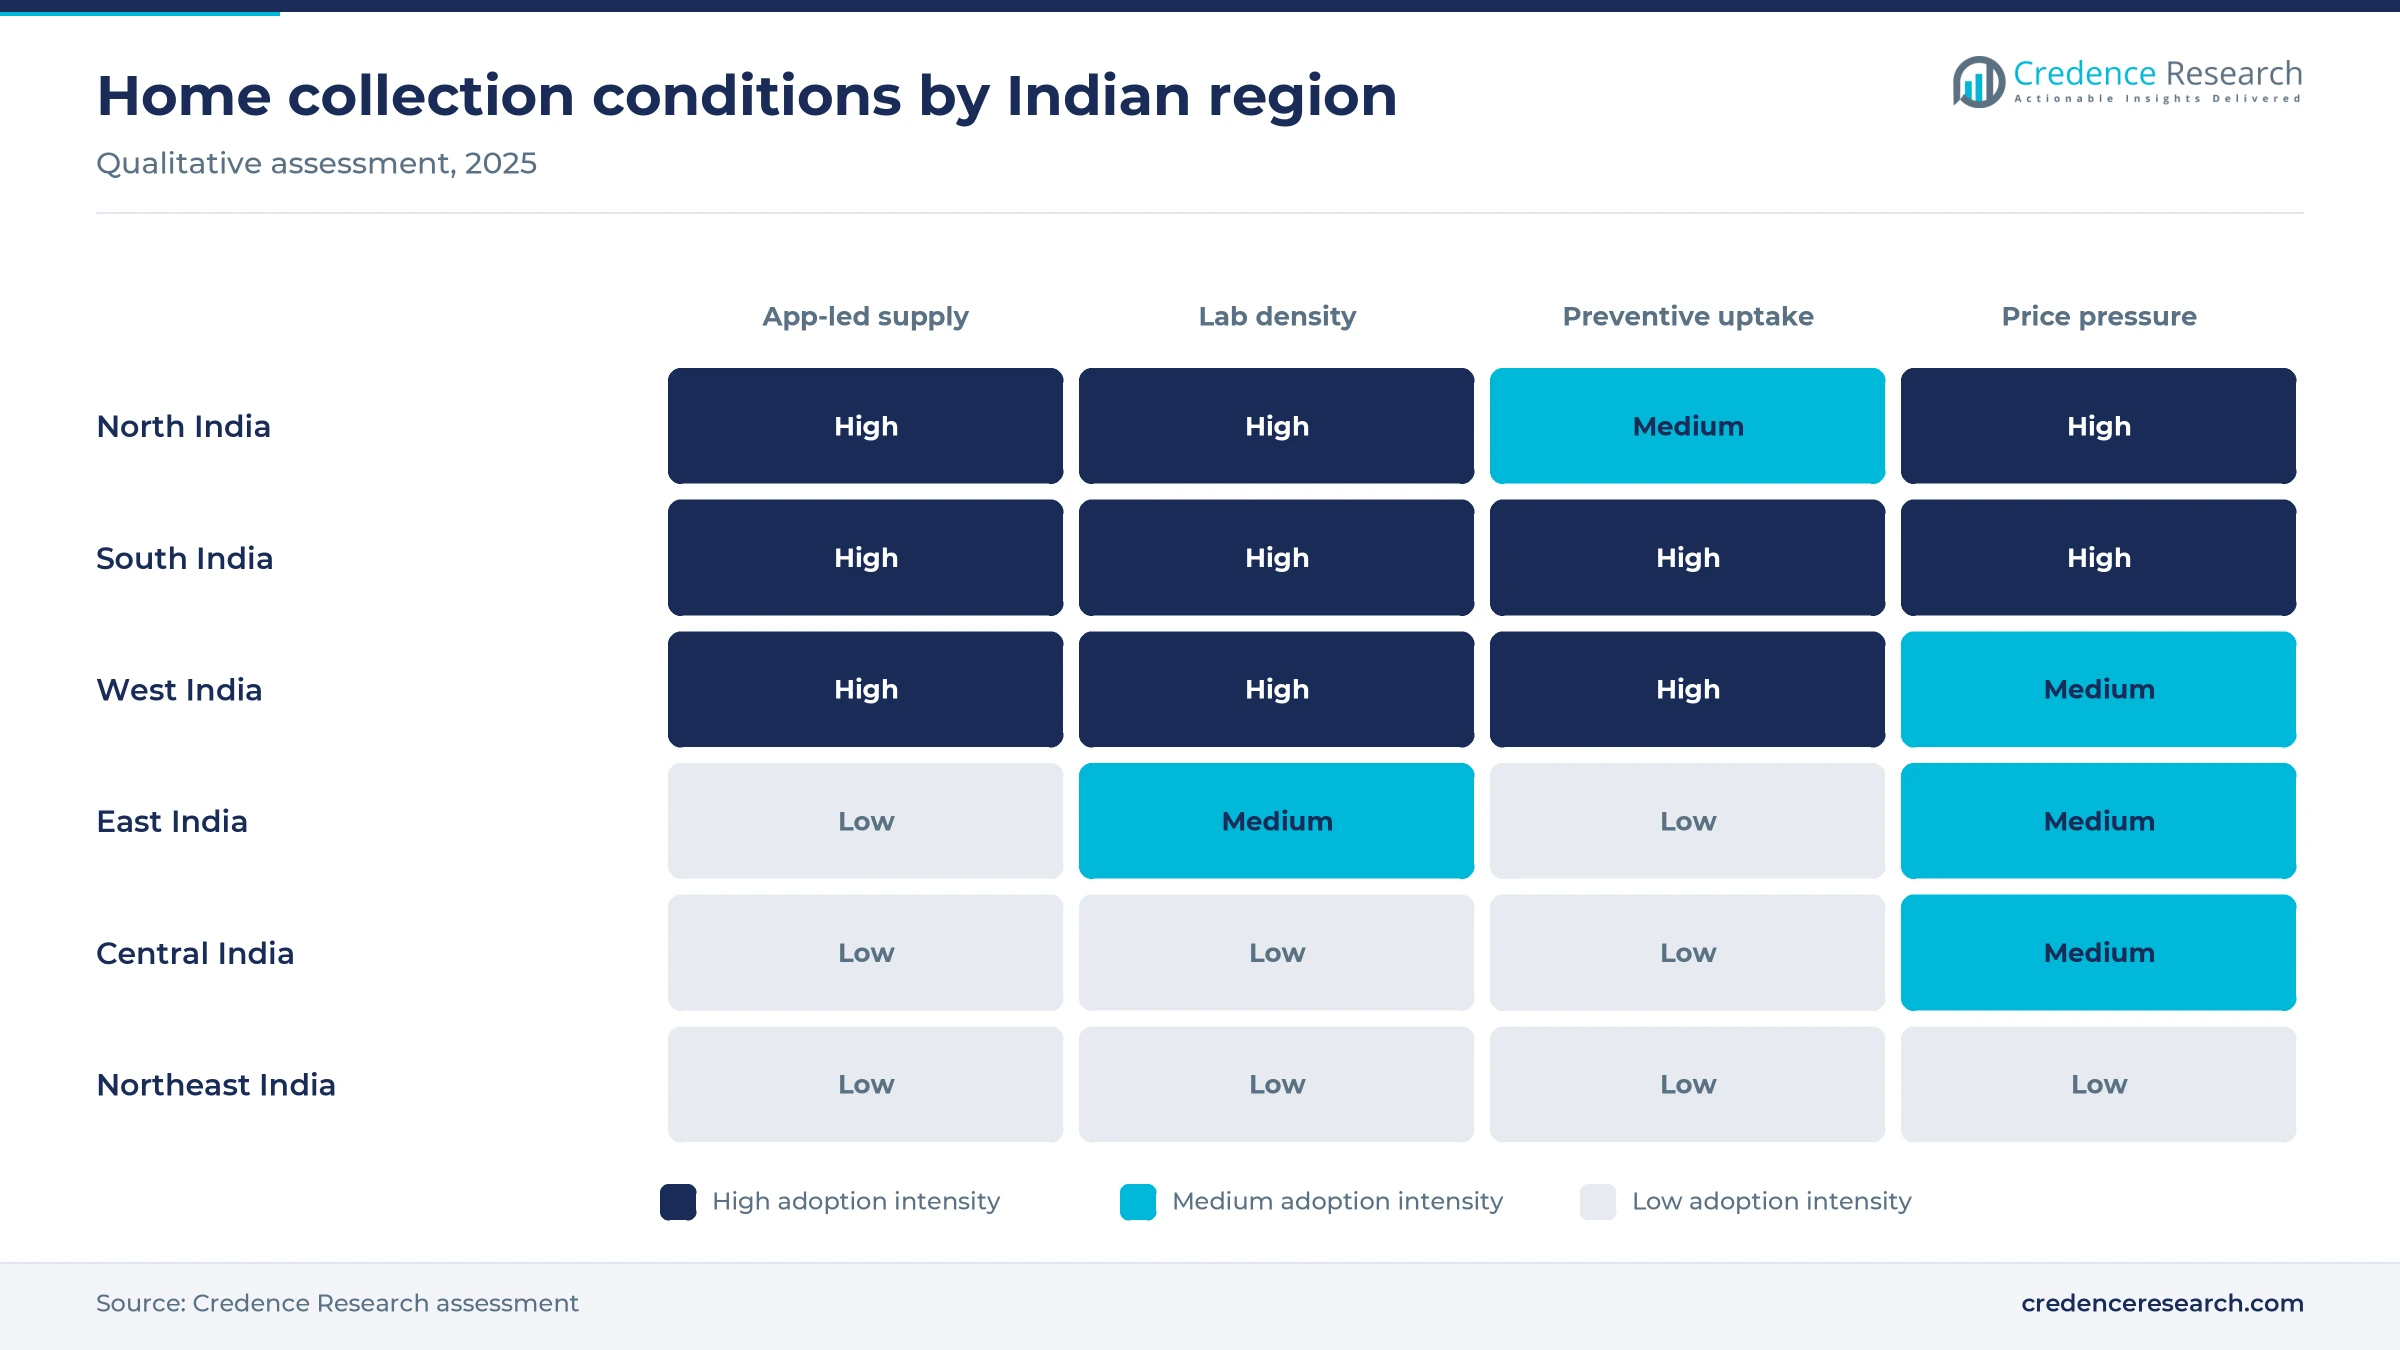
South India held 34.0% of 2025 value and grows at 10.86% a year, the largest zone in the India diagnostic home sample collection market. Bengaluru and Hyderabad anchor app-led demand, and Orange Health Labs began in Bengaluru before moving to Delhi, Mumbai and Hyderabad. Metabolic disease is common here, with ICMR-INDIAB putting diabetes prevalence at 25.5% in Kerala and 26.3% in Puducherry. Dr Lal PathLabs runs a reference lab in Bangalore and is exploring acquisitions in the South, management said in July 2025.
North India centers on Delhi NCR booking density
North India held 26.0% of 2025 value and grows at 10.96% a year, with Delhi NCR as its main booking hub. Amazon launched home testing in Delhi, Gurgaon and Noida in June 2025, and Thyrocare runs one of its two central processing labs in Delhi. Thyrocare also opened partner labs in Roorkee and Kashmir in 2025. Uttar Pradesh shows the gap that remains, since ICMR-INDIAB put its diabetes prevalence at 4.8% with prediabetes near 18%, a profile that points to undiagnosed demand.
West India relies on Mumbai labs and high Goa prevalence
West India held 26.0% of 2025 value and grows at 10.76% a year, led by Mumbai and Pune. Thyrocare runs its other central processing lab in Mumbai, and Amazon included Mumbai in its June 2025 launch with Orange Health Labs. Dr Lal PathLabs also operates a Mumbai reference lab opened within the last three years. The ICMR-INDIAB study recorded the highest diabetes prevalence in Goa at 26.4%, which supports frequent monitoring tests in the zone.
East India adds regional labs from a low base
East India held 7.0% of 2025 value and grows at 11.86% a year from a smaller base. CareEdge Ratings noted in November 2025 that the East and North remain underpenetrated by organized diagnostics. Thyrocare started processing at a regional lab in Bhagalpur in Bihar in the June 2025 quarter, which shortens transport times for samples drawn in nearby districts. Growth runs above the national rate as chains extend collection routes into Bihar, Odisha and West Bengal towns.
Central India depends on franchise collection points
Central India held 5.0% of 2025 value and grows at 11.76% a year in the Credence Research model. The zone has few app-first providers, so home visits often run from franchise collection centers. Thyrocare said more than 95% of its roughly 9,500 active franchisees already ran collection centers, and a new center needs about Rs 3-4 lakh of investment. That low entry cost lets local partners in Madhya Pradesh and Chhattisgarh add home visits quickly.
Northeast India grows fastest from a small base
Northeast India held 2.0% of 2025 value and grows at 12.06% a year, the fastest pace in the model. The base is very small, and most organized activity sits around Guwahati. Public screening at Ayushman Arogya Mandirs is identifying more patients who need follow-up tests, while Redcliffe Labs plans to reach 300 cities by FY28. As national chains extend routes, patients in the zone can give samples at home rather than travel to metro labs.
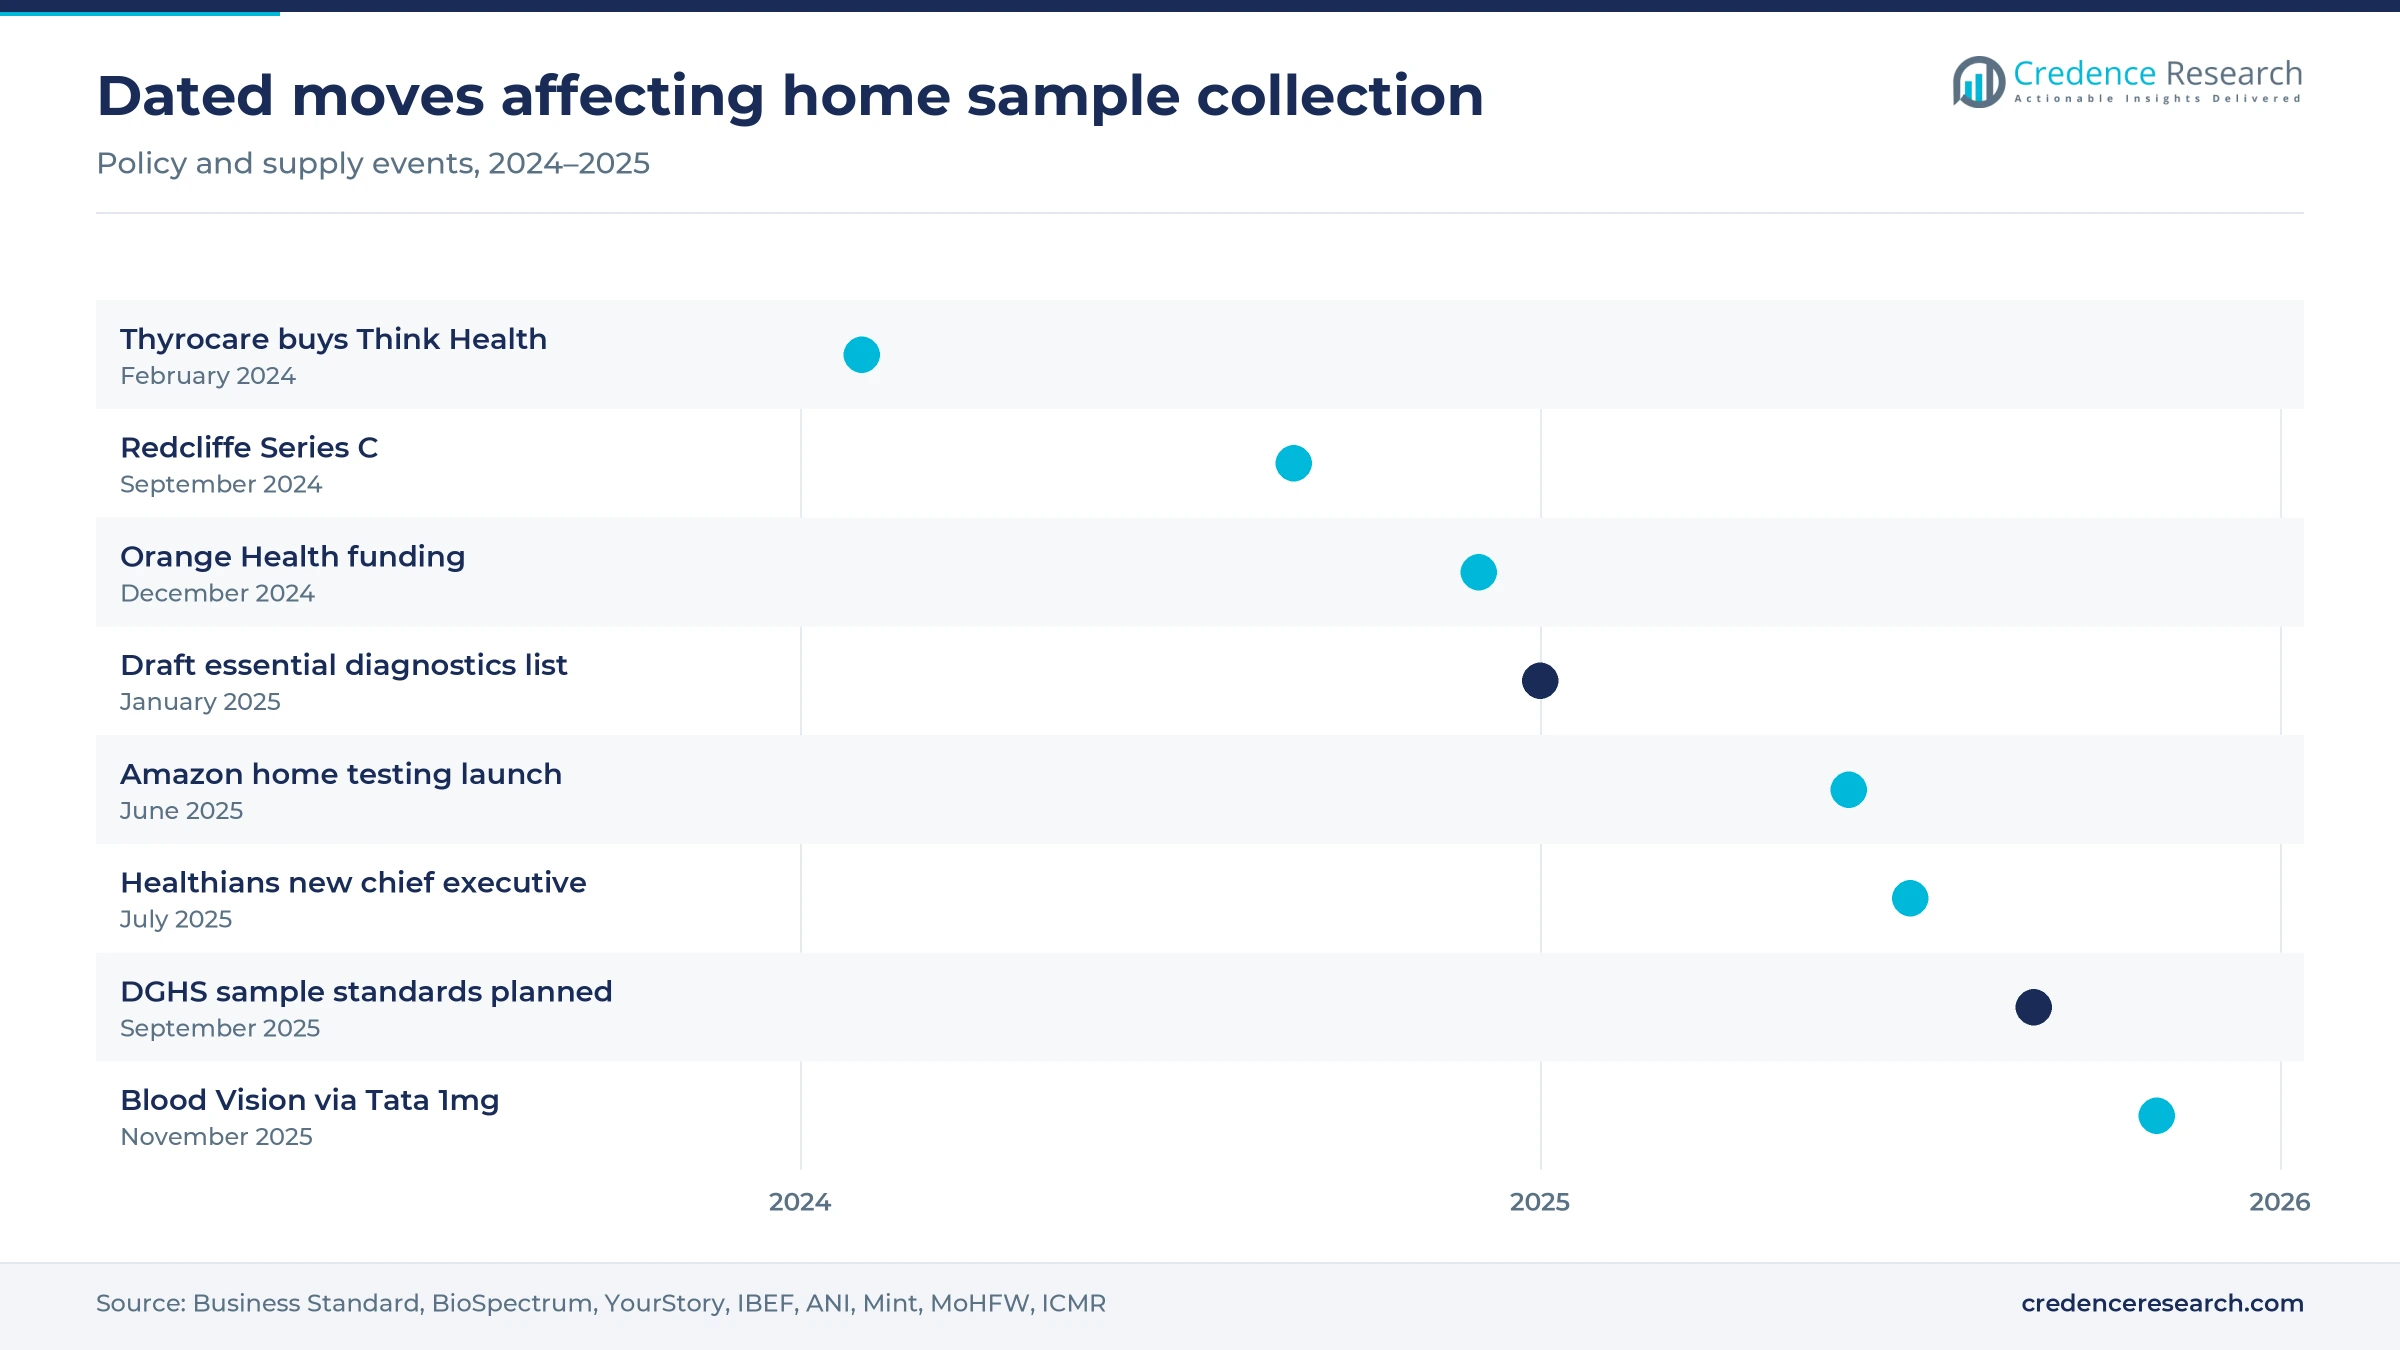
Funding, acquisitions and launches from 2024 to 2026
| Development | Status and market relevance |
|---|---|
| In February 2024, Thyrocare completed its purchase of Think Health Diagnostics, adding at-home ECG and phlebotomy services, Business Standard reported. | Completed, ECG at home now live across the country |
| In September 2024, Redcliffe Labs raised USD 42 million in a Series C round led by IFU to expand labs and home collection, BioSpectrum reported. | Funded, expansion into tier-2 and tier-3 cities |
| In June 2025, Amazon launched at-home diagnostics with Orange Health Labs across more than 450 PIN codes in six cities, IBEF reported. | Operating, 60-minute collection window |
| In July 2025, Healthians appointed Nishant Singhal as chief executive, with a network of 22 labs across more than 300 cities, ANI reported. | New leadership for the next growth phase |
| In November 2025, Ultrahuman extended its Blood Vision home testing through Tata 1mg to more than 60 cities, Outlook Business reported. | Operating, tiers from Rs 999 |
Booking apps and cold-chain kits shape sample quality
- Slot-booking apps assign a collector to each order and track arrival, which lets Orange Health Labs promise an eMedic within 30 minutes of the booked slot.
- Barcoded vacuum tubes tie each sample to its order at the doorstep, and these vacuum blood tubes carry the additives that keep blood stable on the road.
- Temperature-controlled carriers keep samples within range during transport, a requirement expected in the minimum standards that Mint said the DGHS was preparing in September 2025.
- API integrations let pharmacy and insurer platforms book tests directly, and Thyrocare said a single integration reaches more than 300 cities.
Need a Custom Version of This Report?
Tailor the scope, geography, or segments to your exact requirements.
- Custom geography or segment scope
- Direct access to our analyst team
National chains and app-first labs fight for each visit
The India diagnostic home sample collection market is split between national lab chains that added home visits to existing networks and app-first providers built around the doorstep draw. Dr Lal PathLabs and Thyrocare compete on lab scale and franchise reach, with Thyrocare running about 9,500 active franchisees. Redcliffe Labs and Healthians compete on reach in smaller cities, each serving hundreds of towns. Orange Health Labs competes on speed in four metros, while Tata 1mg Labs uses its pharmacy app and 19 accredited labs to sell tests to existing customers. Amazon's entry in June 2025 added a large consumer platform to the field. Competition increasingly turns on collection time, report turnaround and bundle pricing, because the underlying clinical laboratory services are similar. Thousands of local labs still offer free visits, which keeps pressure on fees.
Companies profiled and their roles in this market
| Company | Type | Role in the market |
|---|---|---|
| Dr Lal PathLabs | National lab chain | Sells SwasthFit bundles and added 18 labs in FY25 |
| Thyrocare | Franchise lab network | Runs almost 1,900 phlebotomists and is the exclusive lab partner of PharmEasy |
| Redcliffe Labs | Multi-city lab chain | Operates more than 80 labs with most volume from tier-2 cities and beyond |
| Healthians | Home-first lab platform | Serves more than 300 cities through 22 labs |
| Orange Health | App-first lab operator | Promises 30-minute collection in Bengaluru, Delhi, Mumbai and Hyderabad |
| Tata 1mg Labs | Platform-linked lab network | Runs 19 NABL-accredited labs serving 70 cities |
Visit density will decide which home networks scale
Credence Research's view is that the India diagnostic home sample collection market will reward operators that can fill each collector's route with several orders a morning. Single-test orders at about Rs 37 per test cannot carry a home visit alone, so bundles, repeat plans and corporate contracts decide profitability. Faster windows from Orange Health Labs and Amazon raise service expectations, while the DGHS sample standards will add cost for small labs. Chains with lab density in tier-2 towns, such as Redcliffe Labs, should gain share as demand moves outward. Free public tests will keep basic rural demand outside the paid market.
How the test-value market model was built
The report uses 2025 as the base year and forecasts to 2035. Market values come from the Credence Research model, checked against the size of the diagnostics industry, the pathology share and the share of samples drawn at home. Segment and regional splits are Credence Research estimates informed by company network data, disease prevalence by state and the location of app-led supply. Sources used include government press releases, parliamentary replies, a peer-reviewed national study, a credit rating agency report, company releases and trade press. No interviews or surveys were conducted in preparing this report.
Preventive bundles and smaller towns drive growth to 2035
India diagnostic home sample collection value is forecast to reach USD 2.56 billion by 2035, with preventive bundles and smaller towns doing most of the work. South India should remain the largest region, while Northeast India and East India grow faster as chains open regional labs closer to patients. Preventive packages are expected to grow at 11.83% a year and narrow the gap with routine blood tests. Minimum standards for sample transport should push volume toward trained, organized operators. Corporate and insurer contracts will add steady bulk demand, although free public diagnostics will continue to cap paid testing in villages.
Frequently Asked Questions
How big is the India diagnostic home sample collection market?
Which region leads the market?
Which test type is largest?
Which test type grows fastest?
How fast can a sample be collected at home?
Who are the main companies in the market?
What new rules affect home collection?
What is the biggest challenge for providers?
Table of Content
Chapter 1 Market Segmentation
- 1.1 Segmentation Framework
- 1.1.1 Product and Service Classification
- 1.1.2 Application and End-Use Classification
- 1.1.3 Technology and Solution Classification
- 1.1.4 Customer and Distribution Channel Classification
- 1.1.5 Geographic Segmentation
- 1.1.6 Market Segment Definitions and Boundaries
- 1.2 By Test
- 1.2.1 Routine Blood
- 1.2.2 Preventive Packages
- 1.2.3 Specialized
- 1.3 By Customer
- 1.3.1 B2C
- 1.3.2 Corporate
- 1.4 By City Tier
- 1.4.1 Metro
- 1.4.2 Tier-2/3
Chapter 2 Introduction
- 2.1 Report Objectives and Scope
- 2.2 Product Definition and Industry Terminology
- 2.3 Market Inclusions and Exclusions
- 2.4 Research Process
- 2.4.1 Primary Research and Expert Interviews
- 2.4.2 Secondary Research and Source Review
- 2.4.3 Top-Down and Bottom-Up Estimation
- 2.4.4 Data Triangulation and Verification
- 2.5 Market Size Measurement Basis
- 2.5.1 2025: USD 900.0 million → 2035: USD 2.56 billion
- 2.6 Historical and Forecast Reference Periods
- 2.6.1 Historical Period: 2018-2025
- 2.6.2 Base Year: 2025
- 2.6.3 Forecast Period: 2025-2035
- 2.7 Research Assumptions and Limitations
Chapter 3 Executive Summary
- 3.1 Market Snapshot and Key Findings
- 3.2 Base-Year Market Size, 2025
- 3.3 Forecast Market Size, 2035
- 3.4 Revenue and Volume Growth Outlook
- 3.5 Key Demand and Supply Indicators
- 3.6 Leading Market Segments
- 3.7 Fastest-Growing Market Opportunities
- 3.8 Regional Performance Highlights
- 3.9 Technology and Industry Transformation
- 3.10 Competitive Landscape Summary
- 3.11 Analyst View and Strategic Implications
Chapter 4 India Diagnostic Home Sample Collection Market Trends and Developments
- 4.1 Historical Industry Development, 2018-2025
- 4.2 Recent Market Trends and Developments
- 4.3 Demand and Customer Behavior Trends
- 4.4 Technology and Product Innovation
- 4.5 Artificial Intelligence, Automation and Digitalization
- 4.6 Local Manufacturing and Supply Chain Realignment
- 4.7 Industry Partnerships, Mergers and Acquisitions
- 4.8 Sustainability and Circular Economy Developments
- 4.9 Government and Private Sector Investment Trends
- 4.10 Emerging Business Models and Commercialization
- 4.11 Industry Developments and Announcements
Chapter 5 India Diagnostic Home Sample Collection Market Production, Supply and Demand Analysis
- 5.1 Demand Trend and Consumption Analysis, 2018-2025
- 5.2 Demand Forecast, 2025-2035
- 5.3 Production and Output Trend, 2018-2025
- 5.4 Production and Output Forecast, 2025-2035
- 5.5 Installed Capacity and Capacity Utilization
- 5.6 Company-Wise Production Plants and Statistics
- 5.6.1 Installed Production Capacity
- 5.6.2 Actual Production
- 5.6.3 Planned Capacity and Expansion Targets
- 5.7 Supply Chain Structure and Procurement Trends
- 5.8 Supply-Demand Gap and Bottlenecks
- 5.9 Import Dependence and Sourcing Structure
- 5.10 Contract Manufacturing and Outsourcing
- 5.11 Regional Supply and Demand Concentration
Chapter 6 India Diagnostic Home Sample Collection Market Pricing Analysis
- 6.1 Pricing Structure and Measurement
- 6.2 Historical Pricing Trends, 2018-2025
- 6.3 Pricing Outlook, 2025-2035
- 6.4 Average Selling Price and Unit Economics
- 6.5 Pricing by Product and Market Segment
- 6.6 Geographic Pricing Differences
- 6.7 Key Input, Energy, Labor and Logistics Costs
- 6.8 Contract Pricing and Purchasing Models
- 6.9 Pricing Sensitivity and Competitive Positioning
- 6.10 Price, Margin and Profitability Implications
Chapter 7 India Diagnostic Home Sample Collection Market Dynamics
- 7.1 Market Growth Drivers
- 7.1.1 Demand-Side Drivers
- 7.1.2 Technology and Innovation Drivers
- 7.1.3 Infrastructure and Investment Drivers
- 7.1.4 Regulatory and Policy Drivers
- 7.2 Market Restraints
- 7.2.1 Cost and Affordability Constraints
- 7.2.2 Technology and Adoption Barriers
- 7.2.3 Supply Chain and Operational Constraints
- 7.3 Market Challenges
- 7.3.1 Competitive Pressure and Margin Erosion
- 7.3.2 Skills, Infrastructure and Implementation Gaps
- 7.4 Emerging Market Opportunities
- 7.5 Market Dynamics Impact and Time-Horizon Assessment
Chapter 8 India Diagnostic Home Sample Collection Value Chain Analysis
- 8.1 Industry Value Chain Overview
- 8.2 Upstream Suppliers and Critical Inputs
- 8.3 Technology and Component Providers
- 8.4 Manufacturing or Service Delivery
- 8.5 Distribution, Channel Partners and Integrators
- 8.6 Downstream Applications and End Users
- 8.7 Value Addition and Profit Pools
- 8.8 Vertical Integration and Outsourcing
- 8.9 Supplier Concentration and Risk
- 8.10 Supply Chain Localization and Resilience
Chapter 9 India Diagnostic Home Sample Collection Market Regulations and Policies
- 9.1 Relevant Laws, Standards and Compliance Frameworks
- 9.2 Product, Service, Safety and Quality Requirements
- 9.3 Government Policies, Incentives and Subsidies
- 9.4 Imports, Exports and Trade Barriers
- 9.5 Public Procurement and Local Content Requirements
- 9.6 Environmental and Sustainability Compliance
- 9.7 Upcoming Policy Changes and Market Implications
Chapter 10 India Diagnostic Home Sample Collection Market Hotspots and Opportunities
- 10.1 Market Opportunity Mapping and Growth Hotspots
- 10.2 High-Growth Applications and Customer Groups
- 10.3 Underserved Markets and White-Space Opportunities
- 10.4 Emerging Technology and Product Opportunities
- 10.5 New Capacity and Investment Hotspots
- 10.6 Market Entry and Expansion Opportunities
- 10.7 Distribution and Partnership Opportunities
- 10.8 Near-Term and Long-Term Commercial Potential
- 10.9 Opportunity Attractiveness and Execution Risks
Chapter 11 India Diagnostic Home Sample Collection Market Outlook, 2025-2035
- 11.1 Market Size and Analysis
- 11.1.1 Revenue (Market Measurement: 2025: USD 900.0 million → 2035: USD 2.56 billion)
- 11.1.2 Market Volume and Quantity Sold
- 11.1.3 Historical Market Size, 2018-2025
- 11.1.4 Base-Year Market Size, 2025
- 11.2 Market Forecast, 2025-2035
- 11.2.1 Revenue Forecast to 2035
- 11.2.2 Volume Forecast to 2035
- 11.2.3 CAGR and Year-on-Year Growth
- 11.2.4 Incremental Revenue Opportunity
- 11.3 Forecast Assumptions and Scenario Analysis
- 11.3.1 Base-Case Forecast
- 11.3.2 Optimistic and Conservative Scenarios
- 11.3.3 Technology, Pricing and Policy Sensitivities
- 11.4 Market Attractiveness and Growth Outlook
Chapter 12 India Diagnostic Home Sample Collection Market Segmentation and Outlook
- 12.1 Segmentation Summary and Market Shares, 2025
- 12.2 Largest and Fastest-Growing Segments
- 12.3 By Test - Market Size and Forecast, 2025-2035
- 12.3.1 Segment Definition and Scope
- 12.3.2 Historical Market Size, 2018-2025
- 12.3.3 Revenue Forecast, 2025-2035
- 12.3.4 Volume Forecast, 2025-2035
- 12.3.5 Base-Year Market Share, 2025
- 12.3.6 Segment CAGR and Growth Drivers
- 12.3.7 Subsegment Market Size and Forecast
- 12.3.7.1 Routine Blood
- 12.3.7.2 Preventive Packages
- 12.3.7.3 Specialized
- 12.3.8 Subsegment Pricing and Adoption Trends
- 12.3.9 Leading Suppliers and Competition
- 12.3.10 Regional Demand and Opportunities
- 12.4 By Customer - Market Size and Forecast, 2025-2035
- 12.4.1 Segment Definition and Scope
- 12.4.2 Historical Market Size, 2018-2025
- 12.4.3 Revenue Forecast, 2025-2035
- 12.4.4 Volume Forecast, 2025-2035
- 12.4.5 Base-Year Market Share, 2025
- 12.4.6 Segment CAGR and Growth Drivers
- 12.4.7 Subsegment Market Size and Forecast
- 12.4.7.1 B2C
- 12.4.7.2 Corporate
- 12.4.8 Subsegment Pricing and Adoption Trends
- 12.4.9 Leading Suppliers and Competition
- 12.4.10 Regional Demand and Opportunities
- 12.5 By City Tier - Market Size and Forecast, 2025-2035
- 12.5.1 Segment Definition and Scope
- 12.5.2 Historical Market Size, 2018-2025
- 12.5.3 Revenue Forecast, 2025-2035
- 12.5.4 Volume Forecast, 2025-2035
- 12.5.5 Base-Year Market Share, 2025
- 12.5.6 Segment CAGR and Growth Drivers
- 12.5.7 Subsegment Market Size and Forecast
- 12.5.7.1 Metro
- 12.5.7.2 Tier-2/3
- 12.5.8 Subsegment Pricing and Adoption Trends
- 12.5.9 Leading Suppliers and Competition
- 12.5.10 Regional Demand and Opportunities
- 12.6 Segment Growth Comparison
- 12.7 Segment Attractiveness and Priority Matrix
Chapter 13 India Diagnostic Home Sample Collection End-Use and Application Market Outlook
- 13.1 End-Use Industry and Customer Demand Structure
- 13.2 Leading Applications and Customer Groups
- 13.3 End-Use Market Size, Share and Forecast
- 13.4 Major End-Use Industry Deep Dives
- 13.4.1 Customer Requirements and Use Cases
- 13.4.2 Demand and Replacement Cycles
- 13.4.3 Technical and Regulatory Considerations
- 13.4.4 Purchasing and Procurement Models
- 13.4.5 Leading Vendors and Distribution Channels
- 13.4.6 Forecast and Commercial Opportunities
- 13.5 Emerging Applications and Cross-Segment Demand
- 13.6 End-Use Industry Investment Priorities
Chapter 14 India Diagnostic Home Sample Collection Geographic Market Outlook, 2025-2035
- 14.1 Domestic Market Distribution and Demand Clusters
- 14.2 State- or Province-Wise Market Size and Forecast, 2025-2035
- 14.3 City and Metropolitan Market Outlook
- 14.4 Industrial, Manufacturing and Commercial Clusters
- 14.5 Geographic Concentration of Key End Users
- 14.6 Local Pricing and Purchasing Differences
- 14.7 Domestic Production Facilities and Capacity Map
- 14.8 Local Infrastructure and Project Pipeline
- 14.9 State-Level Policy and Incentive Differences
- 14.10 Subnational Investment Hotspots and Opportunities
- 14.11 Distribution and Logistics Networks
- 14.12 Domestic Competitive Footprint
Chapter 15 India Diagnostic Home Sample Collection Technology, Innovation and Sustainability Outlook
- 15.1 Technology Landscape and Maturity
- 15.2 Product, Process and Service Innovation
- 15.3 AI, Automation and Digital Tools in the Industry
- 15.4 Technology Adoption and Performance Benchmarking
- 15.5 Innovation Pipeline and R&D Investment
- 15.6 Patent and Intellectual Property Trends
- 15.7 Energy Efficiency and Resource Management
- 15.8 Sustainability, Recycling and Circularity
- 15.9 Technology Roadmap, 2025-2035
- 15.10 Risks of Obsolescence and Technology Substitution
Chapter 16 India Diagnostic Home Sample Collection Market Key Strategic Imperatives
- 16.1 Growth and Market Entry Priorities
- 16.2 High-Return Products and Segments
- 16.3 Pricing, Profitability and Cost Optimization
- 16.4 Technology Investment and Product Differentiation
- 16.5 Supply Chain Localization and Resilience
- 16.6 Distribution and Customer Acquisition
- 16.7 Partnership, Acquisition and Capacity Strategy
- 16.8 Regional Expansion Priorities
- 16.9 Short-, Medium- and Long-Term Actions
Chapter 17 Competition Outlook
- 17.1 Industry Competition Characteristics
- 17.2 Market Structure and Concentration
- 17.3 Market Share and Competitive Positioning, 2025
- 17.4 Company-Wise Revenue and Product Benchmarking
- 17.5 Production and Service Capacity Benchmarking
- 17.6 Technology, Pricing and Differentiation
- 17.7 Regional Footprint and Distribution Strength
- 17.8 Mergers, Acquisitions and Strategic Alliances
- 17.9 New Entrants and Competitive Threats
- 17.10 Porter's Five Forces and Industry Attractiveness
- 17.11 Competitive Outlook, 2025-2035
Chapter 18 Company Profiles
- 18.1 Company Coverage and Selection Criteria
- 18.2 Healthians
- 18.2.1 Business Description
- 18.2.2 Company Ownership and Geographic Presence
- 18.2.3 Product and Service Portfolio
- 18.2.4 Manufacturing and Operating Footprint
- 18.2.5 Production Capacity and Expansion Plans
- 18.2.6 Financial Performance and Investment
- 18.2.7 Market Share and Competitive Position
- 18.2.8 Technology and Innovation Capabilities
- 18.2.9 Strategic Alliances or Partnerships
- 18.2.10 Recent Developments
- 18.2.11 Growth Strategy and Outlook
- 18.3 Thyrocare
- 18.4 Redcliffe Labs
- 18.5 Orange Health
- 18.6 Tata 1mg Labs
- 18.7 Dr Lal PathLabs
- 18.8 Other Relevant Market Participants
Note: Every listed company is profiled on the structure shown under the first company. The company list is preliminary and may change based on research findings, market developments, data availability and client requirements.
Chapter 19 Disclaimer
- 19.1 Research and Forecast Disclaimer
- 19.2 Data Source and Estimation Limitations
Note: The depth of individual sections depends on data availability for this market. Volume, capacity, trade and other unit-based metrics are included where applicable.

