
Therapy, chronic care and Medicare rules set the pace
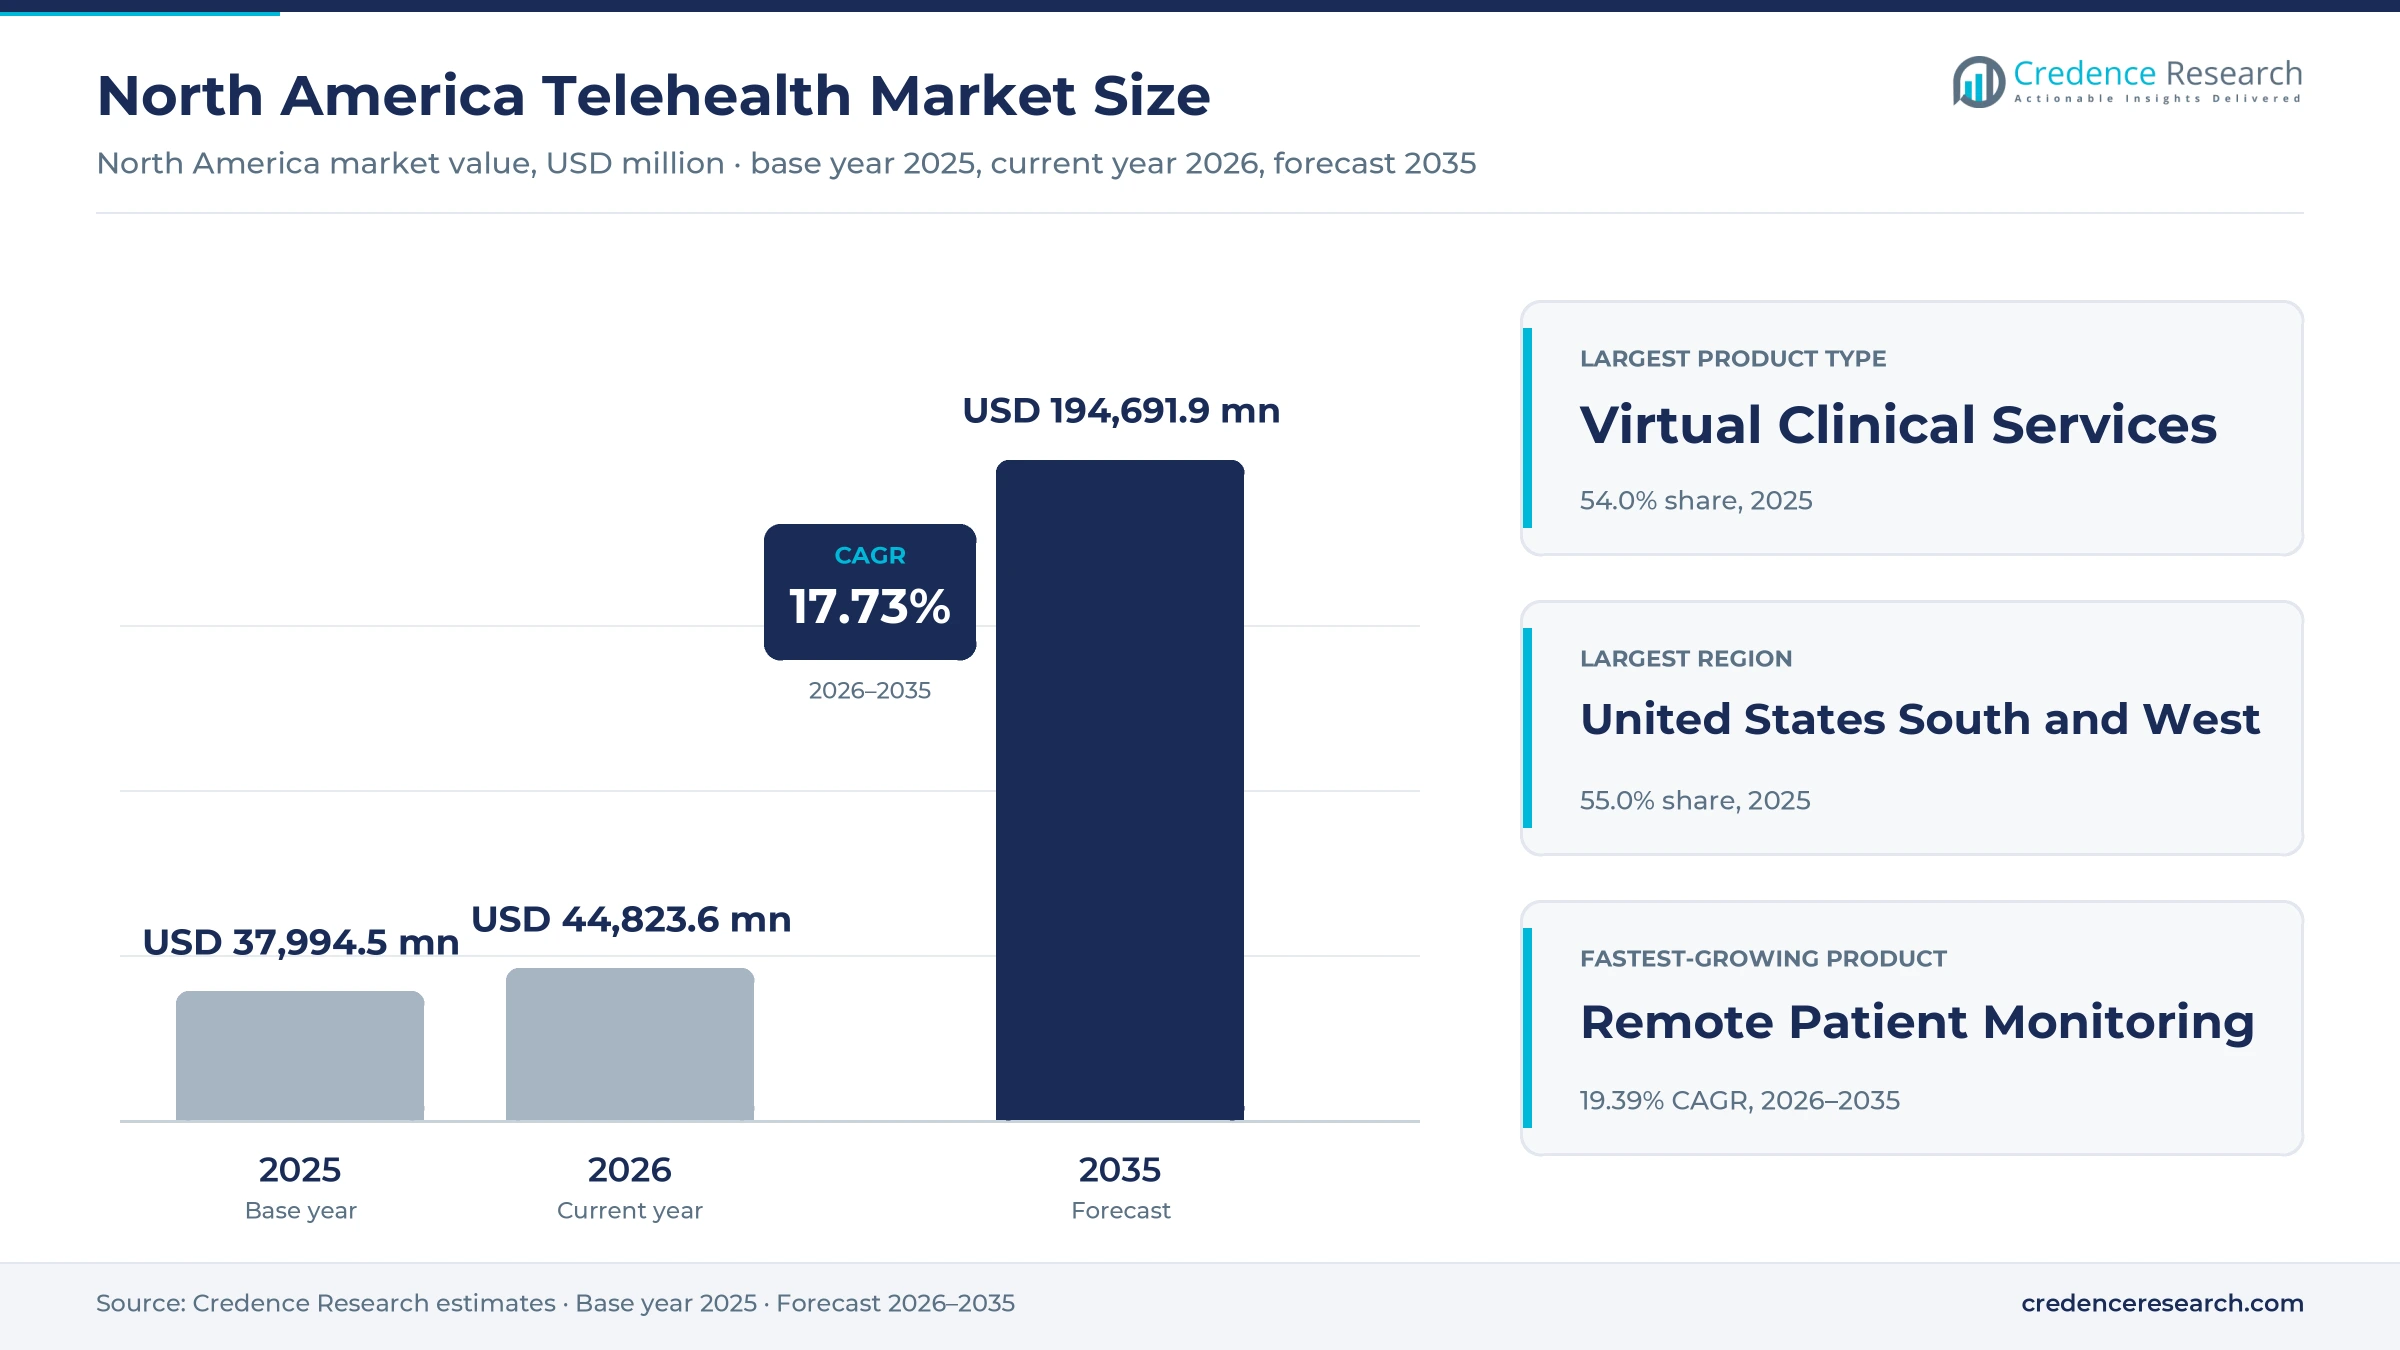
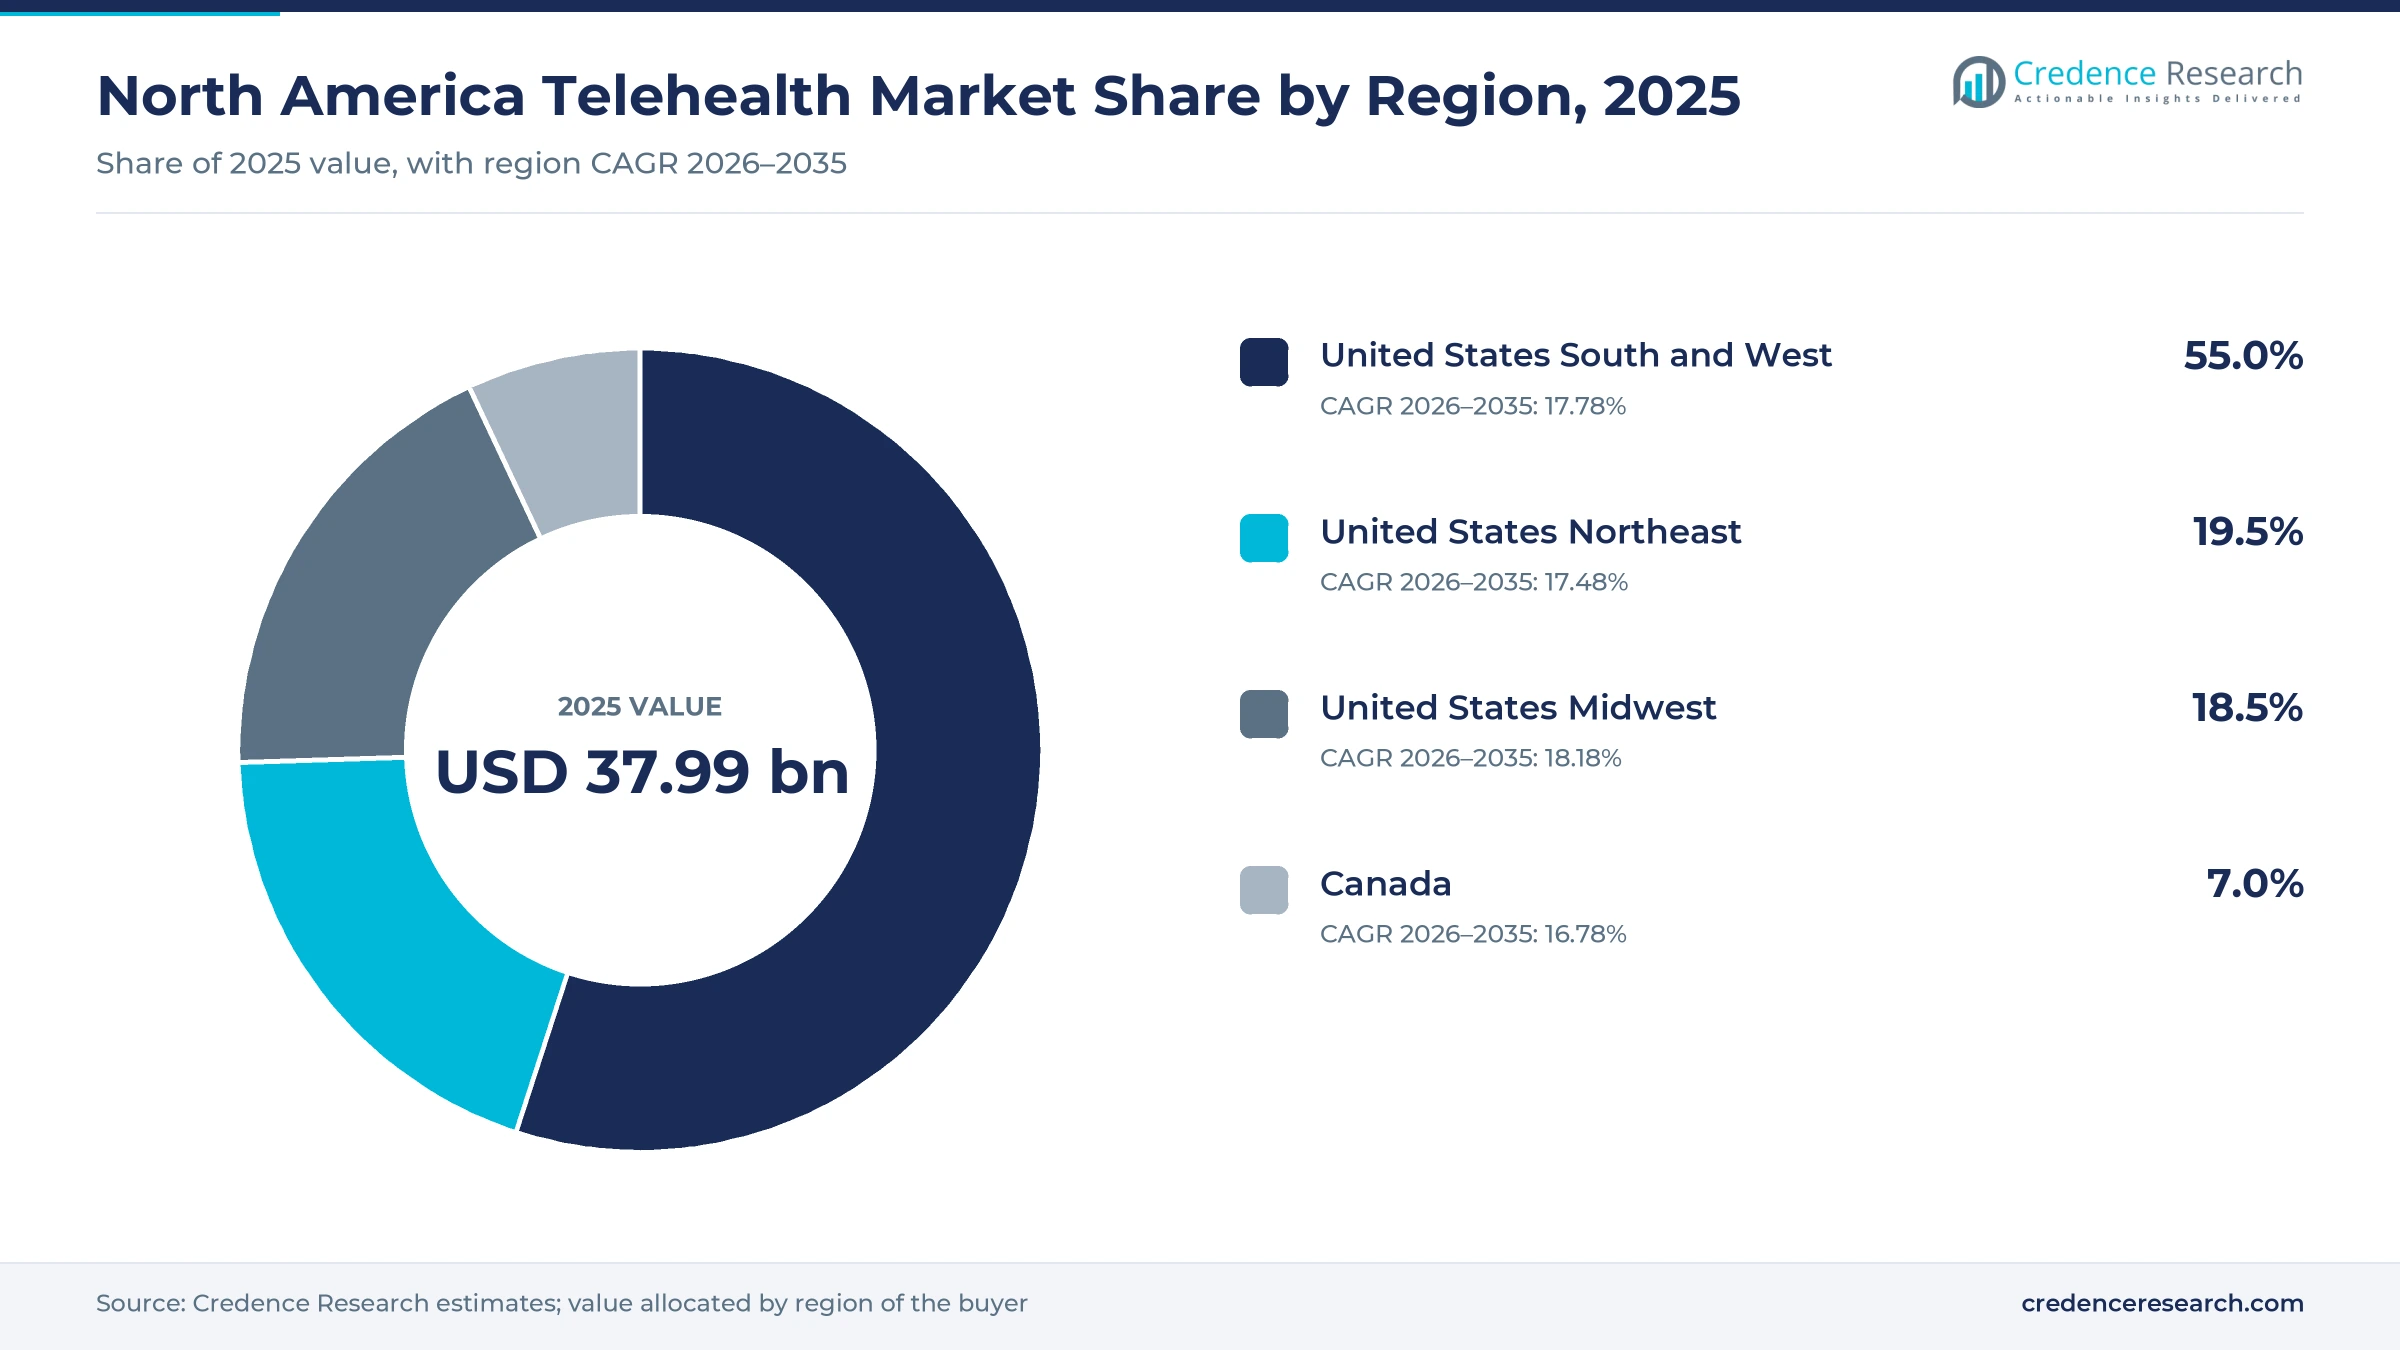
The North America telehealth market was valued at USD 37.99 billion in 2025 and is projected to increase from USD 44.82 billion in 2026 to USD 194.69 billion by 2035, registering a CAGR of 17.73% during 2026–2035. Demand comes from therapy covered by insurers, chronic conditions managed between clinic visits, and hospital programs that treat acute patients at home. United States South and West held the largest share, 55.0% in 2025, because the two census regions hold the largest combined population and Texas won the largest first-year rural health award. United States Midwest is the fastest-growing region at 18.18% a year. Medicare payment certainty changed in February 2026, when Congress extended telehealth flexibilities through the end of 2027 and hospital-at-home waivers through September 2030. Canada follows a different path, since provinces fund most physician care and a federal policy on patient charges took effect in April 2026, which leaves virtual operators there relying on public contracts and employer benefits.
Which virtual services and buyers does this estimate count?
The estimate counts spending on virtual clinical services, remote patient monitoring, telehealth software and telehealth hardware across the United States and Canada. Health systems, independent practices, employers, health plans and patients buy these services through system contracts, benefit programs, public procurement and direct subscriptions.
In-person visits, prescription drug costs and general electronic health record licenses fall outside the estimate, even when a virtual visit leads to them. The value chain runs from device and software suppliers through clinician networks and care operators to the payers and households that fund each episode of care.
North America Telehealth Market Insights
- The North America telehealth market grows from USD 37.99 billion in 2025 to USD 194.69 billion by 2035, a 17.73% CAGR over 2026–2035, as insurers, employers and Medicare fund more virtual care.
- The South and West held 55.0% of value in 2025, while the Midwest is the fastest-growing region at 18.18% a year.
- Virtual clinical services led product types with 54.0% of 2025 value, since clinician time remains the largest item that buyers pay for.
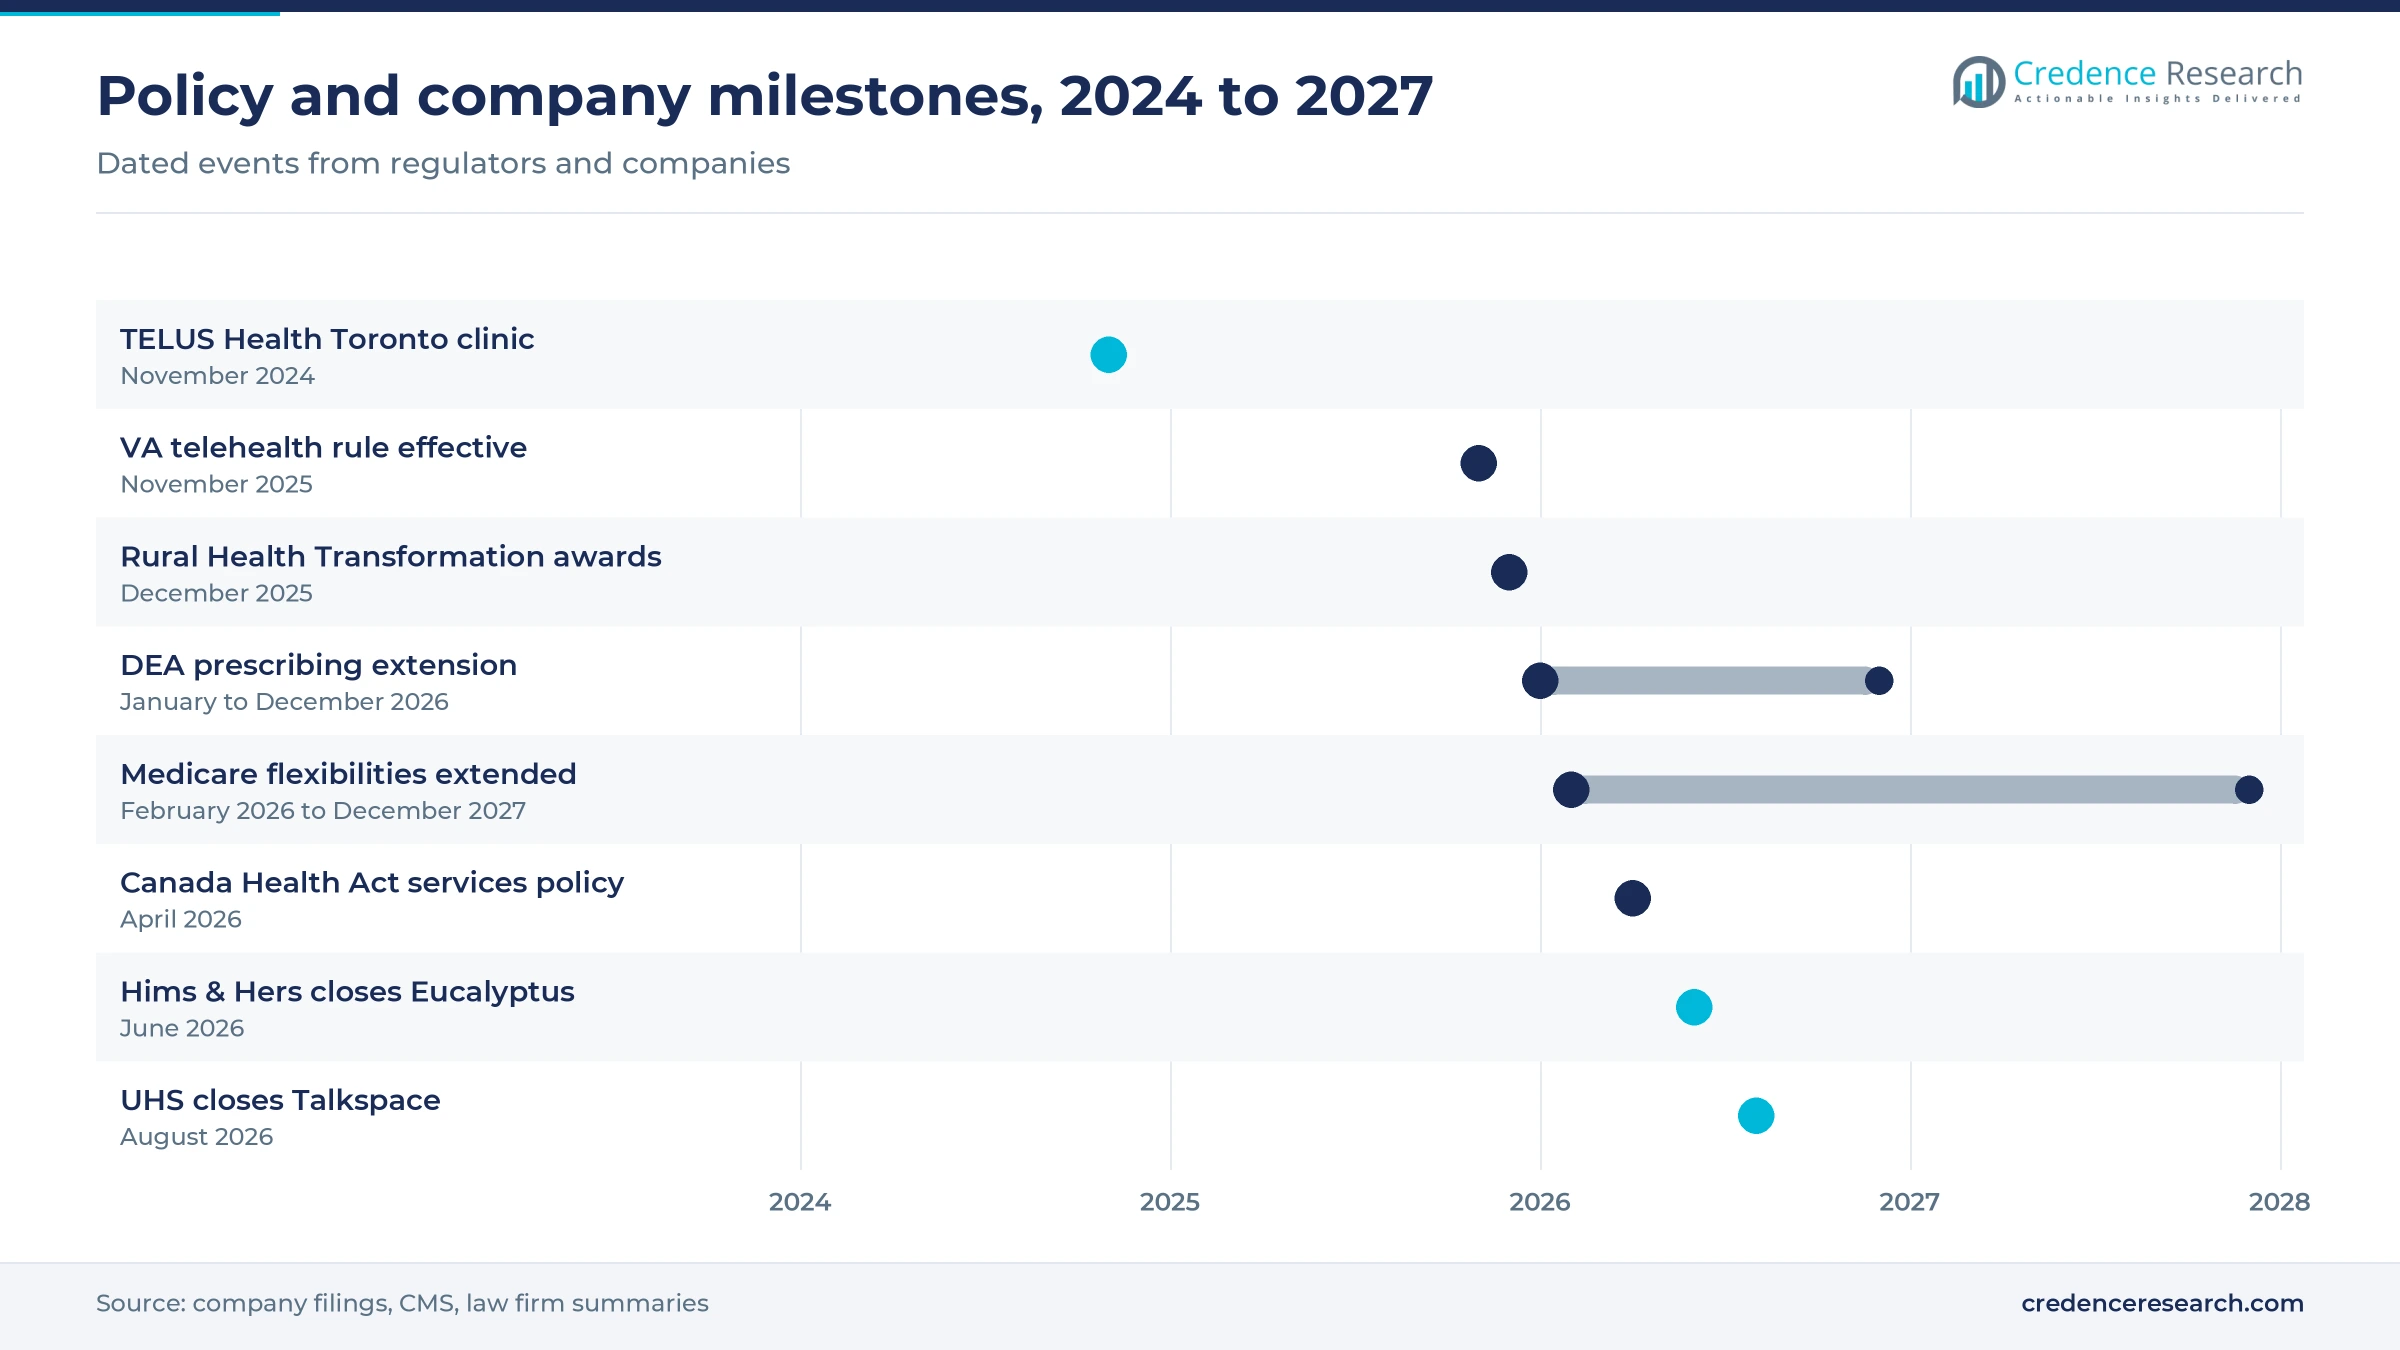
- A federal spending law signed Feb. 3, 2026, extended Medicare telehealth flexibilities through 2027 and gave hospital-at-home programs a waiver running until September 2030.
- Universal Health Services closed its $835 million Talkspace purchase in August 2026, which puts a national virtual therapy network inside a large hospital operator.
Clinician visits, home care and insured therapy lead value
Why clinician visits lead and remote monitoring grows fastest
Based on product type, the market is categorized into virtual clinical services, remote patient monitoring, telehealth software and telehealth hardware. Virtual Clinical Services led with 54.0% of 2025 value because clinician time remains the main item buyers pay for, and FAIR Health ranked established-patient office visits first among telehealth procedures in every U.S. census region in early 2026. Remote Patient Monitoring grows fastest at 19.39% a year as Medicare added CPT 99445 for two to 15 monitoring days and CPT 99470 for 10 to 19 management minutes, which Physicians Practice said removes the earlier 16-day barrier for shorter programs.
Why home visits lead as hospital-at-home programs scale
Based on care setting, the market is categorized into home-based outpatient care, hospital-based acute care, community clinic care and post-acute care. Home-Based Outpatient Care led with 62.0% of 2025 value because most episodes are therapy and office follow-up, and FAIR Health found 18.4% of commercially insured patients held a telehealth claim in the first quarter of 2026. Hospital-Based Acute Care grows fastest at 19.20% a year as CMS had approved 365 hospital campuses across 137 health systems in 37 states for Acute Hospital Care at Home, according to DistilINFO in July 2026, under a waiver now running through Sept. 30, 2030.
Why benefit programs lead and direct patients grow fastest
Based on customer type, the market is categorized into health systems, independent practices, employer and payer programs and direct-paying patients. Employer and Payer Programs led with 36.0% of 2025 value because large contracts decide who can reach members, and Lyra Health reported more than 20 million people served through employers and more than 100 million through health plans and partners in May 2026. Direct-Paying Patients grow fastest at 18.68% a year as Hims & Hers completed its Eucalyptus purchase on June 2, 2026, adding a Canadian business from a group that had served more than 850,000 customers by May.
Why behavioral care leads as metabolic programs gain speed
Based on disease area, the market is categorized into mental and behavioural health, cardiometabolic conditions, acute and primary care conditions and specialty and post-acute conditions. Mental and Behavioural Health led with 46.0% of 2025 value because FAIR Health found 52.1% of patients with a telehealth claim had a mental health diagnosis in the first quarter of 2026. Cardiometabolic Conditions grows fastest at 19.32% a year as digital obesity programs reach scale, and Omada Health reported supporting more than 150,000 members on GLP-1 drugs at the end of 2025, up from more than 50,000 a year earlier.
| Segment Group | Leading Sub-segment | Share, 2025 | Fastest-growing Sub-segment | CAGR, 2026–2035 |
|---|---|---|---|---|
| By Product Type | Virtual Clinical Services | 54.0% | Remote Patient Monitoring | 19.39% |
| By Care Setting | Home-Based Outpatient Care | 62.0% | Hospital-Based Acute Care | 19.20% |
| By Customer Type | Employer and Payer Programs | 36.0% | Direct-Paying Patients | 18.68% |
| By Disease Area | Mental and Behavioural Health | 46.0% | Cardiometabolic Conditions | 19.32% |
Request a Free Sample
Fill in your details and we'll send you a free sample report.
- Sample data tables & charts
- Research methodology
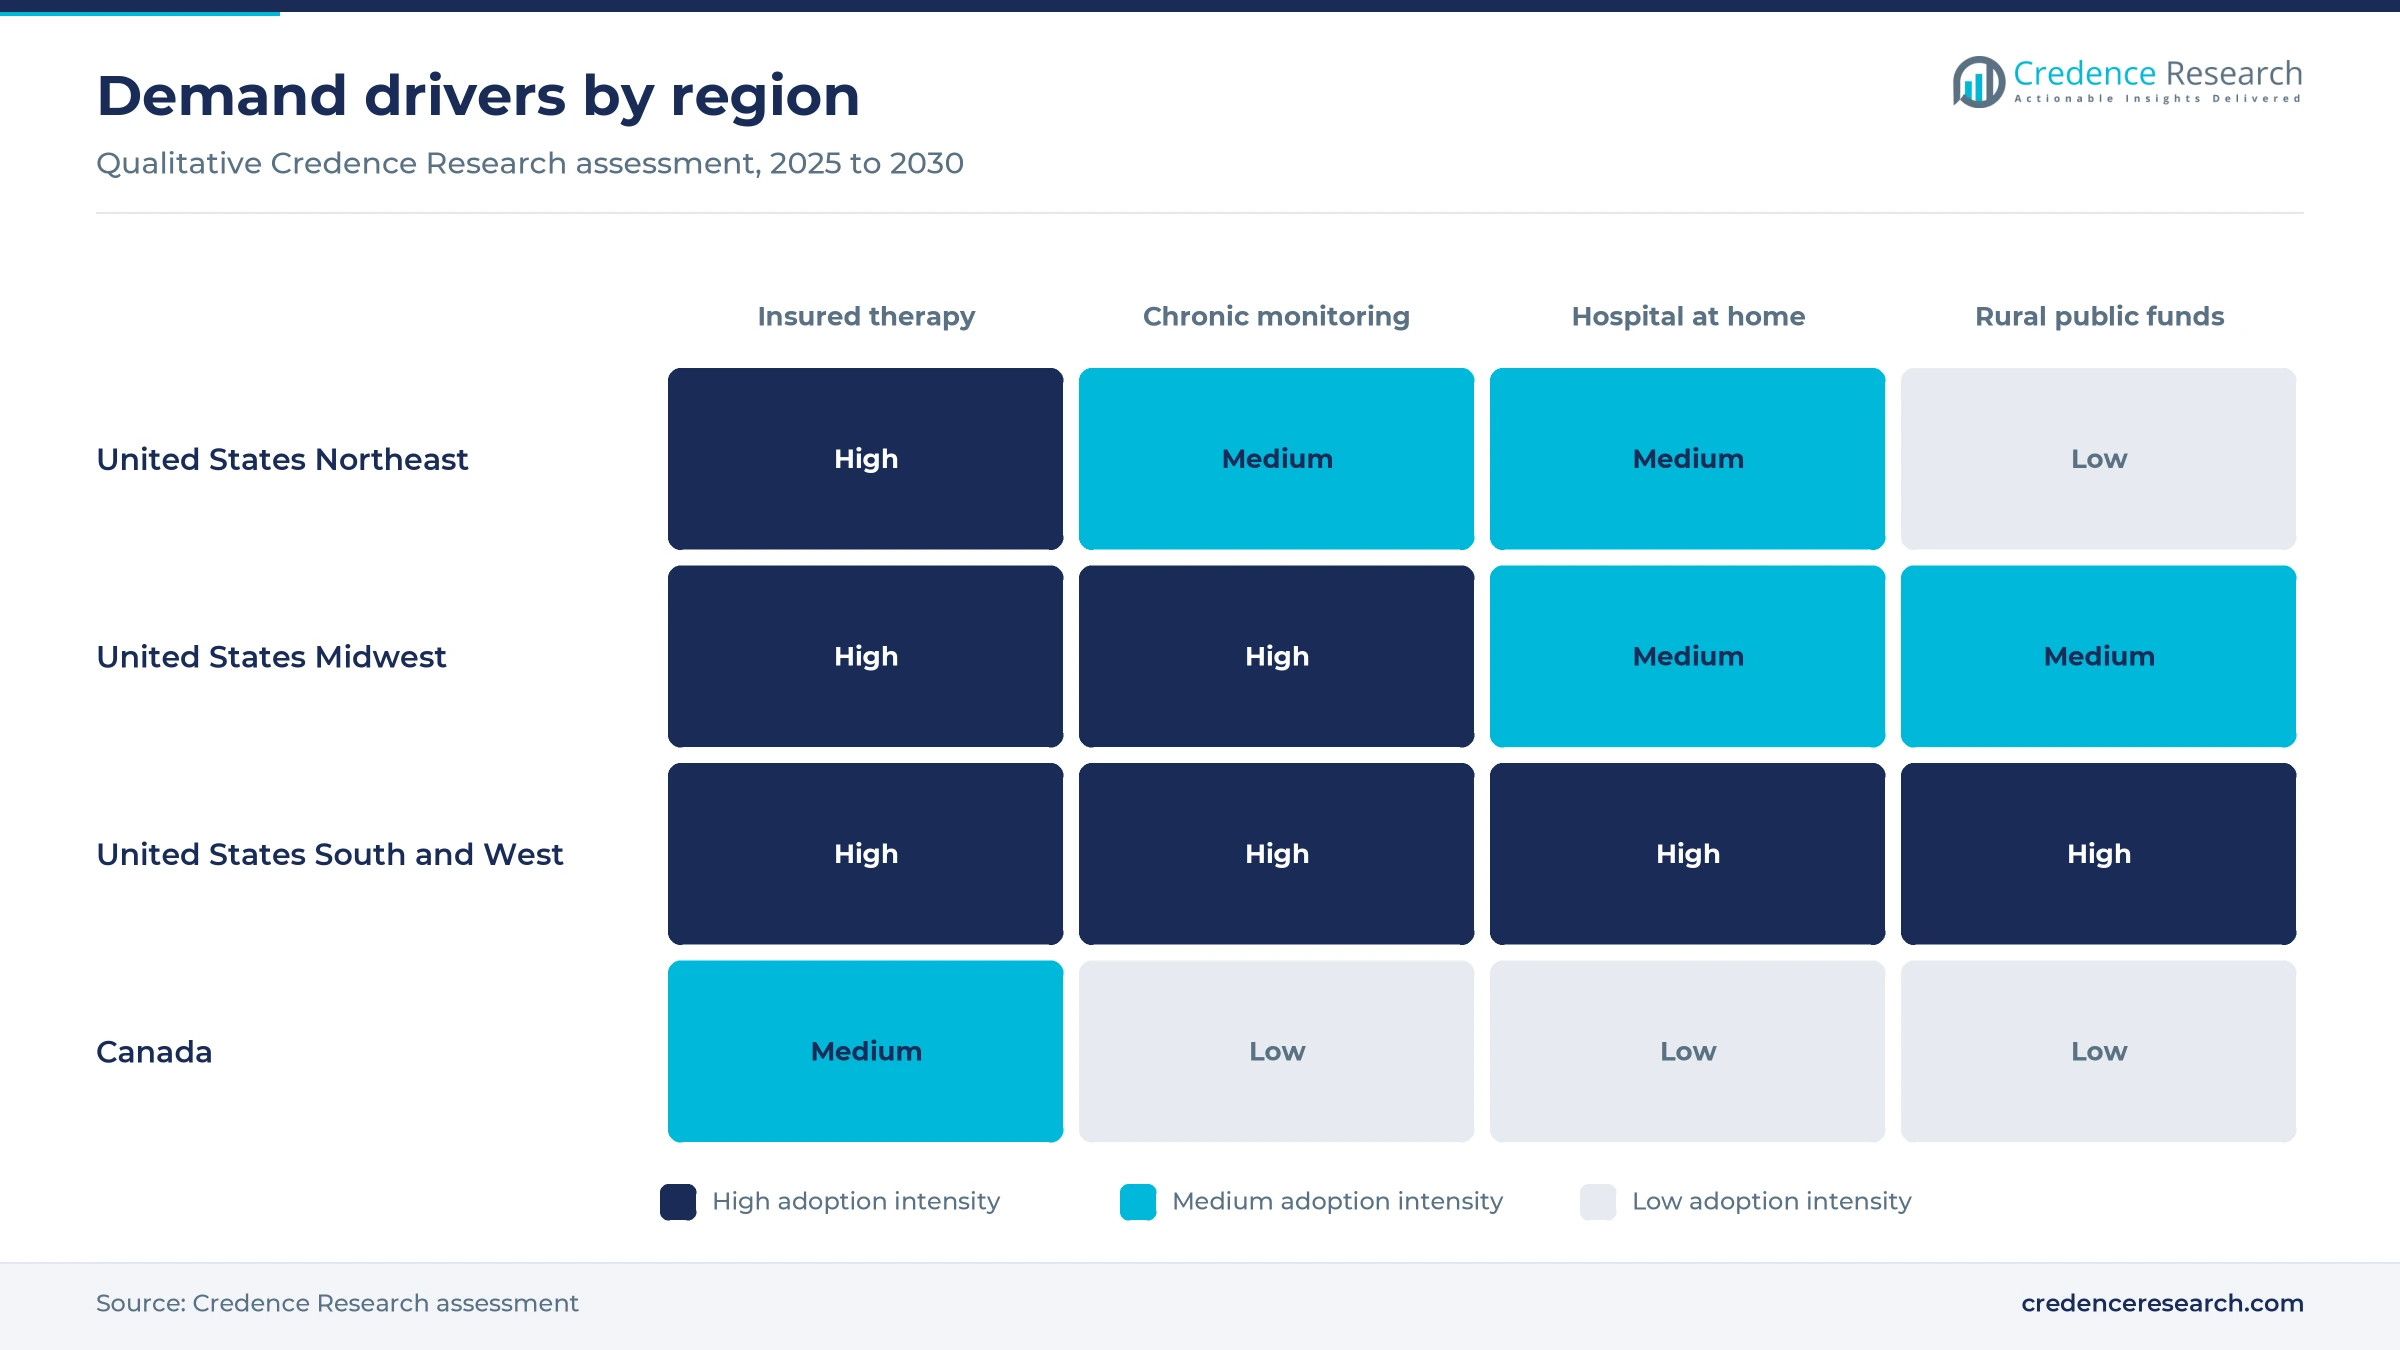
Chronic care and insured therapy widen the buyer base
Longitudinal care demand keeps patients enrolled for years
Longitudinal care lifts spending because a patient with diabetes, obesity or arrhythmia needs contact for years rather than one visit. Omada Health ended 2025 with 886,000 members, up 55% from a year earlier, and it counted more than 2,000 employer, plan, benefit manager and health system customers across its history. Overweight and obesity ranked third among telehealth diagnoses nationally in the first quarter of 2026, according to FAIR Health tracker data reported by Fierce Healthcare. As a result, remote patient monitoring now sits inside routine cardiology, and iRhythm Technologies had posted more than 13 million Zio patient reports by June 30, 2026, with 57% of registration volume coming from accounts linked to electronic health records.
Insurer-funded behavioral care moves therapy off cash pay
Insurer funding widens behavioral demand because covered patients return more often than those paying from their own pockets. Teladoc Health said in May 2026 that BetterHelp insurance was live in 30 states and Washington, D.C., with more than 14,000 covered sessions a week, according to Behavioral Health Business. That report also said covered users averaged 20% more sessions than cash users during their first 90 days. Talkspace had services available to more than 200 million people through health plans, employers and government benefits by Dec. 31, 2025, and it delivered more than 1.6 million patient sessions that year. Together, these figures show therapy shifting from a consumer subscription toward a contracted benefit that plans can budget.
Accessible multimodal delivery reaches patients without video
Multimodal delivery widens the patient base because phone, video and messaging suit different homes and conditions. MedPAC survey data from 2024 showed 24% of Medicare beneficiaries had an audio-only visit in the prior year, against 18% who used video, and satisfaction reached 93% and 92% respectively. Privately insured adults aged 50 to 64 reversed the pattern, with 26% using video and 20% audio. In Canada, Statistics Canada survey data from 2023 showed 37.2% of health care users had both virtual and in-person appointments, while 5.3% relied on virtual visits alone. Providers therefore keep several channels open, because a video-only design would miss many older patients who still answer the phone for care.
Federal payment certainty unlocks multiyear virtual budgets
Federal payment certainty lets health systems fund virtual programs beyond a single budget year. The Consolidated Appropriations Act, 2026, signed Feb. 3, 2026, extended Medicare telehealth flexibilities through Dec. 31, 2027, including audio-only coverage where clinically appropriate. The same law extended hospital-at-home waivers through Sept. 30, 2030, which gives operators a much longer horizon for staffing and equipment. Separately, the Department of Veterans Affairs issued a final rule, effective Nov. 3, 2025, that preempts conflicting state requirements for its own telehealth clinicians. Medicare also made virtual direct supervision permanent in its 2026 fee schedule, according to Physicians Practice, so practices can plan staffing around remote oversight rather than a temporary waiver.
Platform deals and rural funding reshape virtual care
Hospital operators and consumer brands buy virtual networks
Consolidation is shifting virtual care from stand-alone apps into larger operators with referral paths. Universal Health Services completed its purchase of Talkspace on Aug. 17, 2026, adding about 6,000 licensed providers to a group with more than 380 inpatient behavioral health facilities. Hims & Hers completed its Eucalyptus deal on June 2, 2026, giving the consumer brand a leading presence in Canada alongside the United States, according to its Securities and Exchange Commission filing. Earlier, Evernorth placed MDLIVE beside Express Scripts and Accredo inside the Cigna health services portfolio in April 2021. Buyers therefore face fewer independent vendors, and they increasingly compare virtual therapy on how well it hands patients to inpatient, pharmacy or specialty care.
AI guides emerge between therapy sessions and in cardiac reads
Artificial intelligence is emerging as a support layer around clinicians rather than a replacement for visits. Lyra Health made its 24-hour AI guide generally available in May 2026, with automated session summaries for providers and voice mode for members, which extends digital brain health support between appointments. Talkspace also offers Tee, an AI mental health guide for users aged 18 and older, according to the Universal Health Services filing of August 2026. In cardiology, iRhythm reported Food and Drug Administration clearance for a next-generation algorithm in its second-quarter 2026 presentation, with launch expected in the first half of 2027. Buyers now ask how these tools shorten paperwork and how supervisors check their output.
Rural transformation funding opens a public buying channel
Rural funding offers a sizable opening because rural patients still use telehealth far less than urban patients. FAIR Health found 10.3% of rural patients held a telehealth claim in early 2026, against 18.6% of urban patients, although rural use grew 7.8% in the quarter. The Rural Health Transformation awards announced on Dec. 29, 2025 total $50 billion, with $10 billion available each year from 2026 through 2030 and first-year awards averaging $200 million. CMS said states will use the money to expand telehealth, remote patient monitoring and digital tools. Texas received the largest first-year award at $281.3 million, so vendors with state procurement experience and rural clinic workflows can compete for these programs through 2030.
First-dollar employer coverage offers a benefits opening
Employer benefits offer a second opening because federal law now lets high-deductible plans cover virtual care before the deductible. The One, Big, Beautiful Bill Act, enacted July 4, 2025, made that safe harbor permanent for plan years beginning after Dec. 31, 2024, according to HUB International, which summarized IRS Notice 2026-5. Lyra Health became the preferred mental health partner of Workday Wellness in March 2026, which places therapy inside a common benefits system. Walmart extended no-copay virtual primary care from Included Health to its roughly 1.6 million U.S. employees and their families in 2023, according to TechTarget. Vendors that can show savings against health claims should therefore gain from benefit renewals through the decade.
Rule deadlines and rural gaps limit near-term planning
Prescribing and Medicare deadlines keep planning short
Fixed expiry dates make it harder for virtual operators to commit capital. The Drug Enforcement Administration and HHS issued a fourth temporary extension in January 2026, keeping remote prescribing of Schedule II-V drugs without an initial in-person exam only through Dec. 31, 2026, according to Holland & Knight. Medicare telehealth flexibilities then run out exactly one year after that date. Psychiatry and addiction practices carry the greatest exposure, so operators may need in-person referral networks as a fallback while permanent rules remain unsettled.
Canadian patient-charge policy clouds private virtual clinics
Federal policy adds risk for Canadian operators that charge patients or employers for virtual visits. The Canada Health Act services policy took effect April 1, 2026, and treats some charges for nurse practitioner services as prohibited, according to law firm BLG. Provinces face reductions in future federal transfers, and reporting is expected from December 2028. Private clinics and benefit vendors are most exposed, and the Canadian Chamber of Commerce has asked Ottawa for an explicit virtual care exemption. Quebec already allows employer-paid virtual care, which offers one possible model.
Rural access gaps persist despite wider virtual coverage
Virtual coverage has not closed the distance between specialists and patients in remote areas. A CMAJ study of more than 5.3 million Ontario patients, published in September 2025, found no meaningful change in driving distance to specialists, except modest shifts in psychiatry. About 18% of Canadians live in rural areas, but only 2.2% of specialists practice there. Rural patients therefore remain underserved, and provinces may need outreach clinics and specialist incentives alongside virtual visits to change those referral patterns.
Community health center payment rules restrict virtual visits
Payment rules limit how far community clinics can build virtual care into their budgets. The National Association of Community Health Centers said in February 2026 that centers can bill G2025 for non-behavioral telehealth only through Dec. 31, 2026. CMS also declined to count audio-video contact as a medical visit under the center payment system, whose 2026 base rate is $207.72. Low-income patients feel this most, so centers may hold back virtual schedules until Medicare sets a lasting rule.
The South and West lead while the Midwest grows fastest
| Region | Value, 2025 (USD billion) | Share, 2025 | CAGR, 2026–2035 |
|---|---|---|---|
| United States South and West | 20.90 | 55.0% | 17.78% |
| United States Northeast | 7.41 | 19.5% | 17.48% |
| United States Midwest | 7.03 | 18.5% | 18.18% |
| Canada | 2.66 | 7.0% | 16.78% |
The South and West combine scale with state rural funding
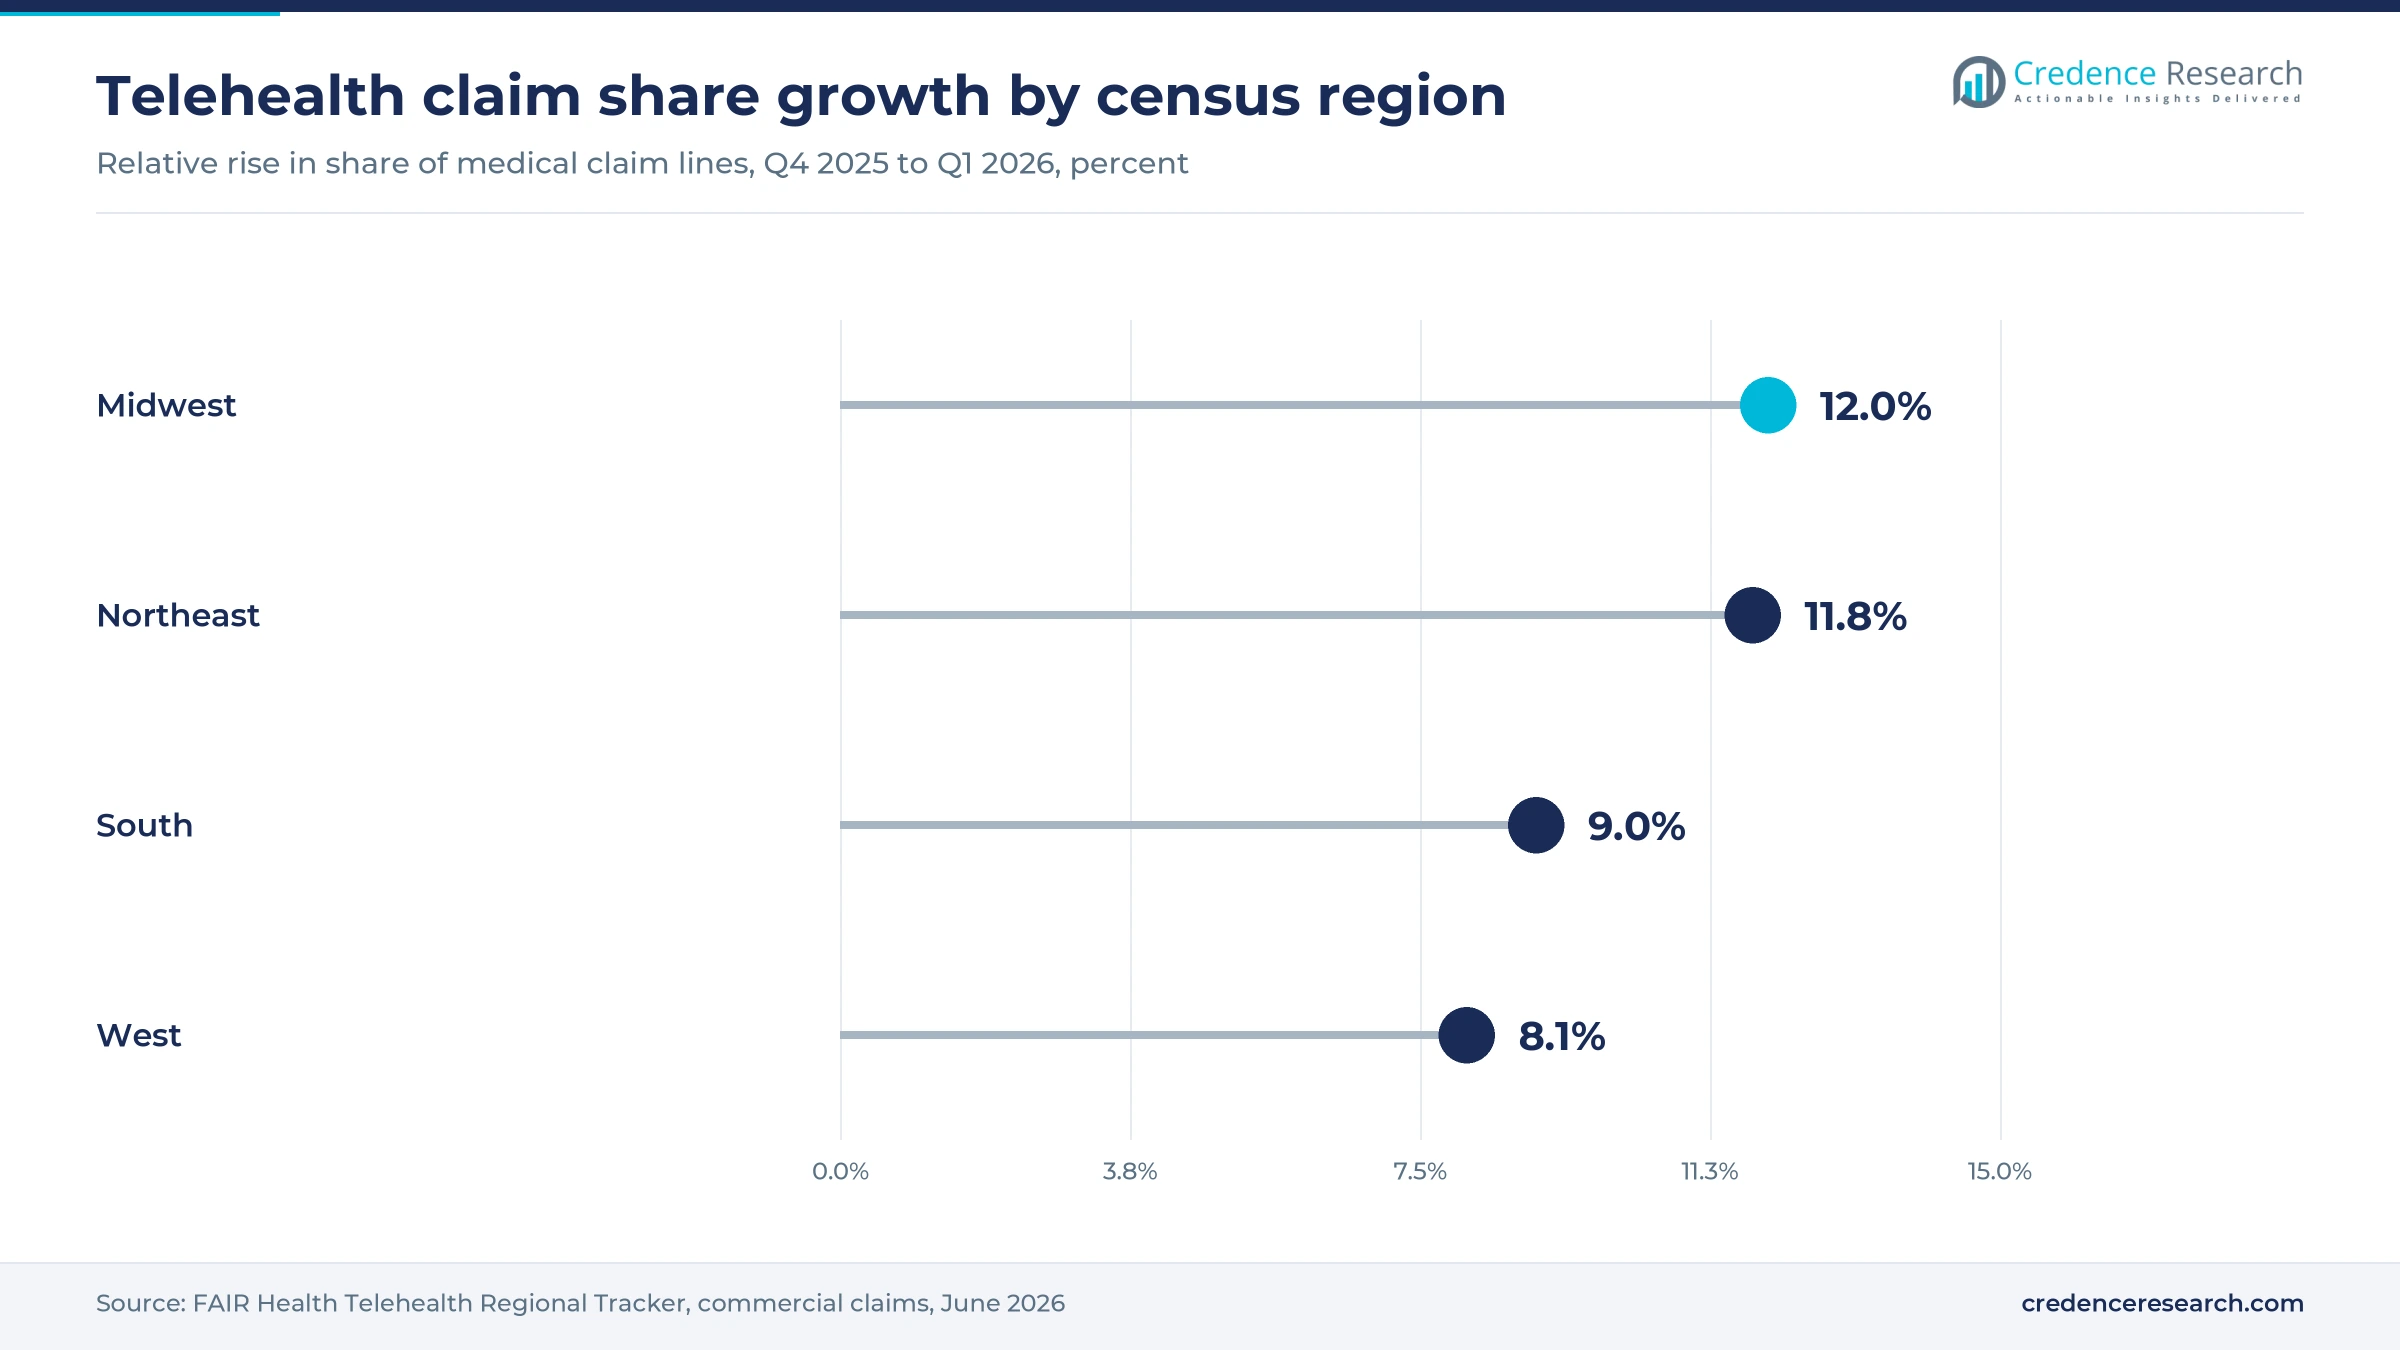
The United States South and West held 55.0% of 2025 value and grows at 17.78% a year. FAIR Health recorded a 9% rise in telehealth claim share in the South and an 8.1% rise in the West between the fourth quarter of 2025 and the first quarter of 2026. Texas also holds the largest first-year rural award, and Atrium Health Navicent in Georgia gained hospital-at-home approval on April 29, 2026, so public and hospital buyers both add demand.
The Northeast pairs rising claims with steady therapy demand
The United States Northeast held 19.5% of 2025 value and grows at 17.48% a year. FAIR Health recorded an 11.8% rise in telehealth claim share there in the first quarter of 2026, along with the largest regional gain in patients using telehealth, at 7.3%. Overweight and obesity ranked third among diagnoses in the Northeast, compared with fifth in the South and West. Weight programs therefore add to an established therapy base, which keeps growth close to the regional average.
The Midwest grows fastest on rising claims and hospital programs
The United States Midwest held 18.5% of 2025 value and grows at 18.18% a year, the fastest of the four regions. FAIR Health recorded a 12% rise in telehealth claim share in the Midwest in the first quarter of 2026, the largest regional gain, along with a 6.8% rise in patients using telehealth. Hospital programs add support, since Advocate Aurora Medical Center Grafton in Wisconsin gained hospital-at-home approval on Jan. 15, 2026. Long rural distances across the region also favor home monitoring programs.
Canada grows under provincial funding and uneven use
Canada held 7.0% of 2025 value and grows at 16.78% a year, slower than the U.S. regions because provinces fund most physician care. The National Institute on Ageing reported in June 2026 that 51% of Canadians aged 50 and older had used virtual care, ranging from 63% in British Columbia to 38% in Alberta. TELUS Health opened a Toronto MyCare clinic for up to 6,000 patients in November 2024, which combines public primary care with in-person and virtual visits under one roster.
Mergers, waivers and funding marked the past 24 months
| Development | Status and market relevance |
|---|---|
| In August 2026, Universal Health Services completed its $835 million purchase of Talkspace, announced in March 2026. | Completed; places a national therapy network inside a large hospital operator |
| In June 2026, Hims & Hers completed its acquisition of Eucalyptus, adding operations in Canada and other countries. | Completed; extends a U.S. consumer brand into Canadian virtual care |
| In April 2026, the Canada Health Act services policy took effect, affecting charges for nurse practitioner care. | In force; provincial reporting of prohibited charges is expected from December 2028 |
| In February 2026, Congress extended Medicare telehealth flexibilities through 2027 and hospital-at-home waivers through September 2030. | Enacted; gives providers a longer planning horizon |
| In December 2025, CMS announced $50 billion in Rural Health Transformation awards covering all 50 states. | Under way; $10 billion is available each year from 2026 through 2030 |
Video, phone and connected sensors define delivery choices
- Synchronous video remains the standard for therapy and specialist follow-up, and MedPAC data show 26% of privately insured adults aged 50 to 64 used it during the prior year.
- Audio-only communication stays covered by Medicare through 2027 where clinically appropriate, which protects patients who lack the devices or broadband needed for video.
- Asynchronous clinical exchange lets clinicians review messages, forms and images later, and community health centers now report remote evaluation under codes G2010, G2250 and 98016 following the 2026 Medicare fee schedule.
- Connected monitoring sends readings from patches, scales and glucose meters to care teams, and iRhythm has collected more than 3 billion hours of curated heart rhythm data through June 2026.
Need a Custom Version of This Report?
Tailor the scope, geography, or segments to your exact requirements.
- Custom geography or segment scope
- Direct access to our analyst team
Ten operators compete on payer access and clinical range
Competition in North America telehealth centers on payer access, clinical range and integration with hospital records rather than on visit price alone. Teladoc Health has credentialed more than 6,000 providers for BetterHelp insurance, while its cash network holds more than 30,000 therapists. Talkspace now competes inside Universal Health Services, and Lyra Health sells through employer contracts and benefit platforms. Amwell supplies technology to the U.S. Defense Health Agency through a Leidos-led effort announced in August 2025. MDLIVE reaches members through health plans under Evernorth, and Included Health serves Walmart. Omada Health and iRhythm Technologies compete on chronic programs and cardiac monitoring, while TELUS Health serves Canadian employers and runs MyCare clinics. Hims & Hers and iRhythm also sell beyond the region, so their plans draw on global telemedicine services demand as well as domestic payer rules.
Companies profiled and their roles in this market
| Company | Type | Role in the market |
|---|---|---|
| Teladoc Health | Virtual care platform | BetterHelp insurance live in 30 states and Washington, D.C., plus health system and employer contracts |
| Hims & Hers Health | Consumer telehealth brand | Direct-paying programs in the United States, with Canadian operations added through Eucalyptus in 2026 |
| TELUS Health | Canadian care operator | MyCare virtual visits, a Toronto public primary care clinic and employer benefits including Walmart Canada |
| iRhythm Technologies | Connected monitoring | Zio long-term cardiac monitoring, with most registrations from accounts linked to electronic records |
| Lyra Health | Employer mental health | Workforce therapy, an AI guide and a preferred partner role with Workday Wellness |
| Amwell | Telehealth software | Technology supplier for Defense Health Agency care teams through a Leidos-led effort |
| Included Health | Virtual primary care | No-copay virtual primary care partner for Walmart employees in the United States |
| Talkspace | Virtual therapy network | About 6,000 providers, owned by Universal Health Services since August 2026 |
| MDLIVE | Virtual care platform | Round-the-clock urgent, dermatology and behavioral visits within the Evernorth portfolio |
| Omada Health | Cardiometabolic programs | Diabetes, weight and GLP-1 support for employers, health plans and health systems |
Coverage depth matters more than visit volume through 2035
Credence Research's view is that coverage depth will decide North America telehealth winners more than raw visit volume. Teladoc Health's data on covered users show that insurance changes how often patients return, and Medicare's extension to the end of 2027 gives providers time to prove outcomes. Operators with contracted benefits, referral paths and monitoring data should hold pricing better than those selling a single visit. The main risk sits with prescribing rules at the end of 2026, which could split psychiatric and addiction programs from routine primary care if regulators require more in-person contact.
Claims data and census counts anchor the estimate
The report uses 2025 as the base year and 2035 as the forecast year, with market values taken from the Credence Research model and checked against national health spending data from CMS. Regional, segment and growth splits are Credence Research estimates informed by census population, FAIR Health commercial claims data, MedPAC, Statistics Canada and company filings. Secondary sources also include federal law summaries, CMS bulletins and company press releases. No interviews or primary surveys were conducted by Credence Research for this edition.
Monitoring and metabolic programs gain share by 2035
The North America telehealth market reaches USD 194.69 billion by 2035 at a 17.73% CAGR, with growth moving toward monitoring and metabolic programs as Medicare codes support shorter programs and employers review GLP-1 costs. Hospital-at-home waivers running to September 2030 give acute programs time to scale before Congress reviews them again. Rural awards end in 2030, so states will need to show results before that funding stops. Canada should grow more slowly, since provincial contracts and the federal charge policy shape who pays, and reporting from December 2028 will show how strictly the rules apply.
Frequently Asked Questions
How big is the North America telehealth market?
Which region holds the largest share?
Which region grows fastest?
Which product type leads the market?
Why does mental health lead telehealth demand?
How long do Medicare telehealth flexibilities last?
What is the main risk for virtual prescribers?
Who are the main companies in the market?
Table of Content
Chapter 1 Market Segmentation
- 1.1 Segmentation Framework
- 1.1.1 Product and Service Classification
- 1.1.2 Application and End-Use Classification
- 1.1.3 Technology and Solution Classification
- 1.1.4 Customer and Distribution Channel Classification
- 1.1.5 Geographic Segmentation
- 1.1.6 Market Segment Definitions and Boundaries
- 1.2 By Product Type
- 1.2.1 Virtual Clinical Services
- 1.2.2 Remote Patient Monitoring
- 1.2.3 Telehealth Software
- 1.2.4 Telehealth Hardware
- 1.3 By Care Setting
- 1.3.1 Home-Based Outpatient Care
- 1.3.2 Hospital-Based Acute Care
- 1.3.3 Community Clinic Care
- 1.3.4 Post-Acute Care
- 1.4 By Customer Type
- 1.4.1 Employer and Payer Programs
- 1.4.2 Health Systems
- 1.4.3 Direct-Paying Patients
- 1.4.4 Independent Practices
- 1.5 By Disease Area
- 1.5.1 Mental and Behavioural Health
- 1.5.2 Acute and Primary Care Conditions
- 1.5.3 Cardiometabolic Conditions
- 1.5.4 Specialty and Post-Acute Conditions
Chapter 2 Introduction
- 2.1 Report Objectives and Scope
- 2.2 Product Definition and Industry Terminology
- 2.3 Market Inclusions and Exclusions
- 2.4 Research Process
- 2.4.1 Primary Research and Expert Interviews
- 2.4.2 Secondary Research and Source Review
- 2.4.3 Top-Down and Bottom-Up Estimation
- 2.4.4 Data Triangulation and Verification
- 2.5 Market Size Measurement Basis
- 2.5.1 2025: USD 37.99 billion → 2035: USD 194.69 billion
- 2.6 Historical and Forecast Reference Periods
- 2.6.1 Historical Period: 2018-2025
- 2.6.2 Base Year: 2025
- 2.6.3 Forecast Period: 2025-2035
- 2.7 Research Assumptions and Limitations
Chapter 3 Executive Summary
- 3.1 Market Snapshot and Key Findings
- 3.2 Base-Year Market Size, 2025
- 3.3 Forecast Market Size, 2035
- 3.4 Revenue and Volume Growth Outlook
- 3.5 Key Demand and Supply Indicators
- 3.6 Leading Market Segments
- 3.7 Fastest-Growing Market Opportunities
- 3.8 Regional Performance Highlights
- 3.9 Technology and Industry Transformation
- 3.10 Competitive Landscape Summary
- 3.11 Analyst View and Strategic Implications
Chapter 4 North America Telehealth Market Trends and Developments
- 4.1 Historical Industry Development, 2018-2025
- 4.2 Recent Market Trends and Developments
- 4.3 Demand and Customer Behavior Trends
- 4.4 Technology and Product Innovation
- 4.5 Artificial Intelligence, Automation and Digitalization
- 4.6 Local Manufacturing and Supply Chain Realignment
- 4.7 Industry Partnerships, Mergers and Acquisitions
- 4.8 Sustainability and Circular Economy Developments
- 4.9 Government and Private Sector Investment Trends
- 4.10 Emerging Business Models and Commercialization
- 4.11 Industry Developments and Announcements
Chapter 5 North America Telehealth Market Production, Supply and Demand Analysis
- 5.1 Demand Trend and Consumption Analysis, 2018-2025
- 5.2 Demand Forecast, 2025-2035
- 5.3 Production and Output Trend, 2018-2025
- 5.4 Production and Output Forecast, 2025-2035
- 5.5 Installed Capacity and Capacity Utilization
- 5.6 Company-Wise Production Plants and Statistics
- 5.6.1 Installed Production Capacity
- 5.6.2 Actual Production
- 5.6.3 Planned Capacity and Expansion Targets
- 5.7 Supply Chain Structure and Procurement Trends
- 5.8 Supply-Demand Gap and Bottlenecks
- 5.9 Import Dependence and Sourcing Structure
- 5.10 Contract Manufacturing and Outsourcing
- 5.11 Regional Supply and Demand Concentration
Chapter 6 North America Telehealth Market Pricing Analysis
- 6.1 Pricing Structure and Measurement
- 6.2 Historical Pricing Trends, 2018-2025
- 6.3 Pricing Outlook, 2025-2035
- 6.4 Average Selling Price and Unit Economics
- 6.5 Pricing by Product and Market Segment
- 6.6 Geographic Pricing Differences
- 6.7 Key Input, Energy, Labor and Logistics Costs
- 6.8 Contract Pricing and Purchasing Models
- 6.9 Pricing Sensitivity and Competitive Positioning
- 6.10 Price, Margin and Profitability Implications
Chapter 7 North America Telehealth Market Dynamics
- 7.1 Market Growth Drivers
- 7.1.1 Demand-Side Drivers
- 7.1.2 Technology and Innovation Drivers
- 7.1.3 Infrastructure and Investment Drivers
- 7.1.4 Regulatory and Policy Drivers
- 7.2 Market Restraints
- 7.2.1 Cost and Affordability Constraints
- 7.2.2 Technology and Adoption Barriers
- 7.2.3 Supply Chain and Operational Constraints
- 7.3 Market Challenges
- 7.3.1 Competitive Pressure and Margin Erosion
- 7.3.2 Skills, Infrastructure and Implementation Gaps
- 7.4 Emerging Market Opportunities
- 7.5 Market Dynamics Impact and Time-Horizon Assessment
Chapter 8 North America Telehealth Value Chain Analysis
- 8.1 Industry Value Chain Overview
- 8.2 Upstream Suppliers and Critical Inputs
- 8.3 Technology and Component Providers
- 8.4 Manufacturing or Service Delivery
- 8.5 Distribution, Channel Partners and Integrators
- 8.6 Downstream Applications and End Users
- 8.7 Value Addition and Profit Pools
- 8.8 Vertical Integration and Outsourcing
- 8.9 Supplier Concentration and Risk
- 8.10 Supply Chain Localization and Resilience
Chapter 9 North America Telehealth Market Regulations and Policies
- 9.1 Relevant Laws, Standards and Compliance Frameworks
- 9.2 Product, Service, Safety and Quality Requirements
- 9.3 Government Policies, Incentives and Subsidies
- 9.4 Imports, Exports and Trade Barriers
- 9.5 Public Procurement and Local Content Requirements
- 9.6 Environmental and Sustainability Compliance
- 9.7 Upcoming Policy Changes and Market Implications
Chapter 10 North America Telehealth Market Hotspots and Opportunities
- 10.1 Market Opportunity Mapping and Growth Hotspots
- 10.2 High-Growth Applications and Customer Groups
- 10.3 Underserved Markets and White-Space Opportunities
- 10.4 Emerging Technology and Product Opportunities
- 10.5 New Capacity and Investment Hotspots
- 10.6 Market Entry and Expansion Opportunities
- 10.7 Distribution and Partnership Opportunities
- 10.8 Near-Term and Long-Term Commercial Potential
- 10.9 Opportunity Attractiveness and Execution Risks
Chapter 11 North America Telehealth Market Outlook, 2025-2035
- 11.1 Market Size and Analysis
- 11.1.1 Revenue (Market Measurement: 2025: USD 37.99 billion → 2035: USD 194.69 billion)
- 11.1.2 Market Volume and Quantity Sold
- 11.1.3 Historical Market Size, 2018-2025
- 11.1.4 Base-Year Market Size, 2025
- 11.2 Market Forecast, 2025-2035
- 11.2.1 Revenue Forecast to 2035
- 11.2.2 Volume Forecast to 2035
- 11.2.3 CAGR and Year-on-Year Growth
- 11.2.4 Incremental Revenue Opportunity
- 11.3 Forecast Assumptions and Scenario Analysis
- 11.3.1 Base-Case Forecast
- 11.3.2 Optimistic and Conservative Scenarios
- 11.3.3 Technology, Pricing and Policy Sensitivities
- 11.4 Market Attractiveness and Growth Outlook
Chapter 12 North America Telehealth Market Segmentation and Outlook
- 12.1 Segmentation Summary and Market Shares, 2025
- 12.2 Largest and Fastest-Growing Segments
- 12.3 By Product Type - Market Size and Forecast, 2025-2035
- 12.3.1 Segment Definition and Scope
- 12.3.2 Historical Market Size, 2018-2025
- 12.3.3 Revenue Forecast, 2025-2035
- 12.3.4 Volume Forecast, 2025-2035
- 12.3.5 Base-Year Market Share, 2025
- 12.3.6 Segment CAGR and Growth Drivers
- 12.3.7 Subsegment Market Size and Forecast
- 12.3.7.1 Virtual Clinical Services
- 12.3.7.2 Remote Patient Monitoring
- 12.3.7.3 Telehealth Software
- 12.3.7.4 Telehealth Hardware
- 12.3.8 Subsegment Pricing and Adoption Trends
- 12.3.9 Leading Suppliers and Competition
- 12.3.10 Regional Demand and Opportunities
- 12.4 By Care Setting - Market Size and Forecast, 2025-2035
- 12.4.1 Segment Definition and Scope
- 12.4.2 Historical Market Size, 2018-2025
- 12.4.3 Revenue Forecast, 2025-2035
- 12.4.4 Volume Forecast, 2025-2035
- 12.4.5 Base-Year Market Share, 2025
- 12.4.6 Segment CAGR and Growth Drivers
- 12.4.7 Subsegment Market Size and Forecast
- 12.4.7.1 Home-Based Outpatient Care
- 12.4.7.2 Hospital-Based Acute Care
- 12.4.7.3 Community Clinic Care
- 12.4.7.4 Post-Acute Care
- 12.4.8 Subsegment Pricing and Adoption Trends
- 12.4.9 Leading Suppliers and Competition
- 12.4.10 Regional Demand and Opportunities
- 12.5 By Customer Type - Market Size and Forecast, 2025-2035
- 12.5.1 Segment Definition and Scope
- 12.5.2 Historical Market Size, 2018-2025
- 12.5.3 Revenue Forecast, 2025-2035
- 12.5.4 Volume Forecast, 2025-2035
- 12.5.5 Base-Year Market Share, 2025
- 12.5.6 Segment CAGR and Growth Drivers
- 12.5.7 Subsegment Market Size and Forecast
- 12.5.7.1 Employer and Payer Programs
- 12.5.7.2 Health Systems
- 12.5.7.3 Direct-Paying Patients
- 12.5.7.4 Independent Practices
- 12.5.8 Subsegment Pricing and Adoption Trends
- 12.5.9 Leading Suppliers and Competition
- 12.5.10 Regional Demand and Opportunities
- 12.6 By Disease Area - Market Size and Forecast, 2025-2035
- 12.6.1 Segment Definition and Scope
- 12.6.2 Historical Market Size, 2018-2025
- 12.6.3 Revenue Forecast, 2025-2035
- 12.6.4 Volume Forecast, 2025-2035
- 12.6.5 Base-Year Market Share, 2025
- 12.6.6 Segment CAGR and Growth Drivers
- 12.6.7 Subsegment Market Size and Forecast
- 12.6.7.1 Mental and Behavioural Health
- 12.6.7.2 Acute and Primary Care Conditions
- 12.6.7.3 Cardiometabolic Conditions
- 12.6.7.4 Specialty and Post-Acute Conditions
- 12.6.8 Subsegment Pricing and Adoption Trends
- 12.6.9 Leading Suppliers and Competition
- 12.6.10 Regional Demand and Opportunities
- 12.7 Segment Growth Comparison
- 12.8 Segment Attractiveness and Priority Matrix
Chapter 13 North America Telehealth End-Use and Application Market Outlook
- 13.1 End-Use Industry and Customer Demand Structure
- 13.2 Leading Applications and Customer Groups
- 13.3 End-Use Market Size, Share and Forecast
- 13.4 Major End-Use Industry Deep Dives
- 13.4.1 Customer Requirements and Use Cases
- 13.4.2 Demand and Replacement Cycles
- 13.4.3 Technical and Regulatory Considerations
- 13.4.4 Purchasing and Procurement Models
- 13.4.5 Leading Vendors and Distribution Channels
- 13.4.6 Forecast and Commercial Opportunities
- 13.5 Emerging Applications and Cross-Segment Demand
- 13.6 End-Use Industry Investment Priorities
Chapter 14 North America Telehealth Geographic Market Outlook, 2025-2035
- 14.1 Regional Market Size and Country-Level Shares, 2025
- 14.2 Country Market Size Comparison, 2025
- 14.3 Country Market Forecasts, 2025-2035
- 14.4 Subregional Industrial and Demand Clusters
- 14.5 Intra-Regional Pricing and Cost Differences
- 14.6 Cross-Border Trade and Supply Networks
- 14.7 Regional Supply and Demand Balances
- 14.8 Country Opportunity Comparison and Prioritization
Note: Every listed country is covered on the structure shown under the first country.
Chapter 15 North America Telehealth Technology, Innovation and Sustainability Outlook
- 15.1 Technology Landscape and Maturity
- 15.2 Product, Process and Service Innovation
- 15.3 AI, Automation and Digital Tools in the Industry
- 15.4 Technology Adoption and Performance Benchmarking
- 15.5 Innovation Pipeline and R&D Investment
- 15.6 Patent and Intellectual Property Trends
- 15.7 Energy Efficiency and Resource Management
- 15.8 Sustainability, Recycling and Circularity
- 15.9 Technology Roadmap, 2025-2035
- 15.10 Risks of Obsolescence and Technology Substitution
Chapter 16 North America Telehealth Market Key Strategic Imperatives
- 16.1 Growth and Market Entry Priorities
- 16.2 High-Return Products and Segments
- 16.3 Pricing, Profitability and Cost Optimization
- 16.4 Technology Investment and Product Differentiation
- 16.5 Supply Chain Localization and Resilience
- 16.6 Distribution and Customer Acquisition
- 16.7 Partnership, Acquisition and Capacity Strategy
- 16.8 Regional Expansion Priorities
- 16.9 Short-, Medium- and Long-Term Actions
Chapter 17 Competition Outlook
- 17.1 Industry Competition Characteristics
- 17.2 Market Structure and Concentration
- 17.3 Market Share and Competitive Positioning, 2025
- 17.4 Company-Wise Revenue and Product Benchmarking
- 17.5 Production and Service Capacity Benchmarking
- 17.6 Technology, Pricing and Differentiation
- 17.7 Regional Footprint and Distribution Strength
- 17.8 Mergers, Acquisitions and Strategic Alliances
- 17.9 New Entrants and Competitive Threats
- 17.10 Porter's Five Forces and Industry Attractiveness
- 17.11 Competitive Outlook, 2025-2035
Chapter 18 Company Profiles
- 18.1 Company Coverage and Selection Criteria
- 18.2 Teladoc Health
- 18.2.1 Business Description
- 18.2.2 Company Ownership and Geographic Presence
- 18.2.3 Product and Service Portfolio
- 18.2.4 Manufacturing and Operating Footprint
- 18.2.5 Production Capacity and Expansion Plans
- 18.2.6 Financial Performance and Investment
- 18.2.7 Market Share and Competitive Position
- 18.2.8 Technology and Innovation Capabilities
- 18.2.9 Strategic Alliances or Partnerships
- 18.2.10 Recent Developments
- 18.2.11 Growth Strategy and Outlook
- 18.3 Hims & Hers Health
- 18.4 TELUS Health
- 18.5 iRhythm Technologies
- 18.6 Lyra Health
- 18.7 Amwell
- 18.8 Included Health
- 18.9 Talkspace
- 18.10 MDLIVE
- 18.11 Omada Health
- 18.12 Other Relevant Market Participants
Note: Every listed company is profiled on the structure shown under the first company. The company list is preliminary and may change based on research findings, market developments, data availability and client requirements.
Chapter 19 Disclaimer
- 19.1 Research and Forecast Disclaimer
- 19.2 Data Source and Estimation Limitations
Note: The depth of individual sections depends on data availability for this market. Volume, capacity, trade and other unit-based metrics are included where applicable.

