
| REPORT ATTRIBUTE | DETAILS |
|---|---|
| Historical Period | 2019-2022 |
| Base Year | 2023 |
| Forecast Period | 2024-2032 |
| Artificial Sweetener Market Size 2023 | USD 5729.4 Million |
| Artificial Sweetener Market, CAGR | 6.10% |
| Artificial Sweetener Market Size 2032 | USD 9906.34 Million |
Market Overview
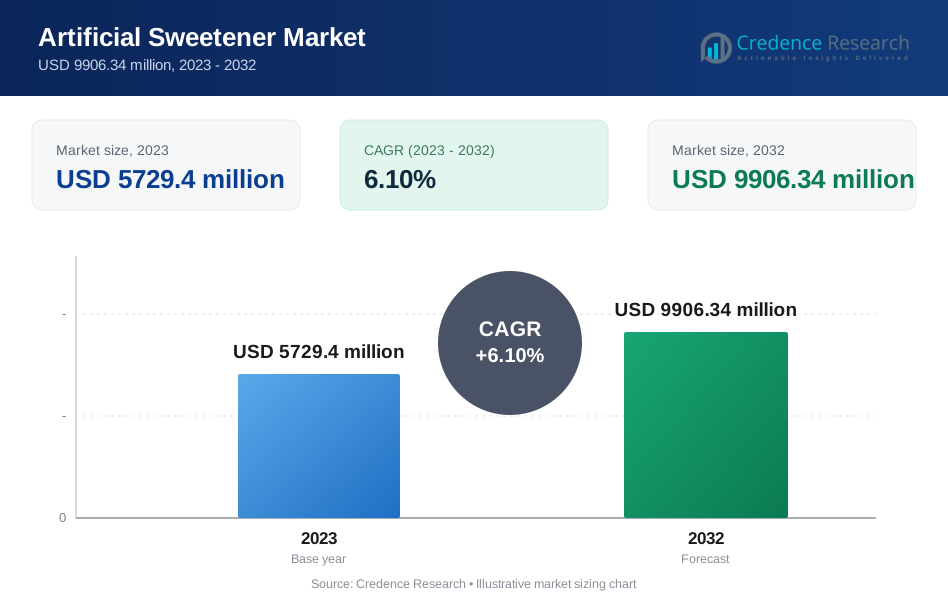
The artificial sweetener market is projected to grow from USD 5729.4 million in 2023 to USD 9906.34 million by 2032, expanding at a CAGR of 6.10%.
The artificial sweetener market is driven by increasing consumer awareness of health issues associated with sugar consumption, such as diabetes and obesity, prompting a shift towards low-calorie alternatives. Additionally, the growing demand for diet beverages and sugar-free food products fuels market expansion. Technological advancements in food processing and flavor enhancement also support the development of new and improved sweeteners. Furthermore, regulatory approvals for safe and effective artificial sweeteners are accelerating their adoption across various industries, reinforcing market growth. These trends indicate a robust outlook for the artificial sweetener sector in the coming years.
Geographically, the artificial sweetener market is dominated by North America due to its high prevalence among health-conscious consumers and stringent food safety regulations. Asia-Pacific is rapidly emerging as a significant market, driven by changing dietary habits and increasing consumer awareness about health and wellness in countries like China and India. Key players in the market include Cargill Incorporated, Tate & Lyle PLC, and Archer Daniels Midland Company, which are continuously innovating and expanding their product portfolios to meet diverse consumer needs globally. European markets also show strong growth, supported by favorable government policies regarding sugar alternatives.
Market Drivers
Rising Prevalence of Obesity and Diabetes
Globally, the increasing rates of obesity and diabetes are key drivers for the artificial sweetener market. For instance, as of 2022, 1 in 8 people in the world were living with obesity. Worldwide, adult obesity has more than doubled since 1990, and adolescent obesity has quadrupled. In the same year, 2.5 billion adults (18 years of age and older) were overweight. This prevalence has been rising more rapidly in low- and middle-income countries than in high-income countries. As populations grapple with these health challenges, artificial sweeteners offer a beneficial alternative for individuals seeking to manage their weight and blood sugar levels. This demographic’s expansion fuels robust demand for sugar-free alternatives, reinforcing the market’s growth trajectory.
Focus on Low-Calorie and Sugar-Free Products
Amid rising health consciousness, consumers are actively reducing their sugar intake. For instance, the World Health Organization recommends adults and children reduce their daily intake of free sugars to less than 10% of their total energy intake. In the U.S., the average daily intake of added sugars was 17 teaspoons for adults aged 20 and older in 2017–2018. This awareness is driving demand for low-calorie and sugar-free products. Food and beverage manufacturers are responding by incorporating artificial sweeteners into their offerings, thus propelling the market forward. These products cater not only to those with specific dietary needs but also to the general population aiming to maintain a healthier lifestyle.
Increased Awareness of Sugar's Negative Effects
Public awareness of the adverse health effects associated with excessive sugar consumption, including dental issues, heart disease, and certain cancers, is intensifying. For instance, studies have shown that excessive sugar consumption can lead to obesity, metabolic disorders, diabetes, cardiovascular disease, cancer, depression, and tooth decay. In the United States, the average adult consumes an estimated 17 teaspoons of added sugar each day, which accounts for 14% of total calorie intake in adults following a 2,000-calorie diet. Consequently, artificial sweeteners are increasingly viewed as a safer alternative to sugar, bolstering their acceptance and integration into daily consumption. This shift is supported by educational campaigns and health advisories that highlight the benefits of reducing sugar intake.
Innovation and Diverse Applications in the Market
Manufacturers are continuously innovating to develop new and improved artificial sweeteners that meet consumer expectations for taste and health. These advancements include creating sweeteners with fewer side effects and minimal aftertaste, which broadens their appeal and usage across various products. Beyond traditional applications in beverages and desserts, artificial sweeteners are now integral in sugar-free pharmaceuticals, tabletop products, and confectioneries, greatly extending their market reach. This versatility in applications, coupled with ongoing development in the sector, ensures sustained market expansion and diversity.
Market Trends
Natural Sweeteners Gaining Traction and Market Innovation
As the sugar substitute market evolves, a significant shift is noticeable, with natural sweeteners like stevia and monk fruit extract gaining traction. In 2023, honey dominated the market with a substantial share of 36.4%. Catering to consumers’ preferences for “natural” labeling, these sweeteners are perceived as healthier alternatives, thereby expanding their market footprint.
Concurrently, ongoing innovation is evident as manufacturers focus on reformulating artificial sweeteners for improved taste and functionality. Efforts include enhancing product profiles to reduce the aftertaste and developing functionalities suitable for various conditions, such as increased stability at high temperatures or incorporating slow-release mechanisms. For instance, in 2023, MycoTechnology extracted honey from a white honey truffle found in Hungary. These advancements are aimed at broadening consumer acceptance and extending application possibilities in the food and beverage sector. The food and beverage sector held the dominant market position, with a share of 40.2%, driven by high sugar consumption in various products.
Strategic Market Expansion and Consumer-Centric Developments
Market trends indeed emphasize increased transparency and the addressing of consumer concerns regarding the safety and composition of artificial sweeteners. For instance, manufacturers are prioritizing clear labeling and non-GMO certifications to build trust and cater to informed consumers. The Non-GMO Project Product Verification Program is North America’s most rigorous third-party verification for GMO avoidance.
Furthermore, there is a targeted approach to developing sweeteners that meet specific dietary needs. Artificial sweeteners are becoming popular alternatives to sugar for people seeking healthier dietary options. They are used for diabetes management, weight loss, and other dietary purposes. For instance, non-glycemic sweeteners for diabetics or options compatible with ketogenic diets are being developed, enhancing their applicability and appeal.
Expansion into new applications is another strategic focus. Artificial sweeteners are being explored for use in pharmaceuticals to mask bitterness or in personal care products like toothpaste and mouthwash. Additionally, as emerging markets show increased health consciousness and rising disposable incomes, manufacturers are poised to tap into these regions by offering affordable and health-aligned artificial sweetener solutions. The Asia-Pacific region, for instance, is witnessing a surge in demand for low-calorie sweeteners due to increasing health awareness, changing dietary preferences, and a rising middle-class population with higher disposable income.
Market Challenge Analysis
Persistent safety concerns and intense market competition
Despite obtaining safety clearances from various regulatory bodies, artificial sweeteners continue to face scrutiny over their long-term health effects. There are ongoing debates fueled by studies that hint at potential links between certain artificial sweeteners and health issues such as digestive disruptions, metabolic disorders, and even cancer risks, though these studies often present inconclusive results. Addressing these concerns demands a commitment to transparency and continued rigorous research to reassure consumers of their safety. Additionally, competition from natural sweeteners like stevia and monk fruit extract is intensifying. These natural alternatives are not only gaining favor due to their perceived health benefits but also often offer superior taste profiles, challenging artificial sweetener manufacturers to innovate and compete more effectively in this evolving market landscape.
Challenges of Overconsumption and Regulatory Landscapes
Artificial sweeteners, being significantly sweeter than sugar, pose a risk of overconsumption, which can counteract the benefits of calorie reduction by encouraging excessive intake of sweet products. This necessitates ongoing consumer education about proper portion control and the responsible use of sweeteners. Taste perception issues also persist, as some artificial sweeteners continue to be plagued by aftertastes or unpleasant mouthfeels, particularly in sensitive applications such as baked goods. Continuous improvements in taste profiles are essential to overcome these hurdles and expand their usability. Furthermore, navigating the complex regulatory environment across different countries adds another layer of challenge. Manufacturers must adapt and reformulate products to meet diverse international standards, complicating market expansion efforts. Additionally, the cost-effectiveness of artificial sweeteners, particularly when compared to sugar and certain natural alternatives, remains a significant barrier, especially in price-sensitive markets, highlighting the need for strategic pricing and value proposition adjustments to enhance market penetration and consumer adoption.
Market Segmentation Analysis:
By Product Type:
In the artificial sweetener market, segmentation by product type reveals a diverse landscape where several key products dominate. Aspartame, known for its sweetness and versatility, is extensively used in the food and beverage industry but faces scrutiny over health concerns, which may impact its market share. Acesulfame K, appreciated for its heat stability, is commonly incorporated in baking and diet soft drinks. Saccharin, one of the oldest artificial sweeteners, continues to be utilized due to its cost-effectiveness, despite varying consumer perceptions regarding its taste. Sucralose, favored for having no aftertaste, is widely adopted in various food products and health-focused beverages. Neotame, the newest and most potent among them, is gaining traction due to its minimal required usage and strong safety profile. Each sweetener’s market share is shaped by its unique properties, including taste, perceived safety, and application versatility.
By End-User:
The artificial sweetener market also segments distinctly based on end-user applications. The food and beverage sector is the largest consumer, deploying these sweeteners in products ranging from diet sodas to low-calorie desserts, driven by growing consumer demand for healthier dietary choices. The pharmaceutical sector leverages these compounds primarily to enhance the palatability of oral medications without increasing caloric content, benefiting diabetic or calorie-conscious consumers. Direct sales to consumers who seek to manage their dietary intake through cooking and home-prepared beverages also represent a significant segment, reflecting a growing trend toward health-aware lifestyles. Other end users include sectors like food service and personal care, where artificial sweeteners are added to improve taste profiles without adding caloric value, expanding the market reach beyond traditional sectors. Each of these segments contributes distinctly to the overall market dynamics, influenced by consumer health awareness and industry-specific demands.
Segments:
Based on product type:
- Aspartame
- Acesulfame K
- Saccharin
- Sucralose
- Neotame
Based on End-User:
- Food and Beverages
- Pharmaceuticals
- Direct Sales
- Other End Users
Based on the application:
- Bakery Goods
- Sweet Spreads
- Confectionery and Chewing Gums
- Beverages
- Dairy Products
- Other Applications
Based on the geography:
- North America
- The U.S.
- Canada
- Mexico
- Europe
- Germany
- France
- The U.K.
- Italy
- Spain
- Rest of Europe
- Asia Pacific
- China
- Japan
- India
- South Korea
- South-east Asia
- Rest of Asia Pacific
- Latin America
- Brazil
- Argentina
- Rest of Latin America
- Middle East & Africa
- GCC Countries
- South Africa
- Rest of the Middle East and Africa
Regional Analysis
Asia-Pacific
Asia-Pacific accounts for nearly 20% of the global market share, representing a rapidly growing region. The increasing prevalence of lifestyle-related diseases, such as diabetes and obesity, coupled with rising disposable incomes and the influence of Western dietary trends, has driven the demand for artificial sweeteners in countries like China, India, and Japan. Additionally, the region's expanding food and beverage industry is expected to further bolster market growth in the coming years.
Europe
Europe closely follows, holding approximately 30% of the global artificial sweetener market share. The region's demand is fueled by factors such as rising awareness of the negative impacts of excess sugar consumption, government initiatives to promote healthy lifestyles, and the increasing popularity of sugar-free and low-calorie products. Countries like Germany, the United Kingdom, and France are key contributors to the region's market growth, with stringent regulations governing the use of artificial sweeteners.
Key Player Analysis
- Tate & Lyle PLC
- DuPont
- Cargill, Incorporated
- Ajinomoto Co., Inc.
- Archer Daniels Midland Company
- Nestlé S.A.
- Wilmar International Limited
- Ingredion Incorporated
- Roquette Freres
- JK Sucralose
Competitive Analysis
In the competitive landscape of the artificial sweetener market, leading players are strategically positioning themselves through innovation, expansion, and collaboration. Tate & Lyle PLC and DuPont stand out for their robust product development and focus on healthier sweetening solutions. Cargill, Incorporated, emphasizes sustainable and transparent production processes, catering to the rising consumer demand for ethical sourcing. Ajinomoto Co., Inc. leverages its expertise in amino acids to enhance sweetener profiles, while Archer Daniels Midland Company diversifies its offerings across various food and beverage sectors. Nestlé S.A. integrates artificial sweeteners into its vast array of consumer products, focusing on reduced-sugar options. Wilmar International Limited and Ingredion Incorporated capitalize on their strong regional presences to expand their market share. Roquette Freres and J.K. Sucralose focus on specialized sweetening solutions, targeting niche markets with high-purity products. These companies drive the market through a combination of innovation, customer-centric solutions, and strategic global networks.
Recent Developments
In July 2023, Tate & Lyle PLC, one of the world leaders in ingredient solutions, launched TASTEVA SOL stevia sweetener. The new product helps meet consumer demand for clean-label ingredients.
In March 2023, Tate & Lyle (UK) partnered with IMCD (Belgium) in Brazil, enhancing its distribution of sweeteners, fibers, starches, and stabilizing solutions. This expansion strengthened Tate & Lyle’s (UK) presence and accessibility in the Brazilian sweeteners market, fostering growth and market reach.
In August 2022, International Flavors & Fragrances Inc. (US) opened its new Nourish Innovation Lab in New Jersey, US, specifically for R&D in the food and beverage market. This would help the company launch new products in various categories, including sweeteners.
Market Concentration and Characteristics
The artificial sweetener market exhibits a moderate to high level of market concentration, characterized by the presence of a few dominant global players who control a significant share of the market. These leading companies, such as Tate & Lyle PLC, DuPont, and Cargill, Incorporated, leverage their extensive research and development capabilities, comprehensive product portfolios, and robust distribution networks to maintain and expand their market presence. This concentration is further intensified by the high entry barriers due to stringent regulatory standards and the substantial capital required for establishing manufacturing capabilities and securing approval for new products. Moreover, the market is characterized by intense competition among established players, who are continually engaged in innovation and strategic partnerships to develop newer, healthier, and more efficient sweetening solutions. These dynamics ensure that the market remains competitive, with constant improvements in product offerings to meet evolving consumer preferences and regulatory requirements.
Report Coverage
The research report offers an in-depth analysis based on product type, end-user, application, and geography. It details leading market players, providing an overview of their business, product offerings, investments, revenue streams, and key applications. Additionally, the report includes insights into the competitive environment, SWOT analysis, current market trends, as well as the primary drivers and constraints. Furthermore, it discusses various factors that have driven market expansion in recent years. The report also explores market dynamics, regulatory scenarios, and technological advancements that are shaping the industry. It assesses the impact of external factors and global economic changes on market growth. Lastly, it provides strategic recommendations for new entrants and established companies to navigate the complexities of the market.
Future Outlook
- Growth in the artificial sweetener market will continue, driven by rising health awareness and consumer demand for low-calorie, sugar-free products.
- Technological advancements will enable the development of newer, more natural-tasting sweeteners with fewer side effects.
- Regulatory changes will shape market dynamics, potentially easing entry barriers or tightening safety evaluations for new products.
- Expansion into emerging markets is expected as companies target growing middle-class populations in Asia, Africa, and South America.
- Natural sweeteners like stevia and monk fruit will increasingly compete with artificial sweeteners, influencing product innovation.
- The food and beverage industry will remain the largest end-user, with increased applications in diet and health-specific products.
- E-commerce and direct-to-consumer sales channels will gain traction, facilitated by digital marketing and consumer data analytics.
- Consumer demand for transparency and clean labels will push manufacturers to provide more detailed product information and reformulate products with simpler ingredients.
- Sustainability concerns will prompt manufacturers to invest in environmentally friendly production processes.
- The pharmaceutical sector will increasingly use artificial sweeteners in formulations to improve the palatability of medications, expanding the market’s scope beyond food and beverages.
Request a Free Sample
Fill in your details and we'll send you a free sample report.
- Sample data tables & charts
- Research methodology
Need a Custom Version of This Report?
Tailor the scope, geography, or segments to your exact requirements.
- Custom geography or segment scope
- Direct access to our analyst team
Frequently Asked Questions
What is the current size of the artificial sweetener market?
What factors are driving the growth of the artificial sweetener market?
What are the key segments within the artificial sweetener market?
What are some challenges faced by the artificial sweetener market?
Who are the major players in the artificial sweetener market?
Table of Content
Chapter 1. Report Introduction
- 1.1 Report Description & Purpose
- 1.1.1 Report Title & Market Definition
- 1.1.2 Unique Selling Propositions (USP) & Key Differentiators
- 1.1.3 Value Proposition for Stakeholders
- 1.2 Research Objectives
- 1.2.1 Market Sizing Objectives (Volume & Revenue)
- 1.2.2 Segmentation Objectives
- 1.2.3 Competitive Intelligence Objectives
- 1.2.4 Forecast & Scenario Objectives
- 1.3 Report Scope
- 1.3.1 Artificial Sweetener Scope – Types & Subtypes Covered
- 1.3.2 Geographic Scope – Regions & Countries Covered
- 1.3.3 Historical Period, Base Year & Forecast Period (2023; forecast to 2032)
- 1.3.4 Inclusions & Exclusions
- 1.4 HS Code & Classification Framework
- 1.5 Currency, Units & Pricing Basis
- 1.6 Target Stakeholders
- 1.7 Limitations & Assumptions
Chapter 2. Executive Summary
- 2.1 Global Artificial Sweetener Market Snapshot
- 2.1.1 Market Size – Historical (2023) & Forecast (2023-2032) (2023: USD 5729.4 million → 2032: USD 9906.34 million)
- 2.1.2 Volume & Revenue – Global Totals
- 2.1.3 Key Market Highlights – Top Five Facts
- 2.2 Artificial Sweetener Market Segmentation Snapshot
- 2.2.1 Market Split by Region – 2023 vs. 2032
- 2.3 Competitive Snapshot
- 2.3.1 Top 10 Players by Revenue Share – 2023
- 2.3.2 Top 10 Players by Volume Share – 2023
- 2.3.3 Recent Strategic Developments (18-Month Summary)
- 2.4 Key Investment Highlights & Strategic Conclusions
Chapter 3. Artificial Sweetener Market Dynamics & Industry Analysis
- 3.1 Market Overview & Context
- 3.1.1 Artificial Sweetener Market Position in the Broader Automotive Value Chain
- 3.1.2 OEM vs. Replacement Market Dynamics
- 3.1.3 Market Maturity & Development Stage by Region
- 3.2 Artificial Sweetener Market Drivers
- 3.3 Artificial Sweetener Market Restraints & Challenges
- 3.4 Artificial Sweetener Market Opportunities
- 3.5 Porter's Five Forces Analysis
- 3.5.1 Threat of New Entrants
- 3.5.2 Bargaining Power of Suppliers
- 3.5.3 Bargaining Power of Buyers
- 3.5.4 Threat of Substitutes
- 3.5.5 Competitive Rivalry – Intensity Assessment
- 3.6 Artificial Sweetener Value Chain Analysis
- 3.6.1 Upstream – Raw Material/Input Suppliers
- 3.6.1.1 Raw Material/Input 1
- 3.6.1.2 Raw Material/Input 2
- 3.6.1.3 Raw Material/Input 3
- 3.6.2 Midstream – Production/Manufacturing/Service Delivery
- 3.6.2.1 Production/Process Overview
- 3.6.2.2 Key Facility Locations & Capacity by Manufacturer
- 3.6.3 Downstream – Distribution & End Consumer
- 3.6.3.1 Primary Channel – B2B/OEM
- 3.6.3.2 Secondary Channels – Dealer, Retail, Online, Direct
- 3.6.4 Value Chain Profitability Analysis
- 3.6.1 Upstream – Raw Material/Input Suppliers
- 3.7 PESTEL Analysis
- 3.7.1 Political Factors
- 3.7.2 Economic Factors
- 3.7.3 Social Factors
- 3.7.4 Technological Factors
- 3.7.5 Environmental Factors
- 3.7.6 Legal Factors
- 3.8 Artificial Sweetener Supply Chain Analysis
- 3.8.1 Raw Material/Input Supply Risk Assessment
- 3.8.2 Manufacturing Concentration Risk (Geographic Exposure)
- 3.8.3 Trade Disruption Impact Analysis
- 3.9 Regulatory & Policy Landscape
Note: The regulatory and policy landscape section covers regulations based on their applicability to the market, Artificial Sweetener category, geography, and scope of the study. Only regulatory frameworks with a material impact on operations, compliance, trade, sustainability, or market access are analyzed in detail.
Chapter 4. Key Investment Pockets & Opportunity Analysis
- 4.1 Artificial Sweetener Market Attractiveness Analysis
- 4.1.1 By Region – Investment Attractiveness Matrix (Volume × CAGR)
- 4.2 Absolute Revenue Growth Opportunity
- 4.2.1 By Region – Absolute USD Growth Through 2032
- 4.3 Incremental Volume Opportunity
- 4.3.1 By Region – Incremental Volume Through 2032
- 4.3.2 Segment – Incremental Volume
- 4.4 Emerging Submarket Opportunity Deep Dive (Subject to Applicability)
- 4.5 Emerging Market Opportunity Scorecards
- 4.5.1 United States
- 4.5.2 Europe
- 4.5.3 Asia
- 4.5.4 Middle East & Africa
Note: Emerging Market Opportunity Scorecards will be included based on relevance and strategic importance. Regions listed are indicative and may vary depending on data availability and market dynamics.
Chapter 5. Artificial Sweetener Import-Export Analysis & Trade Flows
- 5.1 Global Trade Overview
- 5.1.1 Global Export Value by Country (2023)
- 5.1.2 Global Export Volume by Country (2023)
- 5.1.3 Global Import Value by Country (2023)
- 5.1.4 Global Import Volume by Country (2023)
- 5.1.5 Net Trade Balance by Country (2023)
- 5.2 Export Analysis – Segment
- 5.2.1 Type 1 (HS Code)
- 5.2.2 Type 2 (HS Code)
- 5.2.3 Type 3 (HS Code)
- 5.2.4 Type 4 (HS Code)
- 5.2.5 Type 5 (HS Code)
- 5.3 Import Analysis – Segment
- 5.3.1 Type 1 (HS Code)
- 5.3.2 Type 2 (HS Code)
- 5.3.3 Type 3 (HS Code)
- 5.3.4 Type 4 (HS Code)
- 5.3.5 Type 5 (HS Code)
- 5.4 Average Unit Trade Prices
- 5.4.1 Average Export Price – Segment & Country
- 5.4.2 Average Import Price – Segment & Source Country
- 5.4.3 Price Trends (2023)
- 5.5 Key Trade Route Analysis
- 5.5.1 Trade Route 1
- 5.5.2 Trade Route 2
- 5.5.3 Trade Route 3
- 5.5.4 Trade Route 4
- 5.5.5 Trade Route 5
- 5.6 Trade Policy Impact Assessment
- 5.6.1 US Anti-Dumping & Section 301 Tariffs
- 5.6.2 EU Customs Union Impact
- 5.6.3 Major Free Trade Agreements
- 5.6.4 USMCA Rules of Origin
Note: Trade policy analysis will be included only where relevant to the Artificial Sweetener market.
Chapter 6. Competitive Landscape & Company Benchmarking
- 6.1 Artificial Sweetener Market Concentration & Structure
- 6.1.1 Herfindahl-Hirschman Index (HHI) – vs. 2023
- 6.1.2 Tier 1, Tier 2 & Tier 3 Market Structure
- 6.1.3 Global, Regional & Local Player Dynamics
- 6.2 Artificial Sweetener Market Share Analysis – 2023
- 6.2.1 Global Revenue Share by Company
- 6.2.2 Global Volume Share by Company
- 6.2.3 Regional Revenue Share
- 6.2.4 Market Share Evolution ( vs. 2023)
- 6.2.5 OEM Segment Share by Company
- 6.2.6 Replacement Segment Share by Company
- 6.3 Production/Delivery Capacity & Facility Analysis
- 6.3.1 Global Installed Capacity
- 6.3.2 Capacity Utilization Rates
- 6.3.3 Production/Output Volume
- 6.3.4 Facility Locations & Capacity Map
- 6.3.5 Planned Capacity Additions
- 6.4 Artificial Sweetener Competitive Benchmarking Matrix
- 6.4.1 Revenue, Volume, CAGR & Profitability Comparison
- 6.4.2 Channel Revenue Mix
- 6.4.3 Geographic Revenue Exposure
- 6.4.4 R&D Intensity
- 6.4.5 Sustainability Maturity
- 6.5 Strategic Developments in Artificial Sweetener (Last 24 Months)
- 6.5.1 Mergers, Acquisitions & Divestments
- 6.5.2 New Artificial Sweetener Launches
- 6.5.3 Facility Expansions
- 6.5.4 Strategic Alliances, Joint Ventures & Partnerships
- 6.5.5 Distribution Expansion & Market Entry
- 6.5.6 Sustainability & ESG Initiatives
- 6.6 Competitive Strategy Mapping
- 6.6.1 Leader, Challenger, Follower & Niche Classification
- 6.6.2 Pricing Strategy Comparison
- 6.6.3 Channel Strategy Matrix
Note: Strategic developments are included based on their materiality and the availability of reliable information.
Chapter 7. Global Artificial Sweetener Market – By Distribution Channel
- 7.1 Segment Overview
- 7.1.1 Volume & Revenue Split by Channel (2023 & 2032)
- 7.1.2 Channel Mix Evolution (2023-2032)
Chapter 8. Regional Market Analysis – Global Overview
- 8.1 Global Regional Overview
- 8.1.1 Regional Volume Share
- 8.1.2 Regional Revenue Share
- 8.1.3 Regional Volume by Region
- 8.1.4 Regional Revenue by Region
- 8.1.5 Regional Forecast Through 2032
- 8.2 Cross-Regional Segment Analysis
- 8.2.1 By Distribution Channel
- 8.2.2 By Brand/Price Tier
Chapter 9. North America Artificial Sweetener Market
- 9.1 United States
- 9.2 Canada
- 9.3 Mexico
Chapter 10. Europe Artificial Sweetener Market
- 10.1 Germany
- 10.2 France
- 10.3 Italy
- 10.4 United Kingdom
- 10.5 Spain
- 10.6 Poland
- 10.7 Russia
- 10.8 Netherlands
- 10.9 Belgium
- 10.10 Sweden
- 10.11 Denmark
- 10.12 Norway
- 10.13 Rest of Europe
Chapter 11. Asia Pacific Artificial Sweetener Market
- 11.1 China
- 11.2 India
- 11.3 Japan
- 11.4 South Korea
- 11.5 Thailand
- 11.6 Indonesia
- 11.7 Vietnam
- 11.8 Malaysia
- 11.9 Australia
- 11.10 Rest of Asia Pacific
Chapter 12. Latin America Artificial Sweetener Market
- 12.1 Brazil
- 12.2 Argentina
- 12.3 Colombia
- 12.4 Chile
- 12.5 Rest of Latin America
Chapter 13. Middle East Artificial Sweetener Market
- 13.1 Saudi Arabia
- 13.2 United Arab Emirates
- 13.3 Turkey
- 13.4 Israel
- 13.5 Iran
- 13.6 Rest of the Middle East
Chapter 14. Africa Artificial Sweetener Market
- 14.1 South Africa
- 14.2 Egypt
- 14.3 Nigeria
- 14.4 Morocco
- 14.5 Rest of Africa
Chapter 15. Artificial Sweetener Company Profiles
- 15.1 [Company 01]
- 15.1.1 Company Overview
- 15.1.2 Key Management Personnel
- 15.1.3 Products & Services Portfolio
- 15.1.4 Financial Performance
- 15.1.5 Key Market Focus & Geographic Presence
- 15.1.6 Recent Developments & Strategic Initiatives
Note: The company profile list is preliminary and may change based on research findings, market developments, data availability, and client requirements.
Chapter 16. Appendices
- Appendix A – List of Abbreviations & Acronyms
- Appendix B – Industry Classification Code Reference – Full Series
- Appendix C – Production & Capacity Data Tables
- Appendix D – End-Use & Demand Base Tables
- Appendix E – Consumption & Replacement Rate Assumptions
- Appendix F – ASP Reference Tables
- Appendix G – Manufacturing & Facility Database
- Appendix H – Import-Export Data Tables
- Appendix I – Regulatory Summary Tables
- Appendix J – Primary Research Participant List (Anonymized)
- Appendix K – Primary Research Questionnaire Framework
- Appendix L – Data Sources & Bibliography
- Appendix M – Market Size Divergence & Source Comparison
Chapter 17. Research Methodology
- 17.1 Research Framework & Philosophy
- 17.2 Secondary Research – Sources, Hierarchy & Data Extraction
- 17.3 Data Modeling – Bottom-Up & Top-Down Market Sizing
- 17.4 Primary Research – Stakeholder Framework, LOI & Sample Sizes
- 17.5 Forecast Methodology – Regression, Scenario & Sensitivity Analysis
- 17.6 Quality Control – Four-Layer Validation Framework
- 17.7 Limitations & Standard Assumptions
- 17.8 Disclaimer
