
Public tenders turn city fleets toward battery buses
The India electric bus market was valued at USD 1.02 billion in 2025 and is projected to increase from USD 1.40 billion in 2026 to USD 6.64 billion by 2035, registering a CAGR of 18.90% during 2026–2035. Demand comes from state transport undertakings and city transit agencies that lease battery buses from private operators, from airports and corporate campuses that run staff shuttles, and from intercity operators adding sleeper coaches. South India held the largest regional share, 32.2% in 2025, because Bengaluru, Hyderabad and Chennai combine large city fleets with nearby bus plants. East and Northeast India is the fastest-growing region at 19.67% a year, as smaller cities in eastern and hill states join the federal bus schemes. Procurement has also changed, because a central agency now pools orders for the largest cities and pays operators a fixed fee per kilometer. As a result, operators with financing and depot charging skills win most new contracts.
What does the estimate count, from midi city buses to sleeper coaches?
The estimate measures the value of new battery electric and fuel cell electric buses sold in India, from 7-meter feeder buses to 13.5-meter intercity coaches. Values are stated at the vehicle prices that operators, transport undertakings, city agencies, schools and corporate fleets pay through aggregated tenders, gross cost contracts, direct orders and dealers.
The estimate excludes depot chargers, grid connections, operating and maintenance fees, used buses and exports of finished buses. The value chain runs from cell, battery pack, motor and chassis suppliers through bus makers and body builders to fleet operators, and onward to transit agencies that pay for each kilometer of service.
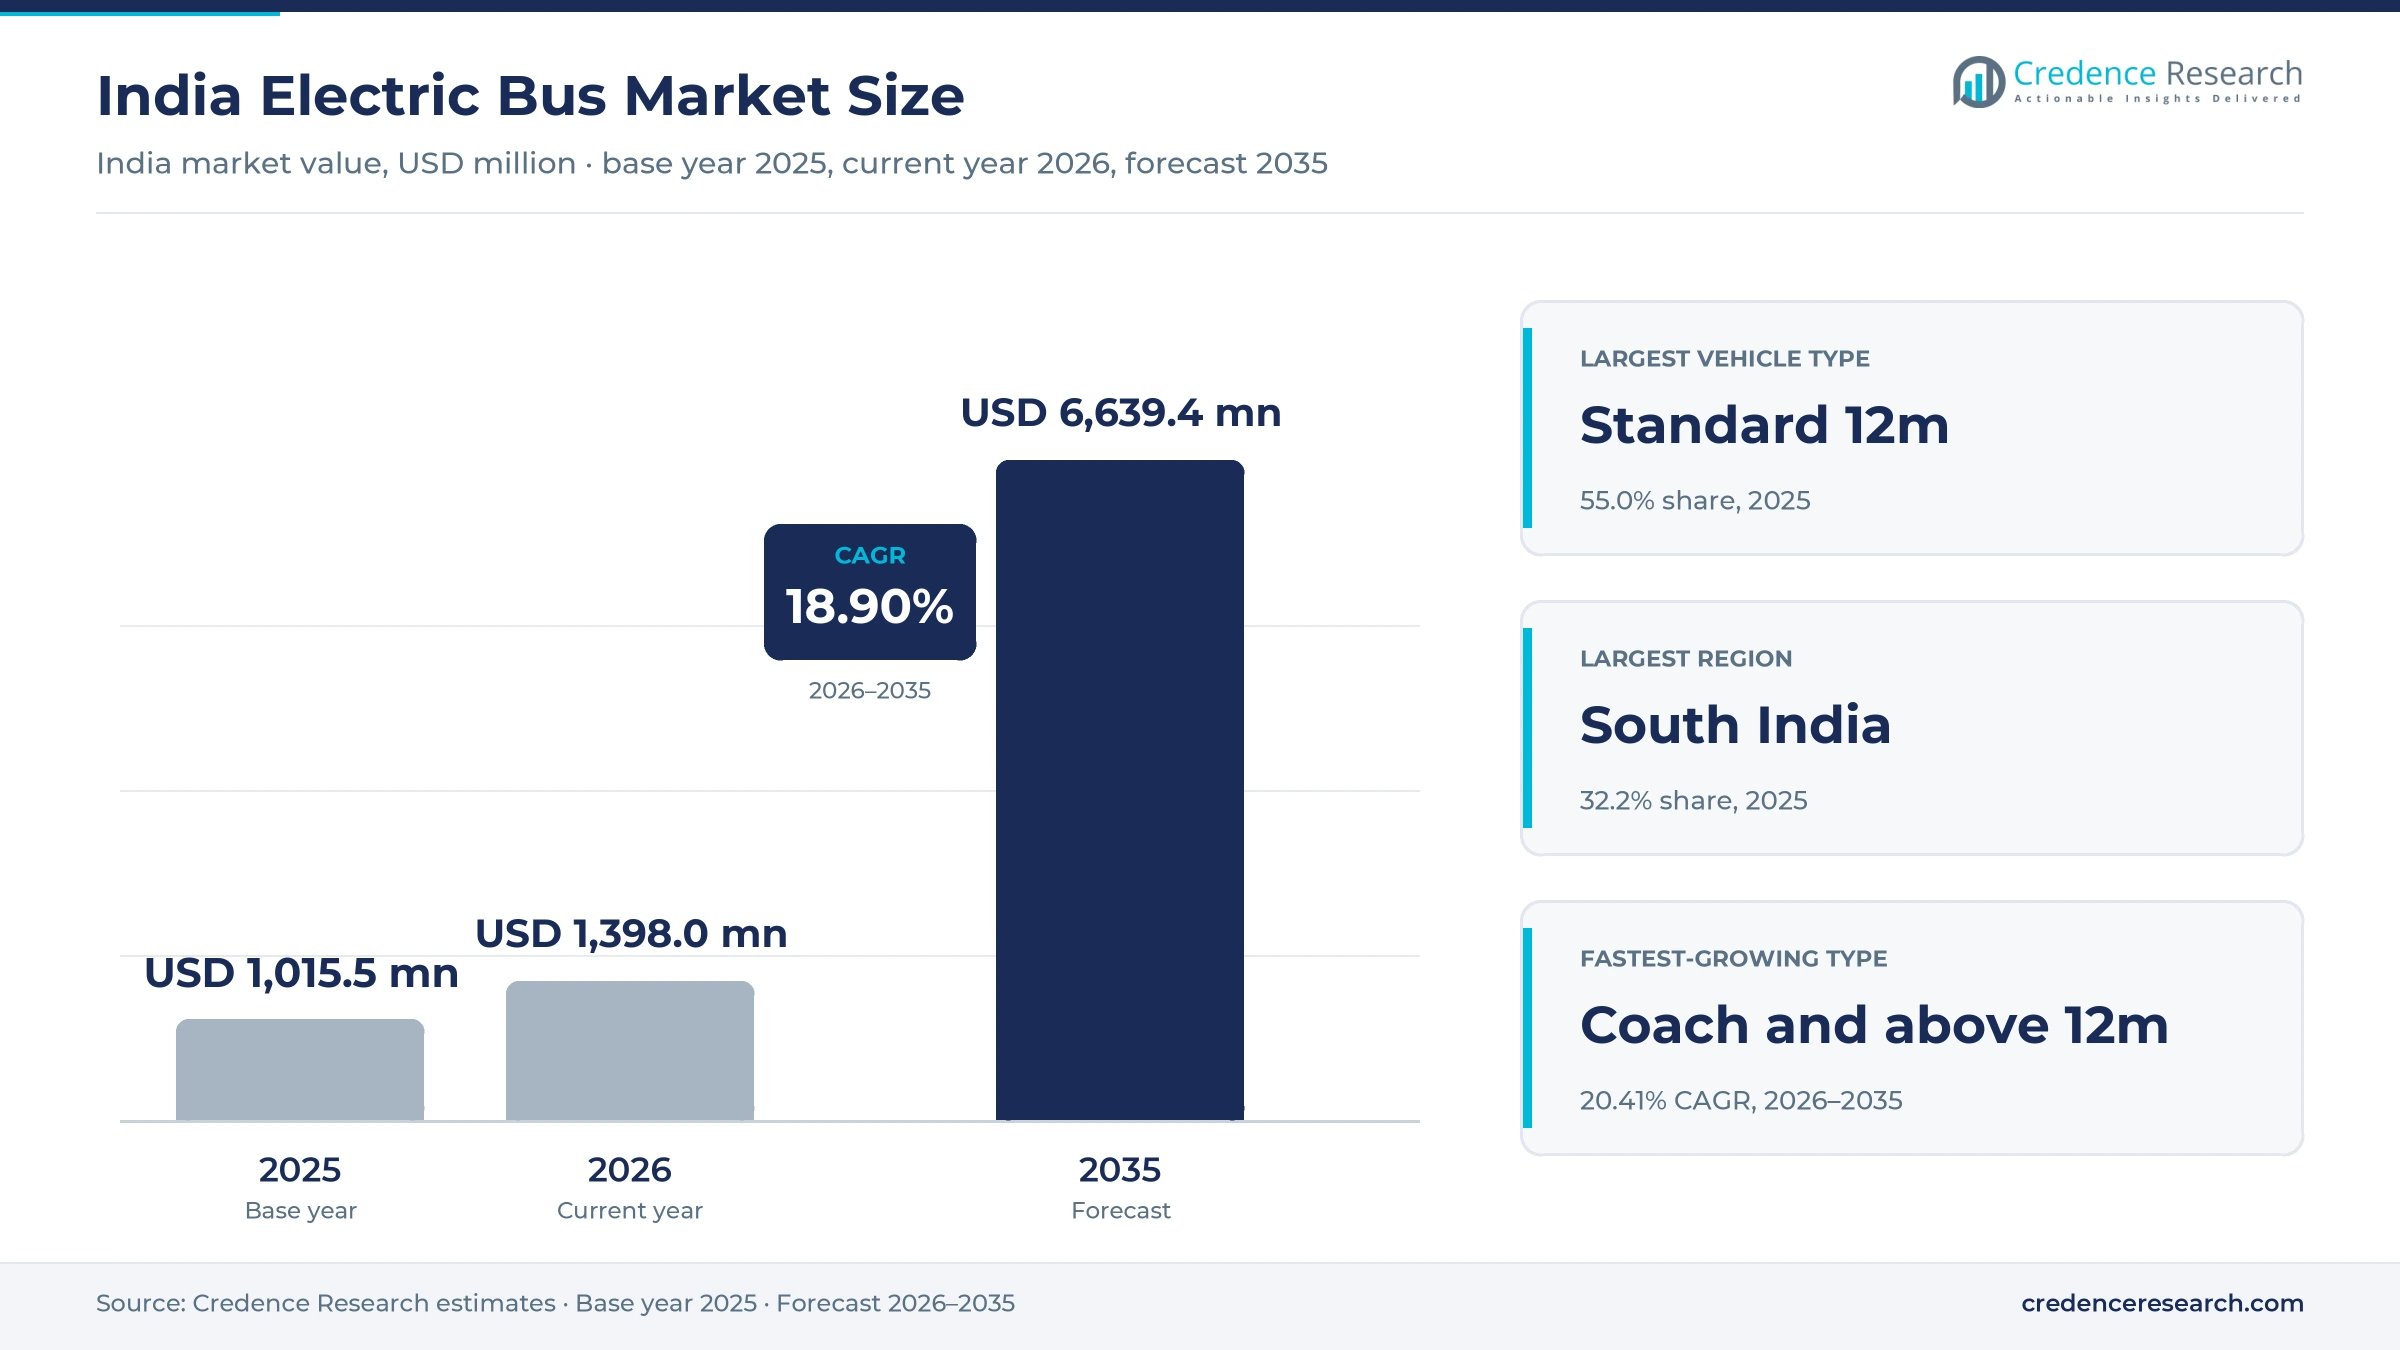
India Electric Bus Market Insights
- The India electric bus market was valued at USD 1.02 billion in 2025 and is projected to reach USD 6.64 billion by 2035, registering a CAGR of 18.90% during 2026–2035.
- South India held a 32.2% share of 2025 value, because Bengaluru and Hyderabad received the largest allocations in the first national bus tender.
- Standard 12m buses led with a 55.0% share of 2025 value, because trunk city routes and state transport depots favor full-size buses.
- Electric bus registrations in India rose to 4,441 units in 2025 from 3,730 in 2024, as PMI, Olectra and Switch delivered large city orders.
- Convergence Energy Services Limited concluded tenders for 10,900 battery buses in December 2025, the largest pooled bus purchase in the country.
Standard 12m buses lead as coaches grow fastest
Why do standard 12m buses lead vehicle demand?
Based on vehicle type, the market is categorized into mini and midi 7-8m, standard 9m, standard 12m, and coach and above 12m buses. Standard 12m buses led with a 55.0% share of 2025 value, because trunk city routes and state depots favor full-size buses with high seating capacity. Coach and Above 12m buses grow fastest at 20.41% a year, as intercity sleeper and seater operators electrify long routes.
How far does depot charging dominate powertrain choice?
Based on powertrain, the market is categorized into depot-charged battery electric, opportunity-charged battery electric and fuel cell electric buses. Depot-Charged Battery Electric buses led with 88.0% of 2025 value, because most city contracts include overnight charging at depots built by the operator. Fuel Cell Electric buses grow fastest at 23.37% a year, as hydrogen pilots move from trial runs toward small fleets.
Which buyers account for the largest bus volumes?
Based on customer type, the market is categorized into state transport undertakings, municipal transit agencies, private stage carriage operators, and institutional and corporate fleets. State Transport Undertakings led with 40.0% of 2025 value, because state corporations run the largest fleets and receive most federal support. Private Stage Carriage Operators grow fastest at 20.07% a year, as private intercity brands add battery coaches on busy corridors.
How do gross cost contracts shape the sales channel mix?
Based on sales channel, the market is categorized into government aggregated tenders, direct OEM fleet sales, GCC operator procurement and dealer and specialized distributor sales. GCC Operator Procurement led with 42.0% of 2025 value, because operators buy the buses they run under long gross cost contracts. Dealer and Specialized Distributor Sales grow fastest at 19.74% a year, as schools, campuses and smaller operators begin buying battery buses through dealers.
| Segment Group | Leading Sub-segment | Share, 2025 | Fastest-growing Sub-segment | CAGR, 2026–2035 |
|---|---|---|---|---|
| By Vehicle Type | Standard 12m | 55.0% | Coach and Above 12m | 20.41% |
| By Powertrain | Depot-Charged Battery Electric | 88.0% | Fuel Cell Electric | 23.37% |
| By Customer Type | State Transport Undertakings | 40.0% | Private Stage Carriage Operators | 20.07% |
| By Sales Channel | GCC Operator Procurement | 42.0% | Dealer and Specialized Distributor Sales | 19.74% |
Request a Free Sample
Fill in your details and we'll send you a free sample report.
- Sample data tables & charts
- Research methodology
Federal schemes, lower running costs and local plants
How do national schemes create fleet procurement at scale?
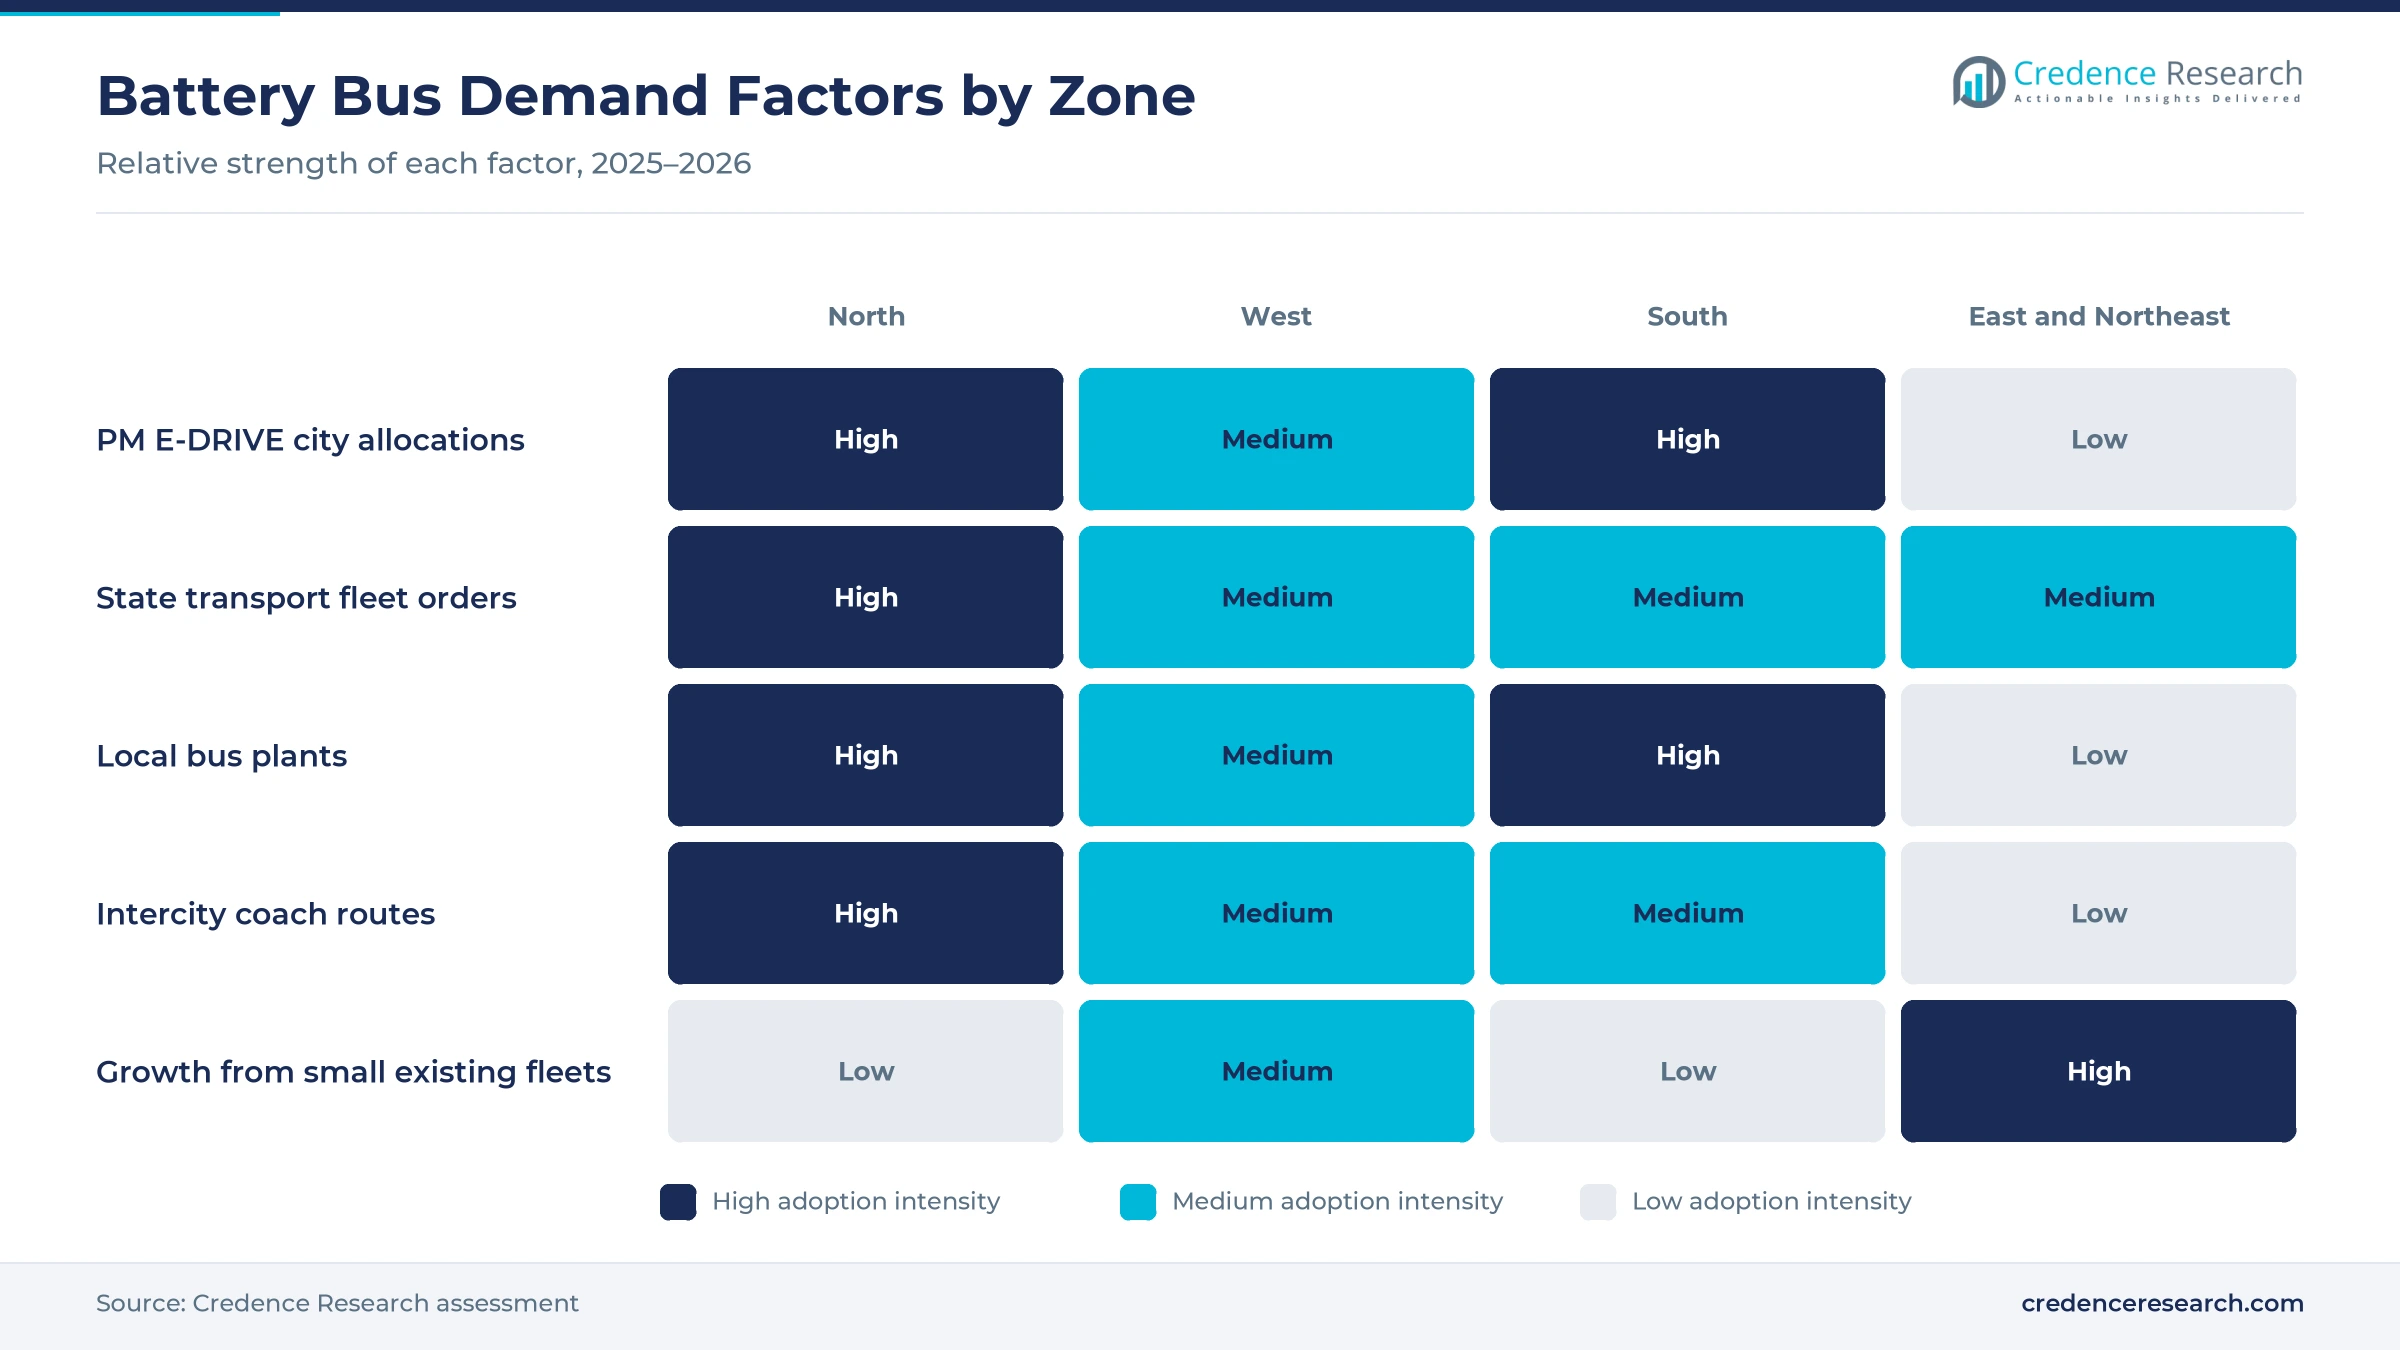
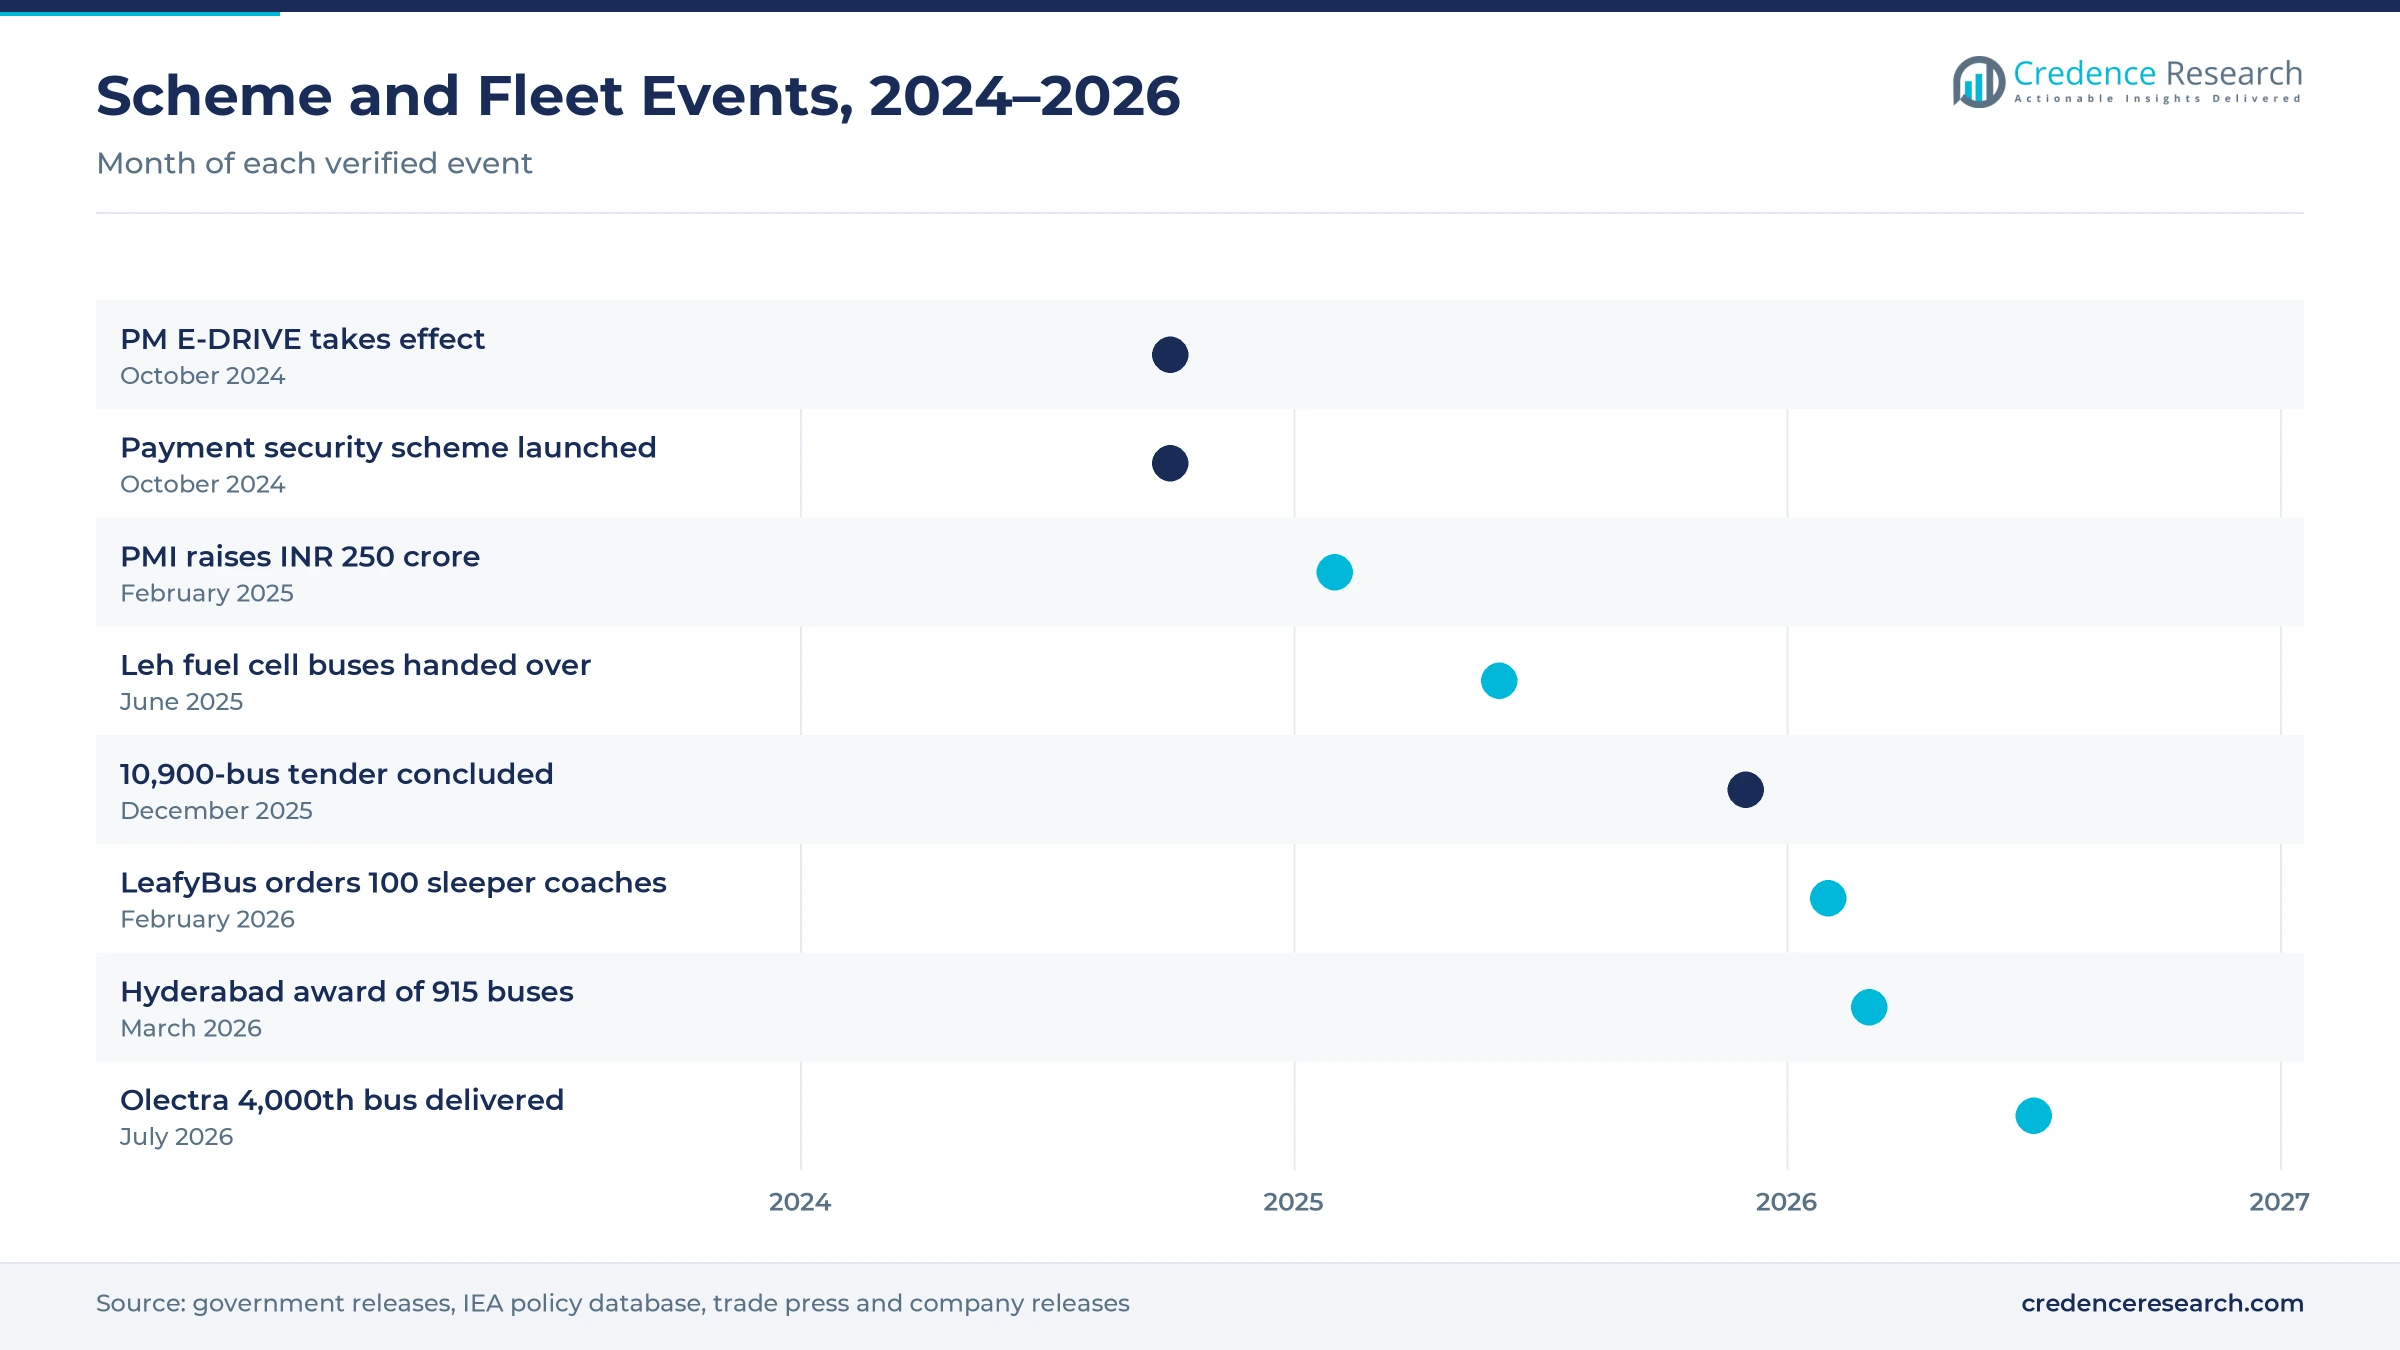
Federal schemes now fund battery buses in large, predictable batches, which gives bus makers the order visibility to plan plant output. The Union Cabinet approved PM-eBus Sewa on Aug. 16, 2023, with 10,000 buses for 169 cities, an estimated cost of INR 57,613 crore and INR 20,000 crore of central support, according to the Press Information Bureau. PM E-DRIVE then set aside INR 4,391 crore for 14,028 buses in nine cities with more than 4 million people, according to the Prime Minister's Office. Convergence Energy Services Limited concluded tenders for 10,900 of those buses in December 2025, with 14 technically qualified bidders. As a result, standard 12m buses, which made up most of the tendered volume, led vehicle types with 55.0% of 2025 value.
Why do lower running costs improve lifecycle economics?
Battery buses cost more to buy than diesel buses, but lower energy and maintenance costs over a 10- to 12-year contract make the per-kilometer price competitive for transit agencies. Gross cost contracts let cities pay a fixed fee per kilometer, so the operator carries the upfront cost and earns it back over the contract. In the second PM E-DRIVE round, Sai Green Projects bid INR 55.55 per km for non-AC 9m buses in Pune, while GreenCell Mobility won 1,050 AC buses in Mumbai at INR 60.25 per km, according to electrive. Tata Motors buses in Bengaluru have also logged more than 60 million kilometers under a 12-year agreement. In turn, GCC operator procurement led channels with 42.0% of 2025 value.
How do domestic plants and supplier competition widen supply?
India now has several bus makers with large local plants, which shortens delivery times and keeps tender prices competitive. Registrations rose to 4,441 units in 2025 from 3,730 in 2024, with PMI at 1,041, Olectra at 990 and Switch at 950, according to Sustainable Bus analysis of Vahan data. JBM Ecolife runs a Delhi-NCR facility with capacity of up to 20,000 units a year, while EKA Mobility plans annual capacity of 10,000 buses across Pune and Pithampur. PMI Electro Mobility raised INR 250 crore in February 2025 to expand a 2,500-bus plant. Local advanced battery energy storage supply chains should also reduce pack costs over the decade.
Why does payment security unlock private operator finance?
Lenders and operators worry that cash-strapped transport undertakings may pay late, so a federal guarantee lowers the risk of financing large bus fleets. The Ministry of Heavy Industries launched the PM e-Bus Sewa Payment Security Mechanism on Oct. 28, 2024, with INR 3,435.33 crore to support more than 38,000 buses, according to the International Energy Agency. The scheme covers deployments from fiscal 2024-25 to 2028-29, and each bus can be supported for up to 12 years, according to a Prime Minister's Office release. JBM Ecolife then secured INR 750 crore from Motilal Oswal Alternates in June 2026 to deploy about 2,000 more buses. As a result, state transport undertakings remain the largest customer group with 40.0% of 2025 value.
Operator models, intercity coaches and hydrogen pilots
How is the shift to operator-led leasing changing ownership?
Transit agencies are moving from owning buses to buying service by the kilometer, which shifts vehicle ownership to private operators. Under the PM E-DRIVE tender, operators own, operate and maintain the buses and build charging at depots provided by city authorities, according to Outlook Business. EKA Mobility and GreenCell won a letter of award for 915 buses in Hyderabad in March 2026, comprising 100 nine-meter and 815 twelve-meter buses, according to Autocar Professional. The same partners also won 750 buses across 11 cities in Andhra Pradesh earlier in 2026. In turn, operators with financing and depot experience gain scale, which matches a wider shift toward zero-emission transit fleets worldwide.
Why is the rise of intercity battery coaches notable?
Private operators are adding long-range battery coaches on intercity routes, which extends demand beyond city transit. LeafyBus and Eicher Trucks and Buses announced 100 Skyline Pro E sleeper coaches on Feb. 4, 2026, each 13.5 meters long with a 400 kWh battery, according to EVreporter. Veera Vahana unveiled the 13.5-meter Mahasamrat intercity coach in October 2024 with a 320 kWh pack that charges in about 15 minutes on a 1 MW charger, according to Motor India. LeafyBus already runs daily battery services between Delhi and Dehradun. As a result, coach and above 12m buses grow fastest by vehicle type at 20.41% a year.
Can hydrogen fuel cell buses open a niche in hill regions?
Fuel cell buses suit high-altitude and long routes where battery weight and cold weather cut range, which opens a small but fast-growing niche. NTPC handed five hydrogen fuel cell buses to the Leh administration on June 18, 2025, fueled from a 350-bar station at 11,562 feet that runs on a 1.7 MW solar plant, according to The Machine Maker. EKA Mobility also runs a 9-meter fuel cell bus at Cochin International Airport and plans 15 more. Ashok Leyland agreed in 2023 to supply about 10 fuel cell buses to NTPC for Ladakh. In turn, fuel cell electric buses grow fastest by powertrain at 23.37% a year from a small base.
Is depot charging infrastructure an opening for new investors?
Every pooled bus order needs depot chargers, transformers and grid connections, which opens room for charging specialists and power utilities. PM E-DRIVE set aside INR 2,000 crore for public charging, including 1,800 fast chargers for battery buses, according to the scheme release. PM-eBus Sewa, approved on Aug. 16, 2023, also funds depot upgrades and behind-the-meter power such as substations in its first segment. Each new city fleet of several hundred buses needs its own depot connection, which adds to the work for distribution companies. As a result, charging infrastructure providers can win long contracts beside bus operators.
Delivery delays, payment risk and grid limits slow rollout
How do delivery delays strain large state contracts?
Large state orders can outrun a single supplier's production plan, which delays fleet replacement for transport undertakings. Maharashtra State Road Transport Corporation ordered 5,150 buses from Olectra under a 12-year contract, yet only 57 had arrived by December 2025, according to The Hitavada. As a result, old diesel buses stay in service longer and riders wait for new routes. Agencies now spread orders across several makers and add penalties for late delivery.
Why does payment risk still deter operators?
Many state transport undertakings run at a loss and depend on state budgets to pay operators each month. Late payments raise financing costs for operators, which then bid higher per-kilometer rates in later tenders. In turn, smaller operators struggle to raise debt for fleets of several hundred buses. The federal payment security scheme reduces this risk, although operators still watch each state's payment record before they bid.
How do grid and depot limits slow fleet rollout?
A depot of 100 battery buses needs a high-capacity power connection, and utilities can take many months to build the substation and lines. Cities must also find depot land near routes, which is scarce in dense urban areas. As a result, buses sometimes arrive before depots can charge them, which delays service start. Agencies now plan depot power with distribution companies at the tender stage to avoid these gaps.
Why does battery import dependence raise cost risk?
Most battery cells used in Indian buses are still imported, so currency swings and cell prices affect bus costs. Bus makers sign fixed-price contracts that run for months, which exposes them to input cost changes before delivery. In turn, margins can fall when cell prices or the rupee move sharply. Domestic cell plants under the national battery incentive scheme should reduce this exposure later in the forecast period.
South India leads as East and Northeast India grows fastest
| Region | Value, 2025 (USD billion) | Share, 2025 | CAGR, 2026–2035 |
|---|---|---|---|
| South India | 0.33 | 32.2% | 18.67% |
| North India | 0.29 | 28.4% | 18.97% |
| West India | 0.23 | 23.1% | 18.57% |
| East and Northeast India | 0.17 | 16.3% | 19.67% |
How do Bengaluru and Hyderabad put South India first?
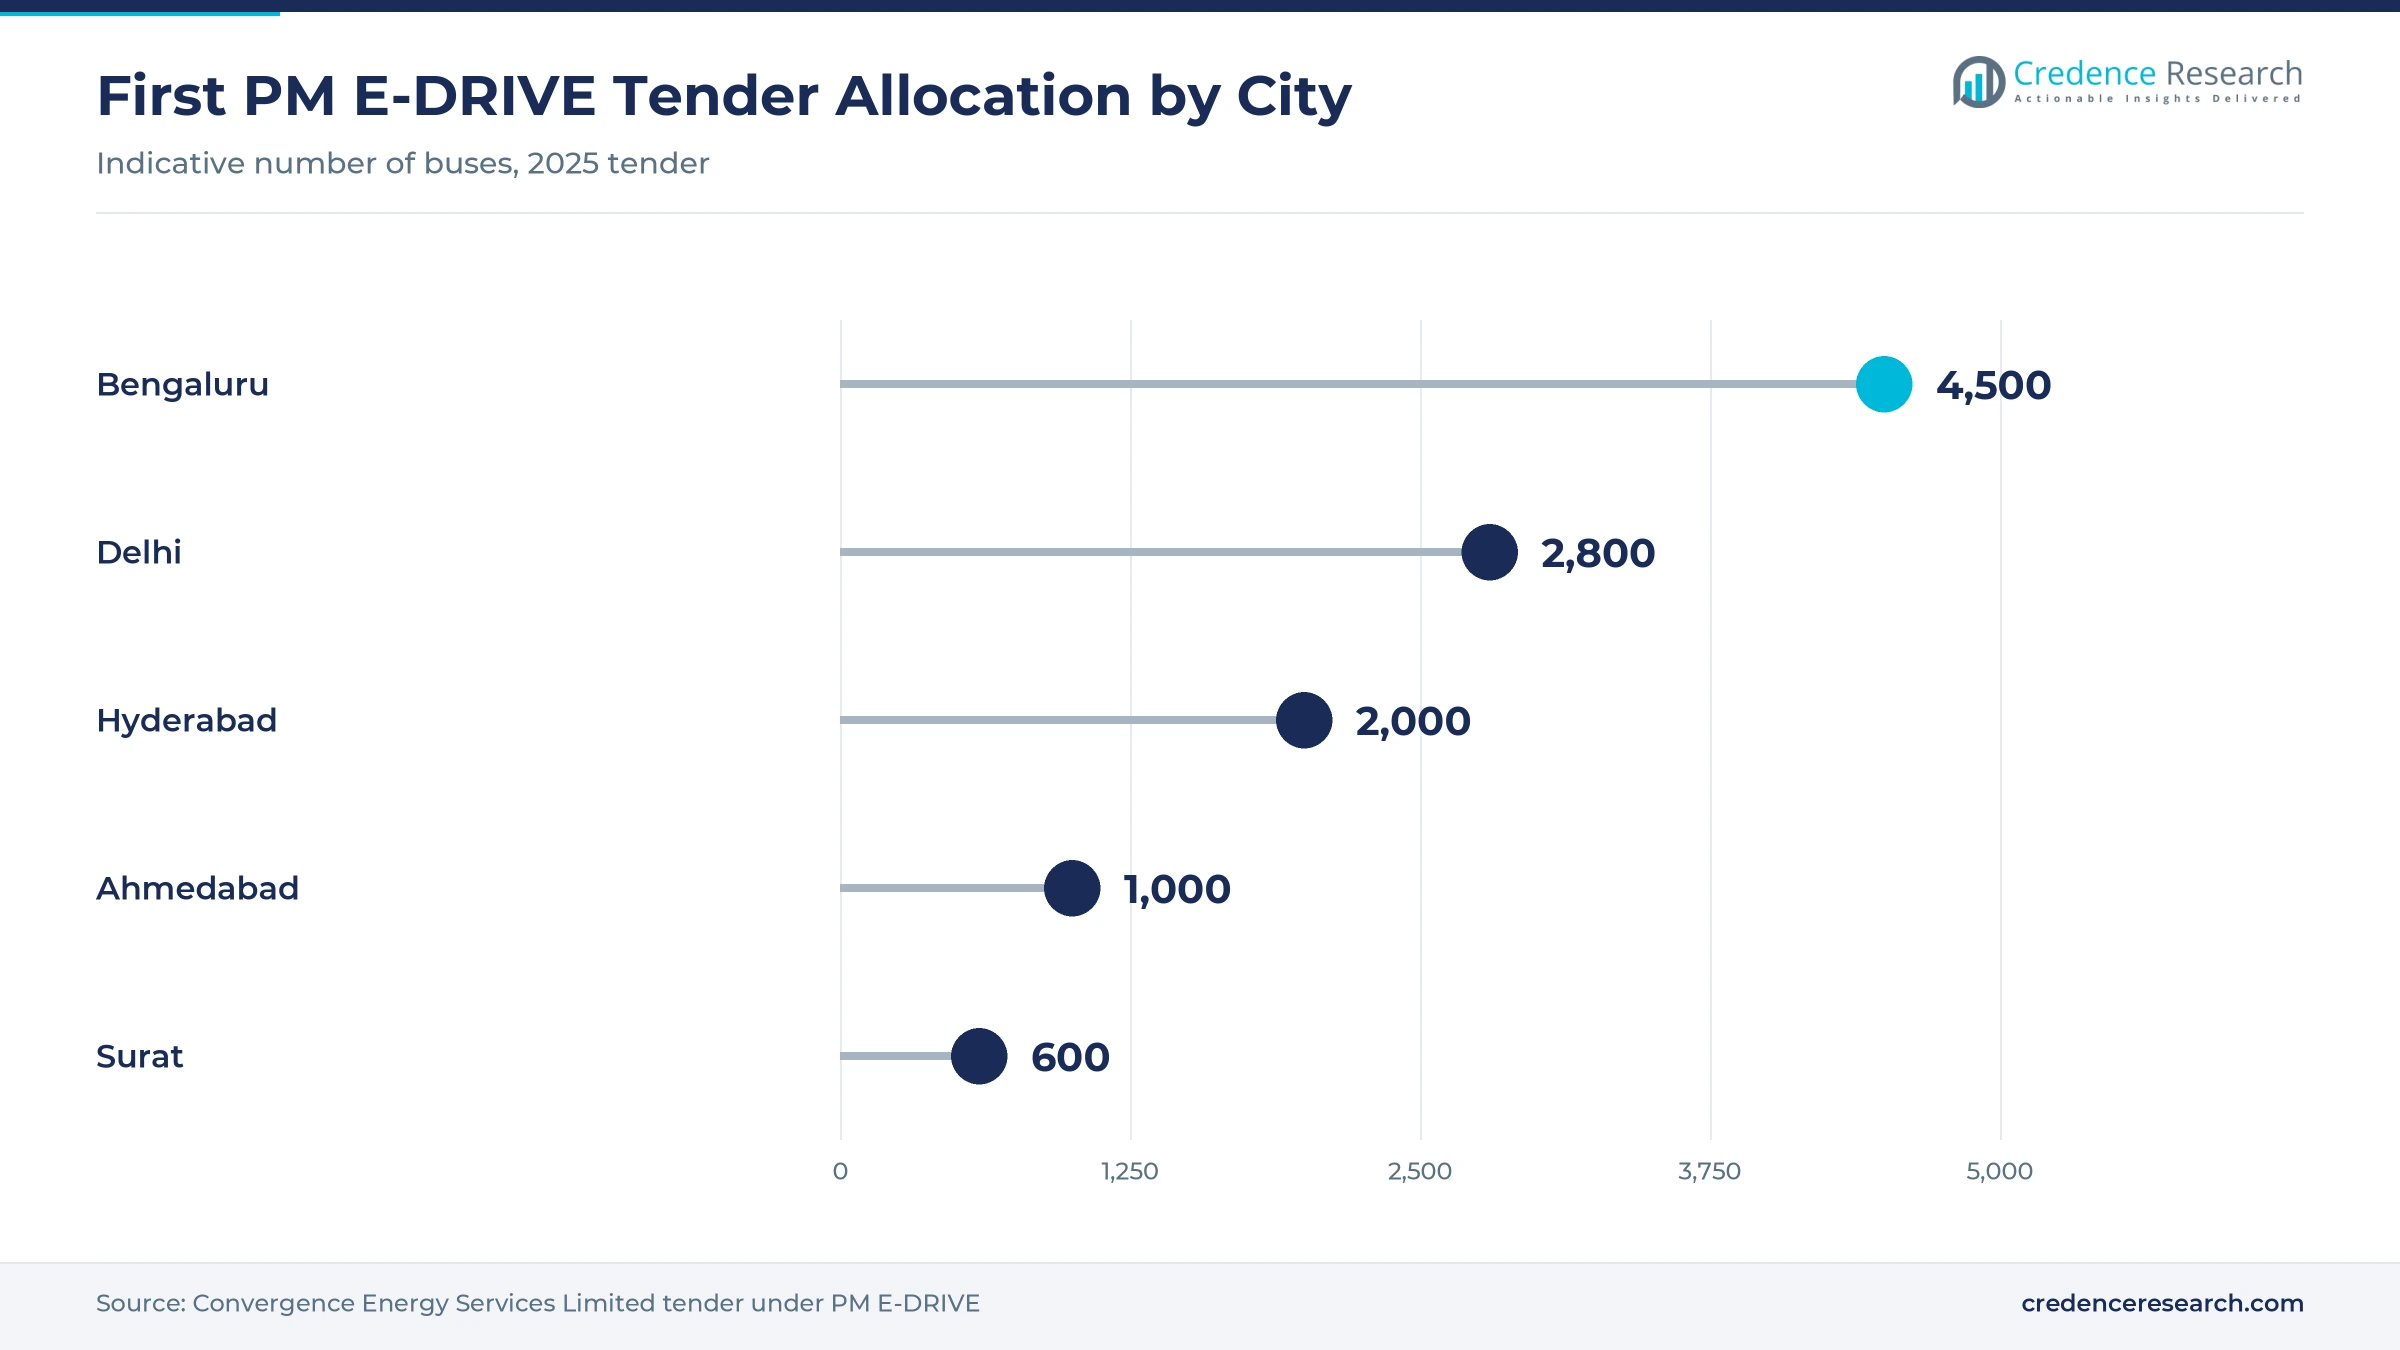
South India held 32.2% of 2025 value and grows at 18.67% a year, because Bengaluru and Hyderabad received the two largest allocations in the first PM E-DRIVE tender, about 4,500 and 2,000 buses. Tata Motors already runs 921 battery buses in Bengaluru for the city transport corporation. EKA Mobility and GreenCell won 750 buses for 11 Andhra Pradesh cities in 2026, and Keto Motors plans a plant at Telangana EV Mobility Valley. As a result, about 6,500 tendered buses for two cities give South India the deepest fleet demand in the country.
Why does Delhi make North India a large buyer?
North India held 28.4% of 2025 value and grows at 18.97% a year, because Delhi runs the largest battery bus fleet of any Indian city. Delhi had 4,538 battery buses in a fleet of about 6,300 in April 2026 and targets 7,000 by the end of the year, according to electrive. Olectra also delivered its 4,000th bus in India as part of 297 units for the Himachal Road Transport Corporation in July 2026. In turn, the capital's target of 14,000 buses by 2028-29 keeps fleet demand in North India high.
How do Mumbai, Pune, Ahmedabad and Surat shape West India?
West India held 23.1% of 2025 value and grows at 18.57% a year, because Mumbai, Pune, Ahmedabad and Surat run large city fleets. Ahmedabad and Surat were allocated about 1,000 and 600 buses in the first PM E-DRIVE tender, while the second round added 1,500 buses for Mumbai and 200 for Pune. However, the 5,150-bus state transport order in Maharashtra has delivered slowly, which holds demand growth in the zone below the national rate.
Why is East and Northeast India growing fastest?
East and Northeast India held 16.3% of 2025 value and grows fastest at 19.67% a year, because its cities start from small battery fleets. PM-eBus Sewa gives priority to cities without organized bus services and covers cities in the northeastern and hill states. Kolkata is also one of the nine large cities named for PM E-DRIVE procurement. As a result, new depots and first fleets in eastern cities lift growth from a low base.
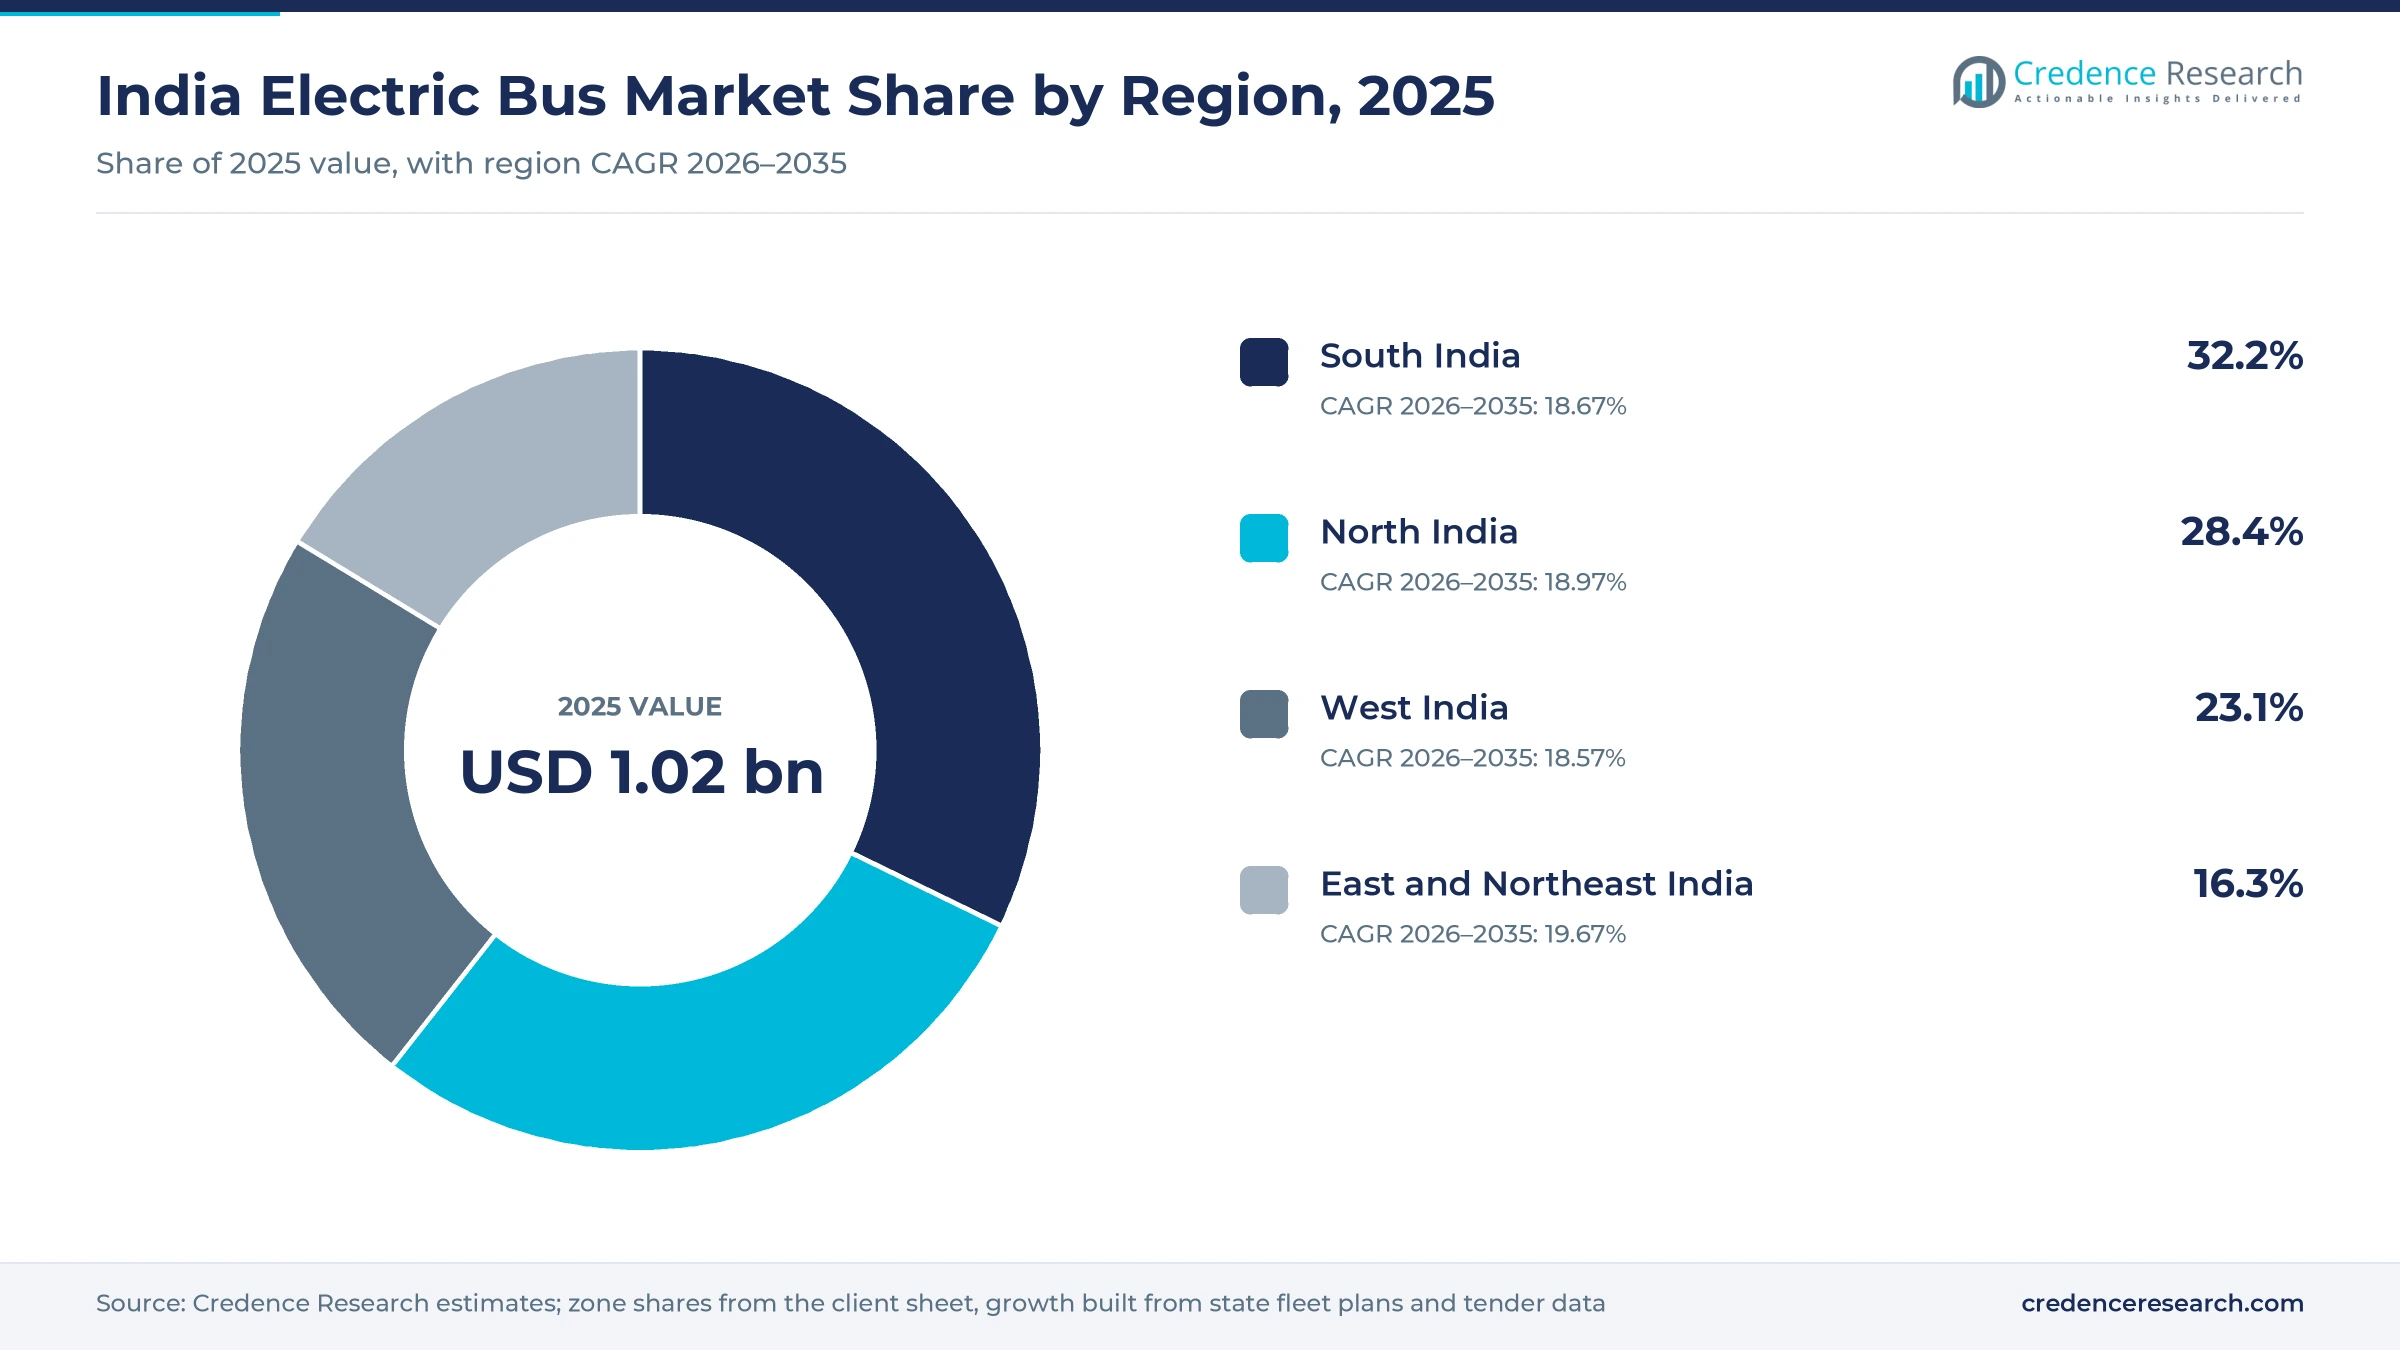
Tenders, funding and fleet milestones from 2024 to 2026
| Development | Status and market relevance |
|---|---|
| In October 2024, the Ministry of Heavy Industries launched an INR 3,435.33 crore payment security scheme for battery buses. | Supports more than 38,000 buses until fiscal 2028-29 |
| In June 2025, NTPC handed five hydrogen fuel cell buses to the Leh administration. | First high-altitude fuel cell bus service in India |
| In December 2025, Convergence Energy Services Limited concluded tenders for 10,900 battery buses in five cities. | Largest pooled bus purchase under PM E-DRIVE |
| In June 2026, JBM Ecolife secured INR 750 crore from Motilal Oswal Alternates to deploy about 2,000 more buses. | Expands an operating fleet of about 3,400 buses |
| In July 2026, Olectra Greentech delivered its 4,000th bus in India to the Himachal Road Transport Corporation. | Fleet has covered more than 730 million kilometers |
Charging method and battery size shape fleet choices
- Depot charging refills large packs overnight with plug-in chargers, which suits city routes that return to one depot.
- Opportunity charging tops up smaller packs at terminals during layovers, which cuts battery weight and bus price.
- LFP batteries use lithium iron phosphate cells, which give long cycle life and good heat tolerance for Indian summers.
- Battery swapping replaces a depleted pack in minutes, which lowers upfront bus cost as Veera Vahana showed with SUN Mobility.
- Fuel cell drives turn stored hydrogen into electricity on board, which suits long and high-altitude routes such as Leh.
Need a Custom Version of This Report?
Tailor the scope, geography, or segments to your exact requirements.
- Custom geography or segment scope
- Direct access to our analyst team
Tender wins and plant capacity separate the leaders
Competition centers on tender wins, plant capacity, operator partnerships and after-sales uptime, because cities pay only for kilometers actually run. PMI Electro Mobility, Olectra Greentech and Switch Mobility led registrations in 2025, while JBM Ecolife combines bus making with fleet operation. Switch Mobility, Ashok Leyland's electric vehicle subsidiary, builds buses in Chennai and is delivering 950 EiV12 buses to Delhi. EKA Mobility sold 1,143 commercial vehicles in fiscal 2025-26 and holds more than 6,000 confirmed bus orders. Tata Motors operates Bengaluru buses through its smart city mobility arm, and Eicher is supplying sleeper coaches to LeafyBus. Veera Vahana and Keto Motors target intercity and 9m niches. PMI, Olectra and Switch together registered 2,981 buses in 2025, so the three largest makers hold about two-thirds of market volume.
Companies profiled and their roles in this market
| Company | Type | Role in the market |
|---|---|---|
| PMI Electro Mobility Solutions Pvt. Ltd. | Bus maker | Led 2025 registrations; Delhi-NCR plant of 2,500 buses a year |
| Olectra Greentech Ltd. | Bus maker | 4,000 buses delivered in India by July 2026; Maharashtra order |
| Switch Mobility Automotive Ltd. | Bus maker | Ashok Leyland subsidiary; 950 EiV12 buses for Delhi |
| JBM Auto Ltd. / JBM ECOLIFE | Bus maker and operator | About 3,400 buses in operation; Delhi-NCR plant |
| EKA Mobility | Bus maker | Pune plants; Hyderabad and Andhra Pradesh awards with GreenCell |
| Tata Motors Ltd. | Bus maker and operator | 921 buses in Bengaluru under a 12-year agreement |
| VE Commercial Vehicles Ltd. (Eicher) | Bus maker | 100 Skyline Pro E sleeper coaches for LeafyBus |
| Ashok Leyland Ltd. | Bus maker | Fuel cell buses for NTPC; parent of Switch Mobility |
| Veera Vahana Udyog Pvt. Ltd. | Bus maker | Mahasamrat intercity coach and swappable battery bus |
| Keto Motors Pvt. Ltd. | Bus maker | Urbanova KE9 9m bus launched August 2026; Telangana plant |
Credence Research view on Indian battery bus demand
Credence Research's view is that Indian battery bus demand will grow strongly, because pooled federal tenders, per-kilometer contracts and a payment guarantee now reduce the risk for operators and lenders. Standard 12m buses keep the largest share, while 9m feeder buses and intercity coaches gain ground. South India should stay the largest zone as Bengaluru and Hyderabad absorb new fleets, while East and Northeast India grows fastest from a small base. Makers that pair plant capacity with operator partners and reliable depot charging should win the most tenders.
Registrations, tenders and scheme data anchor the model
The report uses 2025 as the base year on a calendar basis, and market values come from the Credence Research model. That model combines Vahan registration data as compiled by trade press, scheme allocations, tender volumes and price caps, company plant capacities and fleet announcements. Segment splits and zone growth rates are Credence Research estimates, and zone shares follow the client sheet. Sources used are government releases, scheme documents, the International Energy Agency policy database, trade press and company releases, and no interviews or surveys were used.
City and intercity fleets carry demand toward 2035
Sales of battery and fuel cell buses in India are expected to reach USD 6.64 billion by 2035, an 18.90% CAGR during 2026–2035, as pooled tenders and city fleet targets keep orders flowing. Growth should stay firm through 2029 as PM E-DRIVE and PM-eBus Sewa buses arrive and Delhi and Bengaluru expand their fleets. After that, replacement of state transport diesel fleets and intercity coaches will set the pace. Faster depot power connections would lift deliveries, while slower state payments would delay new contracts. Coach and above 12m buses are expected to gain the most share through 2035.
Frequently Asked Questions
How big is the India electric bus market?
Which vehicle type leads demand in India?
Which region leads the Indian market?
How many electric buses were registered in India in 2025?
What is the PM E-DRIVE scheme for buses?
How are electric buses bought in Indian cities?
Who are the leading electric bus makers in India?
What are the main challenges for the market?
Table of Content
Chapter 1 Market Segmentation
- 1.1 Segmentation Framework
- 1.1.1 Product and Service Classification
- 1.1.2 Application and End-Use Classification
- 1.1.3 Technology and Solution Classification
- 1.1.4 Customer and Distribution Channel Classification
- 1.1.5 Geographic Segmentation
- 1.1.6 Market Segment Definitions and Boundaries
- 1.2 By Vehicle Type
- 1.2.1 Mini and Midi 7-8m
- 1.2.2 Standard 9m
- 1.2.3 Standard 12m
- 1.2.4 Coach and Above 12m
- 1.3 By Powertrain
- 1.3.1 Depot-Charged Battery Electric
- 1.3.2 Opportunity-Charged Battery Electric
- 1.3.3 Fuel Cell Electric
- 1.4 By Customer Type
- 1.4.1 State Transport Undertakings
- 1.4.2 Municipal Transit Agencies
- 1.4.3 Private Stage Carriage Operators
- 1.4.4 Institutional and Corporate Fleets
- 1.5 By Sales Channel
- 1.5.1 Government Aggregated Tenders
- 1.5.2 Direct OEM Fleet Sales
- 1.5.3 GCC Operator Procurement
- 1.5.4 Dealer and Specialized Distributor Sales
Chapter 2 Introduction
- 2.1 Report Objectives and Scope
- 2.2 Product Definition and Industry Terminology
- 2.3 Market Inclusions and Exclusions
- 2.4 Research Process
- 2.4.1 Primary Research and Expert Interviews
- 2.4.2 Secondary Research and Source Review
- 2.4.3 Top-Down and Bottom-Up Estimation
- 2.4.4 Data Triangulation and Verification
- 2.5 Market Size Measurement Basis
- 2.5.1 2025: USD 1.02 billion → 2035: USD 6.64 billion
- 2.6 Historical and Forecast Reference Periods
- 2.6.1 Historical Period: 2018-2025
- 2.6.2 Base Year: 2025
- 2.6.3 Forecast Period: 2025-2035
- 2.7 Research Assumptions and Limitations
Chapter 3 Executive Summary
- 3.1 Market Snapshot and Key Findings
- 3.2 Base-Year Market Size, 2025
- 3.3 Forecast Market Size, 2035
- 3.4 Revenue and Volume Growth Outlook
- 3.5 Key Demand and Supply Indicators
- 3.6 Leading Market Segments
- 3.7 Fastest-Growing Market Opportunities
- 3.8 Regional Performance Highlights
- 3.9 Technology and Industry Transformation
- 3.10 Competitive Landscape Summary
- 3.11 Analyst View and Strategic Implications
Chapter 4 India Electric Bus Market Trends and Developments
- 4.1 Historical Industry Development, 2018-2025
- 4.2 Recent Market Trends and Developments
- 4.3 Demand and Customer Behavior Trends
- 4.4 Technology and Product Innovation
- 4.5 Artificial Intelligence, Automation and Digitalization
- 4.6 Local Manufacturing and Supply Chain Realignment
- 4.7 Industry Partnerships, Mergers and Acquisitions
- 4.8 Sustainability and Circular Economy Developments
- 4.9 Government and Private Sector Investment Trends
- 4.10 Emerging Business Models and Commercialization
- 4.11 Industry Developments and Announcements
Chapter 5 India Electric Bus Market Production, Supply and Demand Analysis
- 5.1 Demand Trend and Consumption Analysis, 2018-2025
- 5.2 Demand Forecast, 2025-2035
- 5.3 Production and Output Trend, 2018-2025
- 5.4 Production and Output Forecast, 2025-2035
- 5.5 Installed Capacity and Capacity Utilization
- 5.6 Company-Wise Production Plants and Statistics
- 5.6.1 Installed Production Capacity
- 5.6.2 Actual Production
- 5.6.3 Planned Capacity and Expansion Targets
- 5.7 Supply Chain Structure and Procurement Trends
- 5.8 Supply-Demand Gap and Bottlenecks
- 5.9 Import Dependence and Sourcing Structure
- 5.10 Contract Manufacturing and Outsourcing
- 5.11 Regional Supply and Demand Concentration
Chapter 6 India Electric Bus Market Pricing Analysis
- 6.1 Pricing Structure and Measurement
- 6.2 Historical Pricing Trends, 2018-2025
- 6.3 Pricing Outlook, 2025-2035
- 6.4 Average Selling Price and Unit Economics
- 6.5 Pricing by Product and Market Segment
- 6.6 Geographic Pricing Differences
- 6.7 Key Input, Energy, Labor and Logistics Costs
- 6.8 Contract Pricing and Purchasing Models
- 6.9 Pricing Sensitivity and Competitive Positioning
- 6.10 Price, Margin and Profitability Implications
Chapter 7 India Electric Bus Market Dynamics
- 7.1 Market Growth Drivers
- 7.1.1 Demand-Side Drivers
- 7.1.2 Technology and Innovation Drivers
- 7.1.3 Infrastructure and Investment Drivers
- 7.1.4 Regulatory and Policy Drivers
- 7.2 Market Restraints
- 7.2.1 Cost and Affordability Constraints
- 7.2.2 Technology and Adoption Barriers
- 7.2.3 Supply Chain and Operational Constraints
- 7.3 Market Challenges
- 7.3.1 Competitive Pressure and Margin Erosion
- 7.3.2 Skills, Infrastructure and Implementation Gaps
- 7.4 Emerging Market Opportunities
- 7.5 Market Dynamics Impact and Time-Horizon Assessment
Chapter 8 India Electric Bus Value Chain Analysis
- 8.1 Industry Value Chain Overview
- 8.2 Upstream Suppliers and Critical Inputs
- 8.3 Technology and Component Providers
- 8.4 Manufacturing or Service Delivery
- 8.5 Distribution, Channel Partners and Integrators
- 8.6 Downstream Applications and End Users
- 8.7 Value Addition and Profit Pools
- 8.8 Vertical Integration and Outsourcing
- 8.9 Supplier Concentration and Risk
- 8.10 Supply Chain Localization and Resilience
Chapter 9 India Electric Bus Market Regulations and Policies
- 9.1 Relevant Laws, Standards and Compliance Frameworks
- 9.2 Product, Service, Safety and Quality Requirements
- 9.3 Government Policies, Incentives and Subsidies
- 9.4 Imports, Exports and Trade Barriers
- 9.5 Public Procurement and Local Content Requirements
- 9.6 Environmental and Sustainability Compliance
- 9.7 Upcoming Policy Changes and Market Implications
Chapter 10 India Electric Bus Market Hotspots and Opportunities
- 10.1 Market Opportunity Mapping and Growth Hotspots
- 10.2 High-Growth Applications and Customer Groups
- 10.3 Underserved Markets and White-Space Opportunities
- 10.4 Emerging Technology and Product Opportunities
- 10.5 New Capacity and Investment Hotspots
- 10.6 Market Entry and Expansion Opportunities
- 10.7 Distribution and Partnership Opportunities
- 10.8 Near-Term and Long-Term Commercial Potential
- 10.9 Opportunity Attractiveness and Execution Risks
Chapter 11 India Electric Bus Market Outlook, 2025-2035
- 11.1 Market Size and Analysis
- 11.1.1 Revenue (Market Measurement: 2025: USD 1.02 billion → 2035: USD 6.64 billion)
- 11.1.2 Market Volume and Quantity Sold
- 11.1.3 Historical Market Size, 2018-2025
- 11.1.4 Base-Year Market Size, 2025
- 11.2 Market Forecast, 2025-2035
- 11.2.1 Revenue Forecast to 2035
- 11.2.2 Volume Forecast to 2035
- 11.2.3 CAGR and Year-on-Year Growth
- 11.2.4 Incremental Revenue Opportunity
- 11.3 Forecast Assumptions and Scenario Analysis
- 11.3.1 Base-Case Forecast
- 11.3.2 Optimistic and Conservative Scenarios
- 11.3.3 Technology, Pricing and Policy Sensitivities
- 11.4 Market Attractiveness and Growth Outlook
Chapter 12 India Electric Bus Market Segmentation and Outlook
- 12.1 Segmentation Summary and Market Shares, 2025
- 12.2 Largest and Fastest-Growing Segments
- 12.3 By Vehicle Type - Market Size and Forecast, 2025-2035
- 12.3.1 Segment Definition and Scope
- 12.3.2 Historical Market Size, 2018-2025
- 12.3.3 Revenue Forecast, 2025-2035
- 12.3.4 Volume Forecast, 2025-2035
- 12.3.5 Base-Year Market Share, 2025
- 12.3.6 Segment CAGR and Growth Drivers
- 12.3.7 Subsegment Market Size and Forecast
- 12.3.7.1 Mini and Midi 7-8m
- 12.3.7.2 Standard 9m
- 12.3.7.3 Standard 12m
- 12.3.7.4 Coach and Above 12m
- 12.3.8 Subsegment Pricing and Adoption Trends
- 12.3.9 Leading Suppliers and Competition
- 12.3.10 Regional Demand and Opportunities
- 12.4 By Powertrain - Market Size and Forecast, 2025-2035
- 12.4.1 Segment Definition and Scope
- 12.4.2 Historical Market Size, 2018-2025
- 12.4.3 Revenue Forecast, 2025-2035
- 12.4.4 Volume Forecast, 2025-2035
- 12.4.5 Base-Year Market Share, 2025
- 12.4.6 Segment CAGR and Growth Drivers
- 12.4.7 Subsegment Market Size and Forecast
- 12.4.7.1 Depot-Charged Battery Electric
- 12.4.7.2 Opportunity-Charged Battery Electric
- 12.4.7.3 Fuel Cell Electric
- 12.4.8 Subsegment Pricing and Adoption Trends
- 12.4.9 Leading Suppliers and Competition
- 12.4.10 Regional Demand and Opportunities
- 12.5 By Customer Type - Market Size and Forecast, 2025-2035
- 12.5.1 Segment Definition and Scope
- 12.5.2 Historical Market Size, 2018-2025
- 12.5.3 Revenue Forecast, 2025-2035
- 12.5.4 Volume Forecast, 2025-2035
- 12.5.5 Base-Year Market Share, 2025
- 12.5.6 Segment CAGR and Growth Drivers
- 12.5.7 Subsegment Market Size and Forecast
- 12.5.7.1 State Transport Undertakings
- 12.5.7.2 Municipal Transit Agencies
- 12.5.7.3 Private Stage Carriage Operators
- 12.5.7.4 Institutional and Corporate Fleets
- 12.5.8 Subsegment Pricing and Adoption Trends
- 12.5.9 Leading Suppliers and Competition
- 12.5.10 Regional Demand and Opportunities
- 12.6 By Sales Channel - Market Size and Forecast, 2025-2035
- 12.6.1 Segment Definition and Scope
- 12.6.2 Historical Market Size, 2018-2025
- 12.6.3 Revenue Forecast, 2025-2035
- 12.6.4 Volume Forecast, 2025-2035
- 12.6.5 Base-Year Market Share, 2025
- 12.6.6 Segment CAGR and Growth Drivers
- 12.6.7 Subsegment Market Size and Forecast
- 12.6.7.1 Government Aggregated Tenders
- 12.6.7.2 Direct OEM Fleet Sales
- 12.6.7.3 GCC Operator Procurement
- 12.6.7.4 Dealer and Specialized Distributor Sales
- 12.6.8 Subsegment Pricing and Adoption Trends
- 12.6.9 Leading Suppliers and Competition
- 12.6.10 Regional Demand and Opportunities
- 12.7 Segment Growth Comparison
- 12.8 Segment Attractiveness and Priority Matrix
Chapter 13 India Electric Bus End-Use and Application Market Outlook
- 13.1 End-Use Industry and Customer Demand Structure
- 13.2 Leading Applications and Customer Groups
- 13.3 End-Use Market Size, Share and Forecast
- 13.4 Major End-Use Industry Deep Dives
- 13.4.1 Customer Requirements and Use Cases
- 13.4.2 Demand and Replacement Cycles
- 13.4.3 Technical and Regulatory Considerations
- 13.4.4 Purchasing and Procurement Models
- 13.4.5 Leading Vendors and Distribution Channels
- 13.4.6 Forecast and Commercial Opportunities
- 13.5 Emerging Applications and Cross-Segment Demand
- 13.6 End-Use Industry Investment Priorities
Chapter 14 India Electric Bus Geographic Market Outlook, 2025-2035
- 14.1 Domestic Market Distribution and Demand Clusters
- 14.2 State- or Province-Wise Market Size and Forecast, 2025-2035
- 14.3 City and Metropolitan Market Outlook
- 14.4 Industrial, Manufacturing and Commercial Clusters
- 14.5 Geographic Concentration of Key End Users
- 14.6 Local Pricing and Purchasing Differences
- 14.7 Domestic Production Facilities and Capacity Map
- 14.8 Local Infrastructure and Project Pipeline
- 14.9 State-Level Policy and Incentive Differences
- 14.10 Subnational Investment Hotspots and Opportunities
- 14.11 Distribution and Logistics Networks
- 14.12 Domestic Competitive Footprint
Chapter 15 India Electric Bus Technology, Innovation and Sustainability Outlook
- 15.1 Technology Landscape and Maturity
- 15.2 Product, Process and Service Innovation
- 15.3 AI, Automation and Digital Tools in the Industry
- 15.4 Technology Adoption and Performance Benchmarking
- 15.5 Innovation Pipeline and R&D Investment
- 15.6 Patent and Intellectual Property Trends
- 15.7 Energy Efficiency and Resource Management
- 15.8 Sustainability, Recycling and Circularity
- 15.9 Technology Roadmap, 2025-2035
- 15.10 Risks of Obsolescence and Technology Substitution
Chapter 16 India Electric Bus Market Key Strategic Imperatives
- 16.1 Growth and Market Entry Priorities
- 16.2 High-Return Products and Segments
- 16.3 Pricing, Profitability and Cost Optimization
- 16.4 Technology Investment and Product Differentiation
- 16.5 Supply Chain Localization and Resilience
- 16.6 Distribution and Customer Acquisition
- 16.7 Partnership, Acquisition and Capacity Strategy
- 16.8 Regional Expansion Priorities
- 16.9 Short-, Medium- and Long-Term Actions
Chapter 17 Competition Outlook
- 17.1 Industry Competition Characteristics
- 17.2 Market Structure and Concentration
- 17.3 Market Share and Competitive Positioning, 2025
- 17.4 Company-Wise Revenue and Product Benchmarking
- 17.5 Production and Service Capacity Benchmarking
- 17.6 Technology, Pricing and Differentiation
- 17.7 Regional Footprint and Distribution Strength
- 17.8 Mergers, Acquisitions and Strategic Alliances
- 17.9 New Entrants and Competitive Threats
- 17.10 Porter's Five Forces and Industry Attractiveness
- 17.11 Competitive Outlook, 2025-2035
Chapter 18 Company Profiles
- 18.1 Company Coverage and Selection Criteria
- 18.2 PMI Electro Mobility Solutions Pvt. Ltd.
- 18.2.1 Business Description
- 18.2.2 Company Ownership and Geographic Presence
- 18.2.3 Product and Service Portfolio
- 18.2.4 Manufacturing and Operating Footprint
- 18.2.5 Production Capacity and Expansion Plans
- 18.2.6 Financial Performance and Investment
- 18.2.7 Market Share and Competitive Position
- 18.2.8 Technology and Innovation Capabilities
- 18.2.9 Strategic Alliances or Partnerships
- 18.2.10 Recent Developments
- 18.2.11 Growth Strategy and Outlook
- 18.3 Olectra Greentech Ltd.
- 18.4 Switch Mobility Automotive Ltd.
- 18.5 JBM Auto Ltd. / JBM ECOLIFE
- 18.6 EKA Mobility
- 18.7 Tata Motors Ltd.
- 18.8 VE Commercial Vehicles Ltd. (Eicher)
- 18.9 Ashok Leyland Ltd.
- 18.10 Veera Vahana Udyog Pvt. Ltd.
- 18.11 Keto Motors Pvt. Ltd.
- 18.12 Other Relevant Market Participants
Note: Every listed company is profiled on the structure shown under the first company. The company list is preliminary and may change based on research findings, market developments, data availability and client requirements.
Chapter 19 Disclaimer
- 19.1 Research and Forecast Disclaimer
- 19.2 Data Source and Estimation Limitations
Note: The depth of individual sections depends on data availability for this market. Volume, capacity, trade and other unit-based metrics are included where applicable.

