| REPORT ATTRIBUTE |
DETAILS |
| Historical Period |
2020-2023 |
| Base Year |
2024 |
| Forecast Period |
2025-2032 |
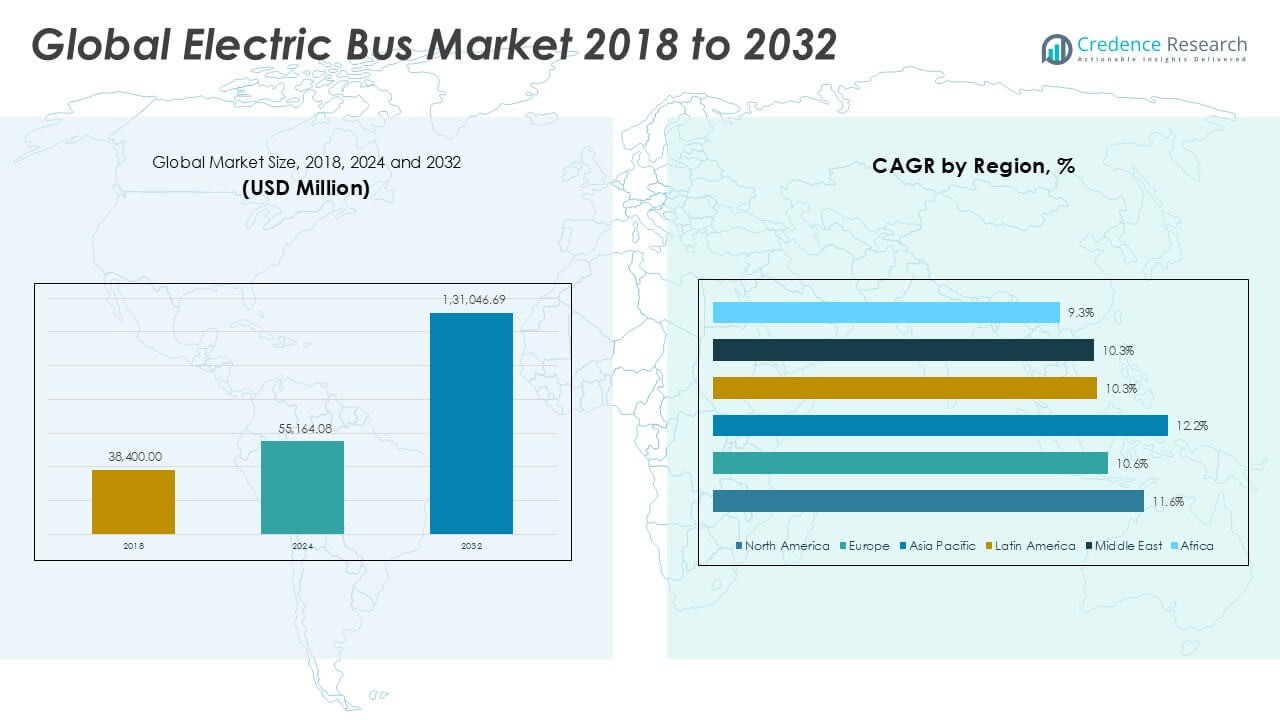
| Electric Bus Market Size 2024 |
USD 55,164.08 Million |
| Electric Bus Market, CAGR |
11.47% |
| Electric Bus Market Size 2032 |
USD 1,31,046.69 Million |
Market Overview
The Global Electric Bus Market is projected to grow from USD 55,164.08 million in 2024 to an estimated USD 1,31,046.69 million by 2032, with a compound annual growth rate (CAGR) of 11.47% from 2025 to 2032.
The electric bus market is being driven by rising environmental concerns, stringent emission regulations, and growing government investments in electric public transport systems. Additionally, the cost advantages of electric buses over the long term, along with subsidies and incentives for electric vehicle adoption, are encouraging operators to transition from diesel to electric fleets. Trends such as technological innovations in battery systems, increasing focus on energy efficiency, and the integration of smart transportation solutions are further shaping the market landscape.
Geographically, the Asia Pacific region holds the largest market share, led by countries like China, India, and Japan, which are rapidly expanding their electric bus fleets due to government mandates and urban pollution concerns. Europe and North America are also witnessing significant growth, supported by strong policy support and investment in green public transportation infrastructure. Key players operating in the Global Electric Bus Market include BYD Company Limited, Yutong, Proterra, AB Volvo, VDL Groep, Daimler AG, and NFI Group Inc., who are actively enhancing their product portfolios and global presence.
Access crucial information at unmatched prices!
Request your sample report today & start making informed decisions powered by Credence Research Inc.!
Download Sample
Market Insights
- The Global Electric Bus Market is expected to grow significantly, driven by rising demand for sustainable public transportation and supportive government policies worldwide.
- Increasing environmental regulations and emission reduction targets are accelerating the shift from diesel to electric bus fleets across major regions.
- Advances in battery technology and charging infrastructure are improving electric bus efficiency, range, and operational feasibility.
- High initial investment costs and limited charging infrastructure in some regions remain key challenges restraining faster adoption.
- Asia Pacific leads the market with the largest share due to rapid urbanization and aggressive government mandates in countries like China and India.
- Europe and North America also show strong growth, supported by robust environmental policies and investments in green public transport systems.
- Market players focus on innovation and strategic partnerships to capitalize on expanding opportunities and overcome operational barriers.
Market Drivers
Government Regulations and Support Programs Fuel Market Expansion
The Global Electric Bus Market is gaining significant momentum due to stringent government regulations targeting carbon emission reductions and air pollution control. Many countries have introduced policies that encourage public transportation authorities to adopt electric buses by providing tax benefits, subsidies, and low-interest financing options. These regulatory measures directly support the growth of electric vehicle adoption in the public transport sector. Governments are also setting long-term targets for phasing out diesel-powered buses, which pushes fleet operators to invest in electric alternatives. Financial incentives reduce the initial cost barrier, making electric buses more viable for mass deployment. It benefits from this proactive policy environment, which is strengthening the commitment toward sustainable urban mobility.
- For instance, according to the U.S. Federal Transit Administration, over 1,100 electric buses were funded through the Low or No Emission Vehicle Program in 2023, supporting transit agencies across 47 states with grants for vehicle purchases and charging infrastructure.
Rising Demand for Sustainable and Cost-Efficient Public Transport Solutions
The Global Electric Bus Market is witnessing growth driven by the increasing demand for sustainable and cost-efficient public transportation. Urban centers are experiencing growing concerns over deteriorating air quality and rising fuel prices. Fleet operators are shifting to electric buses, which offer long-term cost savings on fuel and maintenance compared to traditional diesel buses. Public awareness regarding environmental sustainability is supporting this transition. It offers a cleaner and more energy-efficient alternative, which is becoming essential in densely populated cities. Electric buses contribute to noise reduction and improved urban living conditions, making them an attractive option for city planners.
- For instance, the International Energy Agency reported that more than 66,000 new electric buses were added to city fleets worldwide in 2023, with major deployments in China, Europe, and North America to address urban sustainability goals.
Technological Advancements Enhance Performance and Operational Efficiency
Continuous technological advancements in battery systems and electric drivetrains are significantly improving the performance and reliability of electric buses. The Global Electric Bus Market is benefiting from innovations such as extended battery life, faster charging capabilities, and improved energy density. These improvements enable electric buses to operate longer distances on a single charge, addressing previous range limitations. Manufacturers are focusing on developing modular battery systems and efficient powertrains to optimize operational costs. It is now able to offer competitive alternatives to diesel buses with reduced charging time and enhanced durability. Such technological progress is making electric buses a more practical choice for both urban and intercity transport networks.
Expansion of Charging Infrastructure Supports Large-Scale Adoption
The growing expansion of electric vehicle charging infrastructure is a key driver for the Global Electric Bus Market. Charging stations are being deployed at bus depots, public transit hubs, and major city routes to ensure seamless daily operations. Governments and private companies are investing in the development of fast-charging and wireless charging technologies to support high-frequency bus services. It is gaining from the availability of reliable and accessible charging networks that reduce downtime and operational constraints. The improved infrastructure enables operators to manage electric bus fleets efficiently and scale up their services. The ongoing infrastructure development is essential in overcoming previous deployment barriers and supporting long-term market growth.
Market Trends
Growing Adoption of Battery Electric Buses Across Urban Transport Networks
The Global Electric Bus Market is experiencing a steady rise in the adoption of battery electric buses (BEBs) within urban transportation systems. Cities are moving towards fully electric bus fleets to reduce local emissions and improve public health. The demand for BEBs is increasing due to their lower operating costs and reduced dependence on fossil fuels. It benefits from this shift as municipal authorities and private operators prioritize sustainability in transport planning. BEBs are now a preferred choice because they provide quiet, efficient, and zero-emission transport solutions. The market is seeing significant growth in urban centers where air quality regulations are strict.
- For instance, in the European Union, 2023 marked the first year that electric city bus registrations outpaced diesel bus registrations, with more than 5,000 new battery electric buses added to city fleets across EU countries during the year
Integration of Advanced Telematics and Smart Fleet Management Systems
The Global Electric Bus Market is advancing through the growing use of telematics and smart fleet management systems. Operators are focusing on optimizing route planning, energy consumption, and vehicle performance using real-time data analytics. The integration of these systems enhances fleet efficiency and supports predictive maintenance, reducing unexpected breakdowns. It is gaining from the trend of connected transport solutions that improve service reliability and passenger satisfaction. Smart monitoring tools also allow operators to maximize battery usage and track charging schedules effectively. The use of telematics is transforming electric bus operations into more data-driven and cost-efficient systems.
- For instance, Transit Systems, Australia’s largest bus operator, installed GreenRoad Safety Telematics in over 2,600 buses across Sydney, Melbourne, and Perth, resulting in an 84% reduction in accident rates and significant improvements in operational efficiency within one year
Increasing Preference for Fast-Charging and High-Capacity Battery Solutions
The Global Electric Bus Market is seeing a rising preference for fast-charging technologies and high-capacity battery systems to support demanding transport schedules. Transit authorities require electric buses that can minimize charging downtime while offering extended range. It is now responding with the development of rapid charging stations and advanced battery packs with higher energy densities. These solutions enable quicker turnaround times and better service continuity for busy urban routes. Operators are favoring electric buses that provide faster charging cycles without compromising battery life. The market is moving towards innovative charging technologies that align with the operational needs of high-frequency transit systems.
Rising Collaboration Between Public Transport Authorities and Private Manufacturers
The Global Electric Bus Market is progressing through strong collaborations between public transport authorities and private electric bus manufacturers. Government bodies are working closely with suppliers to tailor electric bus designs that meet local transport requirements. It benefits from this cooperation, which drives product customization and infrastructure alignment. Joint initiatives help accelerate the deployment of large electric bus fleets by ensuring the timely availability of vehicles and charging solutions. These partnerships support the sharing of technical expertise and operational best practices. Collaborative models are emerging as key drivers in scaling up electric bus adoption across global transport networks.
Market Challenges
High Procurement Costs and Budget Constraints Slow Market Growth
The Global Electric Bus Market faces persistent challenges due to the high initial purchase costs of electric buses and supporting infrastructure. Many transit authorities and fleet operators struggle to secure the necessary funding for large-scale electric bus integration. It continues to face resistance in cost-sensitive markets where financial limitations delay investment decisions. Electric buses require substantial capital compared to diesel alternatives, making affordability a key concern. Budget constraints in small and medium-sized cities further limit rapid adoption. This financial barrier slows down market expansion and creates uneven growth across regions.
- For instance, according to the U.S. National Renewable Energy Laboratory, the average upfront cost of a battery electric bus in 2024 was $750,000, while a comparable diesel bus cost approximately $450,000, resulting in a $300,000 price gap that many smaller transit agencies find difficult to bridge without substantial subsidies or grants.
Insufficient Charging Infrastructure and Operational Limitations Create Barriers
The Global Electric Bus Market is also constrained by the underdeveloped charging infrastructure and operational challenges related to range limitations. Many cities lack an extensive network of charging stations, which hinders efficient fleet management. It faces service disruptions when charging availability does not align with demanding transit schedules. Limited range and long charging cycles restrict route planning and reduce fleet flexibility. Operators require dependable infrastructure to ensure continuous service without excessive downtime. The gap in charging capacity and route coverage remains a critical operational hurdle for market participants.
Market Opportunities
Expansion into Emerging Markets Offers Significant Growth Potential
The Global Electric Bus Market has strong opportunities in emerging economies where urbanization is accelerating and public transport networks are expanding. Governments in regions like Southeast Asia, Latin America, and Africa are focusing on sustainable transport solutions to address rising pollution levels. It can benefit from these markets where demand for affordable, low-emission transit options is growing. Local authorities are considering large-scale electric bus deployments to modernize aging fleets. Manufacturers have the opportunity to offer cost-effective, region-specific electric bus models that meet local infrastructure and budget conditions. These emerging markets present untapped potential for long-term growth.
Technological Innovations Open New Revenue Streams for Manufacturers
The Global Electric Bus Market can explore opportunities through advancements in battery technology, charging systems, and energy management solutions. It can leverage fast-charging, battery swapping, and wireless charging technologies to overcome existing operational barriers. Manufacturers can develop next-generation electric buses with extended range and lower lifecycle costs to attract more operators. Growth in autonomous electric buses and connected fleet management systems can further open new segments. Customization of electric bus designs to suit varying route densities and city layouts provides additional competitive advantages. These technological improvements create new pathways for innovation-driven market expansion.
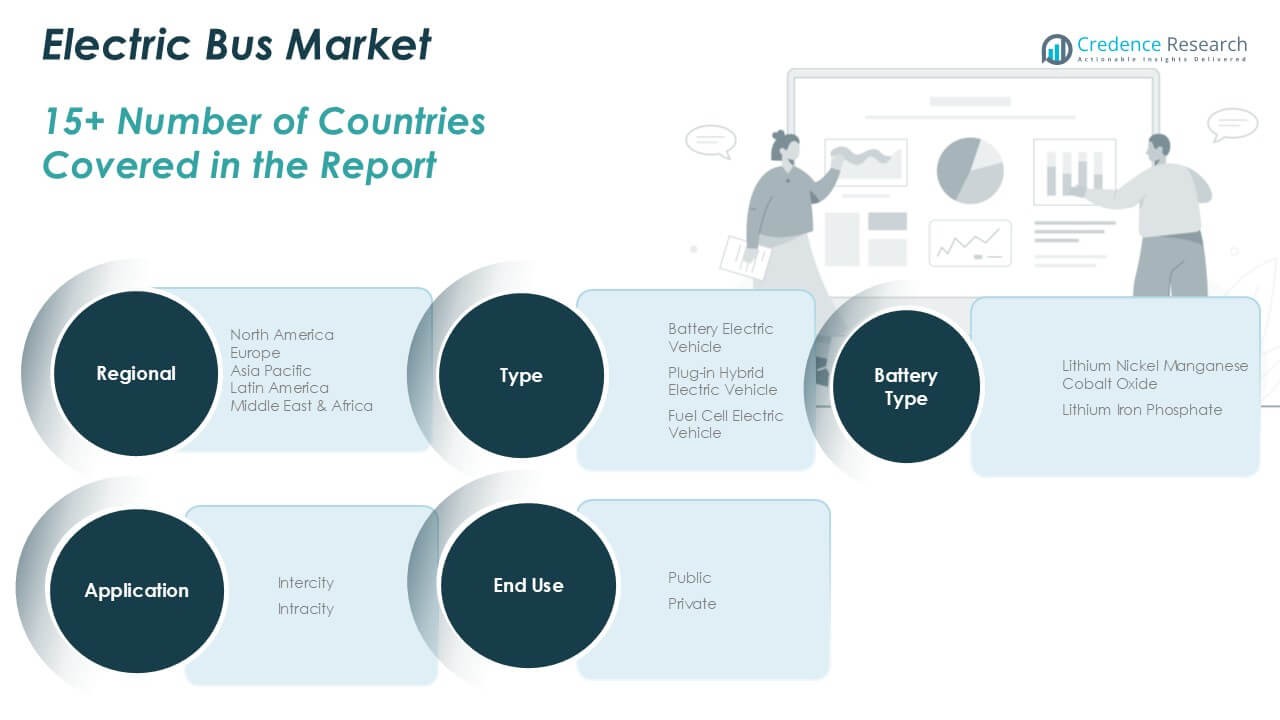
Market Segmentation Analysis
By Type
The Global Electric Bus Market is segmented by type into Battery Electric Vehicles (BEVs), Plug-in Hybrid Electric Vehicles (PHEVs), and Fuel Cell Electric Vehicles (FCEVs). Battery Electric Vehicles hold a dominant share in both volume and revenue due to their zero-emission capability and lower operating costs. It is seeing growing demand for BEVs in urban areas where clean transport is a priority. Plug-in Hybrid Electric Vehicles offer flexibility with dual power sources but hold a smaller share as operators prefer fully electric solutions. Fuel Cell Electric Vehicles are gaining attention for long-range applications, though their market share remains limited due to high costs and limited hydrogen infrastructure.
- For instance, according to the China Association of Automobile Manufacturers, over 78,000 new battery electric buses were produced in China in 2023, while production of plug-in hybrid and fuel cell electric buses was significantly lower, with fewer than 6,000 units combined.
By Application
The Global Electric Bus Market is divided by application into Intercity and Intracity services. Intracity electric buses hold a larger market share due to high adoption in urban public transportation systems. It benefits from growing city-level initiatives focusing on reducing air pollution and noise. Intercity electric buses are slowly gaining traction but face operational challenges due to range limitations and charging network gaps on long routes. Intracity buses remain the preferred choice for daily transit because they align well with existing charging schedules and infrastructure availability.
- For instance, the European Alternative Fuels Observatory reported that in 2023, more than 11,000 new electric buses were registered for intracity use across European cities, compared to just over 900 electric buses registered for intercity routes.
By End-Use
The Global Electric Bus Market is segmented by end-use into Public and Private sectors. Public transportation authorities dominate the market due to large-scale fleet investments supported by government funding and clean energy mandates. It continues to attract public sector buyers who are replacing diesel fleets with electric alternatives. The private sector shows growing interest, especially in shuttle services and corporate transport, though its market share remains smaller. Public sector adoption drives the majority of market growth and technology advancements.
By Battery Type
The Global Electric Bus Market segments by battery type into Lithium Nickel Manganese Cobalt Oxide (NMC) and Lithium Iron Phosphate (LFP) batteries. Lithium Nickel Manganese Cobalt Oxide batteries hold a larger revenue share due to their higher energy density, which supports longer range and faster charging. It sees rising demand for NMC batteries in regions prioritizing long-distance and high-frequency services. Lithium Iron Phosphate batteries offer enhanced safety, longer life cycles, and lower costs, making them a strong choice for city buses with frequent stops. Both battery types play a critical role in shaping the performance and adoption of electric buses across various routes and applications.
Segments
Based on Type
- Battery Electric Vehicle
- Plug-in Hybrid Electric Vehicle
- Fuel Cell Electric Vehicle
Based on Application
Based on End-use
Based on Battery Type
- Lithium Nickel Manganese Cobalt Oxide
- Lithium Iron Phosphate
Based on Region
- North America
- Europe
- UK
- France
- Germany
- Italy
- Spain
- Russia
- Belgium
- Netherlands
- Austria
- Sweden
- Poland
- Denmark
- Switzerland
- Rest of Europe
- Asia Pacific
- China
- Japan
- South Korea
- India
- Australia
- Thailand
- Indonesia
- Vietnam
- Malaysia
- Philippines
- Taiwan
- Rest of Asia Pacific
- Latin America
- Brazil
- Argentina
- Peru
- Chile
- Colombia
- Rest of Latin America
- Middle East
- UAE
- KSA
- Israel
- Turkey
- Iran
- Rest of Middle East
- Africa
- Egypt
- Nigeria
- Algeria
- Morocco
- Rest of Africa
Regional Analysis
North America Electric Bus Market
The Electric Bus Market in North America is projected to grow from USD 11,541.70 million in 2024 to USD 27,658.06 million by 2032, registering a CAGR of 11.60% during the forecast period. North America holds a market share of approximately 20.93% in 2024. It is driven by strong government support, growing environmental awareness, and rising investment in clean public transportation. The United States leads regional growth due to substantial federal and state-level subsidies encouraging electric bus adoption. Canada is also expanding its electric bus fleets with several city-level projects. North America’s market growth is supported by continuous infrastructure development and advancements in fast-charging technology.
Europe Electric Bus Market
The Electric Bus Market in Europe is expected to increase from USD 15,130.00 million in 2024 to USD 33,845.78 million by 2032, growing at a CAGR of 10.63%. Europe holds a market share of approximately 27.42% in 2024. It benefits from strict emission reduction targets and heavy investments in sustainable public transport systems across countries like Germany, France, and the United Kingdom. The European Union’s green mobility policies are encouraging the rapid deployment of electric bus fleets. Leading manufacturers are also expanding their presence in this region, supporting local market growth. Europe’s focus on zero-emission cities strengthens its demand for electric buses.
Asia Pacific Electric Bus Market
The Electric Bus Market in Asia Pacific is forecast to grow from USD 22,790.81 million in 2024 to USD 57,296.07 million by 2032, with the highest regional CAGR of 12.24%. Asia Pacific holds a dominant market share of approximately 41.32% in 2024. China leads global and regional adoption with strong government mandates, large-scale manufacturing, and well-established charging infrastructure. India and Japan are expanding their electric bus fleets to address rising urban pollution. It benefits from high-volume production and cost-effective electric bus solutions in this region. Asia Pacific remains the largest and fastest-growing regional market for electric buses.
Latin America Electric Bus Market
The Electric Bus Market in Latin America is set to grow from USD 2,696.97 million in 2024 to USD 5,880.06 million by 2032, registering a CAGR of 10.33%. Latin America holds a market share of approximately 4.89% in 2024. Countries such as Brazil, Mexico, and Chile are investing in electric bus fleets to reduce urban air pollution and cut operating costs. It is gaining from government-backed programs and partnerships with private companies focused on sustainable mobility. The region is expanding its charging infrastructure, supporting the steady growth of electric bus operations. Latin America’s electric bus deployments are concentrated in major urban centers.
Middle East Electric Bus Market
The Electric Bus Market in the Middle East is projected to grow from USD 1,908.32 million in 2024 to USD 4,140.22 million by 2032, with a CAGR of 10.26%. The Middle East holds a market share of approximately 3.46% in 2024. Countries like the United Arab Emirates and Saudi Arabia are investing in electric buses as part of national sustainability goals. It is benefiting from government initiatives to modernize public transport and reduce reliance on fossil fuels. The region is building dedicated charging stations to support electric bus fleets. Middle Eastern cities are focusing on integrating electric buses into smart city development plans.
Africa Electric Bus Market
The Electric Bus Market in Africa is forecast to grow from USD 1,096.28 million in 2024 to USD 2,226.49 million by 2032, at a CAGR of 9.35%. Africa holds a market share of approximately 1.99% in 2024. The market is expanding slowly due to limited infrastructure and budget constraints in many countries. South Africa and Egypt are leading the region’s early electric bus adoption efforts. It is gradually gaining traction as governments begin to prioritize sustainable urban transportation solutions. Growth remains steady as more international partnerships and funding programs support infrastructure development across the continent.
Key players
- BYD Company Limited
- AB Volvo
- Proterra
- Nissan Motor Corporation
- Ashok Leyland Limited
- Daimler Truck AG
- Zhengzhou Yutong Bus Co., Ltd.
- TATA Motors Limited
- Hyundai Motor Company
Competitive Analysis
The Global Electric Bus Market is highly competitive, with several key players focusing on expanding their product portfolios and strengthening their global presence. It is led by companies like BYD Company Limited, AB Volvo, Proterra, and Zhengzhou Yutong Bus Co., Ltd., which are known for their advanced electric bus solutions and large production capacities. Manufacturers are prioritizing battery technology improvements, fast-charging solutions, and energy-efficient designs to meet growing demand. Strategic collaborations, product launches, and regional expansions are common approaches adopted by these players to increase market share. Competition is also intensifying with new entrants and partnerships between local governments and global companies. The market rewards manufacturers who can offer cost-effective, reliable, and innovative electric bus models. Competitive positioning is strongly influenced by product differentiation, supply chain efficiency, and after-sales support.
Recent Developments
- In February 2025, Zhengzhou Yutong Bus Co., Ltd. delivered 27 E12PRO battery electric buses to Lahore, Pakistan, marking the first e-bus deployment in Punjab Province.
- In March 2024, Volvo launched the Volvo BZR, a full-size, zero-emission electric bus and coach platform. Production of this platform is slated to begin in 2025. The BZR platform is designed to be versatile, suitable for both city and intercity applications, and emphasizes safety, sustainability, and reliability.
Market Concentration and Characteristics
The Global Electric Bus Market is moderately concentrated, with a few dominant players controlling a significant share. It features strong competition among established manufacturers focused on large-scale production and technological leadership. The market is characterized by rapid innovation, growing government support, and increasing demand for zero-emission public transport solutions. Product differentiation through battery performance, charging speed, and vehicle range plays a critical role in market positioning. It offers opportunities for both global and regional players to expand by meeting local transport needs and regulatory standards. Strategic partnerships and long-term supply agreements are key characteristics that shape competitive dynamics in this market.
Shape Your Report to Specific Countries or Regions & Enjoy 30% Off!
Report Coverage
The research report offers an in-depth analysis based on Type, Application, End-use, Battery Type and Region. It details leading market players, providing an overview of their business, product offerings, investments, revenue streams, and key applications. Additionally, the report includes insights into the competitive environment, SWOT analysis, current market trends, as well as the primary drivers and constraints. Furthermore, it discusses various factors that have driven market expansion in recent years. The report also explores market dynamics, regulatory scenarios, and technological advancements that are shaping the industry. It assesses the impact of external factors and global economic changes on market growth. Lastly, it provides strategic recommendations for new entrants and established companies to navigate the complexities of the market.
Future Outlook
- The Global Electric Bus Market will experience accelerated growth driven by increasing environmental regulations and urban pollution control efforts worldwide.
- Advances in battery technology will enhance electric bus range and reduce charging times, improving operational efficiency for fleet operators.
- Government incentives and subsidies will continue to lower the initial cost barriers, encouraging wider adoption across both developed and emerging markets.
- Expansion of charging infrastructure, including fast-charging and wireless solutions, will support large-scale deployment and seamless bus operations.
- Integration of smart fleet management systems will optimize route planning and energy consumption, reducing operational costs and improving service reliability.
- Emerging markets in Asia Pacific, Latin America, and Africa will gain significant traction due to urbanization and growing focus on sustainable transportation.
- Collaboration between public transport authorities and private manufacturers will accelerate innovation and facilitate customized electric bus solutions.
- Increased focus on battery recycling and second-life applications will address sustainability concerns related to electric bus battery disposal.
- The rise of autonomous electric buses will open new opportunities for cost savings and enhanced passenger safety in the near future.
- Competitive dynamics will intensify, pushing manufacturers to differentiate through technology, cost efficiency, and comprehensive after-sales support.


