
Motorcycle taxis and cashless apps anchor trip demand
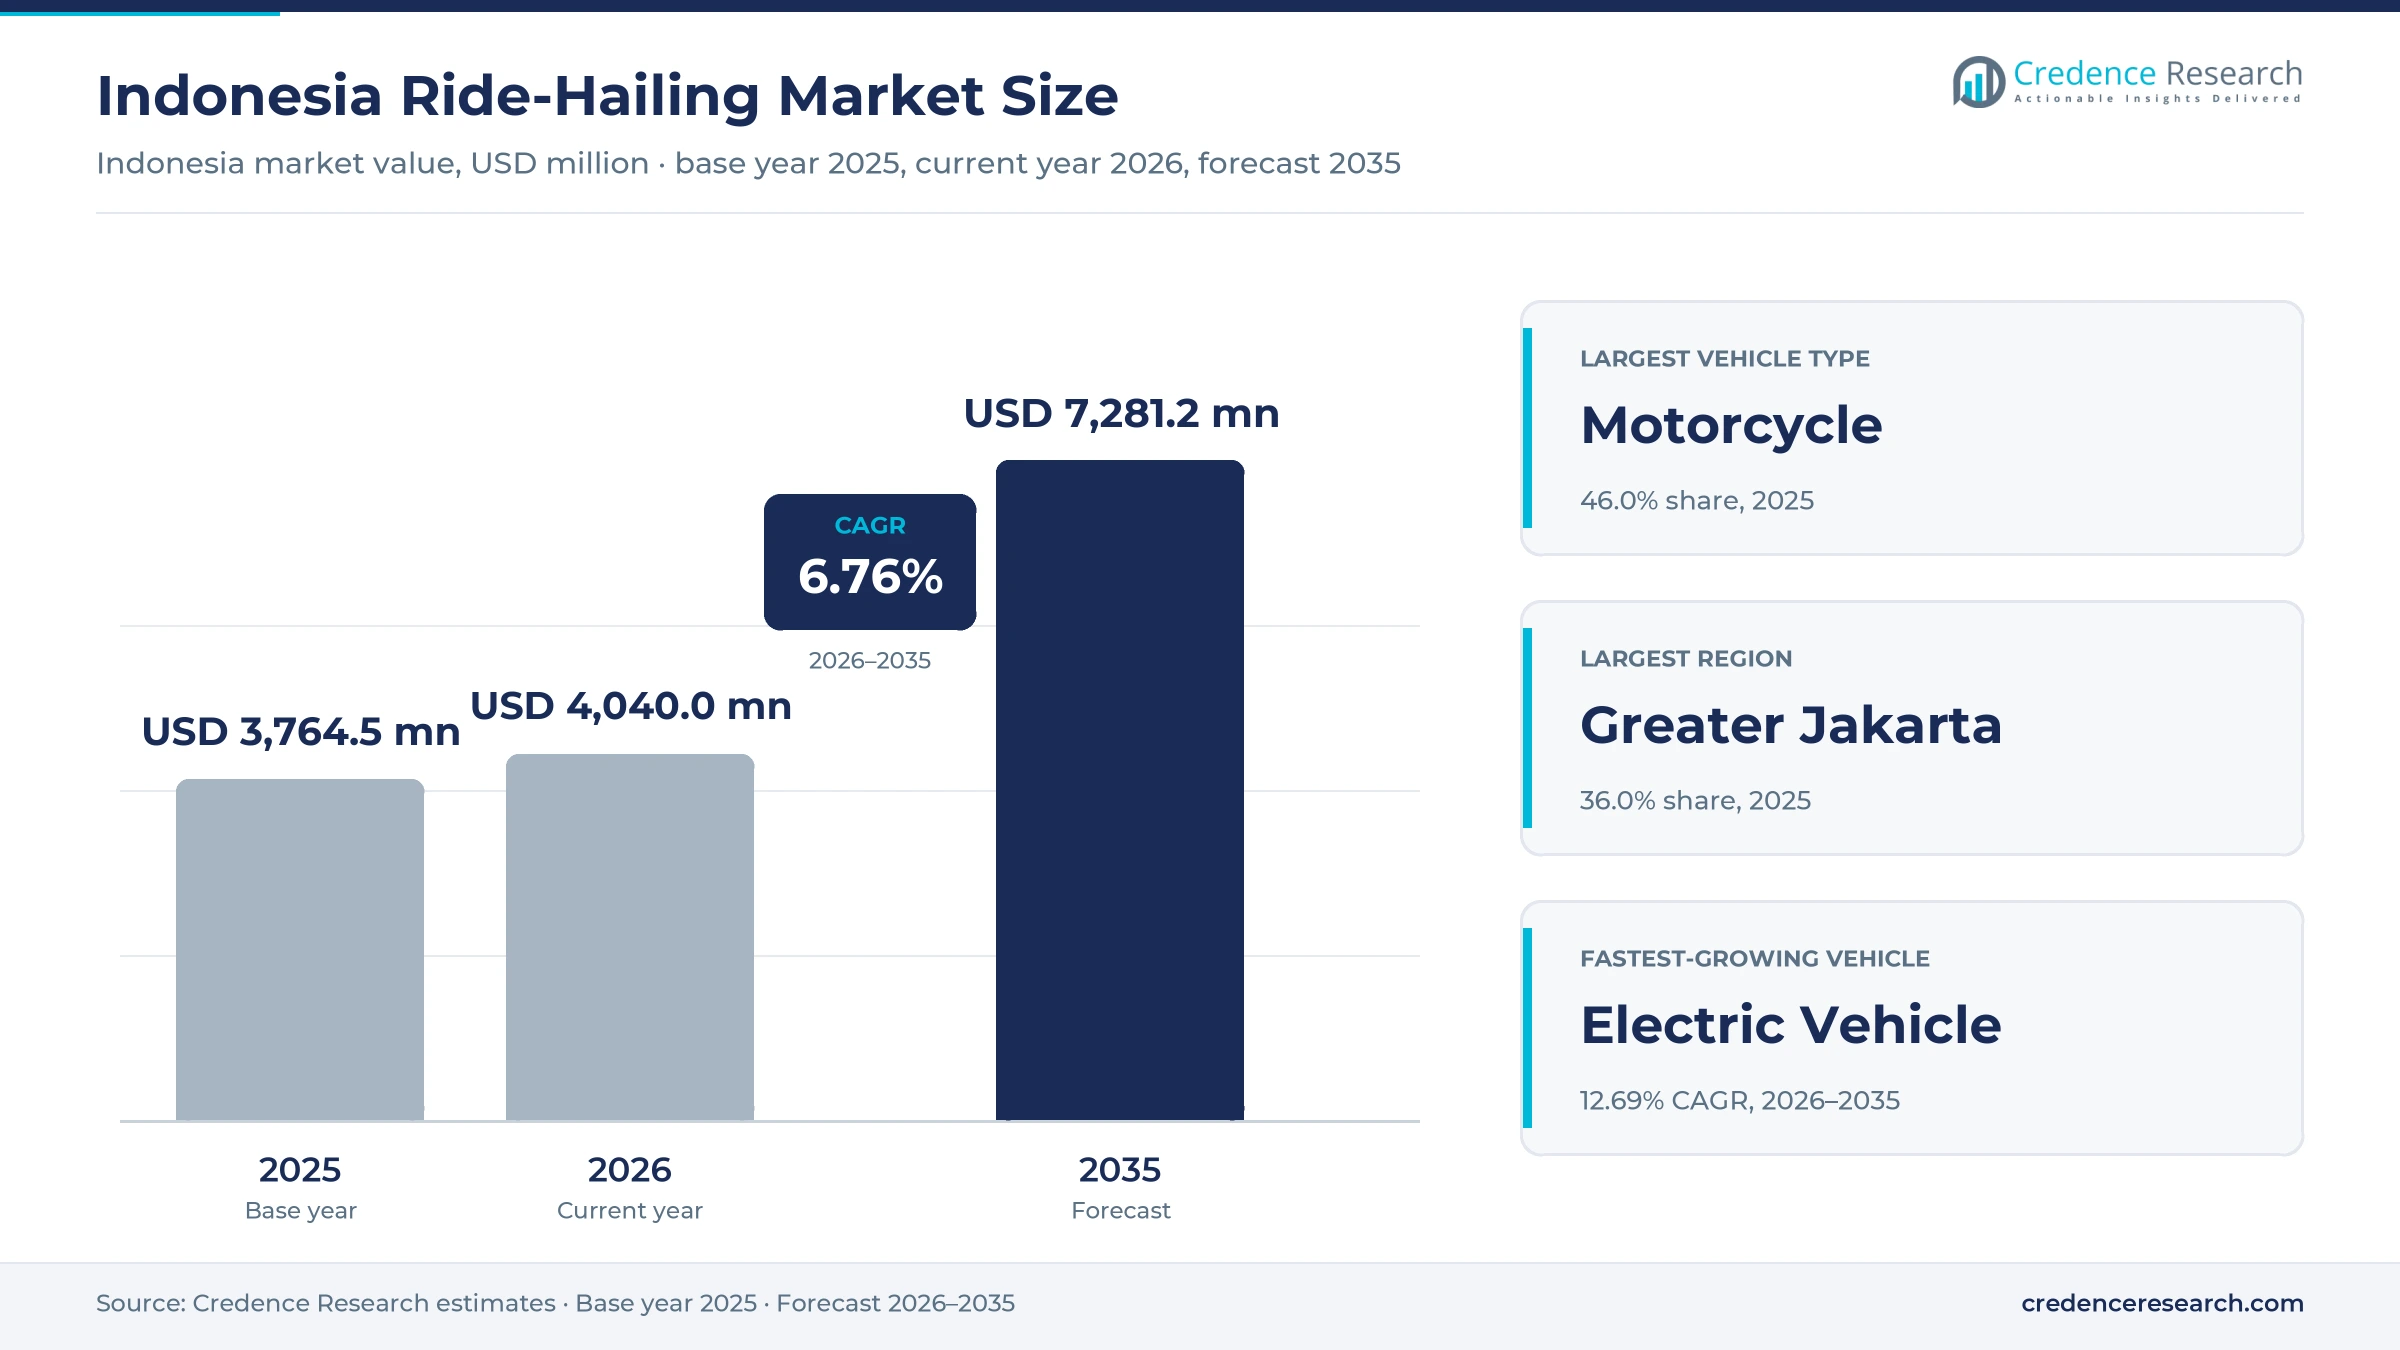
The Indonesia ride-hailing market was valued at USD 3.76 billion in 2025 and is projected to increase from USD 4.04 billion in 2026 to USD 7.28 billion by 2035, registering a CAGR of 6.76% during 2026–2035. Demand comes from urban commuters, students, office workers, tourists and families who book motorcycle taxis and cars through apps instead of owning a second vehicle or waiting for buses. Greater Jakarta held the largest regional share, 36.0% in 2025, because the capital region combines the densest trip demand, the highest incomes and the busiest rail feeder points. Kalimantan, Sulawesi and Eastern Indonesia is the fastest-growing region at 7.55% a year, as platforms add cities beyond Java. Presidential Regulation No. 27 of 2026 caps the commission on two-wheel passenger trips at 8%, down from 20%, which is shifting platform pricing and driver earnings from July 2026.
Which trips, vehicles and fares does the estimate cover?
The estimate measures gross passenger spending on ride-hailing trips booked through mobile apps or digital dispatch in Indonesia, including motorcycle taxis, private-car rides, app-booked metered taxis and electric fleets. It counts the full fare paid by riders, including platform fees, before the driver and platform split.
The estimate excludes food and parcel delivery, car rental without a driver, intercity buses and street-hail trips paid without digital booking. The value chain runs from vehicle makers, lessors and fleet partners through driver-partners and platforms to payment providers and the riders who complete each paid trip.
Indonesia Ride-Hailing Market Insights
- The Indonesia ride-hailing market was valued at USD 3.76 billion in 2025 and is projected to reach USD 7.28 billion by 2035, registering a CAGR of 6.76% during 2026–2035.
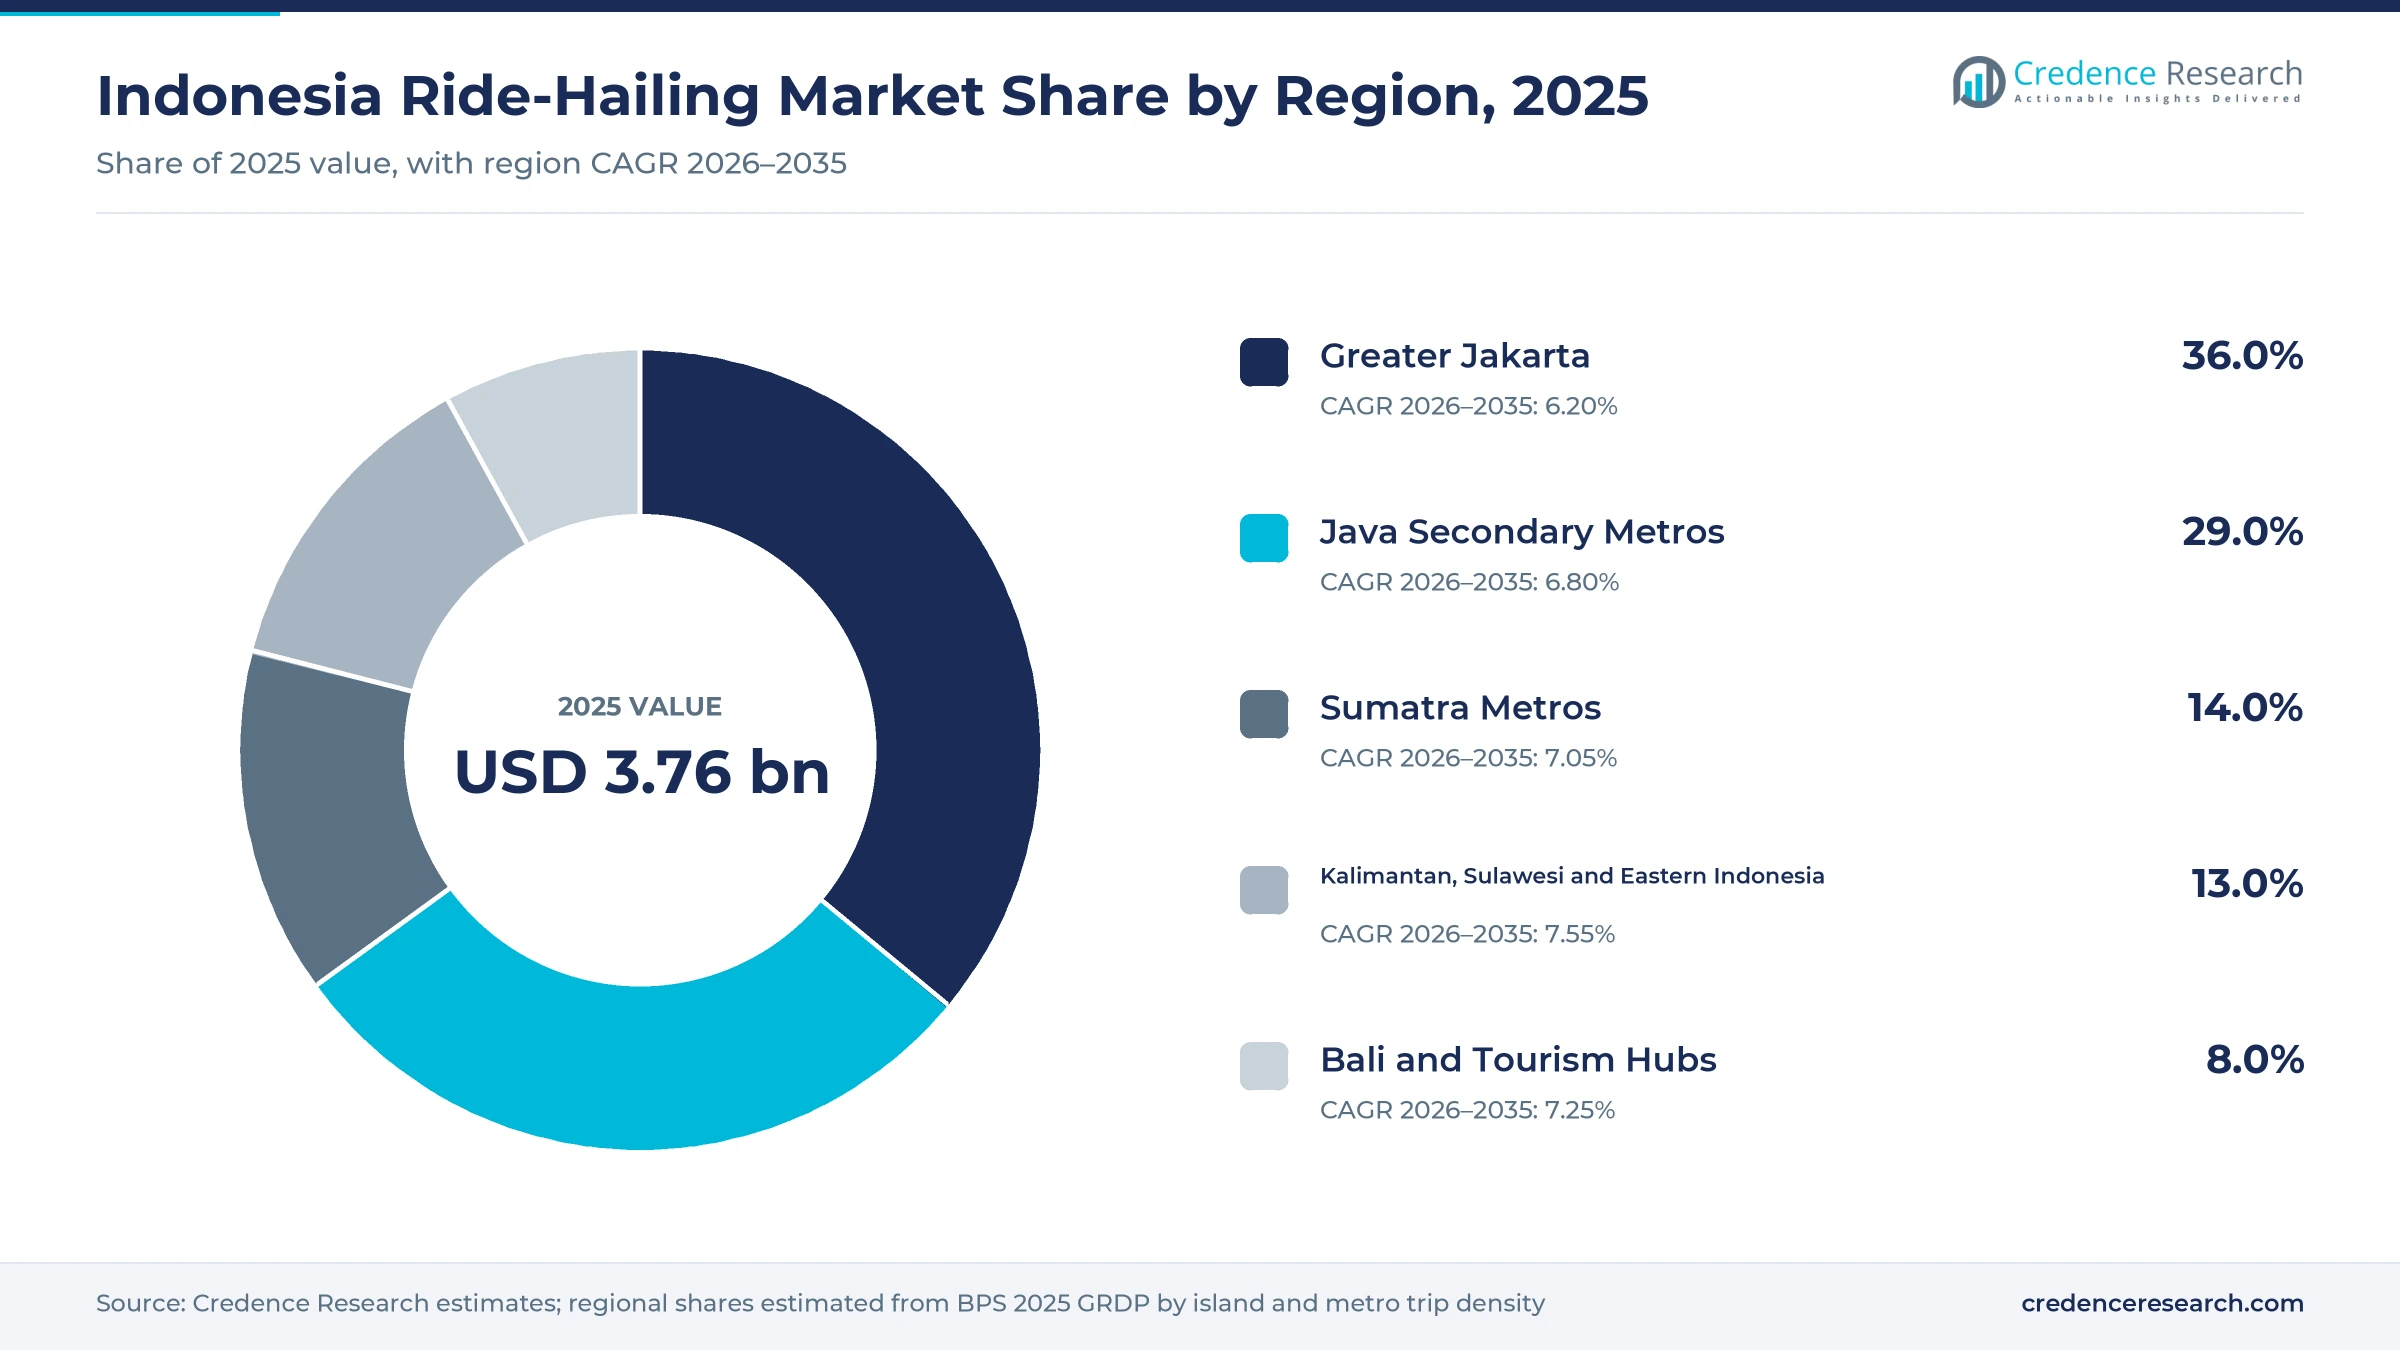
- Greater Jakarta held a 36.0% share of 2025 value, because the capital region carries the densest commuter flows and the highest fares per trip.
- Motorcycles led vehicle types with 46.0% of 2025 value, because two-wheel taxis cut through congestion at the lowest fare per kilometer.
- Presidential Regulation No. 27 of 2026, signed on May 1, 2026, caps the platform commission on two-wheel passenger trips at 8%, down from 20%.
- GoTo surpassed 10,000 electric vehicles in its driver-partner fleet by early 2026, while Grab holds access to up to 50,000 BYD electric cars across six markets.
Motorcycles lead while electric fleets grow fastest
Why do motorcycles dominate trip value?
Based on vehicle type, the market is categorized into motorcycle, compact car, MPV and SUV, metered taxi and electric vehicle. Motorcycle led with 46.0% of 2025 value, because ojek trips are cheap, fast in traffic and available in almost every city. Electric Vehicle grows fastest at 12.69% a year, because platforms, Bluebird and Green SM are adding battery electric fleets with financing support.
How do point-to-point rides compare with feeder trips?
Based on service type, the market is categorized into point-to-point rides, airport and station transfers, corporate mobility, first- and last-mile feeder, and hourly chauffeur services. Point-to-Point Rides led with 68.0% of 2025 value, because most trips link homes, offices, campuses and malls directly. First- and Last-Mile Feeder grows fastest at 8.03% a year, as MRT, commuter rail and bus ridership rises in Greater Jakarta.
Which riders account for most spending?
Based on customer type, the market is categorized into individual commuters, students and young adults, corporate accounts, tourists and visitors, and families and group travelers. Individual Commuters led with 48.0% of 2025 value, because daily work trips create repeat bookings. Tourists and Visitors grow fastest at 7.49% a year, because record air arrivals in Bali lift airport and resort trips.
How do fixed fares and bidding models split value?
Based on pricing model, the market is categorized into fixed upfront fare, dynamic pricing, rider-driver bidding, subscription and ride pass, and metered fare. Fixed Upfront Fare led with 52.0% of 2025 value, because Gojek and Grab quote the fare before each booking. Rider-Driver Bidding grows fastest at 7.96% a year, as inDrive and Maxim widen offers where riders propose their own price.
| Segment Group | Leading Sub-segment | Share, 2025 | Fastest-growing Sub-segment | CAGR, 2026–2035 |
|---|---|---|---|---|
| By Vehicle Type | Motorcycle | 46.0% | Electric Vehicle | 12.69% |
| By Service Type | Point-to-Point Rides | 68.0% | First- and Last-Mile Feeder | 8.03% |
| By Customer Type | Individual Commuters | 48.0% | Tourists and Visitors | 7.49% |
| By Pricing Model | Fixed Upfront Fare | 52.0% | Rider-Driver Bidding | 7.96% |
Request a Free Sample
Fill in your details and we'll send you a free sample report.
- Sample data tables & charts
- Research methodology
Digital access, ojek economics and cheaper rides lift trips
How do mass digital access and cashless payments lift bookings?
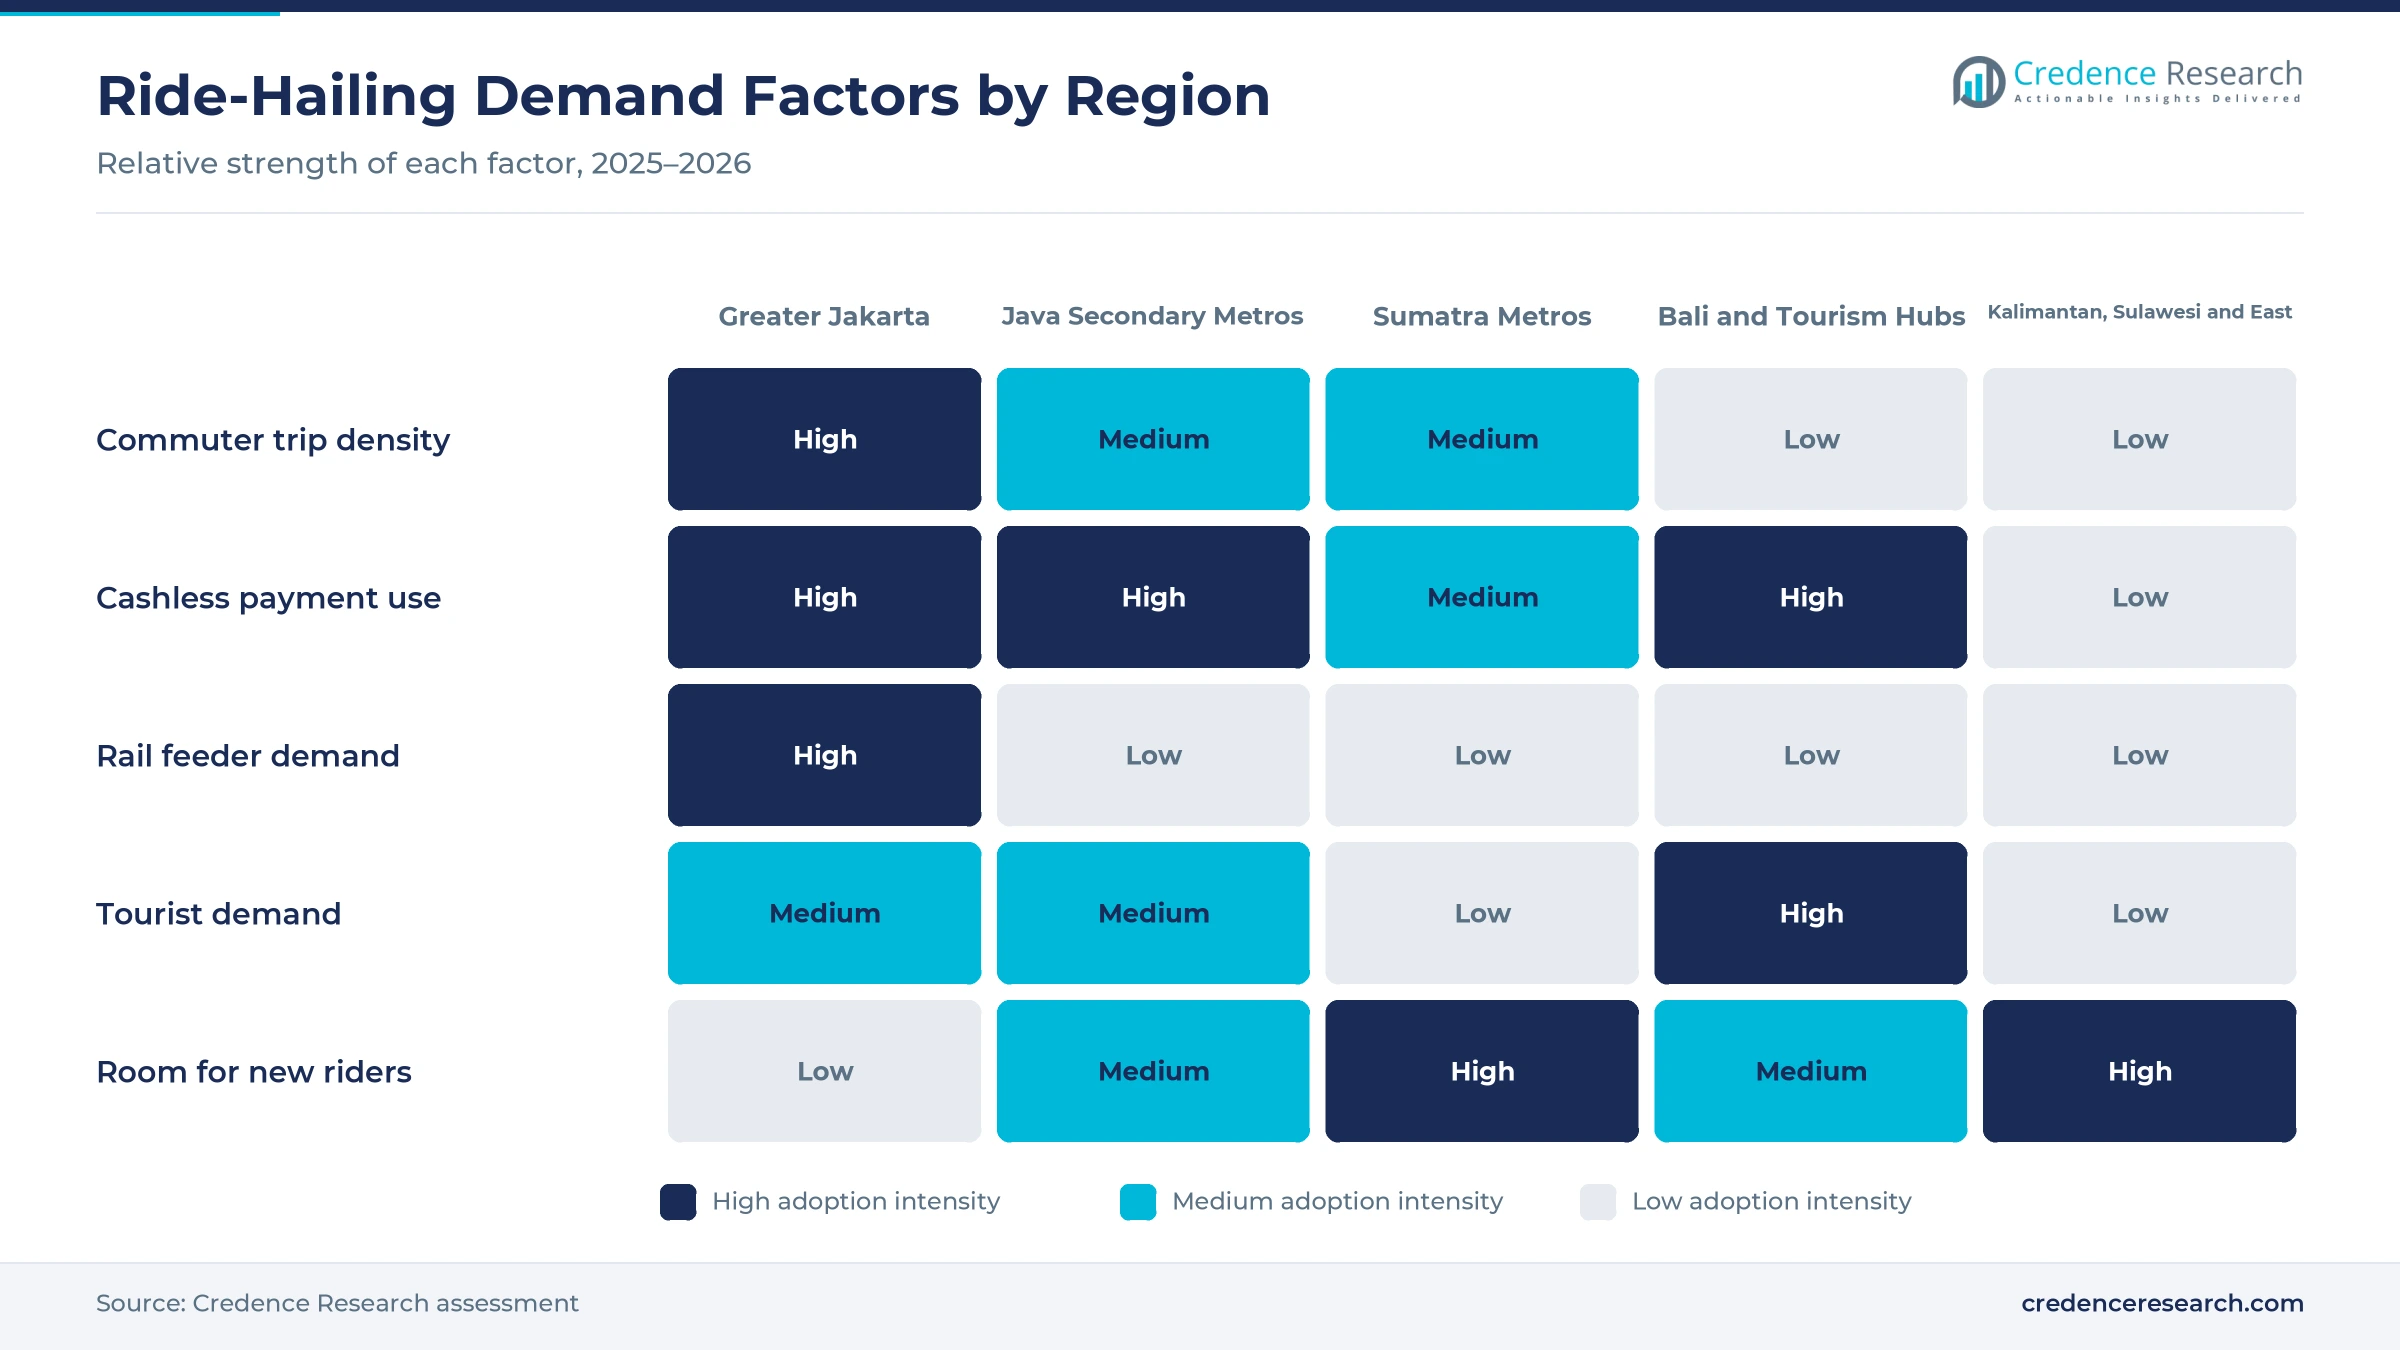
Wide smartphone use and cashless wallets let riders book and pay for trips in seconds, which turns casual riders into frequent users. Indonesia counted 229.43 million internet users in 2025, a penetration of 80.66%, according to the APJII survey reported by Bisnis.com. Bank Indonesia Governor Perry Warjiyo said in May 2025 that transactions over the QRIS national QR standard rose 154.86% in April 2025 from a year earlier. Urban residents made up 59.4% of the population in 2025, according to World Bank data, so the base of app-ready city riders keeps widening. As a result, fixed upfront fares held 52.0% of 2025 value, because riders now see and pay the price inside the app.
Why do motorcycle-led urban economics favor ride-hailing?
Motorcycles are the default way to move through Indonesian cities, which gives two-wheel taxis a huge pool of vehicles and drivers. Indonesia had 139.45 million registered motorcycles in 2024, according to BPS land transport statistics, against about 166 million motor vehicles in total. The government also treats ojek drivers as a core part of the economy, because President Prabowo Subianto asked platforms in March 2025 to pay holiday bonuses to online drivers and couriers. GoTo later said 400,000 eligible driver-partners would receive holiday allowances ahead of Lebaran 2026. In turn, motorcycles led vehicle types with 46.0% of 2025 value, because two-wheel trips are cheaper and faster in congested traffic.
How do platform expansion and affordable formats widen use?
Platforms keep adding cheaper ride tiers and new service formats, which pulls price-sensitive riders into the market. Gojek tested a GoRide Hemat driver subscription program in November 2025 and expanded it in February 2026 to support its budget ride tier. Grab ran a similar Akses Hemat subscription for GrabBike drivers and kept the GrabBike Hemat rider option after ending that subscription in May 2026. Maxim also says its office network reaches more than 310 cities, with an office in each provincial capital. GoTo reported that its mobility gross transaction value rose 7% in 2025, as budget tiers kept riders booking. As a result, students and young adults remain a large rider group, while rider-driver bidding grows fastest among pricing models at 7.96% a year.
Why does the tourism rebound support airport and resort trips?
Tourists rarely own vehicles at their destination, which makes them high-value ride-hailing users for airport, hotel and attraction trips. Bali received about 7.05 million foreign air arrivals in 2025, up from 6.33 million in 2024, according to the Ministry of Tourism citing BPS Bali data. Green SM also lists Bali among its six Indonesian operating areas, adding an electric car option for visitors on the island. Airport and station transfers carry longer distances and higher fares than daily commuter trips. In turn, tourists and visitors grow fastest among customer types at 7.49% a year, while Bali and Tourism Hubs grows at 7.25% a year.
Driver revenue rules and electric fleets reshape supply
How is the shift to electric fleets changing supply?
Platforms and fleet operators are moving drivers into battery electric motorcycles and cars, which lowers running costs per kilometer. GoTo said it surpassed its target of 10,000 electric vehicles in its driver-partner fleet, according to its full-year 2025 results release. Grab signed a partnership with BYD in January 2025 that gives drivers access to up to 50,000 electric cars across six markets, including Indonesia. Bluebird ran more than 300 battery electric taxis in December 2024 and planned to add 1,000 electric vehicles during 2025. As a result, electric vehicles grow fastest among vehicle types at 12.69% a year, alongside wider use of electric two-wheelers by driver-partners.
Why is the rise of driver-protective revenue rules notable?
Government action on commissions is shifting value from platforms toward drivers, which changes how fares and incentives are set. Drivers protesting on May 20, 2025 demanded that the app commission fall from 20% to 10%. On June 30, 2025, the Director General of Land Transportation said fares for two-wheel trips would rise by up to 15%, depending on which of three fare zones applies. Presidential Regulation No. 27 of 2026 then capped the commission at 8%, and Gojek and Grab agreed to apply it to two-wheel passenger trips from July 1, 2026, according to Hukumonline. In turn, both platforms ended their driver subscription programs in May 2026, and point-to-point rides keep 68.0% of 2025 value.
Can first- and last-mile feeder trips open new demand?
Rail and bus networks in Greater Jakarta create short trips between stations, homes and offices, which suits motorcycle taxis well. MRT Jakarta carried 46.5 million passengers in 2025, an average of about 127,000 a day, and targets 50 million in 2026, according to its president director. Platforms already set pickup points at stations, so each new rail line adds predictable feeder demand at peak hours. Wider mobility-as-a-service planning in the region also favors combined rail and ride bookings. As a result, first- and last-mile feeder trips grow fastest among service types at 8.03% a year, while Greater Jakarta remains the largest region by value.
Is there room to grow in secondary and outer-island cities?
Cities outside Greater Jakarta still have lower ride frequency, which gives platforms room to add riders and drivers. Green SM, which launched electric taxis in Jakarta on Dec. 18, 2024, according to Vingroup, now also operates in Makassar, Surabaya, Bali, Bandar Lampung and Palembang. inDrive said its Indonesian user numbers grew by double digits in 2026, after it added intercity trips, courier and financial services in 2025. Maxim's provincial offices also train local drivers and handle rider reports in these cities. Many of these cities have thin public transport, so app rides often replace informal ojek bases and minibuses. In turn, outer-island cities grow faster than Java, while Sumatra Metros grows at 7.05% a year.
Commission caps, consolidation and patchy access set limits
How does the commission cap squeeze platform economics?
The cap sharply cuts platform income on each two-wheel trip, which reduces the funds available for promotions and rider discounts. Gojek and Grab feel this most, because motorcycle trips form the largest share of their ride volume. As a result, platforms may adjust budget ride fares and trim incentives in some cities. Both companies are responding by ending driver subscriptions and leaning on payments and delivery income to support the ride business.
Why does consolidation create uncertainty for the market?
Minister of State Secretary Prasetyo Hadi confirmed on Nov. 7, 2025 that a merger between Grab and GoTo was planned, with Danantara expected to take part. Riders, drivers and smaller platforms face uncertainty, because a combined leader could reshape fares and driver incentives. At the same time, the competition regulator KPPU has warned that any merger must not create a monopoly. Smaller rivals such as Maxim and inDrive are building national networks to stay relevant if the market consolidates.
How do driver protests and welfare costs affect operations?
Driver groups have staged large protests over commissions and earnings, including the demonstration of May 20, 2025 in Jakarta. Riders lose service during protest days, while platforms face higher holiday bonus, insurance and support costs. As a result, platforms must balance driver pay against fares that riders can afford. The new regulation adds social security for drivers, which may reduce disputes if the new split is applied consistently across companies.
Why does uneven digital access limit outer-island growth?
Nearly one in five Indonesians still had no internet access in 2025, according to APJII survey results, and gaps are widest outside Java. Riders in smaller cities on Kalimantan, Sulawesi and Eastern Indonesia therefore book fewer trips and use more cash. In turn, platforms need more driver supply and local marketing to build demand there. Wider mobile coverage and QRIS acceptance should narrow this gap before 2030.
Greater Jakarta leads while outer islands grow fastest
| Region | Value, 2025 (USD billion) | Share, 2025 | CAGR, 2026–2035 |
|---|---|---|---|
| Greater Jakarta | 1.36 | 36.0% | 6.20% |
| Java Secondary Metros | 1.09 | 29.0% | 6.80% |
| Sumatra Metros | 0.53 | 14.0% | 7.05% |
| Kalimantan, Sulawesi and Eastern Indonesia | 0.49 | 13.0% | 7.55% |
| Bali and Tourism Hubs | 0.30 | 8.0% | 7.25% |
Why does Greater Jakarta hold the largest share of spending?
Greater Jakarta held 36.0% of 2025 value and grows at 6.20% a year, because the capital region combines the densest commuter flows, the highest incomes and the most rail feeder points. MRT Jakarta alone carried 46.5 million passengers in 2025, and many riders finish their journey on a motorcycle taxi. Green SM launched electric taxis in Jakarta in December 2024 and electric scooter rides there in September 2026. As a result, Jakarta remains the main testing ground for new ride formats.
How do Java secondary metros add volume?
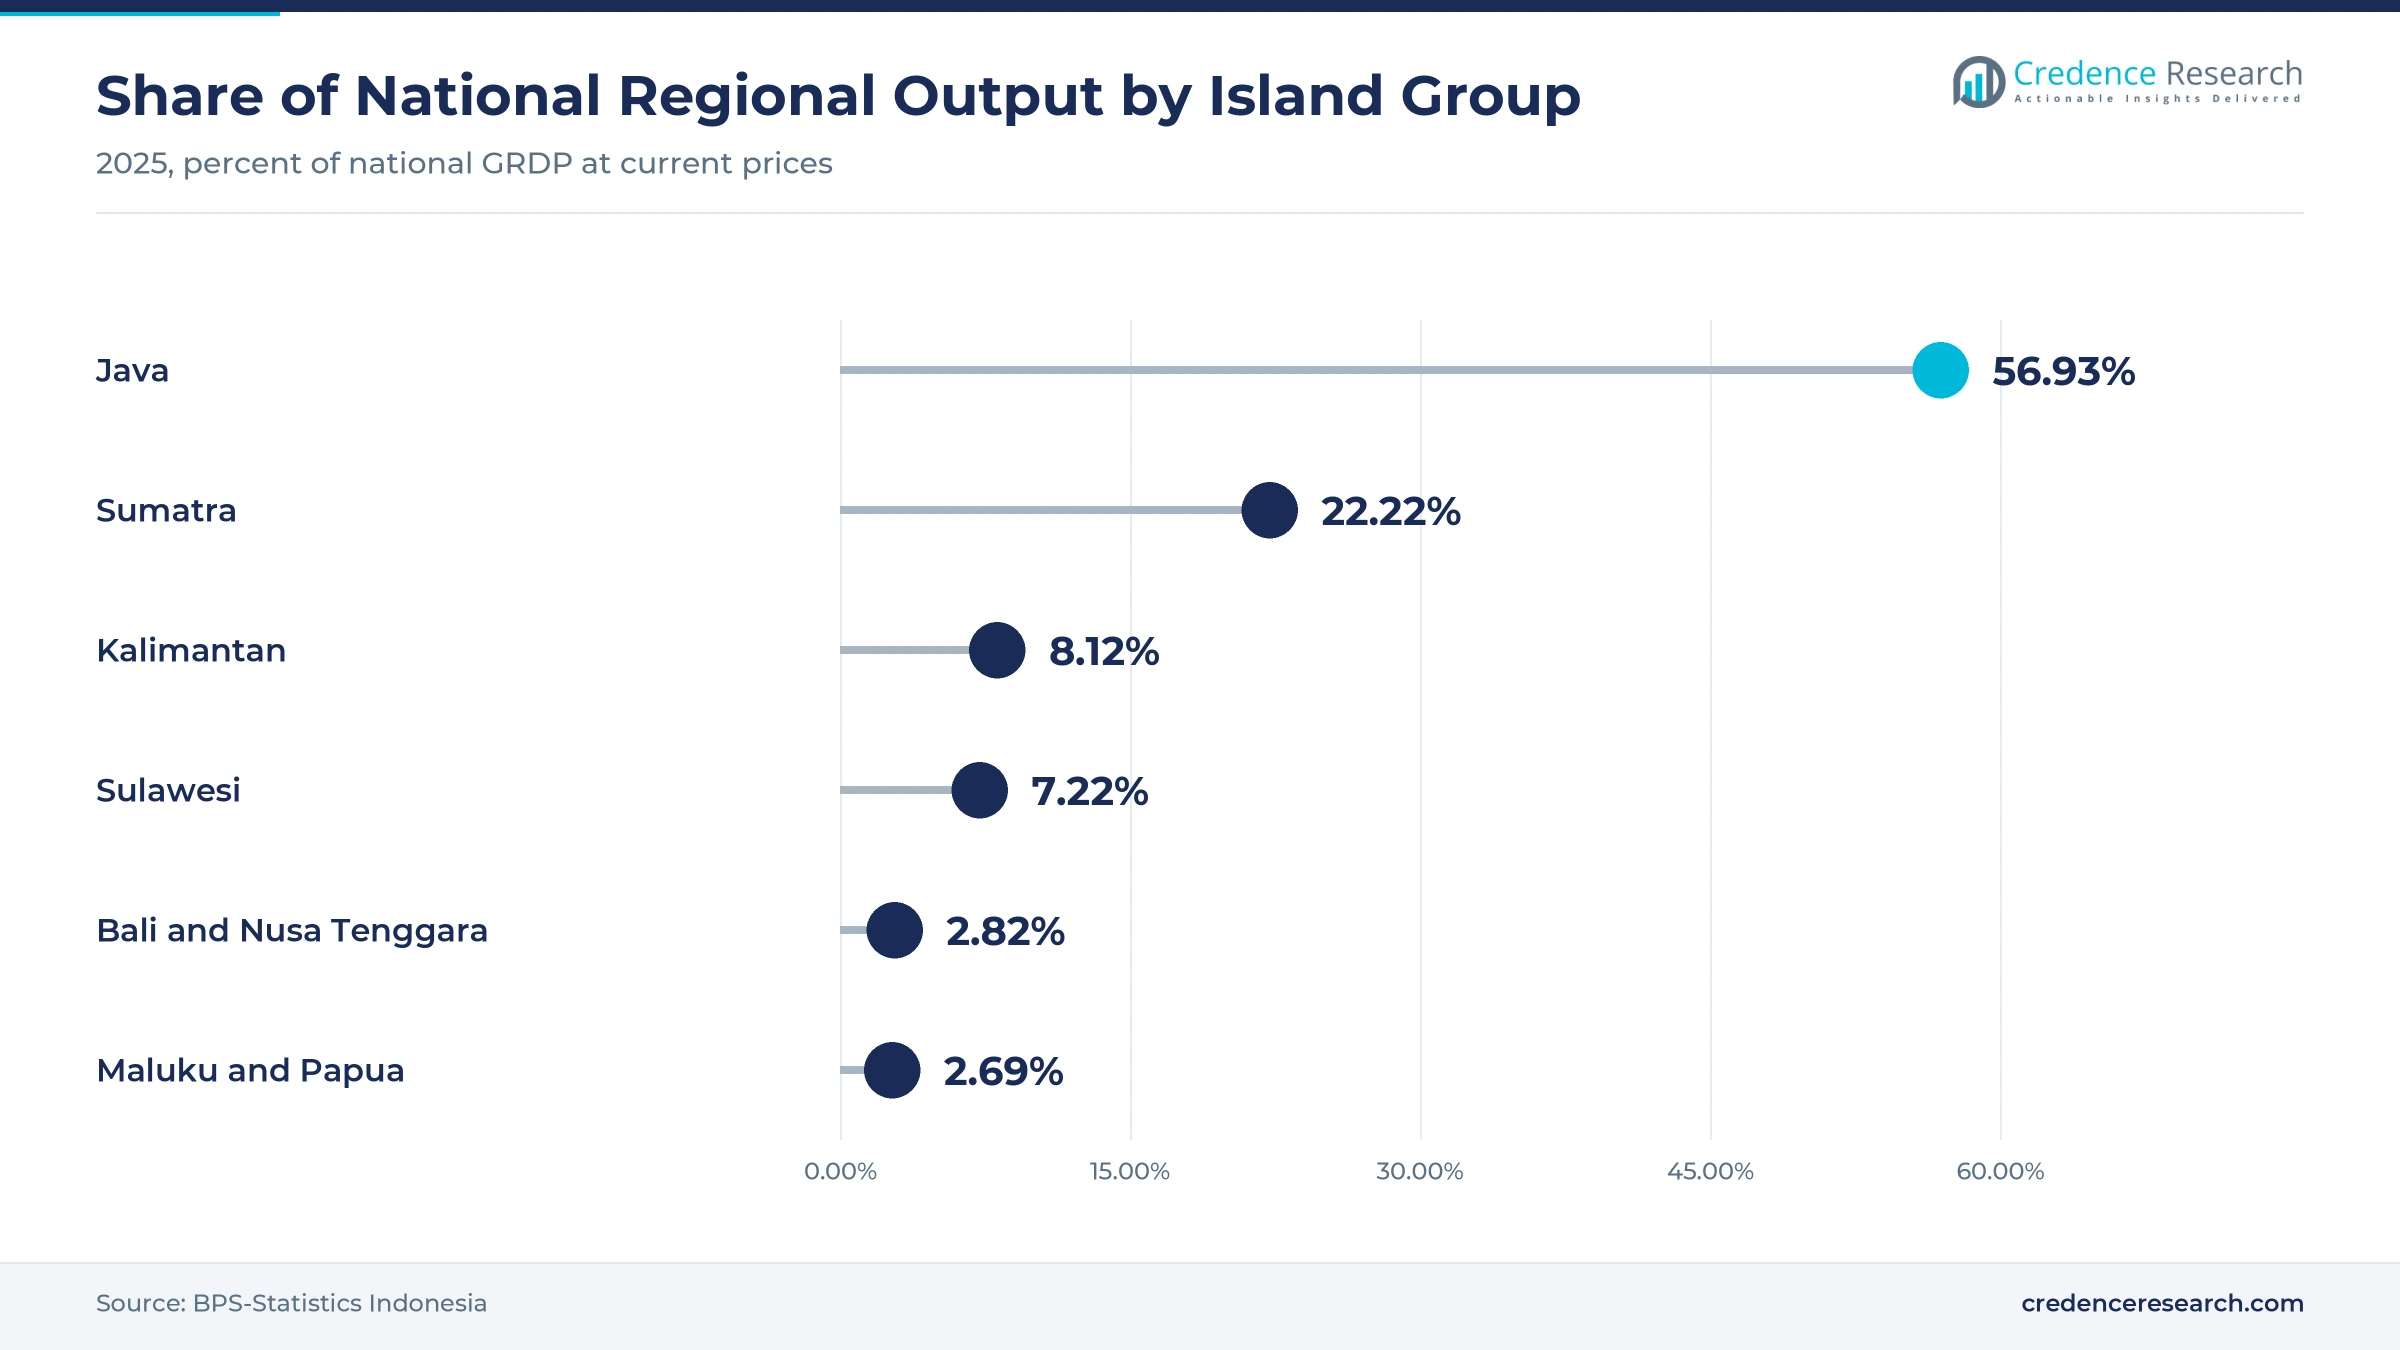
Java Secondary Metros held 29.0% of 2025 value and grows at 6.80% a year, because Surabaya, Bandung, Semarang and Yogyakarta host large student and worker populations. Java as a whole produced 56.93% of national regional output in 2025, according to BPS data. Green SM lists Surabaya among its operating cities, adding electric car supply in East Java. In turn, these cities add steady volume at fares below Jakarta levels.
Why are Sumatra metros a second growth base?
Sumatra Metros held 14.0% of 2025 value and grows at 7.05% a year, because Medan, Palembang and Bandar Lampung are large cities with rising app use. Sumatra produced 22.22% of national regional output in 2025, according to BPS data. Green SM began operating in Palembang in September 2026 and also serves Bandar Lampung. As a result, Sumatra is the next region where new entrants test demand outside Java.
How do Bali and tourism hubs lift average fares?
Bali and Tourism Hubs held 8.0% of 2025 value and grows at 7.25% a year, because visitors take longer airport and resort trips at higher fares. Bali received about 7.05 million foreign air arrivals in 2025, up from 6.33 million in 2024. Tourist trips also link with car rental and chauffeur bookings for day tours. In turn, the region adds value faster than its share of national output suggests.
What drives growth across Kalimantan, Sulawesi and the east?
Kalimantan, Sulawesi and Eastern Indonesia held 13.0% of 2025 value and grows fastest at 7.55% a year, because ride-hailing use is still catching up with Java. Kalimantan and Sulawesi produced 8.12% and 7.22% of national regional output in 2025, according to BPS data. Green SM operates an all-electric car fleet in Makassar, the largest city in Sulawesi. As a result, these cities offer the widest room for new riders.
New entrants, EV deals and a commission cap mark 2024–2026
| Development | Status and market relevance |
|---|---|
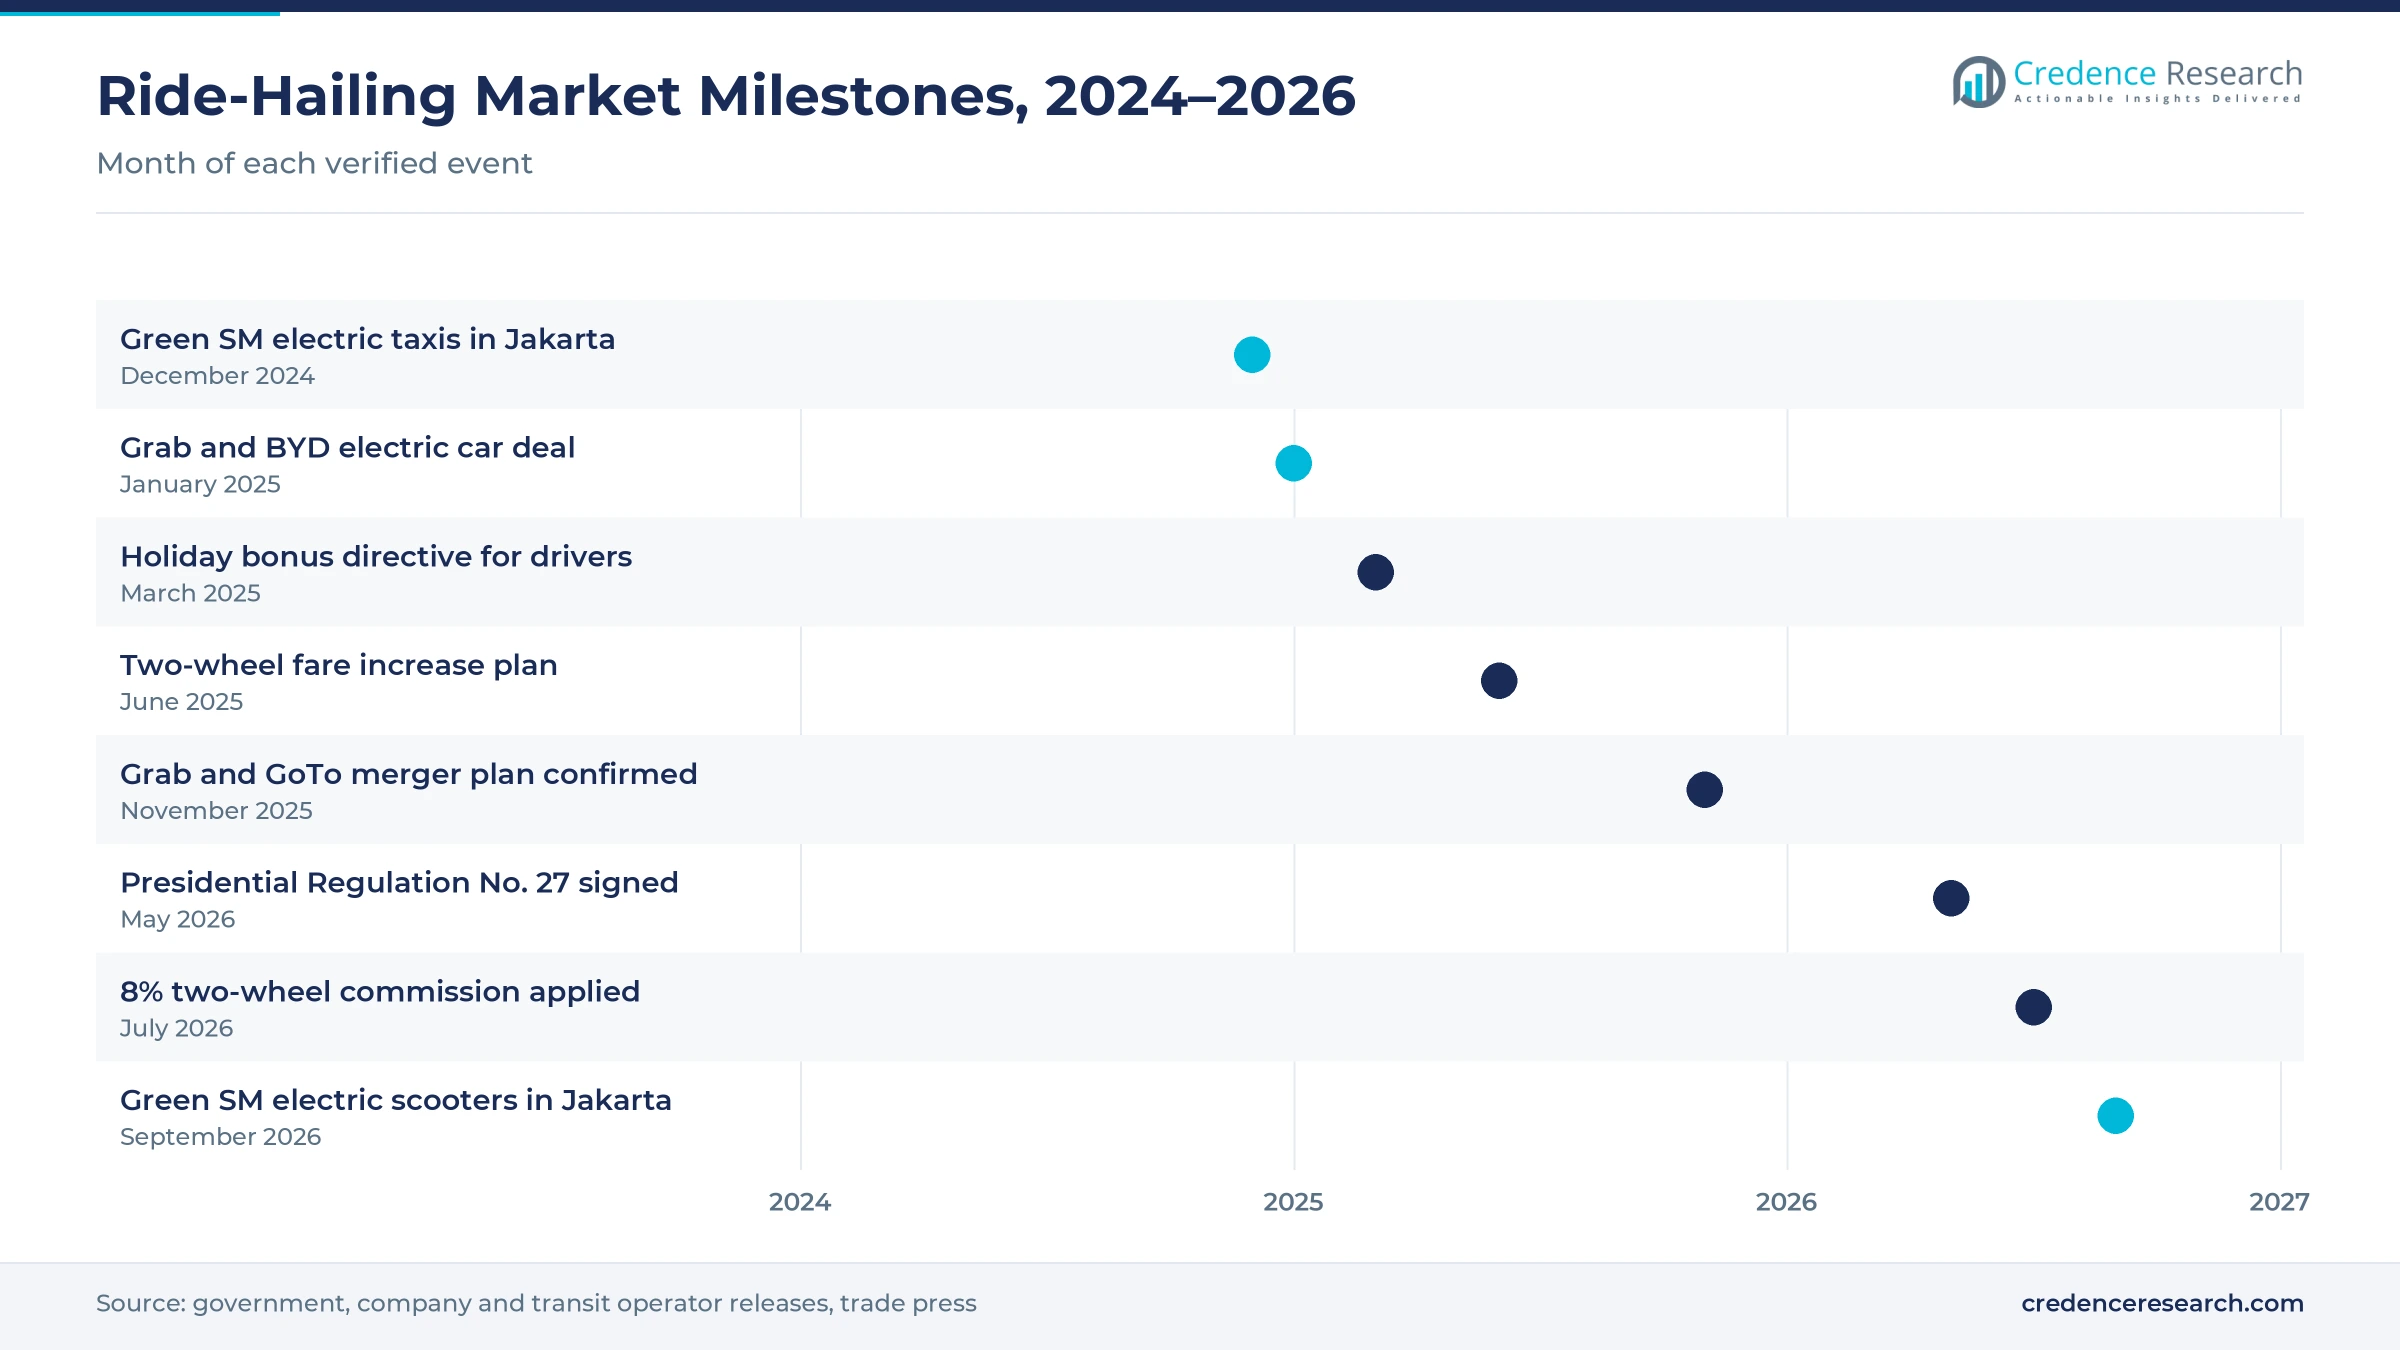
| In December 2024, Green SM launched electric taxi and ride-hailing services in Jakarta with VinFast Limogreen cars. | Adds a fully electric car operator to the capital |
| In January 2025, Grab and BYD agreed to give drivers access to up to 50,000 electric cars across six markets including Indonesia. | Supports lower-cost electric rides for driver-partners |
| In November 2025, the Minister of State Secretary confirmed plans for a merger between Grab and GoTo with Danantara involvement. | Talks continue under competition regulator scrutiny |
| In May 2026, President Prabowo Subianto signed Presidential Regulation No. 27 of 2026 on online driver protection. | Caps two-wheel commissions at 8% from July 2026 |
| In September 2026, Green SM rolled out electric scooter ride-hailing in Jakarta. | Brings a new electric two-wheel option to the main market |
Matching, payments and fleet tools run each trip
- Dispatch and matching engines assign the nearest motorcycle or car within seconds and set pickup points at busy stations and malls.
- Fare engines calculate fixed upfront prices, surge levels or rider bids, and must now follow zone tariffs and the new commission cap.
- Wallet and QRIS payments let riders pay inside the app or by QR code, which reduces cash handling for drivers.
- Electric fleet management tools track battery levels, swap stations and charging, which helps drivers on leased electric vehicles plan shifts.
Need a Custom Version of This Report?
Tailor the scope, geography, or segments to your exact requirements.
- Custom geography or segment scope
- Direct access to our analyst team
Gojek and Grab lead as low-fare and electric rivals push in
Competition centers on driver supply, fare levels, payment integration and city coverage. Grab Indonesia and GoTo's Gojek lead the market through two-wheel, car and budget ride tiers linked to their wallets. Both now apply the lower two-wheel commission cap from July 2026, which narrows the room for heavy rider discounts. Maxim competes on low fares and broad reach, with an office in every provincial capital and more than 310 cities served. inDrive differentiates through rider-driver bidding and intercity trips. PT Blue Bird Tbk anchors the metered taxi segment and is adding electric taxis, while Green SM Indonesia runs an all-electric fleet in six areas. Because motorcycles hold the largest share of 2025 value, operators with the deepest two-wheel driver pools keep the strongest position, while electric entrants compete on quality and newer vehicles.
Companies profiled and their roles in this market
| Company | Type | Role in the market |
|---|---|---|
| Gojek (PT GoTo Gojek Tokopedia Tbk) | National super-app | Runs GoRide and GoCar with over 10,000 EVs |
| Grab Indonesia | Regional super-app | Runs GrabBike and GrabCar with BYD electric supply |
| Maxim Indonesia | Low-fare platform | Serves more than 310 cities |
| inDrive Indonesia | Bidding platform | Offers rider-driver bidding and intercity trips |
| PT Blue Bird Tbk | Taxi operator | Runs metered taxis and adds electric cars |
| Green SM Indonesia | Electric fleet operator | Runs electric cars and scooters in six areas |
Ojek trip economics outlast the commission reset
Credence Research's view is that ride-hailing spending in Indonesia will grow steadily because motorcycle taxis remain the cheapest way to move through crowded cities and cashless payments keep spreading. The lower commission cap shifts value toward drivers and may limit platform discounts, yet trip demand should hold. Electric fleets should grow fastest as Gojek, Grab, Bluebird and Green SM add vehicles. Outer-island cities should outpace Greater Jakarta in growth as platforms add drivers there. However, a Grab and GoTo merger could reshape competition, so operators with strong driver pools and wallets should gain the most.
Platform filings and official statistics anchor the model
The report uses 2025 as the base year on a calendar basis, and market values come from the Credence Research model. That model draws on listed-company filings, official statistics on population, internet use, vehicles and regional output, and government regulations on fares and commissions. Segment splits and all regional shares and growth rates are Credence Research estimates, with regional shares derived from BPS output by island and metro trip density. Sources used are government and central bank statements, statistics agency data, World Bank data, company releases and trade press, and no interviews or surveys were used.
Electric fleets and secondary cities carry growth to 2035
Ride-hailing spending is expected to reach USD 7.28 billion by 2035, a 6.76% CAGR during 2026–2035, as riders in more cities shift daily trips to apps. Growth should stay steady through 2030 as rail feeder trips, tourism and secondary cities add demand. After that, electric motorcycles and cars should carry a much larger share of trips as charging and battery swap networks spread. A consolidated market would change fares and incentives, while stable commission rules would support driver supply. Electric vehicles are expected to gain the most share among vehicle types through 2035.
Frequently Asked Questions
How big is the Indonesia ride-hailing market?
Do motorcycles or cars earn more ride-hailing spending?
Where in Indonesia do riders spend the most on app trips?
What does Presidential Regulation No. 27 of 2026 change?
How quickly are electric motorcycles and cars joining fleets?
Which trip type is gaining fastest?
Which platforms compete for Indonesian riders?
What could slow growth in app-booked rides?
Table of Content
Chapter 1 Market Segmentation
- 1.1 Segmentation Framework
- 1.1.1 Product and Service Classification
- 1.1.2 Application and End-Use Classification
- 1.1.3 Technology and Solution Classification
- 1.1.4 Customer and Distribution Channel Classification
- 1.1.5 Geographic Segmentation
- 1.1.6 Market Segment Definitions and Boundaries
- 1.2 By Vehicle Type
- 1.2.1 Motorcycle
- 1.2.2 Compact Car
- 1.2.3 MPV and SUV
- 1.2.4 Metered Taxi
- 1.2.5 Electric Vehicle
- 1.3 By Service Type
- 1.3.1 Point-to-Point Rides
- 1.3.2 Airport and Station Transfers
- 1.3.3 Corporate Mobility
- 1.3.4 First- and Last-Mile Feeder
- 1.3.5 Hourly Chauffeur Services
- 1.4 By Customer Type
- 1.4.1 Individual Commuters
- 1.4.2 Students and Young Adults
- 1.4.3 Corporate Accounts
- 1.4.4 Tourists and Visitors
- 1.4.5 Families and Group Travelers
- 1.5 By Pricing Model
- 1.5.1 Fixed Upfront Fare
- 1.5.2 Dynamic Pricing
- 1.5.3 Rider-Driver Bidding
- 1.5.4 Subscription and Ride Pass
- 1.5.5 Metered Fare
Chapter 2 Introduction
- 2.1 Report Objectives and Scope
- 2.2 Product Definition and Industry Terminology
- 2.3 Market Inclusions and Exclusions
- 2.4 Research Process
- 2.4.1 Primary Research and Expert Interviews
- 2.4.2 Secondary Research and Source Review
- 2.4.3 Top-Down and Bottom-Up Estimation
- 2.4.4 Data Triangulation and Verification
- 2.5 Market Size Measurement Basis
- 2.5.1 2025: USD 3.76 billion → 2035: USD 7.28 billion
- 2.6 Historical and Forecast Reference Periods
- 2.6.1 Historical Period: 2018-2025
- 2.6.2 Base Year: 2025
- 2.6.3 Forecast Period: 2025-2035
- 2.7 Research Assumptions and Limitations
Chapter 3 Executive Summary
- 3.1 Market Snapshot and Key Findings
- 3.2 Base-Year Market Size, 2025
- 3.3 Forecast Market Size, 2035
- 3.4 Revenue and Volume Growth Outlook
- 3.5 Key Demand and Supply Indicators
- 3.6 Leading Market Segments
- 3.7 Fastest-Growing Market Opportunities
- 3.8 Regional Performance Highlights
- 3.9 Technology and Industry Transformation
- 3.10 Competitive Landscape Summary
- 3.11 Analyst View and Strategic Implications
Chapter 4 Indonesia Ride-Hailing Market Trends and Developments
- 4.1 Historical Industry Development, 2018-2025
- 4.2 Recent Market Trends and Developments
- 4.3 Demand and Customer Behavior Trends
- 4.4 Technology and Product Innovation
- 4.5 Artificial Intelligence, Automation and Digitalization
- 4.6 Local Manufacturing and Supply Chain Realignment
- 4.7 Industry Partnerships, Mergers and Acquisitions
- 4.8 Sustainability and Circular Economy Developments
- 4.9 Government and Private Sector Investment Trends
- 4.10 Emerging Business Models and Commercialization
- 4.11 Industry Developments and Announcements
Chapter 5 Indonesia Ride-Hailing Market Production, Supply and Demand Analysis
- 5.1 Demand Trend and Consumption Analysis, 2018-2025
- 5.2 Demand Forecast, 2025-2035
- 5.3 Production and Output Trend, 2018-2025
- 5.4 Production and Output Forecast, 2025-2035
- 5.5 Installed Capacity and Capacity Utilization
- 5.6 Company-Wise Production Plants and Statistics
- 5.6.1 Installed Production Capacity
- 5.6.2 Actual Production
- 5.6.3 Planned Capacity and Expansion Targets
- 5.7 Supply Chain Structure and Procurement Trends
- 5.8 Supply-Demand Gap and Bottlenecks
- 5.9 Import Dependence and Sourcing Structure
- 5.10 Contract Manufacturing and Outsourcing
- 5.11 Regional Supply and Demand Concentration
Chapter 6 Indonesia Ride-Hailing Market Pricing Analysis
- 6.1 Pricing Structure and Measurement
- 6.2 Historical Pricing Trends, 2018-2025
- 6.3 Pricing Outlook, 2025-2035
- 6.4 Average Selling Price and Unit Economics
- 6.5 Pricing by Product and Market Segment
- 6.6 Geographic Pricing Differences
- 6.7 Key Input, Energy, Labor and Logistics Costs
- 6.8 Contract Pricing and Purchasing Models
- 6.9 Pricing Sensitivity and Competitive Positioning
- 6.10 Price, Margin and Profitability Implications
Chapter 7 Indonesia Ride-Hailing Market Dynamics
- 7.1 Market Growth Drivers
- 7.1.1 Demand-Side Drivers
- 7.1.2 Technology and Innovation Drivers
- 7.1.3 Infrastructure and Investment Drivers
- 7.1.4 Regulatory and Policy Drivers
- 7.2 Market Restraints
- 7.2.1 Cost and Affordability Constraints
- 7.2.2 Technology and Adoption Barriers
- 7.2.3 Supply Chain and Operational Constraints
- 7.3 Market Challenges
- 7.3.1 Competitive Pressure and Margin Erosion
- 7.3.2 Skills, Infrastructure and Implementation Gaps
- 7.4 Emerging Market Opportunities
- 7.5 Market Dynamics Impact and Time-Horizon Assessment
Chapter 8 Indonesia Ride-Hailing Value Chain Analysis
- 8.1 Industry Value Chain Overview
- 8.2 Upstream Suppliers and Critical Inputs
- 8.3 Technology and Component Providers
- 8.4 Manufacturing or Service Delivery
- 8.5 Distribution, Channel Partners and Integrators
- 8.6 Downstream Applications and End Users
- 8.7 Value Addition and Profit Pools
- 8.8 Vertical Integration and Outsourcing
- 8.9 Supplier Concentration and Risk
- 8.10 Supply Chain Localization and Resilience
Chapter 9 Indonesia Ride-Hailing Market Regulations and Policies
- 9.1 Relevant Laws, Standards and Compliance Frameworks
- 9.2 Product, Service, Safety and Quality Requirements
- 9.3 Government Policies, Incentives and Subsidies
- 9.4 Imports, Exports and Trade Barriers
- 9.5 Public Procurement and Local Content Requirements
- 9.6 Environmental and Sustainability Compliance
- 9.7 Upcoming Policy Changes and Market Implications
Chapter 10 Indonesia Ride-Hailing Market Hotspots and Opportunities
- 10.1 Market Opportunity Mapping and Growth Hotspots
- 10.2 High-Growth Applications and Customer Groups
- 10.3 Underserved Markets and White-Space Opportunities
- 10.4 Emerging Technology and Product Opportunities
- 10.5 New Capacity and Investment Hotspots
- 10.6 Market Entry and Expansion Opportunities
- 10.7 Distribution and Partnership Opportunities
- 10.8 Near-Term and Long-Term Commercial Potential
- 10.9 Opportunity Attractiveness and Execution Risks
Chapter 11 Indonesia Ride-Hailing Market Outlook, 2025-2035
- 11.1 Market Size and Analysis
- 11.1.1 Revenue (Market Measurement: 2025: USD 3.76 billion → 2035: USD 7.28 billion)
- 11.1.2 Market Volume and Quantity Sold
- 11.1.3 Historical Market Size, 2018-2025
- 11.1.4 Base-Year Market Size, 2025
- 11.2 Market Forecast, 2025-2035
- 11.2.1 Revenue Forecast to 2035
- 11.2.2 Volume Forecast to 2035
- 11.2.3 CAGR and Year-on-Year Growth
- 11.2.4 Incremental Revenue Opportunity
- 11.3 Forecast Assumptions and Scenario Analysis
- 11.3.1 Base-Case Forecast
- 11.3.2 Optimistic and Conservative Scenarios
- 11.3.3 Technology, Pricing and Policy Sensitivities
- 11.4 Market Attractiveness and Growth Outlook
Chapter 12 Indonesia Ride-Hailing Market Segmentation and Outlook
- 12.1 Segmentation Summary and Market Shares, 2025
- 12.2 Largest and Fastest-Growing Segments
- 12.3 By Vehicle Type - Market Size and Forecast, 2025-2035
- 12.3.1 Segment Definition and Scope
- 12.3.2 Historical Market Size, 2018-2025
- 12.3.3 Revenue Forecast, 2025-2035
- 12.3.4 Volume Forecast, 2025-2035
- 12.3.5 Base-Year Market Share, 2025
- 12.3.6 Segment CAGR and Growth Drivers
- 12.3.7 Subsegment Market Size and Forecast
- 12.3.7.1 Motorcycle
- 12.3.7.2 Compact Car
- 12.3.7.3 MPV and SUV
- 12.3.7.4 Metered Taxi
- 12.3.7.5 Electric Vehicle
- 12.3.8 Subsegment Pricing and Adoption Trends
- 12.3.9 Leading Suppliers and Competition
- 12.3.10 Regional Demand and Opportunities
- 12.4 By Service Type - Market Size and Forecast, 2025-2035
- 12.4.1 Segment Definition and Scope
- 12.4.2 Historical Market Size, 2018-2025
- 12.4.3 Revenue Forecast, 2025-2035
- 12.4.4 Volume Forecast, 2025-2035
- 12.4.5 Base-Year Market Share, 2025
- 12.4.6 Segment CAGR and Growth Drivers
- 12.4.7 Subsegment Market Size and Forecast
- 12.4.7.1 Point-to-Point Rides
- 12.4.7.2 Airport and Station Transfers
- 12.4.7.3 Corporate Mobility
- 12.4.7.4 First- and Last-Mile Feeder
- 12.4.7.5 Hourly Chauffeur Services
- 12.4.8 Subsegment Pricing and Adoption Trends
- 12.4.9 Leading Suppliers and Competition
- 12.4.10 Regional Demand and Opportunities
- 12.5 By Customer Type - Market Size and Forecast, 2025-2035
- 12.5.1 Segment Definition and Scope
- 12.5.2 Historical Market Size, 2018-2025
- 12.5.3 Revenue Forecast, 2025-2035
- 12.5.4 Volume Forecast, 2025-2035
- 12.5.5 Base-Year Market Share, 2025
- 12.5.6 Segment CAGR and Growth Drivers
- 12.5.7 Subsegment Market Size and Forecast
- 12.5.7.1 Individual Commuters
- 12.5.7.2 Students and Young Adults
- 12.5.7.3 Corporate Accounts
- 12.5.7.4 Tourists and Visitors
- 12.5.7.5 Families and Group Travelers
- 12.5.8 Subsegment Pricing and Adoption Trends
- 12.5.9 Leading Suppliers and Competition
- 12.5.10 Regional Demand and Opportunities
- 12.6 By Pricing Model - Market Size and Forecast, 2025-2035
- 12.6.1 Segment Definition and Scope
- 12.6.2 Historical Market Size, 2018-2025
- 12.6.3 Revenue Forecast, 2025-2035
- 12.6.4 Volume Forecast, 2025-2035
- 12.6.5 Base-Year Market Share, 2025
- 12.6.6 Segment CAGR and Growth Drivers
- 12.6.7 Subsegment Market Size and Forecast
- 12.6.7.1 Fixed Upfront Fare
- 12.6.7.2 Dynamic Pricing
- 12.6.7.3 Rider-Driver Bidding
- 12.6.7.4 Subscription and Ride Pass
- 12.6.7.5 Metered Fare
- 12.6.8 Subsegment Pricing and Adoption Trends
- 12.6.9 Leading Suppliers and Competition
- 12.6.10 Regional Demand and Opportunities
- 12.7 Segment Growth Comparison
- 12.8 Segment Attractiveness and Priority Matrix
Chapter 13 Indonesia Ride-Hailing End-Use and Application Market Outlook
- 13.1 End-Use Industry and Customer Demand Structure
- 13.2 Leading Applications and Customer Groups
- 13.3 End-Use Market Size, Share and Forecast
- 13.4 Major End-Use Industry Deep Dives
- 13.4.1 Customer Requirements and Use Cases
- 13.4.2 Demand and Replacement Cycles
- 13.4.3 Technical and Regulatory Considerations
- 13.4.4 Purchasing and Procurement Models
- 13.4.5 Leading Vendors and Distribution Channels
- 13.4.6 Forecast and Commercial Opportunities
- 13.5 Emerging Applications and Cross-Segment Demand
- 13.6 End-Use Industry Investment Priorities
Chapter 14 Indonesia Ride-Hailing Geographic Market Outlook, 2025-2035
- 14.1 Domestic Market Distribution and Demand Clusters
- 14.2 State- or Province-Wise Market Size and Forecast, 2025-2035
- 14.3 City and Metropolitan Market Outlook
- 14.4 Industrial, Manufacturing and Commercial Clusters
- 14.5 Geographic Concentration of Key End Users
- 14.6 Local Pricing and Purchasing Differences
- 14.7 Domestic Production Facilities and Capacity Map
- 14.8 Local Infrastructure and Project Pipeline
- 14.9 State-Level Policy and Incentive Differences
- 14.10 Subnational Investment Hotspots and Opportunities
- 14.11 Distribution and Logistics Networks
- 14.12 Domestic Competitive Footprint
Chapter 15 Indonesia Ride-Hailing Technology, Innovation and Sustainability Outlook
- 15.1 Technology Landscape and Maturity
- 15.2 Product, Process and Service Innovation
- 15.3 AI, Automation and Digital Tools in the Industry
- 15.4 Technology Adoption and Performance Benchmarking
- 15.5 Innovation Pipeline and R&D Investment
- 15.6 Patent and Intellectual Property Trends
- 15.7 Energy Efficiency and Resource Management
- 15.8 Sustainability, Recycling and Circularity
- 15.9 Technology Roadmap, 2025-2035
- 15.10 Risks of Obsolescence and Technology Substitution
Chapter 16 Indonesia Ride-Hailing Market Key Strategic Imperatives
- 16.1 Growth and Market Entry Priorities
- 16.2 High-Return Products and Segments
- 16.3 Pricing, Profitability and Cost Optimization
- 16.4 Technology Investment and Product Differentiation
- 16.5 Supply Chain Localization and Resilience
- 16.6 Distribution and Customer Acquisition
- 16.7 Partnership, Acquisition and Capacity Strategy
- 16.8 Regional Expansion Priorities
- 16.9 Short-, Medium- and Long-Term Actions
Chapter 17 Competition Outlook
- 17.1 Industry Competition Characteristics
- 17.2 Market Structure and Concentration
- 17.3 Market Share and Competitive Positioning, 2025
- 17.4 Company-Wise Revenue and Product Benchmarking
- 17.5 Production and Service Capacity Benchmarking
- 17.6 Technology, Pricing and Differentiation
- 17.7 Regional Footprint and Distribution Strength
- 17.8 Mergers, Acquisitions and Strategic Alliances
- 17.9 New Entrants and Competitive Threats
- 17.10 Porter's Five Forces and Industry Attractiveness
- 17.11 Competitive Outlook, 2025-2035
Chapter 18 Company Profiles
- 18.1 Company Coverage and Selection Criteria
- 18.2 Gojek (PT GoTo Gojek Tokopedia Tbk)
- 18.2.1 Business Description
- 18.2.2 Company Ownership and Geographic Presence
- 18.2.3 Product and Service Portfolio
- 18.2.4 Manufacturing and Operating Footprint
- 18.2.5 Production Capacity and Expansion Plans
- 18.2.6 Financial Performance and Investment
- 18.2.7 Market Share and Competitive Position
- 18.2.8 Technology and Innovation Capabilities
- 18.2.9 Strategic Alliances or Partnerships
- 18.2.10 Recent Developments
- 18.2.11 Growth Strategy and Outlook
- 18.3 Grab Indonesia
- 18.4 Maxim Indonesia
- 18.5 inDrive Indonesia
- 18.6 PT Blue Bird Tbk
- 18.7 Green SM Indonesia
- 18.8 NUJEK (PT Tekno Karya Nusa)
- 18.9 Anterin Digital Nusantara
- 18.10 PT Okejek Kreasi Indonesia
- 18.11 PT Draiv Indonesia Inc
- 18.12 Other Relevant Market Participants
Note: Every listed company is profiled on the structure shown under the first company. The company list is preliminary and may change based on research findings, market developments, data availability and client requirements.
Chapter 19 Disclaimer
- 19.1 Research and Forecast Disclaimer
- 19.2 Data Source and Estimation Limitations
Note: The depth of individual sections depends on data availability for this market. Volume, capacity, trade and other unit-based metrics are included where applicable.

