
A mature clothing market that still grows with the South
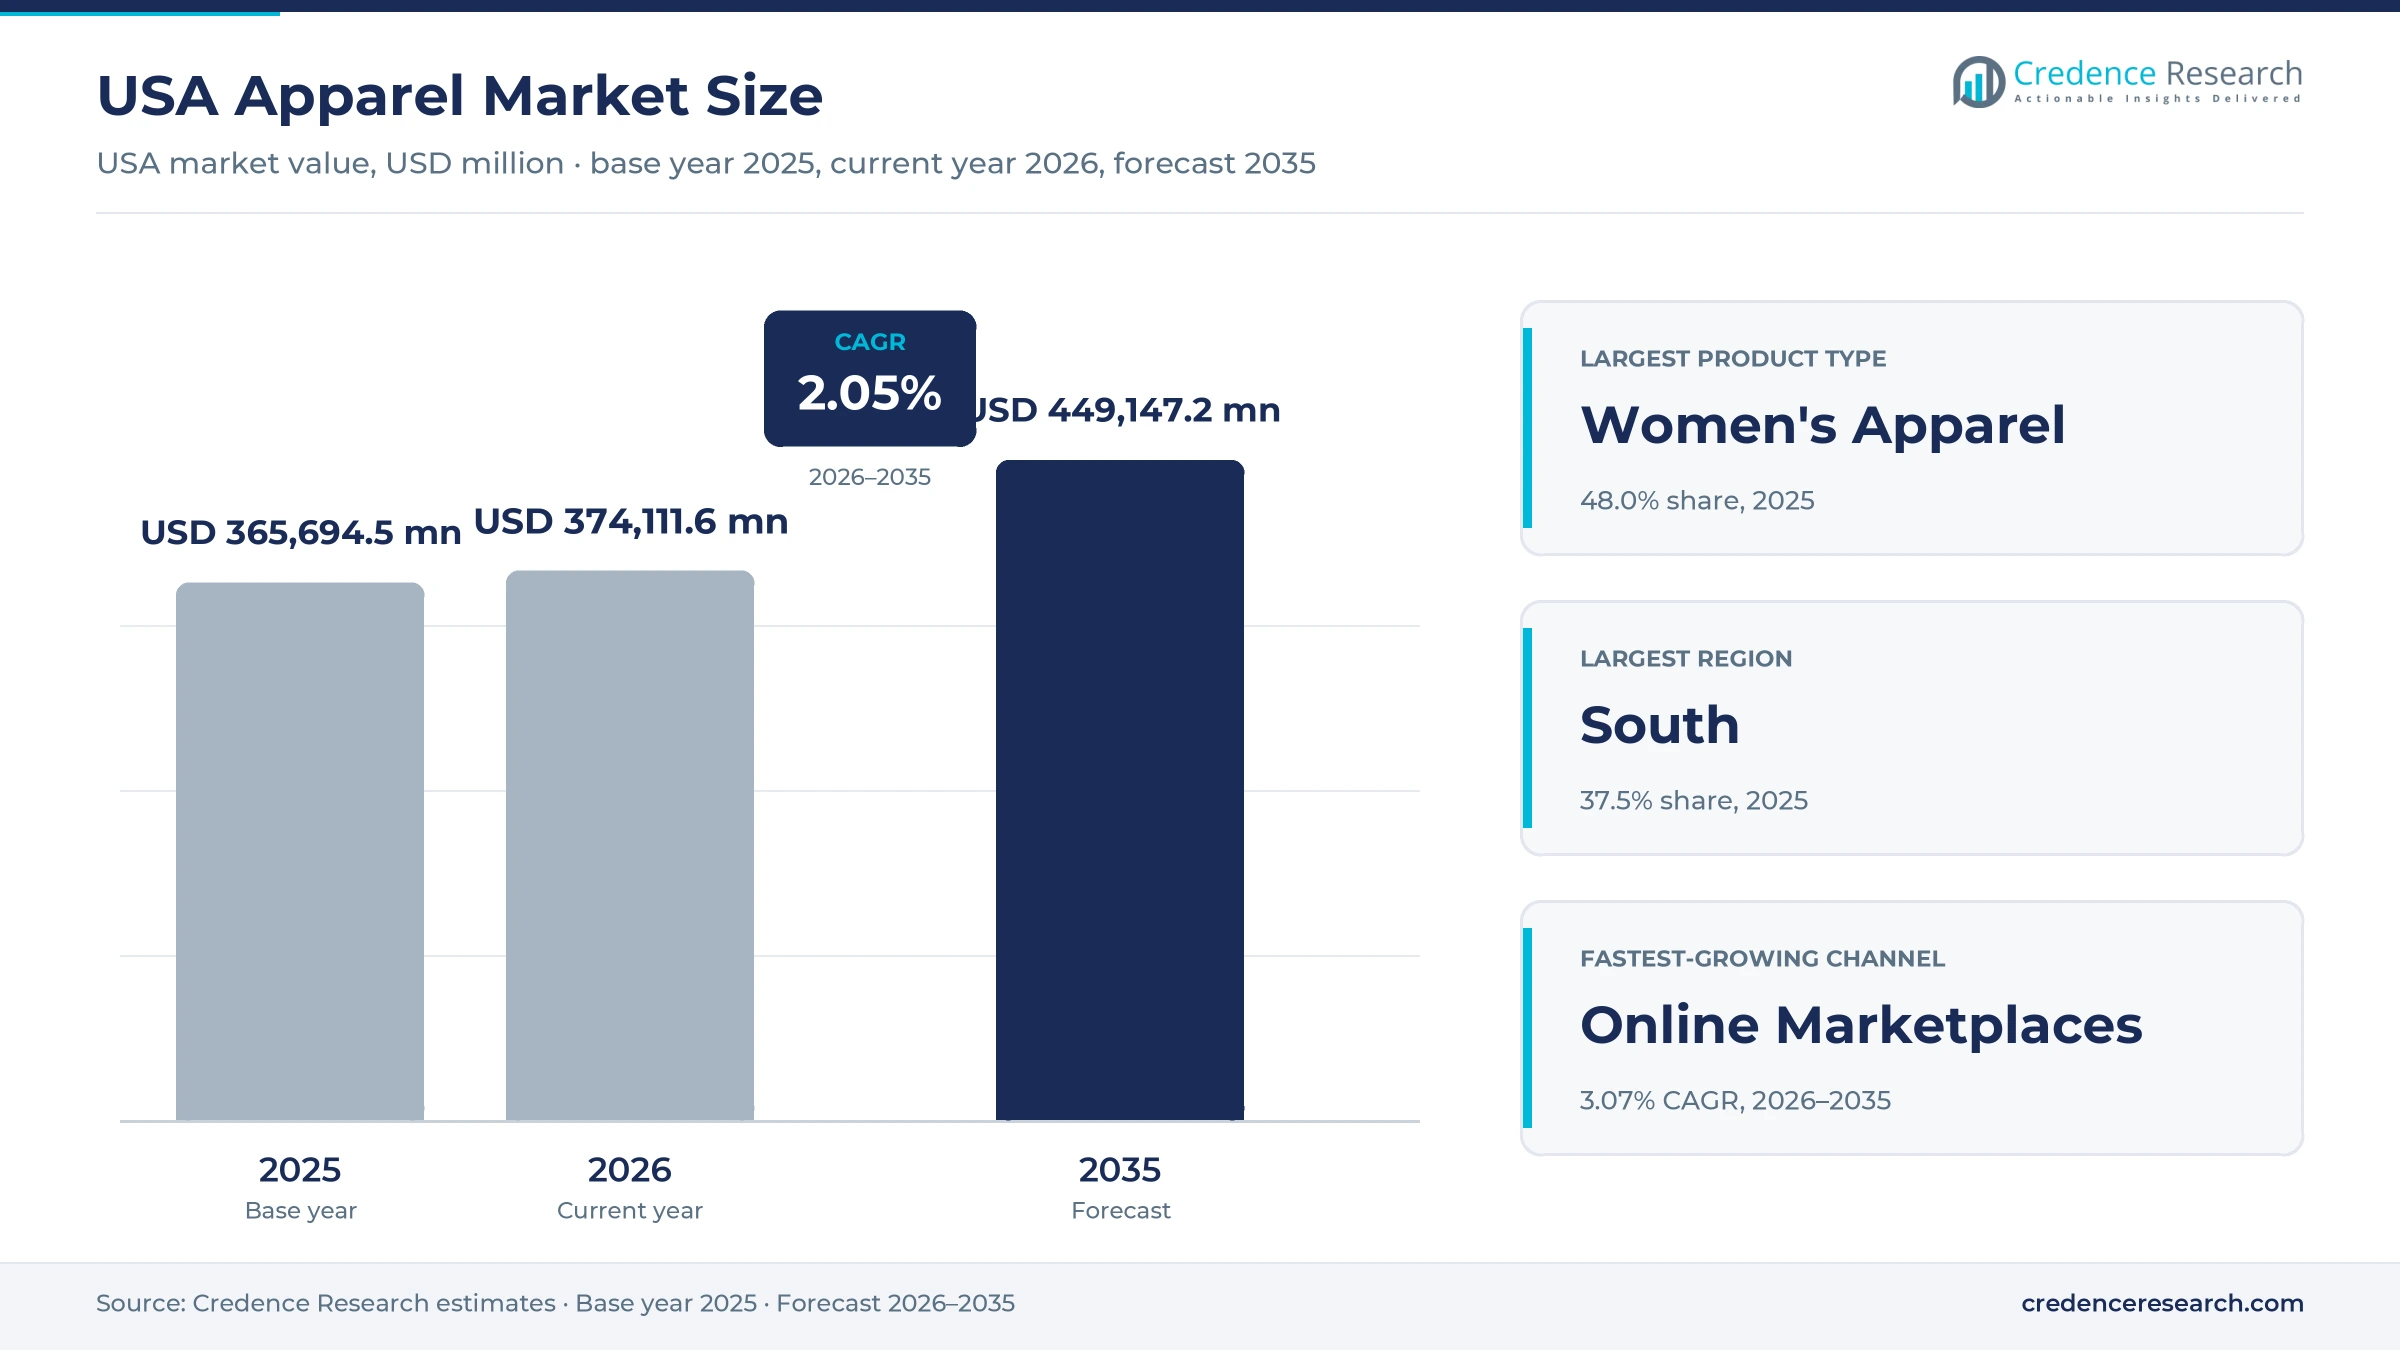
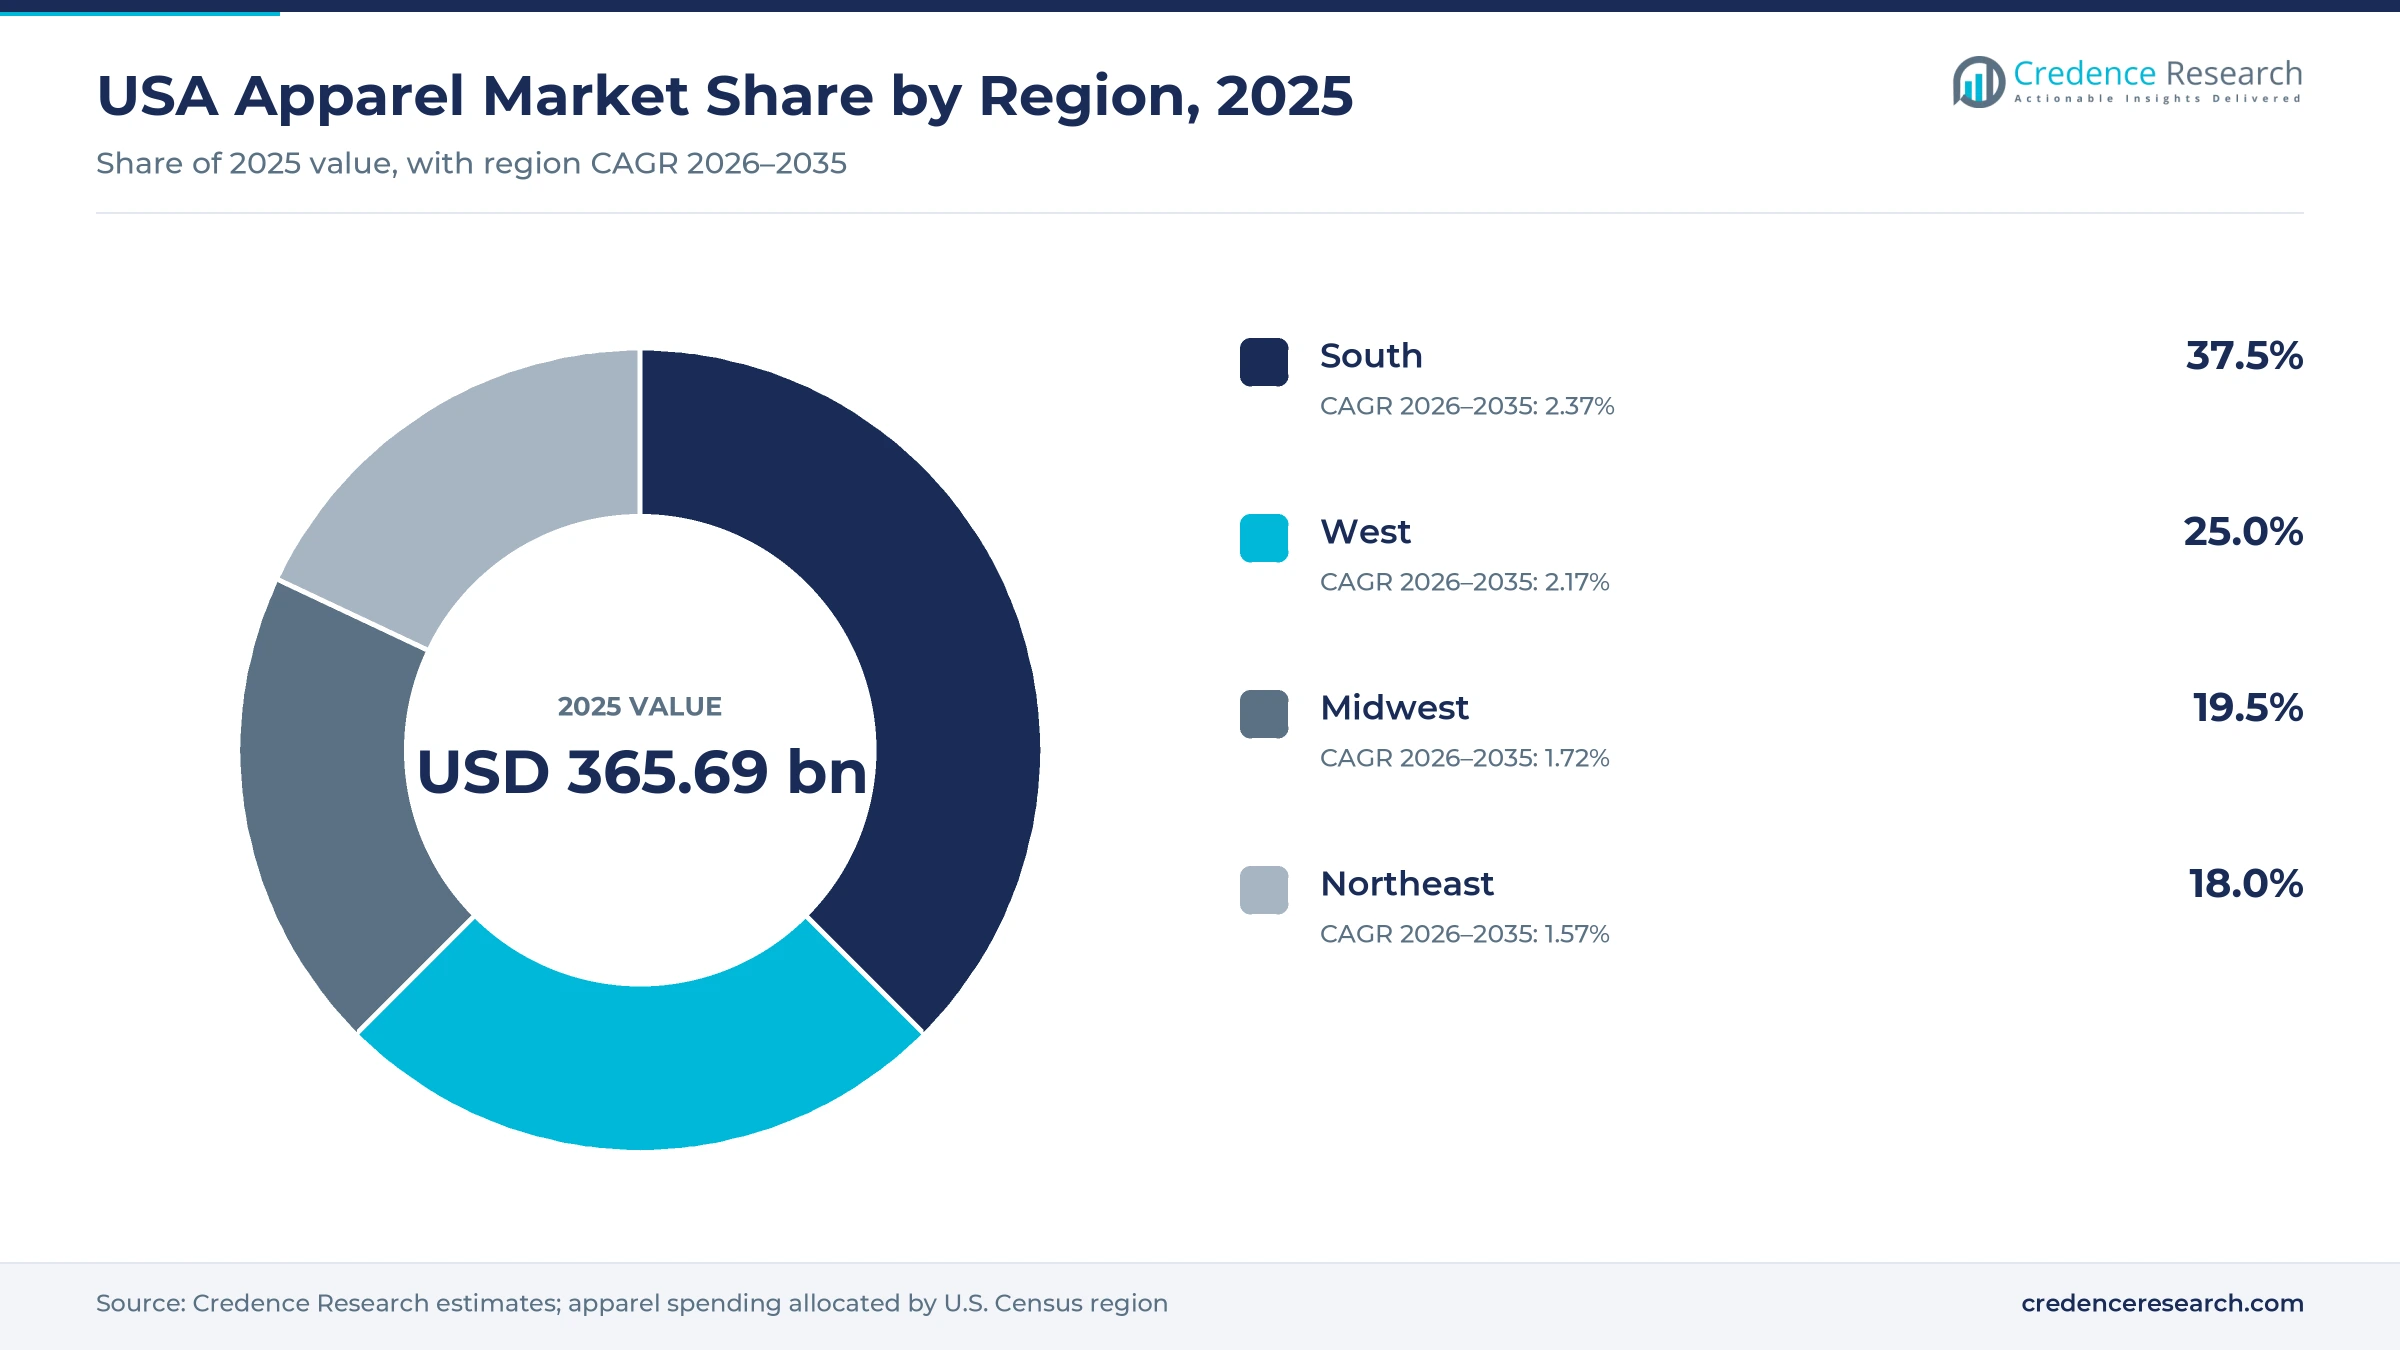
The USA apparel market was valued at USD 365.69 billion in 2025 and is projected to increase from USD 374.11 billion in 2026 to USD 449.15 billion by 2035, registering a CAGR of 2.05% during 2026–2035. Demand comes from a population of about 341.8 million people, broad participation across value, mid-market and premium price tiers, and steady replacement of everyday wardrobes. The South held the largest regional share, 37.5% in 2025, and it is also the fastest-growing region at 2.37% a year, because its population grew 6.0% between 2020 and 2025, about twice the national rate. The West follows with 25.0% of 2025 value, supported by dense metro demand and strong online buying. On the commercial side, duty-free de minimis treatment ended for goods from all countries on Aug. 29, 2025, which raised landed costs for low-value parcels shipped directly to shoppers. As a result, brands with domestic distribution and omnichannel fulfillment gained an edge over cross-border sellers that relied on small direct shipments.
What spending does the clothing estimate include?
The estimate measures consumer and institutional spending on finished garments at retail prices across women's, men's, children's, unisex and adaptive clothing. It covers purchases in brand-owned stores, department and specialty chains, online marketplaces and brand websites. Values are stated in USD million at current prices for each calendar year.
The estimate excludes footwear, bags, jewelry, watches and other accessories, which follow separate product cycles. It also excludes secondhand resale, rental and repair services, along with fabric and trim sold to manufacturers. The value chain runs from overseas and domestic garment makers through importers and brand owners to retailers and finally to shoppers.
USA Apparel Market Insights
- The market was valued at USD 365.69 billion in 2025 and is projected to reach USD 449.15 billion by 2035, registering a CAGR of 2.05% during 2026–2035.
- The South held 37.5% of 2025 spending, because the region gained population faster than the rest of the country between 2020 and 2025.
- Women's apparel led with 48.0% of 2025 value, as women buy across more occasions and refresh wardrobes more often than other groups.
- Duty-free de minimis treatment for low-value imports ended for all countries on Aug. 29, 2025, which pushed cross-border sellers toward formal entry and duties.
- Levi Strauss & Co. completed the sale of Dockers to Authentic Brands Group in February 2026, which shows leading brands narrowing their portfolios to core labels.
Women's wear and mid-market price points lead spending
Why do women's garments lead spending?
Based on product type, the market is categorized into women's apparel, men's apparel, children's apparel and unisex and adaptive apparel. Women's Apparel led with 48.0% of 2025 value, because women buy across work, casual, sports and event occasions and replace items more often. Unisex and Adaptive Apparel grows fastest at 3.39% a year from a small base, as gender-neutral basics and garments with easy closures reach mainstream assortments.
Which price tier gains the most share?
Based on price tier, the market is categorized into value, mid-market, premium and luxury apparel. Mid-Market led with 40.0% of 2025 value, because most households fill wardrobes from national specialty chains and department store labels. Premium apparel grows fastest at 2.57% a year, as shoppers trade up selectively for performance fabrics, better fits and recognized brands while cutting back on volume elsewhere.
How do sports and wellness purchases change the mix?
Based on purchase occasion, the market is categorized into everyday casual, work and professional, sports and wellness, and event and seasonal wear. Everyday Casual led with 46.0% of 2025 value, because relaxed dress codes made jeans, knits and tees the default for most days. Sports and Wellness grows fastest at 2.78% a year, as performance pieces move from the gym into daily outfits.
Where do shoppers buy their clothing?
Based on distribution channel, the market is categorized into brand-owned stores, department and specialty retail, online marketplaces and online direct-to-consumer sites. Department and Specialty Retail led with 36.0% of 2025 value, because national chains still anchor malls and shopping centers. Online Marketplaces grow fastest at 3.07% a year, as price comparison, fast delivery and easy returns pull more spending online.
| Segment Group | Leading Sub-segment | Share, 2025 | Fastest-growing Sub-segment | CAGR, 2026–2035 |
|---|---|---|---|---|
| By Product Type | Women's Apparel | 48.0% | Unisex and Adaptive Apparel | 3.39% |
| By Price Tier | Mid-Market | 40.0% | Premium | 2.57% |
| By Purchase Occasion | Everyday Casual | 46.0% | Sports and Wellness | 2.78% |
| By Distribution Channel | Department and Specialty Retail | 36.0% | Online Marketplaces | 3.07% |
Request a Free Sample
Fill in your details and we'll send you a free sample report.
- Sample data tables & charts
- Research methodology
Omnichannel reach and a large shopper base sustain demand
How does omnichannel scale capture digital demand?
Omnichannel scale is the strongest demand driver, because brands that link stores, websites and marketplaces convert more browsing into purchases. Retail e-commerce reached USD 340.2 billion in the second quarter of 2026, or 17.1% of total U.S. retail sales, according to Census Bureau estimates. In turn, apparel brands are building digital tools into campaigns, and American Eagle paired its fall 2025 denim launch with AI-enabled try-on technology and a Snapchat lens. Online marketplaces grow at 3.07% a year in this report, the fastest of the four channels, because broad e-commerce platforms make price comparison, fast delivery and doorstep returns routine for everyday clothing buyers.
Why does a large shopper base support every price tier?
A large and diverse shopper base supports demand across every price tier, from value basics to luxury labels. The U.S. population reached 341,784,857 on July 1, 2025, according to Census Bureau estimates, which gives brands a deep domestic customer pool across every age group, income level and climate zone. Consumer units spent an average of USD 2,001 on apparel and services in 2024, according to the Bureau of Labor Statistics, across 135.76 million consumer units. As a result, mid-market apparel held 40.0% of 2025 value, while value and premium tiers both draw large shopper groups with very different budgets and shopping habits.
How do performance and casual wear lift premium spending?
Performance wear, casual dressing and brand-led premiumization lift average spending per garment, because shoppers pay more for technical fabrics and trusted labels. Nike named Elliott Hill president and chief executive officer effective Oct. 14, 2024, according to its filing with the SEC, putting a long-time sport executive at the head of the largest athletic brand. Levi Strauss & Co. sold Dockers to sharpen its focus on the Levi's brand and its Beyond Yoga activewear label. In turn, demand for athleisure clothing keeps sports and wellness wear growing at 2.78% a year, the fastest purchase occasion in this report, as gym pieces become daily outfits.
Why does population growth in the South add demand?
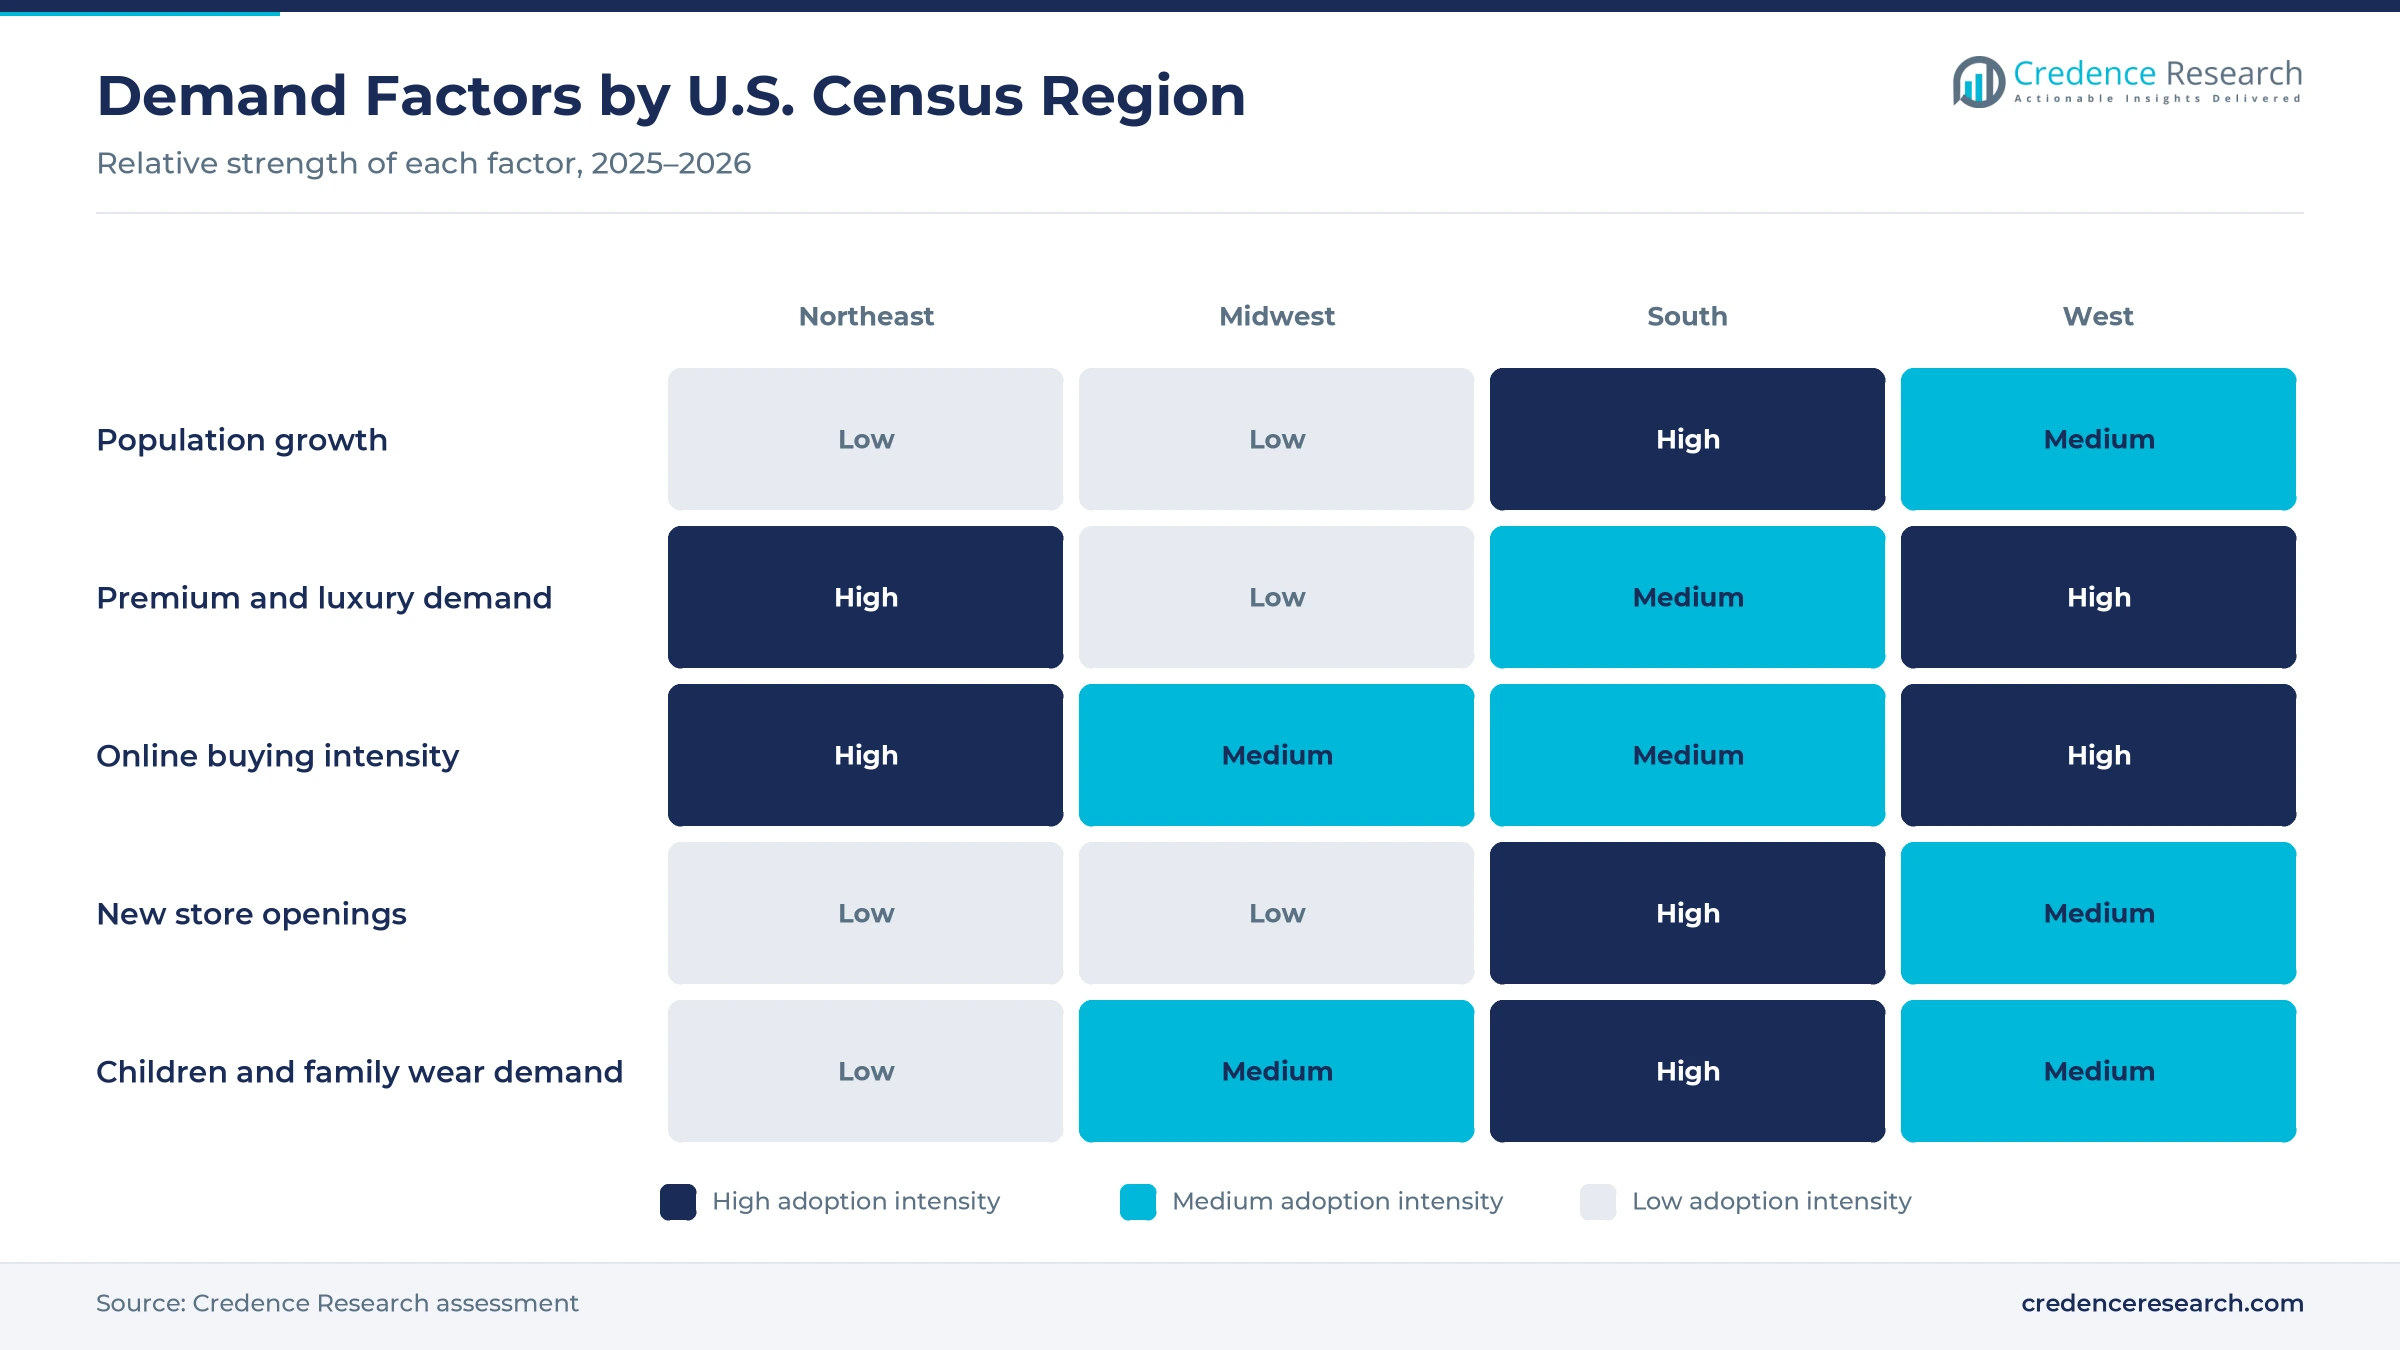
Population growth in the South adds new households that need everyday wardrobes, school clothing and work outfits. The South grew 6.0% between April 2020 and July 2025, about twice the national rate of 3.1%, according to Census Bureau estimates. Its metro counties grew 6.7% over the same period, which supports new store openings in fast-growing suburbs. By comparison, the West grew 1.9% and the Northeast only 0.7%, so the gap keeps widening. As a result, the South adds more new clothing buyers each year than any other region, which steadily lifts its weight in USA apparel spending as families settle in growing suburbs and school districts.
Parcel duties and sourcing shifts reshape supply
How is the end of de minimis entry shifting fulfillment?
The end of de minimis entry is shifting fulfillment from small cross-border parcels toward bulk imports and domestic warehouses. An executive order issued on July 30, 2025 suspended duty-free de minimis treatment for goods from all countries, according to U.S. Customs and Border Protection guidance. Beginning on Aug. 29, 2025, filers had to submit a formal or informal entry and pay all applicable duties, taxes and fees. This change removed a price advantage that direct-ship sellers held on low-value garments. In turn, brands that stock inventory inside the country can now compete more evenly on price and delivery speed for value clothing.
Why is garment sourcing shifting away from China?
Garment sourcing continues to shift toward Vietnam and Bangladesh as brands spread tariff and supply risk across more countries. U.S. imports in the main apparel categories fell from USD 74.0 billion in 2024 to USD 72.7 billion in 2025, according to an ICAC briefing on OTEXA data. Vietnam supplied 26.6% of man-made fiber garment imports in 2025, while China supplied 18.2%. In cotton garments, Bangladesh held 15.3% of 2025 import value and China only 8.2%, a split that shows how widely cotton garment sourcing now spreads. As a result, importers now manage longer supplier lists and more freight routes, which raises planning costs but reduces dependence on any single country.
Can wider fit ranges in denim open premium growth?
Wider fit ranges in denim open a premium growth path, because shoppers pay more when jeans fit well and carry a recognized label. American Eagle launched its fall 2025 campaign with Sydney Sweeney on July 23, 2025, offering more than 200 fits of its jeans and more than 50 new styles. The campaign also included a limited-run jean whose full purchase price went to Crisis Text Line. Such launches keep denim jeans central to casual wardrobes across age groups and regions. Premium apparel grows at 2.57% a year, the fastest price tier, which rewards brands that pair fit depth with strong storytelling.
Is there room to grow family and value wear in the South?
Family and value wear in the South offers a clear opening, because the region is adding children as well as adults. The South was the only region where the under-18 population grew between 2020 and 2025, rising 1.1% while the other three regions declined. It was also the only region with growth in all five age groups tracked by the Census Bureau. Meanwhile, Old Navy signed a deal in May 2025 for a two-story flagship in Manhattan's Herald Square, showing value chains still invest in large stores. The South's metro counties also grew 6.7% between 2020 and 2025, which concentrates young families in reachable suburbs. Therefore, children's and value apparel retailers can gain by placing new stores in fast-growing southern suburbs.
Flat household budgets and tariffs squeeze margins
How do flat household clothing budgets limit growth?
Flat household clothing budgets limit volume growth, because apparel competes with housing, food and health costs for each paycheck. Spending on apparel and services fell 2.0% per consumer unit in 2024, although the change was not statistically significant. As a result, retailers rely on promotions to move seasonal stock, which reduces margins in the value and mid-market tiers. Brands respond with tighter assortments and fewer markdowns, but the pressure remains strongest for chains without distinctive products.
Why do import duties and parcel rules raise costs?
Import duties and new parcel rules raise landed costs, because most garments sold in the country are made overseas. The end of de minimis entry in August 2025 added duties, taxes and entry paperwork to every low-value shipment. In turn, marketplace sellers and smaller online brands face higher costs per order and slower clearance. Larger importers can spread these costs across bulk containers, but the change still lifts shelf prices for budget clothing and squeezes margins.
How does store traffic pressure department retail?
Store traffic pressure weighs on department and specialty retail, because shoppers now compare prices online before visiting a mall. Department and specialty retail still held 36.0% of 2025 value, yet it grows slower than every online channel in this report. Therefore, chains must invest in store remodels, faster checkout and buy-online-pickup-in-store service to keep visits steady. Weaker locations may close, which shifts spending to brand stores and online sites.
Why do inventory and trend risks hurt margins?
Inventory and trend risks hurt margins, because fashion cycles are short and long overseas lead times force early buying decisions. A wrong bet on colors, fits or volumes leaves excess stock that must be sold at a discount. Meanwhile, sourcing spread across more countries adds planning complexity and longer supplier lists. Brands mitigate this with smaller first orders, faster reorders and data from online sales, but these tools require investment that smaller labels struggle to fund.
The South holds the largest share and grows fastest
| Region | Value, 2025 (USD billion) | Share, 2025 | CAGR, 2026–2035 |
|---|---|---|---|
| South | 137.14 | 37.5% | 2.37% |
| West | 91.42 | 25.0% | 2.17% |
| Midwest | 71.31 | 19.5% | 1.72% |
| Northeast | 65.83 | 18.0% | 1.57% |
Why does the South lead clothing spending?
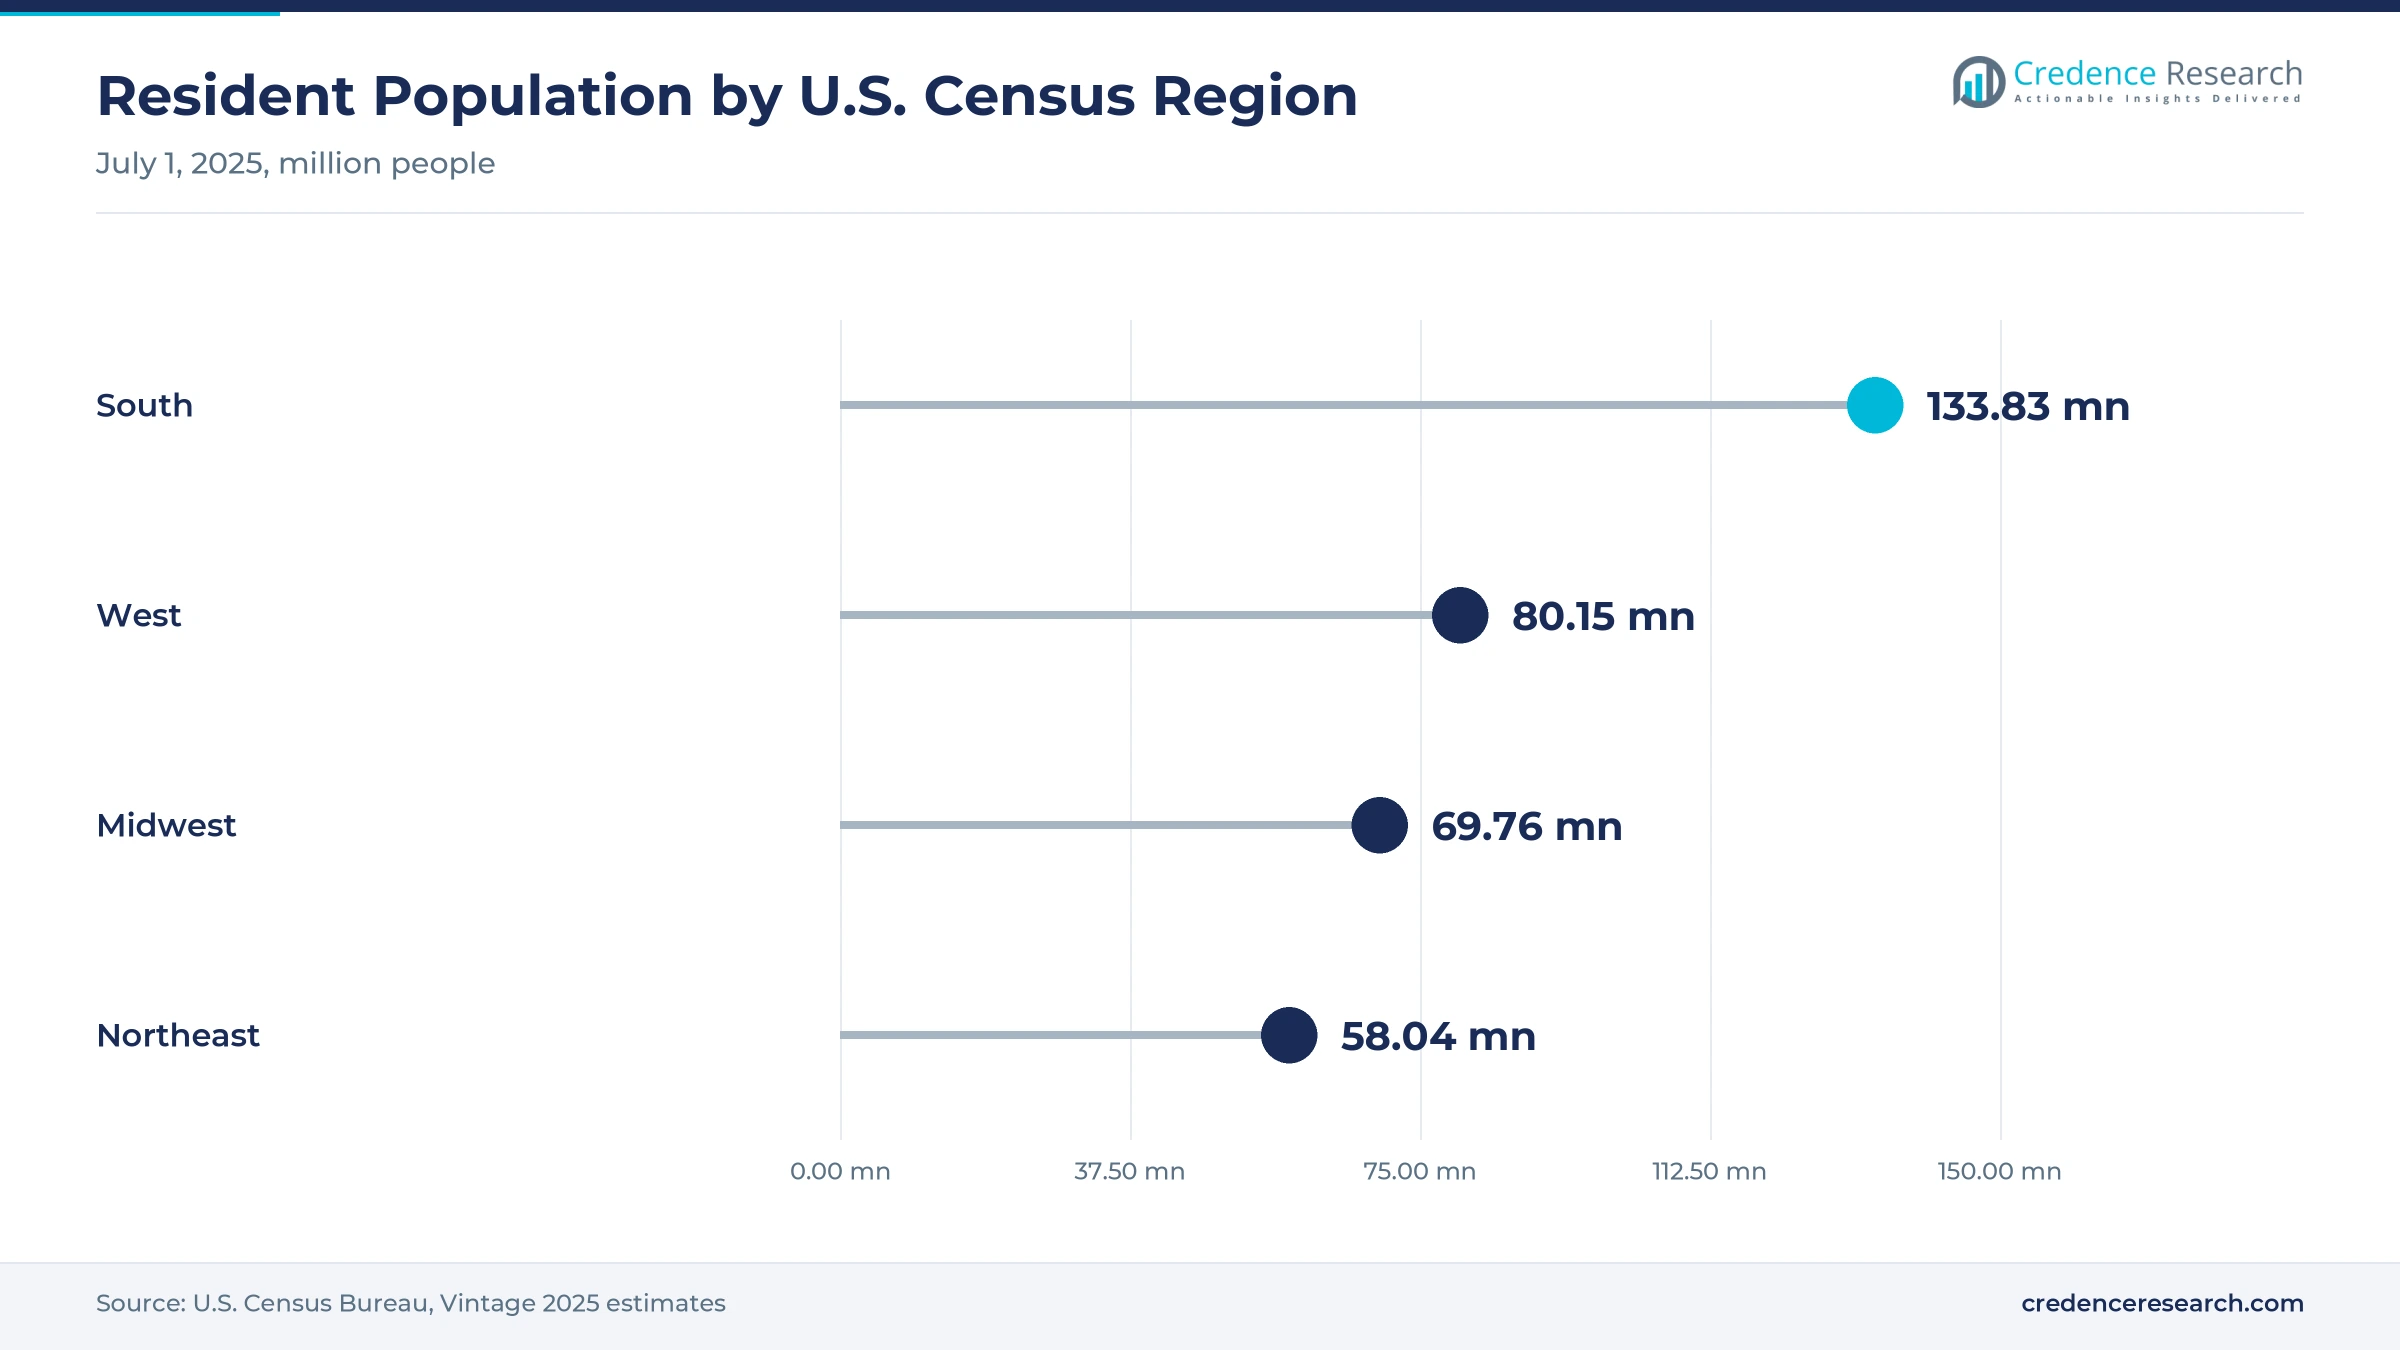
The South held 37.5% of 2025 value and grows at 2.37% a year, the fastest pace among the four regions. Its population reached 133,833,983 on July 1, 2025, the largest of any region, and it added more than 7.5 million residents since 2020. Warm climates also favor lighter garments that are replaced often, while fast-growing metro areas such as those in Texas, Florida and the Carolinas attract new stores. As a result, the South remains the main target for retail expansion through 2035.
How does the West combine density and digital demand?
The West held 25.0% of 2025 value and grows at 2.17% a year, supported by 80,146,154 residents and large coastal metro areas. The region hosts many athletic, outdoor and digital-native brands, which test new products with local shoppers before national launches. Online buying is common across the region, so direct-to-consumer and marketplace channels capture a large part of spending. In turn, higher living costs push shoppers toward both premium performance pieces and value basics.
What keeps the Midwest market steady?
The Midwest held 19.5% of 2025 value and grows at 1.72% a year, with 69,762,666 residents in 2025. Population grew only 1.1% between 2020 and 2025, so demand depends mainly on replacement buying rather than new households. Seasonal weather drives strong demand for outerwear, layering and workwear, which supports spending in colder months. Therefore, retailers in the region focus on value pricing, practical assortments and store networks in suburban shopping centers.
Why does the Northeast grow slowest?
The Northeast held 18.0% of 2025 value and grows at 1.57% a year, the slowest pace among the four regions. Its population of 58,042,054 grew only 0.7% between 2020 and 2025, which limits new demand. However, the region has dense cities with high spending on premium and luxury clothing, and New York remains a flagship location for national brands. As a result, stores there act as showcases, while online channels handle a growing share of repeat purchases.
Leadership changes and brand sales mark 2024 to 2026
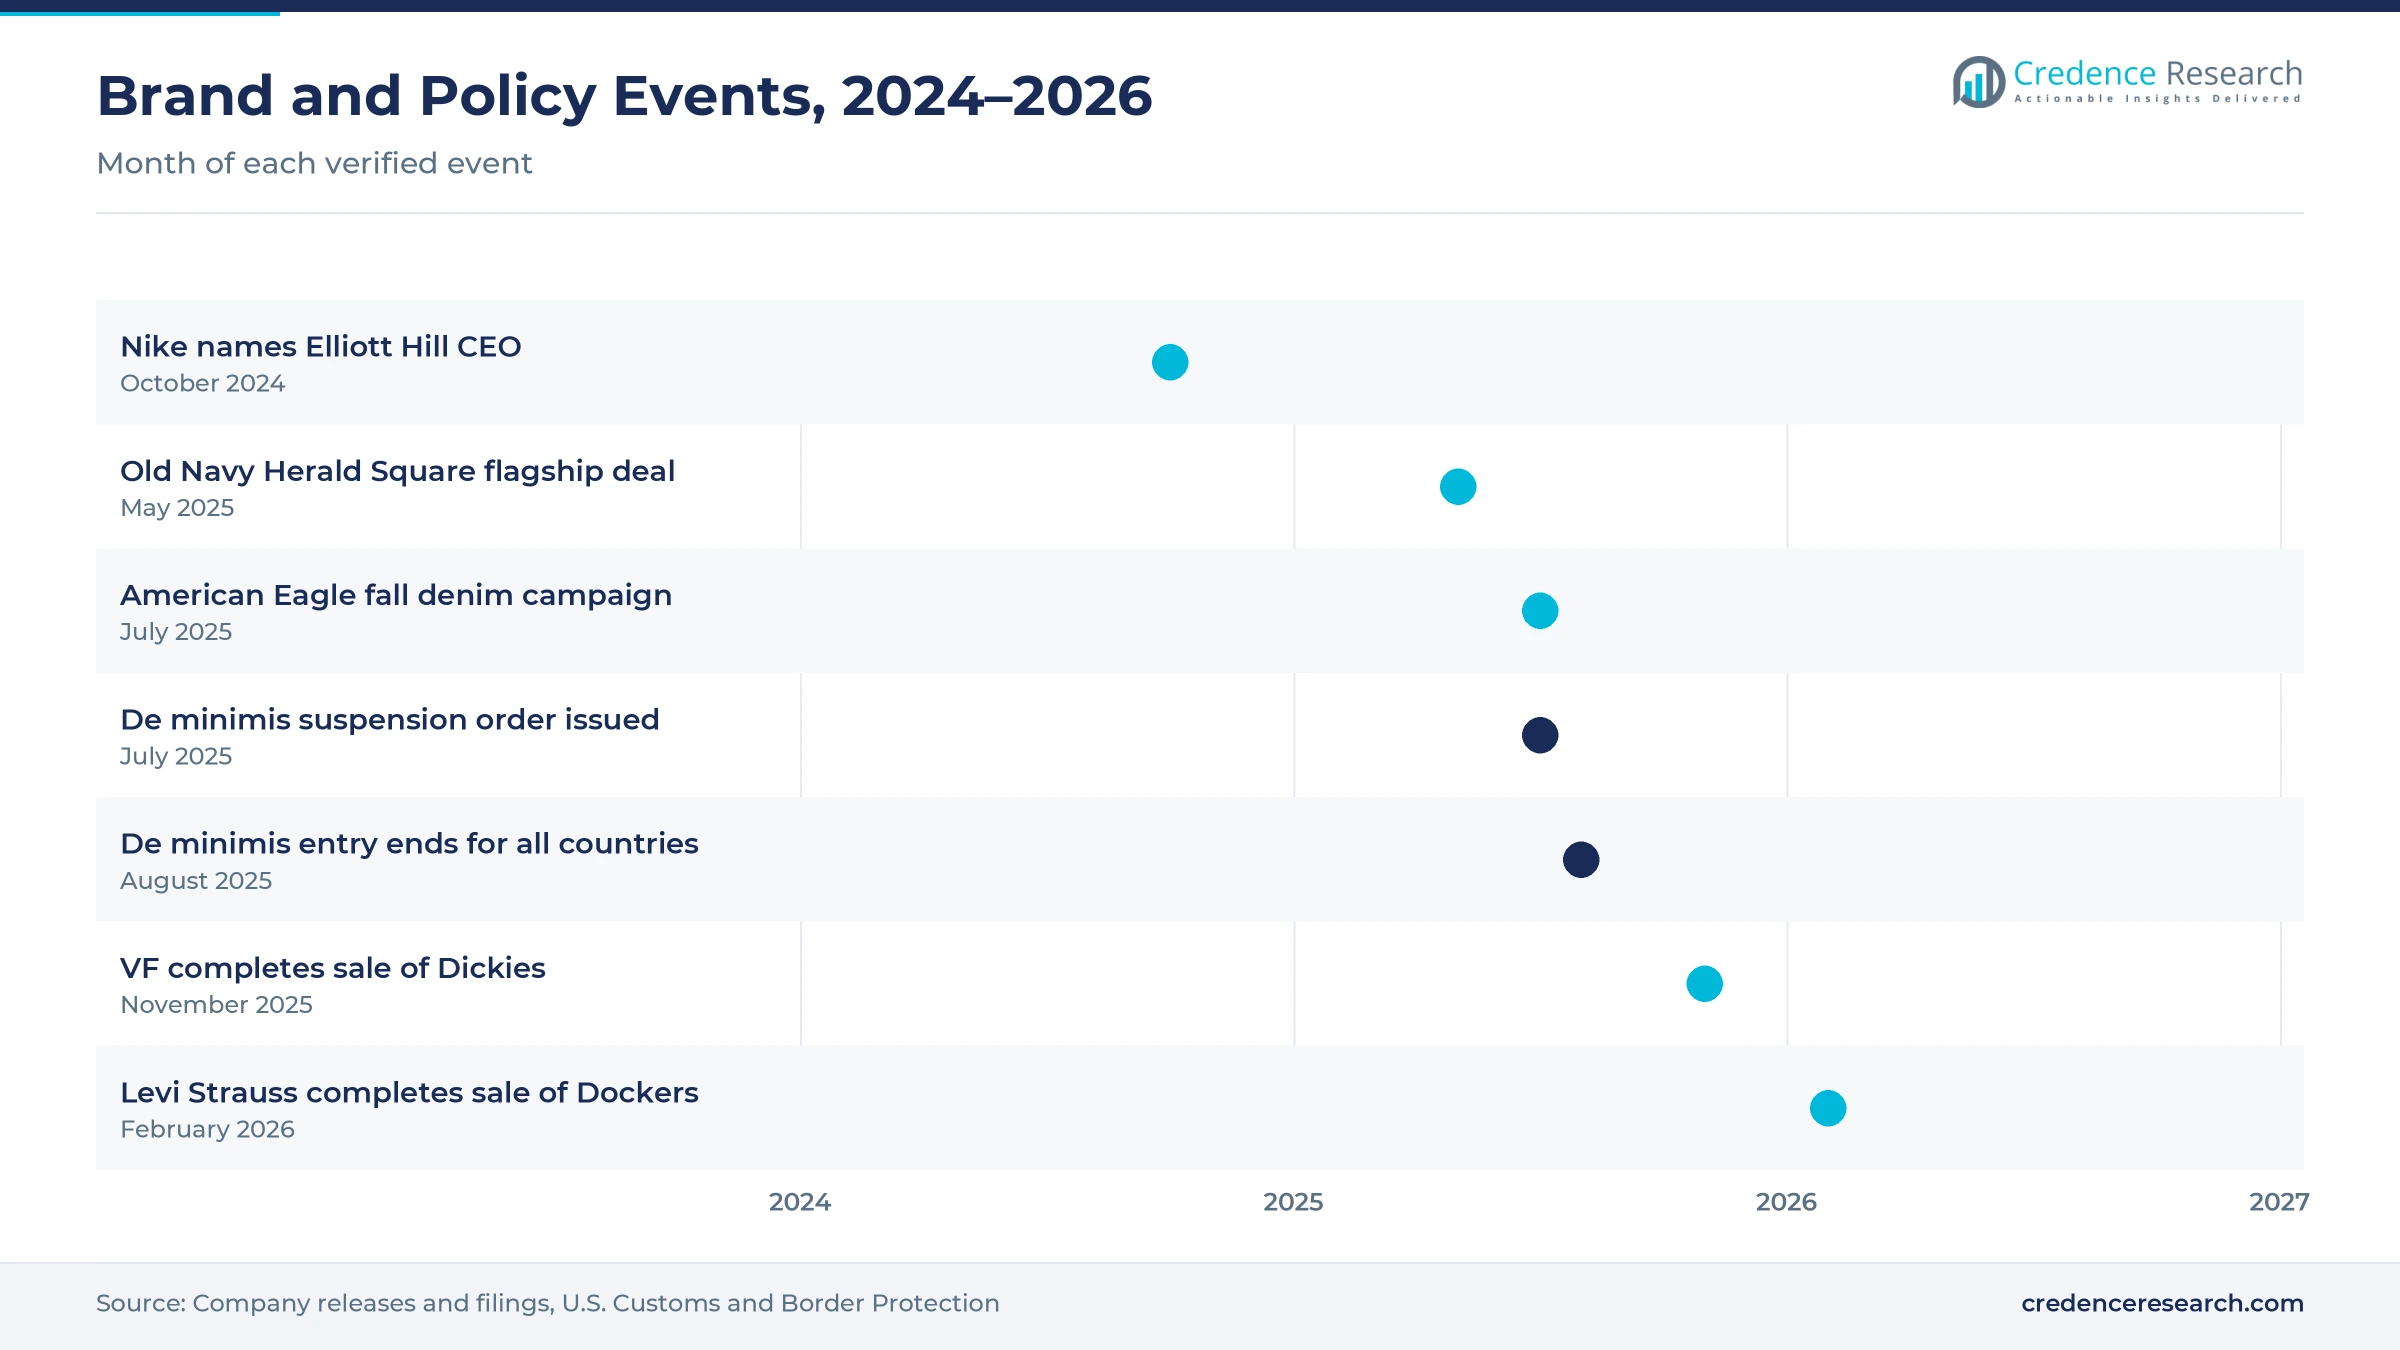
| Development | Status and market relevance |
|---|---|
| In October 2024, Nike named Elliott Hill president and chief executive officer, effective Oct. 14, 2024. | Returns a long-time Nike executive to lead the largest athletic brand in the country |
| In May 2025, Old Navy signed a deal for a two-story flagship store in Manhattan's Herald Square, planned to open in 2026. | Shows value family retailers still investing in large physical stores |
| In July 2025, American Eagle launched its fall 2025 denim campaign with Sydney Sweeney, adding AI-enabled try-on and a Snapchat lens. | Links brand storytelling with digital tools and a wider range of jean fits |
| In November 2025, VF Corporation completed the sale of the Dickies brand to Bluestar Alliance. | Narrows VF to outdoor, active and workwear brands such as The North Face, Vans and Timberland |
| In February 2026, Levi Strauss & Co. completed the sale of Dockers to Authentic Brands Group. | Lets the company focus on the Levi's brand and its Beyond Yoga activewear label |
AI try-on and social formats change how shoppers buy
- AI-enabled virtual try-on helps online shoppers judge fit and style before buying, which can reduce returns of the wrong size.
- Augmented reality social lenses let brands reach younger shoppers on platforms such as Snapchat, where a campaign face can speak directly to viewers.
- Item-level RFID tagging gives retailers accurate store inventory counts, which supports buy-online-pickup-in-store service and faster replenishment.
- Demand forecasting software uses online sales signals to size first orders and reorders, which helps limit markdowns on seasonal clothing.
Need a Custom Version of This Report?
Tailor the scope, geography, or segments to your exact requirements.
- Custom geography or segment scope
- Direct access to our analyst team
Athletic, specialty and value brands compete on reach
Competition in the USA apparel market is fragmented, because global athletic brands, national specialty chains, department store private labels and digital-native labels all target the same shoppers. Nike leads in performance and sportswear, while lululemon and Under Armour compete for premium training and wellness buyers. Gap Inc. reaches value and mid-market families through Old Navy, Gap and Banana Republic. American Eagle Outfitters and Abercrombie & Fitch compete for younger shoppers with denim, casual wear and campaign-driven launches. PVH and Ralph Lauren focus on premium lifestyle brands, and Levi Strauss & Co. concentrates on denim and activewear after selling Dockers. VF Corporation now centers on outdoor, active and workwear brands after selling Dickies. Rivals compete on brand strength, fit range, price, store location, online convenience and speed of product refresh, while sourcing flexibility increasingly shapes margins.
Companies profiled and their roles in this market
| Company | Type | Role in the market |
|---|---|---|
| Nike, Inc. | Global athletic brand | Leads performance and sportswear, with Elliott Hill as chief executive since October 2024 |
| Gap Inc. | National specialty retailer | Runs Old Navy, Gap and Banana Republic, and plans an Old Navy flagship in Herald Square |
| American Eagle Outfitters, Inc. | National specialty brand | Offers more than 200 jean fits and ran a high-profile fall 2025 denim campaign |
| Levi Strauss & Co. | Global denim brand | Focuses on the Levi's brand and Beyond Yoga after selling Dockers in 2026 |
| VF Corporation | Brand portfolio owner | Centers on The North Face, Vans and Timberland after selling Dickies in 2025 |
Credence Research view on brand focus and channels
Credence Research's view is that USA apparel spending will grow slowly but steadily, with gains driven by price mix and channel shifts rather than unit volume. Brands that narrow portfolios to core labels, as Levi Strauss & Co. and VF Corporation did, should invest more in fit, fabrics and digital tools. The end of de minimis entry gives domestic inventory holders a fairer cost base against direct-ship sellers. However, flat household clothing budgets and import duties will keep pressure on value chains, so winners will pair strong brands with flexible sourcing and fast online fulfillment.
How the clothing spending estimate was built
The report uses 2025 as the base year on a calendar basis, with values in USD million at current prices. Market values come from the Credence Research model, which starts from household spending on clothing and adds institutional purchases, then checks the result against import values and retail channel data. Regional, segment and channel splits are Credence Research estimates built from population, spending and channel indicators. Sources used are Census Bureau population and retail statistics, Bureau of Labor Statistics spending data, customs guidance, trade data briefings and company releases and filings, and no interviews or surveys were used.
Steady low single-digit growth through 2035
USA apparel spending is expected to reach USD 449.15 billion by 2035, a 2.05% CAGR during 2026–2035, as population growth, price mix and online channels support modest gains. Growth should stay near the low single digits in 2026 and 2027 while brands absorb new import costs and adjust sourcing. After that, the South should keep adding the most new demand, and online marketplaces and brand sites should take a larger share of sales. Faster wage growth would lift this outlook, while higher duties or weaker hiring would lower it.
Frequently Asked Questions
How big is the USA apparel market?
Which region leads clothing spending in the country?
Which product type holds the largest share?
Which sales channel grows fastest?
How did the end of de minimis entry affect clothing imports?
How much do households spend on apparel?
Who are the leading apparel companies in the country?
Where are U.S. garments sourced from?
Table of Content
Chapter 1 Market Segmentation
- 1.1 Segmentation Framework
- 1.1.1 Product and Service Classification
- 1.1.2 Application and End-Use Classification
- 1.1.3 Technology and Solution Classification
- 1.1.4 Customer and Distribution Channel Classification
- 1.1.5 Geographic Segmentation
- 1.1.6 Market Segment Definitions and Boundaries
- 1.2 By Product Type
- 1.2.1 Women's Apparel
- 1.2.2 Men's Apparel
- 1.2.3 Children's Apparel
- 1.2.4 Unisex and Adaptive Apparel
- 1.3 By Price Tier
- 1.3.1 Value
- 1.3.2 Mid-Market
- 1.3.3 Premium
- 1.3.4 Luxury
- 1.4 By Purchase Occasion
- 1.4.1 Everyday Casual
- 1.4.2 Work and Professional
- 1.4.3 Sports and Wellness
- 1.4.4 Event and Seasonal
Chapter 2 Introduction
- 2.1 Report Objectives and Scope
- 2.2 Product Definition and Industry Terminology
- 2.3 Market Inclusions and Exclusions
- 2.4 Research Process
- 2.4.1 Primary Research and Expert Interviews
- 2.4.2 Secondary Research and Source Review
- 2.4.3 Top-Down and Bottom-Up Estimation
- 2.4.4 Data Triangulation and Verification
- 2.5 Market Size Measurement Basis
- 2.5.1 2025: USD 365.69 billion → 2035: USD 449.15 billion
- 2.6 Historical and Forecast Reference Periods
- 2.6.1 Historical Period: 2018-2025
- 2.6.2 Base Year: 2025
- 2.6.3 Forecast Period: 2025-2035
- 2.7 Research Assumptions and Limitations
Chapter 3 Executive Summary
- 3.1 Market Snapshot and Key Findings
- 3.2 Base-Year Market Size, 2025
- 3.3 Forecast Market Size, 2035
- 3.4 Revenue and Volume Growth Outlook
- 3.5 Key Demand and Supply Indicators
- 3.6 Leading Market Segments
- 3.7 Fastest-Growing Market Opportunities
- 3.8 Regional Performance Highlights
- 3.9 Technology and Industry Transformation
- 3.10 Competitive Landscape Summary
- 3.11 Analyst View and Strategic Implications
Chapter 4 USA Apparel Market Trends and Developments
- 4.1 Historical Industry Development, 2018-2025
- 4.2 Recent Market Trends and Developments
- 4.3 Demand and Customer Behavior Trends
- 4.4 Technology and Product Innovation
- 4.5 Artificial Intelligence, Automation and Digitalization
- 4.6 Local Manufacturing and Supply Chain Realignment
- 4.7 Industry Partnerships, Mergers and Acquisitions
- 4.8 Sustainability and Circular Economy Developments
- 4.9 Government and Private Sector Investment Trends
- 4.10 Emerging Business Models and Commercialization
- 4.11 Industry Developments and Announcements
Chapter 5 USA Apparel Market Production, Supply and Demand Analysis
- 5.1 Demand Trend and Consumption Analysis, 2018-2025
- 5.2 Demand Forecast, 2025-2035
- 5.3 Production and Output Trend, 2018-2025
- 5.4 Production and Output Forecast, 2025-2035
- 5.5 Installed Capacity and Capacity Utilization
- 5.6 Company-Wise Production Plants and Statistics
- 5.6.1 Installed Production Capacity
- 5.6.2 Actual Production
- 5.6.3 Planned Capacity and Expansion Targets
- 5.7 Supply Chain Structure and Procurement Trends
- 5.8 Supply-Demand Gap and Bottlenecks
- 5.9 Import Dependence and Sourcing Structure
- 5.10 Contract Manufacturing and Outsourcing
- 5.11 Regional Supply and Demand Concentration
Chapter 6 USA Apparel Market Pricing Analysis
- 6.1 Pricing Structure and Measurement
- 6.2 Historical Pricing Trends, 2018-2025
- 6.3 Pricing Outlook, 2025-2035
- 6.4 Average Selling Price and Unit Economics
- 6.5 Pricing by Product and Market Segment
- 6.6 Geographic Pricing Differences
- 6.7 Key Input, Energy, Labor and Logistics Costs
- 6.8 Contract Pricing and Purchasing Models
- 6.9 Pricing Sensitivity and Competitive Positioning
- 6.10 Price, Margin and Profitability Implications
Chapter 7 USA Apparel Market Dynamics
- 7.1 Market Growth Drivers
- 7.1.1 Demand-Side Drivers
- 7.1.2 Technology and Innovation Drivers
- 7.1.3 Infrastructure and Investment Drivers
- 7.1.4 Regulatory and Policy Drivers
- 7.2 Market Restraints
- 7.2.1 Cost and Affordability Constraints
- 7.2.2 Technology and Adoption Barriers
- 7.2.3 Supply Chain and Operational Constraints
- 7.3 Market Challenges
- 7.3.1 Competitive Pressure and Margin Erosion
- 7.3.2 Skills, Infrastructure and Implementation Gaps
- 7.4 Emerging Market Opportunities
- 7.5 Market Dynamics Impact and Time-Horizon Assessment
Chapter 8 USA Apparel Value Chain Analysis
- 8.1 Industry Value Chain Overview
- 8.2 Upstream Suppliers and Critical Inputs
- 8.3 Technology and Component Providers
- 8.4 Manufacturing or Service Delivery
- 8.5 Distribution, Channel Partners and Integrators
- 8.6 Downstream Applications and End Users
- 8.7 Value Addition and Profit Pools
- 8.8 Vertical Integration and Outsourcing
- 8.9 Supplier Concentration and Risk
- 8.10 Supply Chain Localization and Resilience
Chapter 9 USA Apparel Market Regulations and Policies
- 9.1 Relevant Laws, Standards and Compliance Frameworks
- 9.2 Product, Service, Safety and Quality Requirements
- 9.3 Government Policies, Incentives and Subsidies
- 9.4 Imports, Exports and Trade Barriers
- 9.5 Public Procurement and Local Content Requirements
- 9.6 Environmental and Sustainability Compliance
- 9.7 Upcoming Policy Changes and Market Implications
Chapter 10 USA Apparel Market Hotspots and Opportunities
- 10.1 Market Opportunity Mapping and Growth Hotspots
- 10.2 High-Growth Applications and Customer Groups
- 10.3 Underserved Markets and White-Space Opportunities
- 10.4 Emerging Technology and Product Opportunities
- 10.5 New Capacity and Investment Hotspots
- 10.6 Market Entry and Expansion Opportunities
- 10.7 Distribution and Partnership Opportunities
- 10.8 Near-Term and Long-Term Commercial Potential
- 10.9 Opportunity Attractiveness and Execution Risks
Chapter 11 USA Apparel Market Outlook, 2025-2035
- 11.1 Market Size and Analysis
- 11.1.1 Revenue (Market Measurement: 2025: USD 365.69 billion → 2035: USD 449.15 billion)
- 11.1.2 Market Volume and Quantity Sold
- 11.1.3 Historical Market Size, 2018-2025
- 11.1.4 Base-Year Market Size, 2025
- 11.2 Market Forecast, 2025-2035
- 11.2.1 Revenue Forecast to 2035
- 11.2.2 Volume Forecast to 2035
- 11.2.3 CAGR and Year-on-Year Growth
- 11.2.4 Incremental Revenue Opportunity
- 11.3 Forecast Assumptions and Scenario Analysis
- 11.3.1 Base-Case Forecast
- 11.3.2 Optimistic and Conservative Scenarios
- 11.3.3 Technology, Pricing and Policy Sensitivities
- 11.4 Market Attractiveness and Growth Outlook
Chapter 12 USA Apparel Market Segmentation and Outlook
- 12.1 Segmentation Summary and Market Shares, 2025
- 12.2 Largest and Fastest-Growing Segments
- 12.3 By Product Type - Market Size and Forecast, 2025-2035
- 12.3.1 Segment Definition and Scope
- 12.3.2 Historical Market Size, 2018-2025
- 12.3.3 Revenue Forecast, 2025-2035
- 12.3.4 Volume Forecast, 2025-2035
- 12.3.5 Base-Year Market Share, 2025
- 12.3.6 Segment CAGR and Growth Drivers
- 12.3.7 Subsegment Market Size and Forecast
- 12.3.7.1 Women's Apparel
- 12.3.7.2 Men's Apparel
- 12.3.7.3 Children's Apparel
- 12.3.7.4 Unisex and Adaptive Apparel
- 12.3.8 Subsegment Pricing and Adoption Trends
- 12.3.9 Leading Suppliers and Competition
- 12.3.10 Regional Demand and Opportunities
- 12.4 By Price Tier - Market Size and Forecast, 2025-2035
- 12.4.1 Segment Definition and Scope
- 12.4.2 Historical Market Size, 2018-2025
- 12.4.3 Revenue Forecast, 2025-2035
- 12.4.4 Volume Forecast, 2025-2035
- 12.4.5 Base-Year Market Share, 2025
- 12.4.6 Segment CAGR and Growth Drivers
- 12.4.7 Subsegment Market Size and Forecast
- 12.4.7.1 Value
- 12.4.7.2 Mid-Market
- 12.4.7.3 Premium
- 12.4.7.4 Luxury
- 12.4.8 Subsegment Pricing and Adoption Trends
- 12.4.9 Leading Suppliers and Competition
- 12.4.10 Regional Demand and Opportunities
- 12.5 By Purchase Occasion - Market Size and Forecast, 2025-2035
- 12.5.1 Segment Definition and Scope
- 12.5.2 Historical Market Size, 2018-2025
- 12.5.3 Revenue Forecast, 2025-2035
- 12.5.4 Volume Forecast, 2025-2035
- 12.5.5 Base-Year Market Share, 2025
- 12.5.6 Segment CAGR and Growth Drivers
- 12.5.7 Subsegment Market Size and Forecast
- 12.5.7.1 Everyday Casual
- 12.5.7.2 Work and Professional
- 12.5.7.3 Sports and Wellness
- 12.5.7.4 Event and Seasonal
- 12.5.8 Subsegment Pricing and Adoption Trends
- 12.5.9 Leading Suppliers and Competition
- 12.5.10 Regional Demand and Opportunities
- 12.6 Segment Growth Comparison
- 12.7 Segment Attractiveness and Priority Matrix
Chapter 13 USA Apparel Geographic Market Outlook, 2025-2035
- 13.1 Regional Market Size and Country-Level Shares, 2025
- 13.2 Country Market Size Comparison, 2025
- 13.3 Country Market Forecasts, 2025-2035
- 13.4 Subregional Industrial and Demand Clusters
- 13.5 Intra-Regional Pricing and Cost Differences
- 13.6 Cross-Border Trade and Supply Networks
- 13.7 Regional Supply and Demand Balances
- 13.8 Country Opportunity Comparison and Prioritization
Note: Every listed country is covered on the structure shown under the first country.
Chapter 14 USA Apparel Technology, Innovation and Sustainability Outlook
- 14.1 Technology Landscape and Maturity
- 14.2 Product, Process and Service Innovation
- 14.3 AI, Automation and Digital Tools in the Industry
- 14.4 Technology Adoption and Performance Benchmarking
- 14.5 Innovation Pipeline and R&D Investment
- 14.6 Patent and Intellectual Property Trends
- 14.7 Energy Efficiency and Resource Management
- 14.8 Sustainability, Recycling and Circularity
- 14.9 Technology Roadmap, 2025-2035
- 14.10 Risks of Obsolescence and Technology Substitution
Chapter 15 USA Apparel Market Key Strategic Imperatives
- 15.1 Growth and Market Entry Priorities
- 15.2 High-Return Products and Segments
- 15.3 Pricing, Profitability and Cost Optimization
- 15.4 Technology Investment and Product Differentiation
- 15.5 Supply Chain Localization and Resilience
- 15.6 Distribution and Customer Acquisition
- 15.7 Partnership, Acquisition and Capacity Strategy
- 15.8 Regional Expansion Priorities
- 15.9 Short-, Medium- and Long-Term Actions
Chapter 16 Competition Outlook
- 16.1 Industry Competition Characteristics
- 16.2 Market Structure and Concentration
- 16.3 Market Share and Competitive Positioning, 2025
- 16.4 Company-Wise Revenue and Product Benchmarking
- 16.5 Production and Service Capacity Benchmarking
- 16.6 Technology, Pricing and Differentiation
- 16.7 Regional Footprint and Distribution Strength
- 16.8 Mergers, Acquisitions and Strategic Alliances
- 16.9 New Entrants and Competitive Threats
- 16.10 Porter's Five Forces and Industry Attractiveness
- 16.11 Competitive Outlook, 2025-2035
Chapter 17 Company Profiles
- 17.1 Company Coverage and Selection Criteria
- 17.2 Nike, Inc.
- 17.2.1 Business Description
- 17.2.2 Company Ownership and Geographic Presence
- 17.2.3 Product and Service Portfolio
- 17.2.4 Manufacturing and Operating Footprint
- 17.2.5 Production Capacity and Expansion Plans
- 17.2.6 Financial Performance and Investment
- 17.2.7 Market Share and Competitive Position
- 17.2.8 Technology and Innovation Capabilities
- 17.2.9 Strategic Alliances or Partnerships
- 17.2.10 Recent Developments
- 17.2.11 Growth Strategy and Outlook
- 17.3 Gap Inc.
- 17.4 PVH Corp.
- 17.5 Ralph Lauren Corporation
- 17.6 Levi Strauss & Co.
- 17.7 VF Corporation
- 17.8 lululemon athletica inc.
- 17.9 American Eagle Outfitters, Inc.
- 17.10 Abercrombie & Fitch Co.
- 17.11 Under Armour, Inc.
- 17.12 Other Relevant Market Participants
Note: Every listed company is profiled on the structure shown under the first company. The company list is preliminary and may change based on research findings, market developments, data availability and client requirements.
Chapter 18 Disclaimer
- 18.1 Research and Forecast Disclaimer
- 18.2 Data Source and Estimation Limitations
Note: The depth of individual sections depends on data availability for this market. Volume, capacity, trade and other unit-based metrics are included where applicable.

