
Market Overview
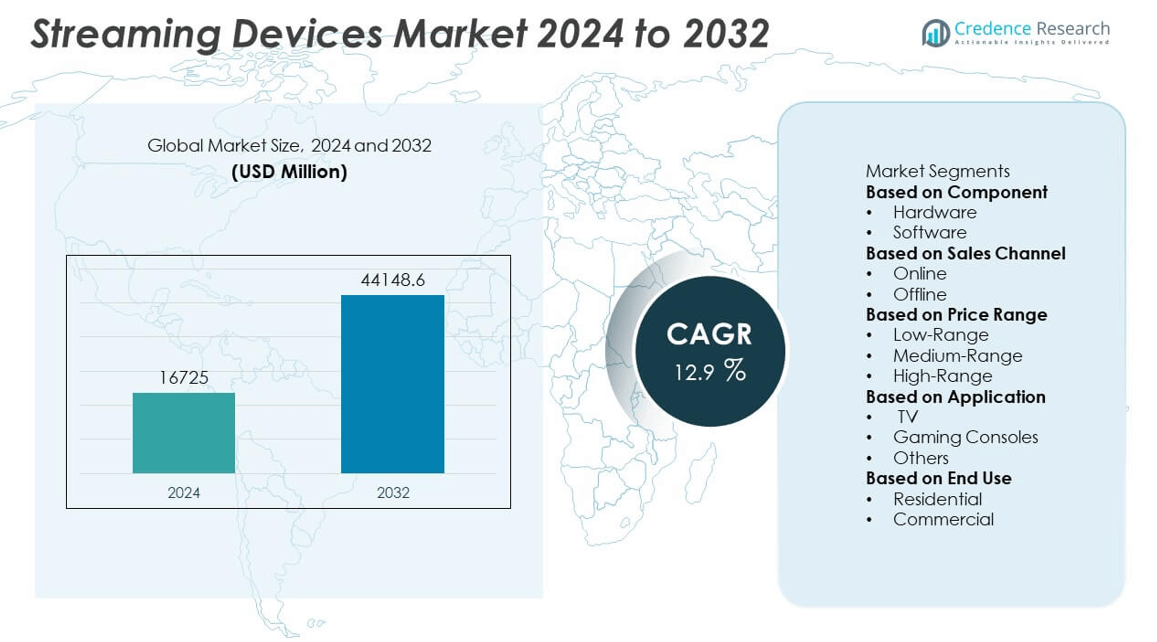
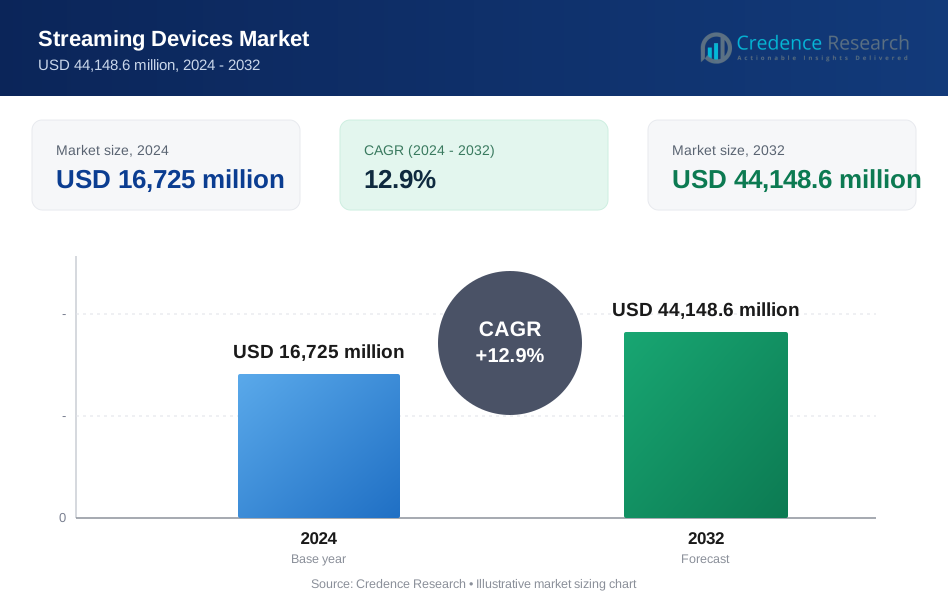
The Streaming Devices Market was valued at USD 16,725 million in 2024 and is anticipated to reach USD 44,148.6 million by 2032, growing at a CAGR of 12.9% during the forecast period.
| REPORT ATTRIBUTE | DETAILS |
|---|---|
| Historical Period | 2020-2023 |
| Base Year | 2024 |
| Forecast Period | 2025-2032 |
| Streaming Devices Market Size 2024 | USD 16,725 million |
| Streaming Devices Market, CAGR | 12.9% |
| Streaming Devices Market Size 2032 | USD 44,148.6 million |
The Streaming Devices Market is driven by the growing demand for on-demand entertainment, rising internet penetration, and the increasing shift from traditional cable to digital streaming platforms. Consumers seek cost-effective and flexible viewing experiences, encouraging the adoption of smart TVs and portable streaming devices.
The Streaming Devices Market shows strong regional dynamics, with North America leading in technology adoption and home entertainment infrastructure, followed by Europe and the Asia Pacific. High-speed internet access, widespread use of smart TVs, and strong presence of streaming service providers support market expansion in these regions. Asia Pacific presents significant growth potential due to rising disposable incomes, rapid urbanization, and increasing smartphone and smart TV penetration. Countries like China and India are emerging as key demand centers driven by a tech-savvy consumer base. Latin America and the Middle East & Africa are also witnessing gradual adoption supported by improving internet access. Key players shaping the market landscape include Amazon.com with its Fire TV lineup, Google Inc. offering Chromecast, and Apple Inc. with its Apple TV platform.
Market Insights
- The Streaming Devices Market was valued at USD 16,725 million in 2024 and is projected to reach USD 44,148.6 million by 2032, growing at a CAGR of 12.9% during the forecast period.
- Growing demand for on-demand content, rising preference for cord-cutting, and increasing adoption of smart TVs are driving the market globally.
- Advancements in streaming technology, integration of voice assistants, and rising partnerships between streaming device manufacturers and content providers are shaping market trends.
- Companies such as Apple Inc., Google Inc., Amazon.com, and Sony Corporation dominate the competitive landscape, focusing on device innovation, bundled content services, and user interface improvements.
- High initial costs of advanced streaming devices and limited internet access in remote areas restrain market growth, especially in developing economies.
- North America leads in adoption due to robust digital infrastructure and consumer preference for premium content experiences, while Asia Pacific shows strong growth potential supported by rising digital penetration and affordable streaming solutions.
- Europe shows stable adoption driven by demand for multilingual content and integration with smart home systems, whereas Latin America and the Middle East & Africa are gradually expanding due to improved broadband access and mobile streaming.
Market Drivers
Rising Demand for On-Demand Content is Reshaping Consumer Viewing Preferences
The rapid transition from traditional broadcast TV to on-demand content consumption has created a strong growth driver for the Streaming Devices Market. Consumers now expect flexible, personalized, and ad-free viewing experiences, which these devices support through direct access to popular platforms. It caters to the increasing appetite for binge-worthy series, movies, and niche channels across all age groups. The convenience of accessing content anytime across various applications enhances user engagement. Consumers prefer devices that offer a seamless experience with intuitive user interfaces and multi-platform compatibility. This shift continues to support device adoption across both urban and semi-urban regions.
- For instance, Amazon’s Fire TV ecosystem surpassed 250 million devices sold globally by November 2024, reflecting immense consumer uptake for flexible, content-rich streaming access.
Technological Advancements are Driving Innovation in Streaming Hardware
The integration of advanced technologies such as 4K and 8K resolution support, Dolby Atmos, voice control, and AI-based recommendations plays a vital role in driving product upgrades. The Streaming Devices Market benefits from constant improvements in device efficiency, compactness, and multi-functional performance. It allows users to convert traditional TVs into smart TVs, eliminating the need for full hardware replacements. Device manufacturers are focusing on enhancing connectivity features, low-latency performance, and cross-platform usability. These upgrades attract tech-savvy users and support the long-term growth of the market. Enhanced device capabilities continue to strengthen brand loyalty and fuel market expansion.
- For instance, Apple’s third‑generation Apple TV 4K, introduced in October 2022, features an A15 Bionic chip delivering up to 50 percent faster CPU and 30 percent faster GPU performance over the preceding model, along with power-efficient, fanless design supporting HDR10+ and Dolby Vision formats.
Expansion of High-Speed Internet and 5G is Supporting Market Penetration
The widespread availability of high-speed broadband and the global rollout of 5G networks have significantly increased streaming quality and accessibility. The Streaming Devices Market benefits from the improved bandwidth and lower latency that support uninterrupted high-definition content delivery. It opens new opportunities for streaming in remote or underserved regions where conventional cable services are limited. Improved connectivity infrastructure encourages consumers to invest in streaming hardware. Telecom providers and ISPs are also bundling streaming services with broadband packages, making these devices more affordable and accessible. This infrastructure expansion continues to accelerate global market adoption.
Smart Home Integration and IoT Adoption are Boosting Device Usage
The growing trend of smart home ecosystems has increased the demand for connected devices that integrate seamlessly with other home technologies. The Streaming Devices Market gains momentum from consumers seeking centralized control of media, lighting, and appliances through voice-enabled assistants. It enhances user convenience by enabling hands-free content browsing and playback. Device compatibility with platforms like Amazon Alexa, Google Assistant, and Apple HomeKit supports broader ecosystem participation. Consumers are increasingly valuing inter-device synchronization, which drives purchasing decisions in favor of smart-enabled streaming solutions. This convergence of media and automation continues to influence market dynamics.
Market Trends
Rising Integration of Voice-Controlled Assistants into Streaming Devices
The incorporation of voice assistants into streaming devices reflects a growing trend toward hands-free operation and user convenience. Devices such as Amazon Fire TV Stick and Apple TV now integrate Alexa and Siri, allowing users to search, control playback, and adjust settings through voice commands. This trend aligns with increasing demand for smart home compatibility. Manufacturers focus on enhancing natural language processing capabilities to support multilingual and contextual interactions. It supports a seamless entertainment experience and reduces reliance on traditional remotes. The Streaming Devices Market is witnessing product development cycles that prioritize voice-first user interfaces.
- For instance, Amazon’s Fire TV Cube (3rd Gen), released in late 2022, features an eight‑microphone array designed to detect voice commands from up to 10 meters away, even while TV audio plays, demonstrating Amazon’s emphasis on far‑field voice recognition.
Adoption of 4K and 8K Streaming Capabilities for High-Resolution Content Delivery
Streaming devices now support ultra-high-definition (UHD) formats, including 4K and 8K resolution, responding to consumer demand for enhanced visual experiences. Brands like Roku Ultra and NVIDIA Shield TV offer 4K HDR support with Dolby Vision and Dolby Atmos, meeting quality expectations for both video and audio. Content platforms increasingly optimize libraries for UHD streaming, prompting device makers to match performance needs. It leads to stronger hardware configurations with faster processing and improved connectivity standards. HDMI 2.1 support and advanced upscaling technologies are also becoming standard features. The trend reflects growing user expectations around cinematic quality in home entertainment.
- For instance, the NVIDIA Shield TV Pro delivers 4K upscaling using AI-enhanced algorithms running on a 256-core GPU, capable of upscaling 720p to 4K in real-time with latency under 16 milliseconds.
Growing Demand for Multi-Platform Compatibility and Cross-Device Streaming
Consumers seek uninterrupted access to streaming services across multiple devices, driving demand for cross-platform compatibility. Streaming devices now support seamless integration with smartphones, tablets, and PCs to ensure synchronized viewing experiences. Google Chromecast with Google TV, for example, enables casting and control from Android or iOS devices. It addresses user preferences for content continuity and accessibility. Device ecosystems increasingly rely on shared user profiles and content recommendations based on multi-device consumption patterns. Compatibility with both Android and iOS ecosystems remains a key design focus.
Emphasis on Energy-Efficient and Compact Device Design
Streaming device manufacturers emphasize portability and energy efficiency to meet changing consumer preferences. Compact form factors like the Amazon Fire TV Stick or Chromecast appeal to users seeking minimalistic and space-saving solutions. It also aligns with sustainability goals, with manufacturers incorporating low-power chipsets and energy-saving modes. USB-powered designs eliminate the need for bulky adapters, enhancing mobility. Regulatory compliance around energy standards further accelerates this trend. Companies optimize both hardware and software to reduce idle power consumption while maintaining performance.
Market Challenges Analysis
High Competition and Market Saturation Pressures Margins
The Streaming Devices Market faces intense competition from a wide array of global and regional players. This saturation limits pricing flexibility and puts pressure on profit margins. Continuous innovation becomes necessary to differentiate products, but it increases R&D expenditures. Companies must balance offering high-performance devices with cost-efficiency to maintain consumer interest. The presence of tech giants like Amazon, Apple, and Google intensifies competitive dynamics, making market entry challenging for newer firms. Rapid product cycles and evolving user expectations force brands to regularly upgrade device capabilities, creating a demanding development environment.
Privacy Concerns and Regulatory Compliance Create Barriers
Privacy issues and growing regulatory scrutiny pose significant hurdles in the Streaming Devices Market. Consumers are increasingly concerned about how their personal viewing data is collected, stored, and shared. Regulatory frameworks such as the General Data Protection Regulation (GDPR) in Europe and evolving policies in North America and Asia require strict compliance. Ensuring device security and data protection adds complexity to product design and increases operational costs. Companies that fail to meet compliance standards risk facing legal penalties and losing consumer trust. These regulatory pressures demand robust internal controls and transparent communication with users, which complicates market growth strategies.
Market Opportunities
Expansion Across Emerging Economies with Growing Digital Penetration
The Streaming Devices Market presents strong growth opportunities across emerging economies where internet penetration and smart TV adoption are rising rapidly. Countries in Asia-Pacific, Latin America, and Africa are witnessing a surge in mobile broadband access, enabling broader access to streaming services. Consumers in these regions are shifting away from traditional cable TV toward flexible, on-demand digital content. This shift opens avenues for streaming device manufacturers to offer affordable and region-specific solutions. Localized content and language integration can further drive product adoption. Companies that form strategic alliances with regional content providers can strengthen their foothold and scale operations in untapped areas.
Technological Advancements Supporting Enhanced User Experiences
The adoption of technologies such as artificial intelligence, voice control, and 4K and 8K resolutions offers new potential within the Streaming Devices Market. These innovations enhance user experience and increase the perceived value of devices. Integration with smart home ecosystems also positions streaming devices as essential components of connected living. Consumers now demand seamless, intuitive interfaces that support multitasking and personalization. Companies that invest in user-focused features and cloud-based platforms stand to gain competitive advantages. Upgrades in processing speed, memory, and energy efficiency can further support global expansion efforts.
Market Segmentation Analysis:
By Component
The Streaming Devices Market, segmented by component, includes hardware and software. Hardware holds the dominant share due to continuous innovations in media players, streaming sticks, and smart TVs. Consumers prefer compact and cost-effective devices that support high-definition streaming and fast connectivity. Software, while secondary in market share, plays a critical role in enhancing device functionality through user interfaces, voice control integration, and compatibility with various platforms. Streaming service providers invest in proprietary software solutions to improve performance, content accessibility, and personalization. Companies focusing on seamless software-hardware integration tend to offer more competitive products.
- For instance, Amazon Fire OS, used in over 200 million Fire TV devices as of 2023, integrates Alexa voice control and supports over 10,000 streaming apps, ensuring high user engagement and platform stickiness.
By Sales Channel
Based on sales channel, the market includes online and offline retail distribution. Online channels account for a significant share due to convenience, broader product selection, and attractive pricing. E-commerce platforms support rapid product comparisons and enable direct-to-consumer strategies. Offline retail still holds relevance in regions with limited digital infrastructure, offering physical demos and in-store support. Consumer electronics outlets and brand-exclusive stores contribute to offline sales by enabling hands-on experience and instant purchase. Hybrid distribution models that combine online and offline presence offer manufacturers a balanced approach to reaching diverse consumer segments.
- For instance, Amazon reported in internal Q4 2023 data that its Fire TV Stick lines experienced over one million units sold during Prime Day events across global online channels-indicating strong digital demand and promotional effectiveness.
By Price Range
The Streaming Devices Market, by price range, spans low, medium, and high-end categories. The low-price segment attracts budget-conscious consumers and first-time buyers, particularly in emerging markets. These devices typically offer basic features, sufficient for standard streaming needs. The medium range balances performance and cost, appealing to a broad customer base seeking reliability and upgraded functions like voice control or dual-band Wi-Fi. High-end devices cater to tech-savvy users demanding features such as 4K/8K streaming, smart assistant integration, and premium build quality. Manufacturers target this segment to showcase innovation and brand strength while driving higher profit margins.
Segments:
Based on Component
- Hardware
- Software
Based on Sales Channel
- Online
- Offline
Based on Price Range
- Low-Range
- Medium-Range
- High-Range
Based on Application
- TV
- Gaming Consoles
- Others
Based on End Use
- Residential
- Commercial
Based on the Geography:
- North America
- U.S.
- Canada
- Mexico
- Europe
- Germany
- France
- U.K.
- Italy
- Spain
- Rest of Europe
- Asia Pacific
- China
- Japan
- India
- South Korea
- South-east Asia
- Rest of Asia Pacific
- Latin America
- Brazil
- Argentina
- Rest of Latin America
- Middle East & Africa
- GCC Countries
- South Africa
- Rest of the Middle East and Africa
Regional Analysis
North America
North America holds the largest share of the Streaming Devices Market, securing approximately 40 % to 44 % of global revenue in 2024. Consumers in the United States and Canada lead adoption of streaming sticks, set-top boxes, and smart TVs. It benefits from mature broadband infrastructure, high disposable income, and early embrace of OTT platforms like Netflix, Amazon Prime, and Hulu. Firms such as Roku, Amazon Fire TV, and Apple TV see strong household penetration, with Roku alone installed in roughly half of U.S. streaming households. Cloud platforms and AI-powered content recommendations further support widespread adoption and premium feature integration.
Europe
Europe captures approximately 20 % to 25 % of the global market share. Regions like the U.K., Germany, and France rely on fiber-optic broadband and widespread smart TV ownership. Consumers increasingly shift from scheduled broadcasting to on-demand viewing, driving demand for device compatibility and localized content. Regulatory frameworks around net neutrality and data protection (e.g. GDPR) influence product design and feature inclusion. Telecom operators and electronics brands collaborate on bundled offers and local OTT services to support adoption among cost-conscious segments.
Asia Pacific
Asia Pacific holds approximately 20 % to 30 % of market share. Rapid urbanization, rising middle-class incomes, and expanding broadband connectivity are fueling demand in countries such as China, India, South Korea, and Australia. It presents a mix of high-end smart TV usage and ultrabudget streaming dongles. Local content platforms like Hotstar, iQIYI, and Tencent Video drive ecosystem growth. Brands such as Xiaomi and Hisense succeed in delivering affordable streaming devices tailored for regional content consumption patterns. The region shows high growth potential through entry-level devices in high-population economies.
Latin America
Latin America represents roughly 7 % to 10 % of global market share. Device adoption rises in countries like Brazil, Mexico, and Argentina, where young demographic cohorts embrace OTT services on both mobile and connected TVs. The region’s affordability constraints promote usage of ad-supported and basic streaming devices. Local operators like Claro Video and Blim partner with OEMs to expand reach. Urban populations with increasing internet access favor devices that work with limited-bandwidth networks.
Middle East & Africa
The Middle East & Africa together contribute around 3 % to 8 % of the global market share. Markets such as UAE, Saudi Arabia, and South Africa increasingly incorporate streaming platforms for smart city and entertainment use cases. Internet infrastructure expansion and SVOD uptake support device adoption in urban areas. However, penetration remains modest in rural zones due to infrastructure gaps and affordability challenges. Local content and regional partnerships drive pilot deployments and future multiyear growth potential.
Key Player Analysis
- D-Link Corporation
- Sony Corporation
- Arris Group Inc.
- Google, Inc.
- com
- Huawei Technologies
- Microsoft Corporation
- Apple, Inc.
- Philips Electronics
- HiMedia Technology
Competitive Analysis
The competitive landscape of the streaming devices market is defined by the presence of several dominant players, including Apple Inc., Google Inc., Amazon.com, Microsoft Corporation, Sony Corporation, Philips Electronics, Huawei Technologies, D-Link Corporation, HiMedia Technology, and Arris Group Inc. These companies are actively competing on the basis of innovation, pricing strategies, platform compatibility, and content integration. Apple Inc. continues to lead with its Apple TV, leveraging ecosystem integration and strong brand loyalty. Google Inc. maintains a solid position through its Chromecast series, which is known for affordability and seamless mobile-to-TV casting. Amazon.com’s Fire TV line remains a key player, offering a competitive mix of pricing, Alexa voice integration, and bundled content services through Prime. Sony Corporation and Microsoft Corporation capitalize on their gaming consoles, PlayStation and Xbox, which double as streaming hubs, providing multi-functional value to consumers. Companies like Philips Electronics and Huawei are strengthening their positions in emerging markets by offering cost-effective devices with smart features. D-Link and HiMedia Technology focus on hardware flexibility and customization for tech-savvy users, while Arris Group Inc. serves both enterprise and consumer markets with scalable streaming hardware. Collectively, these players are shaping a highly dynamic and innovation-driven market, aiming to capture an increasingly digital-first consumer base.
Recent Developments
- In July 2025, D-Link released a new line of 2.5G multi-gigabit unmanaged switches: the DMS-108P, DMS-1016, and DMS-1024. These switches are designed to support high-bandwidth networking for home and small office/home office (SOHO) users.
- In May 2025, D-Link's AQUILA PRO AI M95 BE9500 Wi-Fi 7 Smart Mesh Router was awarded the prestigious Red Dot Design Award. This recognition highlights the router's exceptional design, which incorporates a sleek, eagle-inspired aesthetic with four omnidirectional antennas designed to resemble wings.
- In August 2024, Google discontinued the Chromecast and introduced the Google TV Streamer, a more powerful, full-featured device. The Google TV Streamer boasts a faster CPU, more RAM, and a built-in Thread border router, transitioning from a dongle to a more robust, set-top box-like design.
Market Concentration & Characteristics
The Streaming Devices Market exhibits a moderately concentrated landscape, characterized by the strong presence of major global players such as Apple Inc., Google Inc., Amazon.com, and Sony Corporation. These companies hold significant influence over market dynamics through technological innovation, integrated ecosystems, and strong brand recognition. It benefits from increasing internet penetration, smart TV adoption, and consumer demand for on-demand entertainment content. The market displays fast-paced technological evolution, with players consistently upgrading device compatibility, user interface, and resolution standards. Strategic alliances, product differentiation, and pricing play critical roles in competitive positioning. While larger companies dominate through economies of scale and proprietary platforms, several regional and emerging players contribute to diversification. The Streaming Devices Market caters to varied consumer preferences across different price points, creating a competitive balance between premium and budget-friendly devices. Product life cycles remain relatively short, and companies compete by launching updated models and expanding their streaming service partnerships
Report Coverage
The research report offers an in-depth analysis based on Component, Sales Channel, Price Range, Application, End-Use and Geography. It details leading market players, providing an overview of their business, product offerings, investments, revenue streams, and key applications. Additionally, the report includes insights into the competitive environment, SWOT analysis, current market trends, as well as the primary drivers and constraints. Furthermore, it discusses various factors that have driven market expansion in recent years. The report also explores market dynamics, regulatory scenarios, and technological advancements that are shaping the industry. It assesses the impact of external factors and global economic changes on market growth. Lastly, it provides strategic recommendations for new entrants and established companies to navigate the complexities of the market.
Future Outlook
- Consumer demand for high-definition and 4K streaming will drive innovation in device resolution capabilities.
- Integration with smart home ecosystems will become a standard feature in streaming devices.
- Voice control and AI-enabled search functionalities will see wider adoption across devices.
- Subscription bundling with streaming services will emerge as a key competitive strategy.
- Cloud gaming support through streaming devices will expand to attract gaming audiences.
- Growth in emerging markets will increase due to affordable internet access and mobile-first behavior.
- Companies will focus on energy-efficient and compact designs to meet sustainability goals.
- Security and privacy enhancements will gain importance as user data becomes more valuable.
- Open-source operating systems may see increased adoption among new entrants.
- Continuous partnerships with content providers will shape the device compatibility and user experience.
Request a Free Sample
Fill in your details and we'll send you a free sample report.
- Sample data tables & charts
- Research methodology
Market Dynamics
Shift to On-Demand Content Consumption
Consumers are increasingly moving away from traditional cable TV in favor of flexible, on-demand streaming, which streaming devices enable by providing direct access to a wide range of digital content platforms.
Technological Advancements in Streaming Hardware
Continuous innovation in device capabilities, such as 4K/8K resolution, voice control, and AI-based recommendations, is driving upgrades and attracting tech-savvy users seeking enhanced viewing experiences.
Expansion of High-Speed Internet and 5G
The rollout of high-speed broadband and 5G networks globally is improving streaming quality and accessibility, making streaming devices more viable and attractive even in previously underserved regions.
Smart Home and IoT Integration
The growing adoption of smart home ecosystems is boosting demand for streaming devices that seamlessly integrate with voice assistants and other connected home technologies, enhancing user convenience and driving device adoption.
Affordability and Multi-Platform Compatibility
Manufacturers are offering a range of devices across different price points and ensuring compatibility with various platforms and devices, making streaming accessible to a broader audience and supporting market growth in both developed and emerging economies.
Need a Custom Version of This Report?
Tailor the scope, geography, or segments to your exact requirements.
- Custom geography or segment scope
- Direct access to our analyst team
Frequently Asked Questions
What is the current market size for Streaming Devices, and what is its projected size in 2032?
At what Compound Annual Growth Rate is the Streaming Devices market projected to grow between 2025 and 2032?
What are the primary factors fueling the growth of the Streaming Devices market?
Who are the leading companies in the Streaming Devices market?
Table of Content
Chapter 1 Market Segmentation
- 1.1 Segmentation Framework
- 1.1.1 Product and Service Classification
- 1.1.2 Application and End-Use Classification
- 1.1.3 Technology and Solution Classification
- 1.1.4 Customer and Distribution Channel Classification
- 1.1.5 Geographic Segmentation
- 1.1.6 Market Segment Definitions and Boundaries
- 1.2 By Component
- 1.2.1 Hardware
- 1.2.2 Software
- 1.3 By Application
- 1.3.1 TV
- 1.3.2 Gaming Consoles
- 1.3.3 Others
- 1.4 By Price Range
- 1.4.1 Low-Range
- 1.4.2 Medium-Range
- 1.4.3 High-Range
- 1.5 By Sales Channel
- 1.5.1 Online
- 1.5.2 Offline
Chapter 2 Introduction
- 2.1 Report Objectives and Scope
- 2.2 Product Definition and Industry Terminology
- 2.3 Market Inclusions and Exclusions
- 2.4 Research Process
- 2.4.1 Primary Research and Expert Interviews
- 2.4.2 Secondary Research and Source Review
- 2.4.3 Top-Down and Bottom-Up Estimation
- 2.4.4 Data Triangulation and Verification
- 2.5 Market Size Measurement Basis
- 2.5.1 2024: USD 16,725 million → 2032: USD 44,148.6 million
- 2.6 Historical and Forecast Reference Periods
- 2.6.1 Base Year: 2024
- 2.6.2 Forecast Period: 2024-2032
- 2.7 Research Assumptions and Limitations
Chapter 3 Executive Summary
- 3.1 Market Snapshot and Key Findings
- 3.2 Base-Year Market Size, 2024
- 3.3 Forecast Market Size, 2032
- 3.4 Revenue and Volume Growth Outlook
- 3.5 Key Demand and Supply Indicators
- 3.6 Leading Market Segments
- 3.7 Fastest-Growing Market Opportunities
- 3.8 Regional Performance Highlights
- 3.9 Technology and Industry Transformation
- 3.10 Competitive Landscape Summary
- 3.11 Analyst View and Strategic Implications
Chapter 4 Global Streaming Devices Market Trends and Developments
- 4.1 Historical Industry Development
- 4.2 Recent Market Trends and Developments
- 4.3 Demand and Customer Behavior Trends
- 4.4 Technology and Product Innovation
- 4.5 Artificial Intelligence, Automation and Digitalization
- 4.6 Local Manufacturing and Supply Chain Realignment
- 4.7 Industry Partnerships, Mergers and Acquisitions
- 4.8 Sustainability and Circular Economy Developments
- 4.9 Government and Private Sector Investment Trends
- 4.10 Emerging Business Models and Commercialization
- 4.11 Industry Developments and Announcements
Chapter 5 Global Streaming Devices Market Production, Supply and Demand Analysis
- 5.1 Demand Trend and Consumption Analysis
- 5.2 Demand Forecast, 2024-2032
- 5.3 Production and Output Trend
- 5.4 Production and Output Forecast, 2024-2032
- 5.5 Installed Capacity and Capacity Utilization
- 5.6 Company-Wise Production Plants and Statistics
- 5.6.1 Installed Production Capacity
- 5.6.2 Actual Production
- 5.6.3 Planned Capacity and Expansion Targets
- 5.7 Supply Chain Structure and Procurement Trends
- 5.8 Supply-Demand Gap and Bottlenecks
- 5.9 Import Dependence and Sourcing Structure
- 5.10 Contract Manufacturing and Outsourcing
- 5.11 Regional Supply and Demand Concentration
Chapter 6 Global Streaming Devices Market Pricing Analysis
- 6.1 Pricing Structure and Measurement
- 6.2 Historical Pricing Trends
- 6.3 Pricing Outlook, 2024-2032
- 6.4 Average Selling Price and Unit Economics
- 6.5 Pricing by Product and Market Segment
- 6.6 Geographic Pricing Differences
- 6.7 Key Input, Energy, Labor and Logistics Costs
- 6.8 Contract Pricing and Purchasing Models
- 6.9 Pricing Sensitivity and Competitive Positioning
- 6.10 Price, Margin and Profitability Implications
Chapter 7 Global Streaming Devices Market Dynamics
- 7.1 Market Growth Drivers
- 7.1.1 Demand-Side Drivers
- 7.1.2 Technology and Innovation Drivers
- 7.1.3 Infrastructure and Investment Drivers
- 7.1.4 Regulatory and Policy Drivers
- 7.2 Market Restraints
- 7.2.1 Cost and Affordability Constraints
- 7.2.2 Technology and Adoption Barriers
- 7.2.3 Supply Chain and Operational Constraints
- 7.3 Market Challenges
- 7.3.1 Competitive Pressure and Margin Erosion
- 7.3.2 Skills, Infrastructure and Implementation Gaps
- 7.4 Emerging Market Opportunities
- 7.5 Market Dynamics Impact and Time-Horizon Assessment
Chapter 8 Global Streaming Devices Value Chain Analysis
- 8.1 Industry Value Chain Overview
- 8.2 Upstream Suppliers and Critical Inputs
- 8.3 Technology and Component Providers
- 8.4 Manufacturing or Service Delivery
- 8.5 Distribution, Channel Partners and Integrators
- 8.6 Downstream Applications and End Users
- 8.7 Value Addition and Profit Pools
- 8.8 Vertical Integration and Outsourcing
- 8.9 Supplier Concentration and Risk
- 8.10 Supply Chain Localization and Resilience
Chapter 9 Global Streaming Devices Market Regulations and Policies
- 9.1 Relevant Laws, Standards and Compliance Frameworks
- 9.2 Product, Service, Safety and Quality Requirements
- 9.3 Government Policies, Incentives and Subsidies
- 9.4 Imports, Exports and Trade Barriers
- 9.5 Public Procurement and Local Content Requirements
- 9.6 Environmental and Sustainability Compliance
- 9.7 Upcoming Policy Changes and Market Implications
Chapter 10 Global Streaming Devices Market Hotspots and Opportunities
- 10.1 Market Opportunity Mapping and Growth Hotspots
- 10.2 High-Growth Applications and Customer Groups
- 10.3 Underserved Markets and White-Space Opportunities
- 10.4 Emerging Technology and Product Opportunities
- 10.5 New Capacity and Investment Hotspots
- 10.6 Market Entry and Expansion Opportunities
- 10.7 Distribution and Partnership Opportunities
- 10.8 Near-Term and Long-Term Commercial Potential
- 10.9 Opportunity Attractiveness and Execution Risks
Chapter 11 Global Streaming Devices Market Outlook, 2024-2032
- 11.1 Market Size and Analysis
- 11.1.1 Revenue (Market Measurement: 2024: USD 16,725 million → 2032: USD 44,148.6 million)
- 11.1.2 Market Volume and Quantity Sold
- 11.1.3 Historical Market Size
- 11.1.4 Base-Year Market Size, 2024
- 11.2 Market Forecast, 2024-2032
- 11.2.1 Revenue Forecast to 2032
- 11.2.2 Volume Forecast to 2032
- 11.2.3 CAGR and Year-on-Year Growth
- 11.2.4 Incremental Revenue Opportunity
- 11.3 Forecast Assumptions and Scenario Analysis
- 11.3.1 Base-Case Forecast
- 11.3.2 Optimistic and Conservative Scenarios
- 11.3.3 Technology, Pricing and Policy Sensitivities
- 11.4 Market Attractiveness and Growth Outlook
Chapter 12 Global Streaming Devices Market Segmentation and Outlook
- 12.1 Segmentation Summary and Market Shares, 2024
- 12.2 Largest and Fastest-Growing Segments
- 12.3 By Component - Market Size and Forecast, 2024-2032
- 12.3.1 Segment Definition and Scope
- 12.3.2 Historical Market Size
- 12.3.3 Revenue Forecast, 2024-2032
- 12.3.4 Volume Forecast, 2024-2032
- 12.3.5 Base-Year Market Share, 2024
- 12.3.6 Segment CAGR and Growth Drivers
- 12.3.7 Subsegment Market Size and Forecast
- 12.3.7.1 Hardware
- 12.3.7.2 Software
- 12.3.8 Subsegment Pricing and Adoption Trends
- 12.3.9 Leading Suppliers and Competition
- 12.3.10 Regional Demand and Opportunities
- 12.4 By Application - Market Size and Forecast, 2024-2032
- 12.4.1 Segment Definition and Scope
- 12.4.2 Historical Market Size
- 12.4.3 Revenue Forecast, 2024-2032
- 12.4.4 Volume Forecast, 2024-2032
- 12.4.5 Base-Year Market Share, 2024
- 12.4.6 Segment CAGR and Growth Drivers
- 12.4.7 Subsegment Market Size and Forecast
- 12.4.7.1 TV
- 12.4.7.2 Gaming Consoles
- 12.4.7.3 Others
- 12.4.8 Subsegment Pricing and Adoption Trends
- 12.4.9 Leading Suppliers and Competition
- 12.4.10 Regional Demand and Opportunities
- 12.5 By Price Range - Market Size and Forecast, 2024-2032
- 12.5.1 Segment Definition and Scope
- 12.5.2 Historical Market Size
- 12.5.3 Revenue Forecast, 2024-2032
- 12.5.4 Volume Forecast, 2024-2032
- 12.5.5 Base-Year Market Share, 2024
- 12.5.6 Segment CAGR and Growth Drivers
- 12.5.7 Subsegment Market Size and Forecast
- 12.5.7.1 Low-Range
- 12.5.7.2 Medium-Range
- 12.5.7.3 High-Range
- 12.5.8 Subsegment Pricing and Adoption Trends
- 12.5.9 Leading Suppliers and Competition
- 12.5.10 Regional Demand and Opportunities
- 12.6 By Sales Channel - Market Size and Forecast, 2024-2032
- 12.6.1 Segment Definition and Scope
- 12.6.2 Historical Market Size
- 12.6.3 Revenue Forecast, 2024-2032
- 12.6.4 Volume Forecast, 2024-2032
- 12.6.5 Base-Year Market Share, 2024
- 12.6.6 Segment CAGR and Growth Drivers
- 12.6.7 Subsegment Market Size and Forecast
- 12.6.7.1 Online
- 12.6.7.2 Offline
- 12.6.8 Subsegment Pricing and Adoption Trends
- 12.6.9 Leading Suppliers and Competition
- 12.6.10 Regional Demand and Opportunities
- 12.7 Segment Growth Comparison
- 12.8 Segment Attractiveness and Priority Matrix
Chapter 13 Global Streaming Devices End-Use and Application Market Outlook
- 13.1 End-Use Industry and Customer Demand Structure
- 13.2 Leading Applications and Customer Groups
- 13.3 End-Use Market Size, Share and Forecast
- 13.4 Major End-Use Industry Deep Dives
- 13.4.1 Customer Requirements and Use Cases
- 13.4.2 Demand and Replacement Cycles
- 13.4.3 Technical and Regulatory Considerations
- 13.4.4 Purchasing and Procurement Models
- 13.4.5 Leading Vendors and Distribution Channels
- 13.4.6 Forecast and Commercial Opportunities
- 13.5 Emerging Applications and Cross-Segment Demand
- 13.6 End-Use Industry Investment Priorities
Chapter 14 Global Streaming Devices Geographic Market Outlook, 2024-2032
- 14.1 Regional Market Size and Share, 2024
- 14.2 Regional Market Forecast, 2024-2032
- 14.3 Regional Pricing, Production and Demand Differences
- 14.4 North America
- 14.4.1 United States
- 14.4.2 Canada
- 14.4.3 Mexico
- 14.5 Europe
- 14.5.1 Germany
- 14.5.2 France
- 14.5.3 Italy
- 14.5.4 United Kingdom
- 14.5.5 Spain
- 14.5.6 Poland
- 14.5.7 Russia
- 14.5.8 Netherlands
- 14.5.9 Belgium
- 14.5.10 Sweden
- 14.5.11 Denmark
- 14.5.12 Norway
- 14.5.13 Rest of Europe
- 14.6 Asia Pacific
- 14.6.1 China
- 14.6.2 India
- 14.6.3 Japan
- 14.6.4 South Korea
- 14.6.5 Thailand
- 14.6.6 Indonesia
- 14.6.7 Vietnam
- 14.6.8 Malaysia
- 14.6.9 Australia
- 14.6.10 Rest of Asia Pacific
- 14.7 Latin America
- 14.7.1 Brazil
- 14.7.2 Argentina
- 14.7.3 Colombia
- 14.7.4 Chile
- 14.7.5 Rest of Latin America
- 14.8 Middle East
- 14.8.1 Saudi Arabia
- 14.8.2 United Arab Emirates
- 14.8.3 Turkey
- 14.8.4 Israel
- 14.8.5 Iran
- 14.8.6 Rest of the Middle East
- 14.9 Africa
- 14.9.1 South Africa
- 14.9.2 Egypt
- 14.9.3 Nigeria
- 14.9.4 Morocco
- 14.9.5 Rest of Africa
- 14.10 Regional Investment, Policy and Supply Chain Differences
- 14.11 Regional Competitive Landscape
- 14.12 Geographic Growth Hotspots
Chapter 15 Global Streaming Devices Technology, Innovation and Sustainability Outlook
- 15.1 Technology Landscape and Maturity
- 15.2 Product, Process and Service Innovation
- 15.3 AI, Automation and Digital Tools in the Industry
- 15.4 Technology Adoption and Performance Benchmarking
- 15.5 Innovation Pipeline and R&D Investment
- 15.6 Patent and Intellectual Property Trends
- 15.7 Energy Efficiency and Resource Management
- 15.8 Sustainability, Recycling and Circularity
- 15.9 Technology Roadmap, 2024-2032
- 15.10 Risks of Obsolescence and Technology Substitution
Chapter 16 Global Streaming Devices Market Key Strategic Imperatives
- 16.1 Growth and Market Entry Priorities
- 16.2 High-Return Products and Segments
- 16.3 Pricing, Profitability and Cost Optimization
- 16.4 Technology Investment and Product Differentiation
- 16.5 Supply Chain Localization and Resilience
- 16.6 Distribution and Customer Acquisition
- 16.7 Partnership, Acquisition and Capacity Strategy
- 16.8 Regional Expansion Priorities
- 16.9 Short-, Medium- and Long-Term Actions
Chapter 17 Competition Outlook
- 17.1 Industry Competition Characteristics
- 17.2 Market Structure and Concentration
- 17.3 Market Share and Competitive Positioning, 2024
- 17.4 Company-Wise Revenue and Product Benchmarking
- 17.5 Production and Service Capacity Benchmarking
- 17.6 Technology, Pricing and Differentiation
- 17.7 Regional Footprint and Distribution Strength
- 17.8 Mergers, Acquisitions and Strategic Alliances
- 17.9 New Entrants and Competitive Threats
- 17.10 Porter's Five Forces and Industry Attractiveness
- 17.11 Competitive Outlook, 2024-2032
Chapter 18 Company Profiles
- 18.1 Company Coverage and Selection Criteria
- 18.2 Apple Inc.
- 18.2.1 Business Description
- 18.2.2 Company Ownership and Geographic Presence
- 18.2.3 Product and Service Portfolio
- 18.2.4 Manufacturing and Operating Footprint
- 18.2.5 Production Capacity and Expansion Plans
- 18.2.6 Financial Performance and Investment
- 18.2.7 Market Share and Competitive Position
- 18.2.8 Technology and Innovation Capabilities
- 18.2.9 Strategic Alliances or Partnerships
- 18.2.10 Recent Developments
- 18.2.11 Growth Strategy and Outlook
- 18.3 Google Inc.
- 18.4 Amazon.com
- 18.5 Sony Corporation
- 18.6 Microsoft Corporation
- 18.7 Philips Electronics
- 18.8 Huawei Technologies
- 18.9 D-Link Corporation
- 18.10 HiMedia Technology
- 18.11 Arris Group Inc.
- 18.12 Other Relevant Market Participants
Note: Every listed company is profiled on the structure shown under the first company. The company list is preliminary and may change based on research findings, market developments, data availability and client requirements.
Chapter 19 Disclaimer
- 19.1 Research and Forecast Disclaimer
- 19.2 Data Source and Estimation Limitations
Note: The depth of individual sections depends on data availability for this market. Volume, capacity, trade and other unit-based metrics are included where applicable.

